1. Introduction
Tissue fixation is the primary step for pathological analysis to prevent the autolysis of tissues and allow further histological examination. For this purpose, in diagnostics, chemical fixatives are mainly used, and among them the most widely used is formalin, the aqueous solution of formaldehyde. However, Bouin’s fixative has been extensively used as an elective fixative for histological examination in some institutions worldwide [
1]. Bouin’s fixative is a mixture of a saturated aqueous solution of picric acid, formalin, and acetic acid [
2]. The principle of fixation is mostly based on protein precipitation through picrate formation. This fixation method has been used for specific purposes because it better preserves some morphological details, such as nuclear conformation [
3]. In the past decades, several studies have already shown that Bouin’s-fixed samples are amenable for nucleic acid and protein analyses, but only to a certain point, as the fixative has resulted to be more detrimental compared to 10% buffered formalin mixture in the preservation of biomolecules [
1,
3,
4]. Currently, no investigation has been carried out on the analysis performance with respect to miRNAs, despite the publication of two samples in a report [
4].
Among biomolecules, micro RNAs (miRNAs), which are single-stranded non-coding RNAs comprised of 18 to 24 nucleotides, have been launched as a new generation of biomarkers because of their possible use in monitoring the efficacy, as well as the safety, of therapeutic regimens, but also in the diagnosis or risk assessment for the development of a disease, as well as for treatment options [
5]. Furthermore, they have been demonstrated to be resistant to formalin-fixed paraffin-embedding (FFPE) processing [
6] and storage [
7] in archives so that they can be analyzed in retrospective studies.
The aim of this study was to investigate the reliability of micro RNA analysis in formalin- and Bouin’s-fixed tissue by analyzing 15 matched samples of formalin- and Bouin’s-fixed paraffin-embedded high grade serous ovarian cancers (HGSOC) as part of the HERCULES project [
8].
3. Discussion
In this study, we investigated whether miRNAs can be efficiently isolated and quantified from formalin- and Bouin’s-fixed paraffin-embedded tissues for expression analysis by real-time and droplet digital RT-PCR. For this purpose, we compared the results in matched Bouin’s- and formalin-fixed paraffin-embedded samples of high grade serous ovarian cancers. Degradation of nucleic acids in fixed tissues is due to different contributing factors related to enzyme activity, and also to the effect of chemicals. In detail, in formalin fixation, nucleic acid degradation assembles both fragmentation and chemical modification of methylol addition to the bases [
13]. The latter factor is even more critical for RNA, as the methylol addition impedes reverse transcription and cDNA synthesis [
13]. The fixatives analyzed in the present study include both a crosslinking agent, formaldehyde (formalin), but our results clearly show that their degradation effects on RNA during fixation greatly differ.
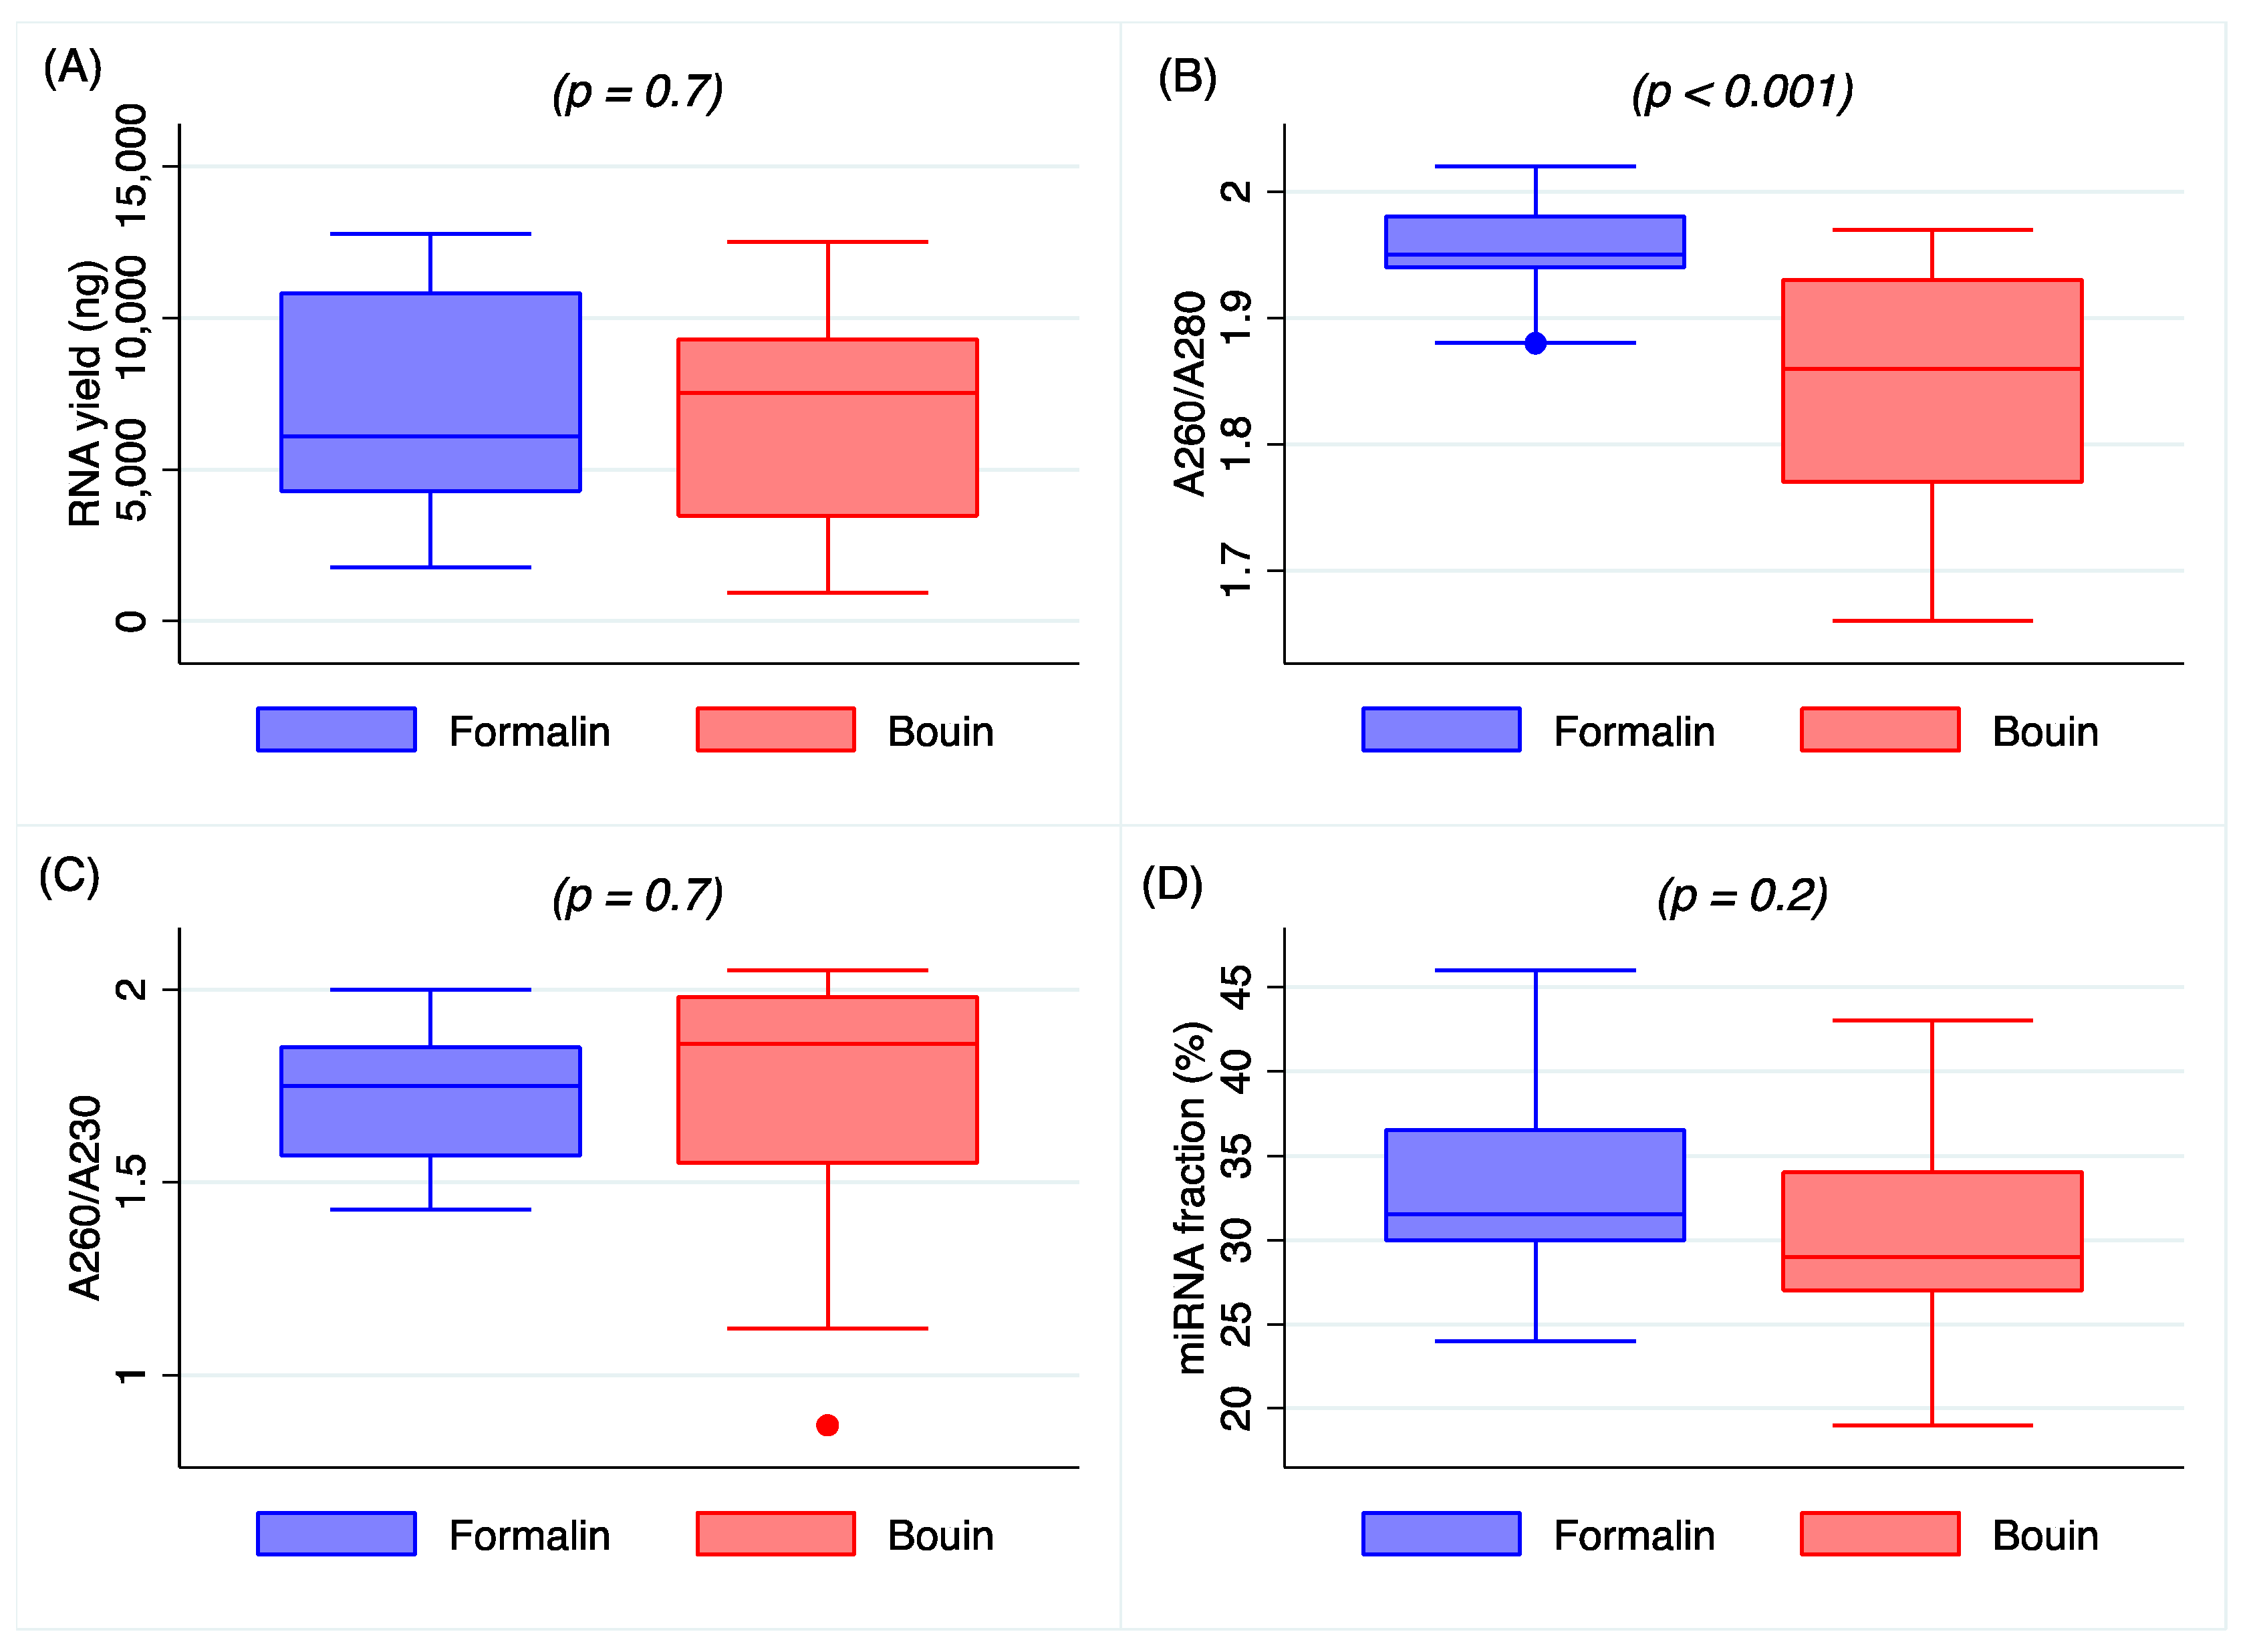
Data on the extraction procedure indicate that total RNA obtained from formalin and Bouin’s specimens was closely comparable in amount, although a higher purity was detected in formalin extracts, as shown in
Figure 1B. The lower A260/A280 ratio in Bouin’s extracts is likely related to the presence of picric acid residues, that, with its aromatic ring, has an absorbance peak between 200 and 300 nm [
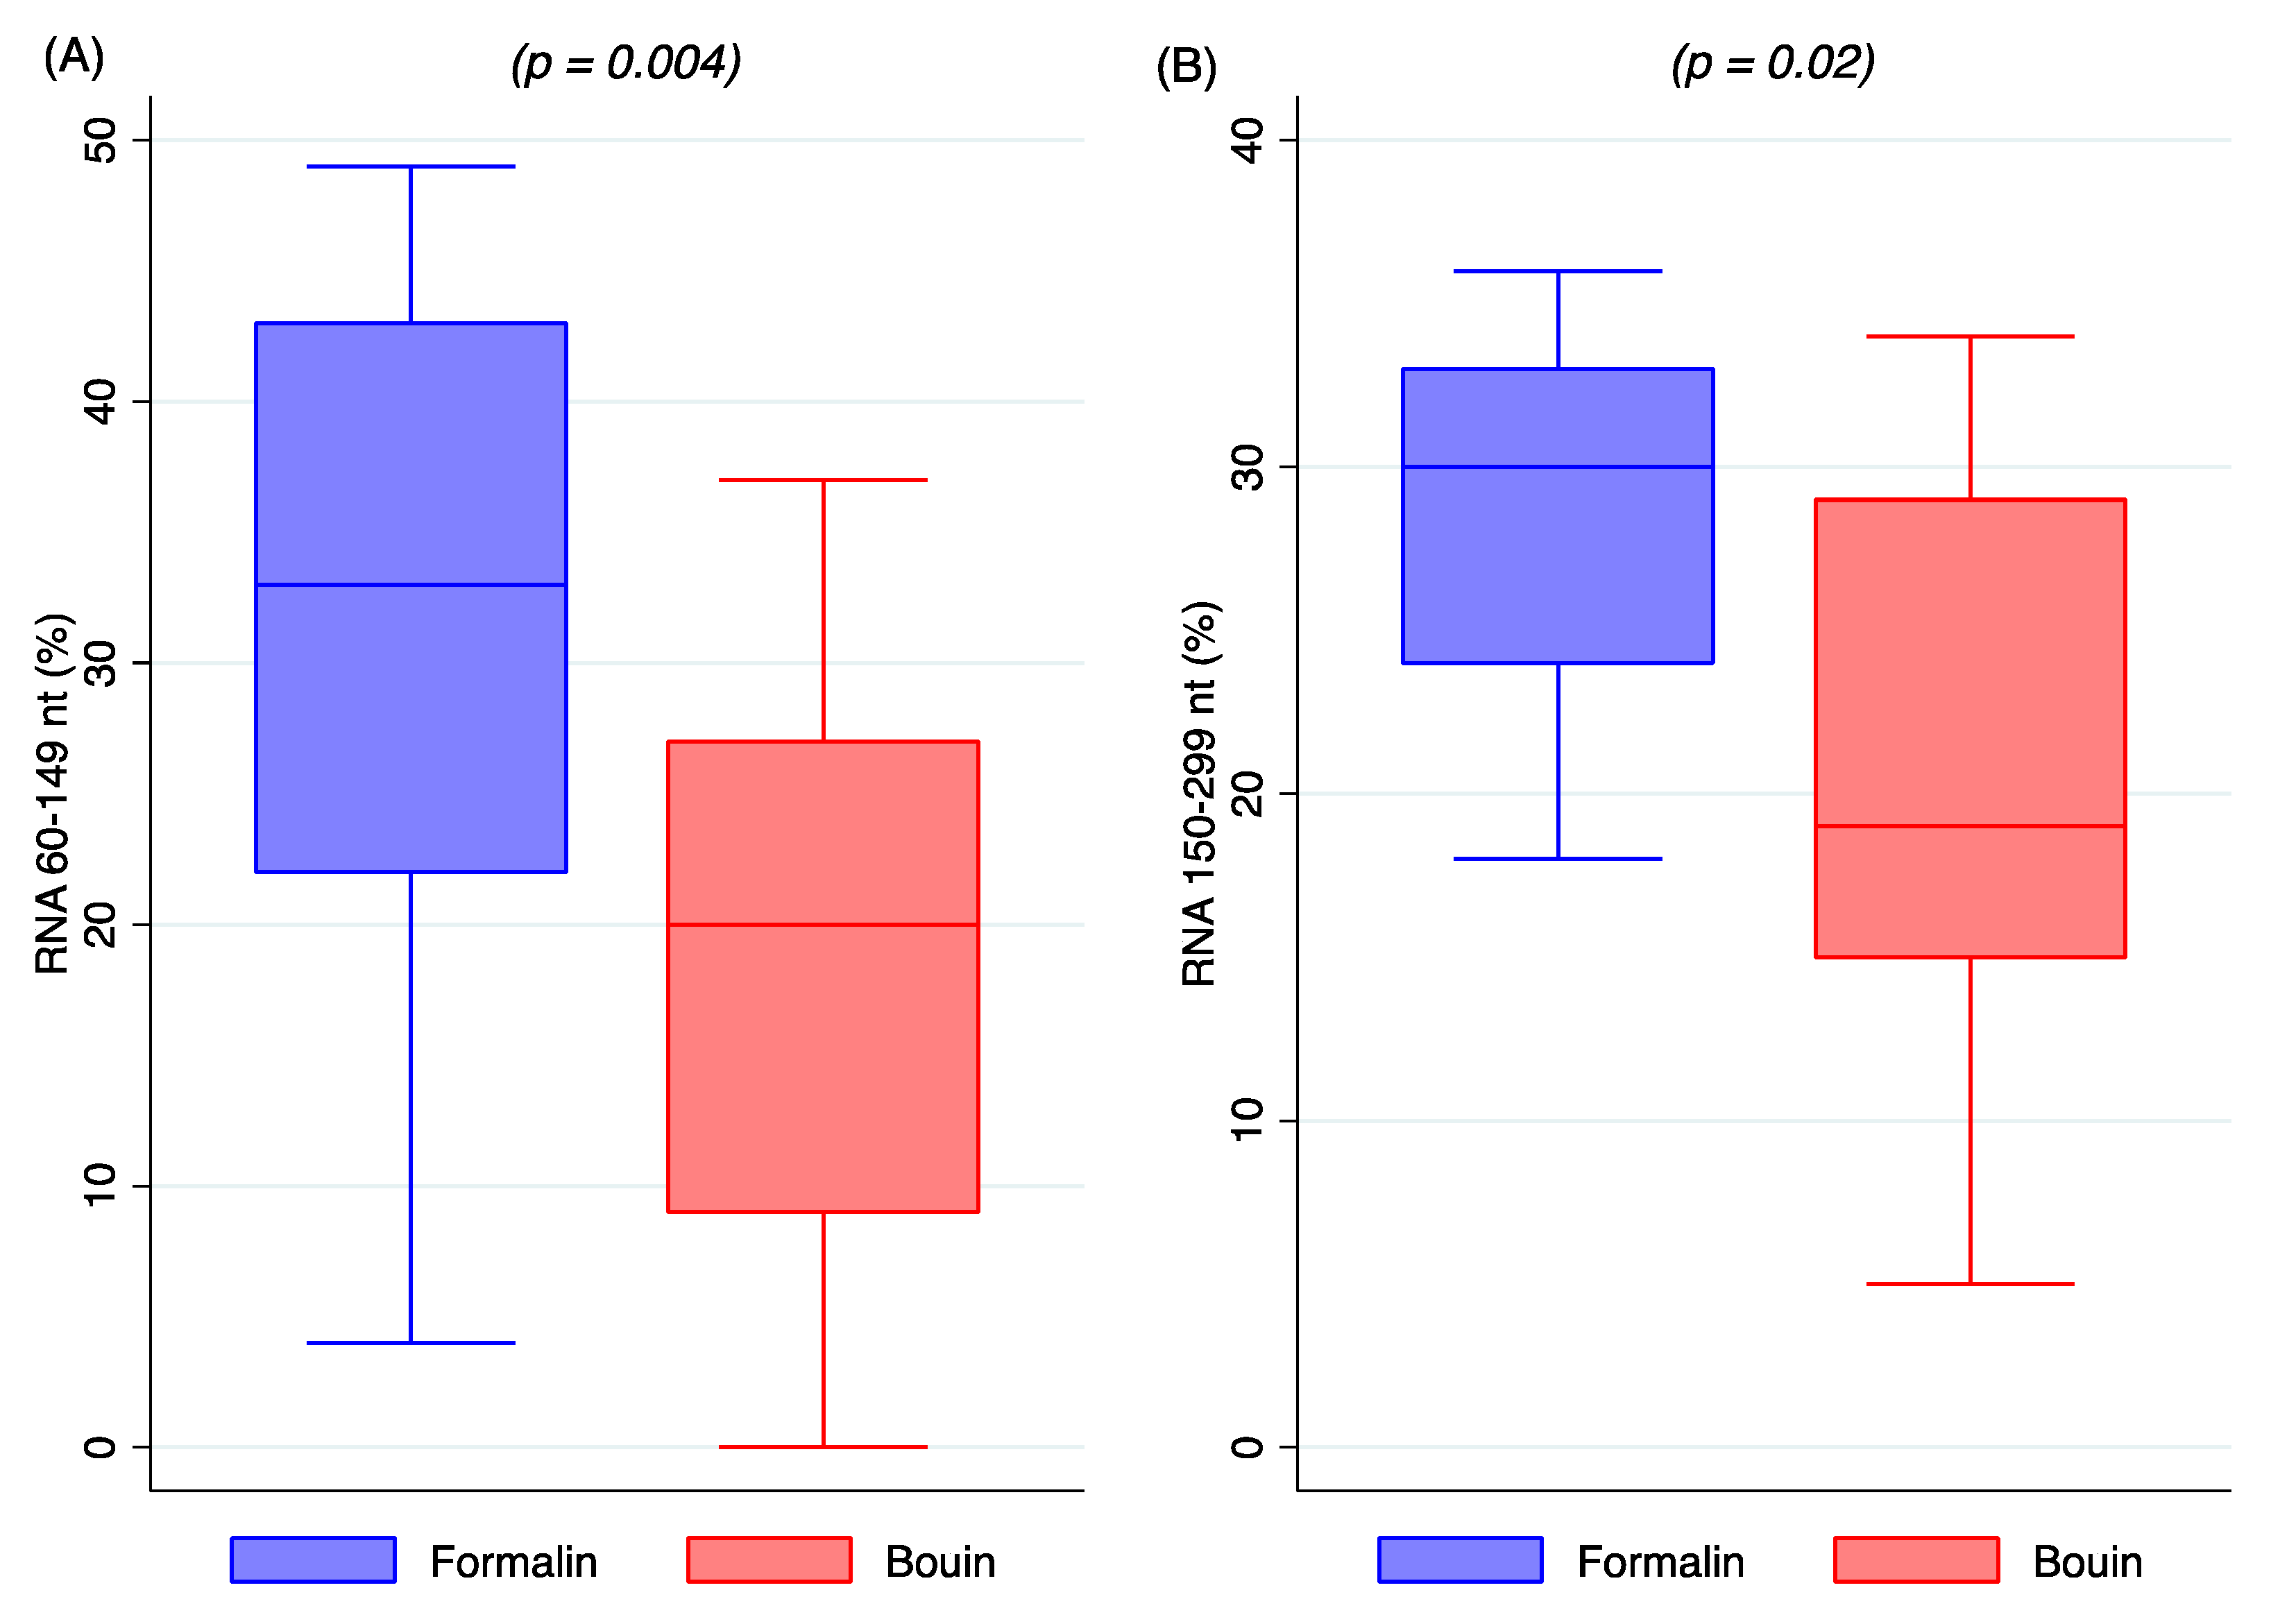
14]. Nonetheless, the amount of small RNAs as detected by Agilent Bioanalyzer resulted as being similar in extracts from formalin- and Bouin’s-fixed samples, highlighting the feasibility of the use of these type of tissues.
Micro RNAs, considering their short length, have been reported to be more accessible in FFPE tissues compared to miRNAs, representing a viable analysis for clinical research and diagnosis [
15]. In several reports, miRNAs have been shown to be minimally affected by FFPE treatments, as expression levels of isolated miRNAs were directly comparable in frozen and FFPE tissue samples [
16,
17,
18].
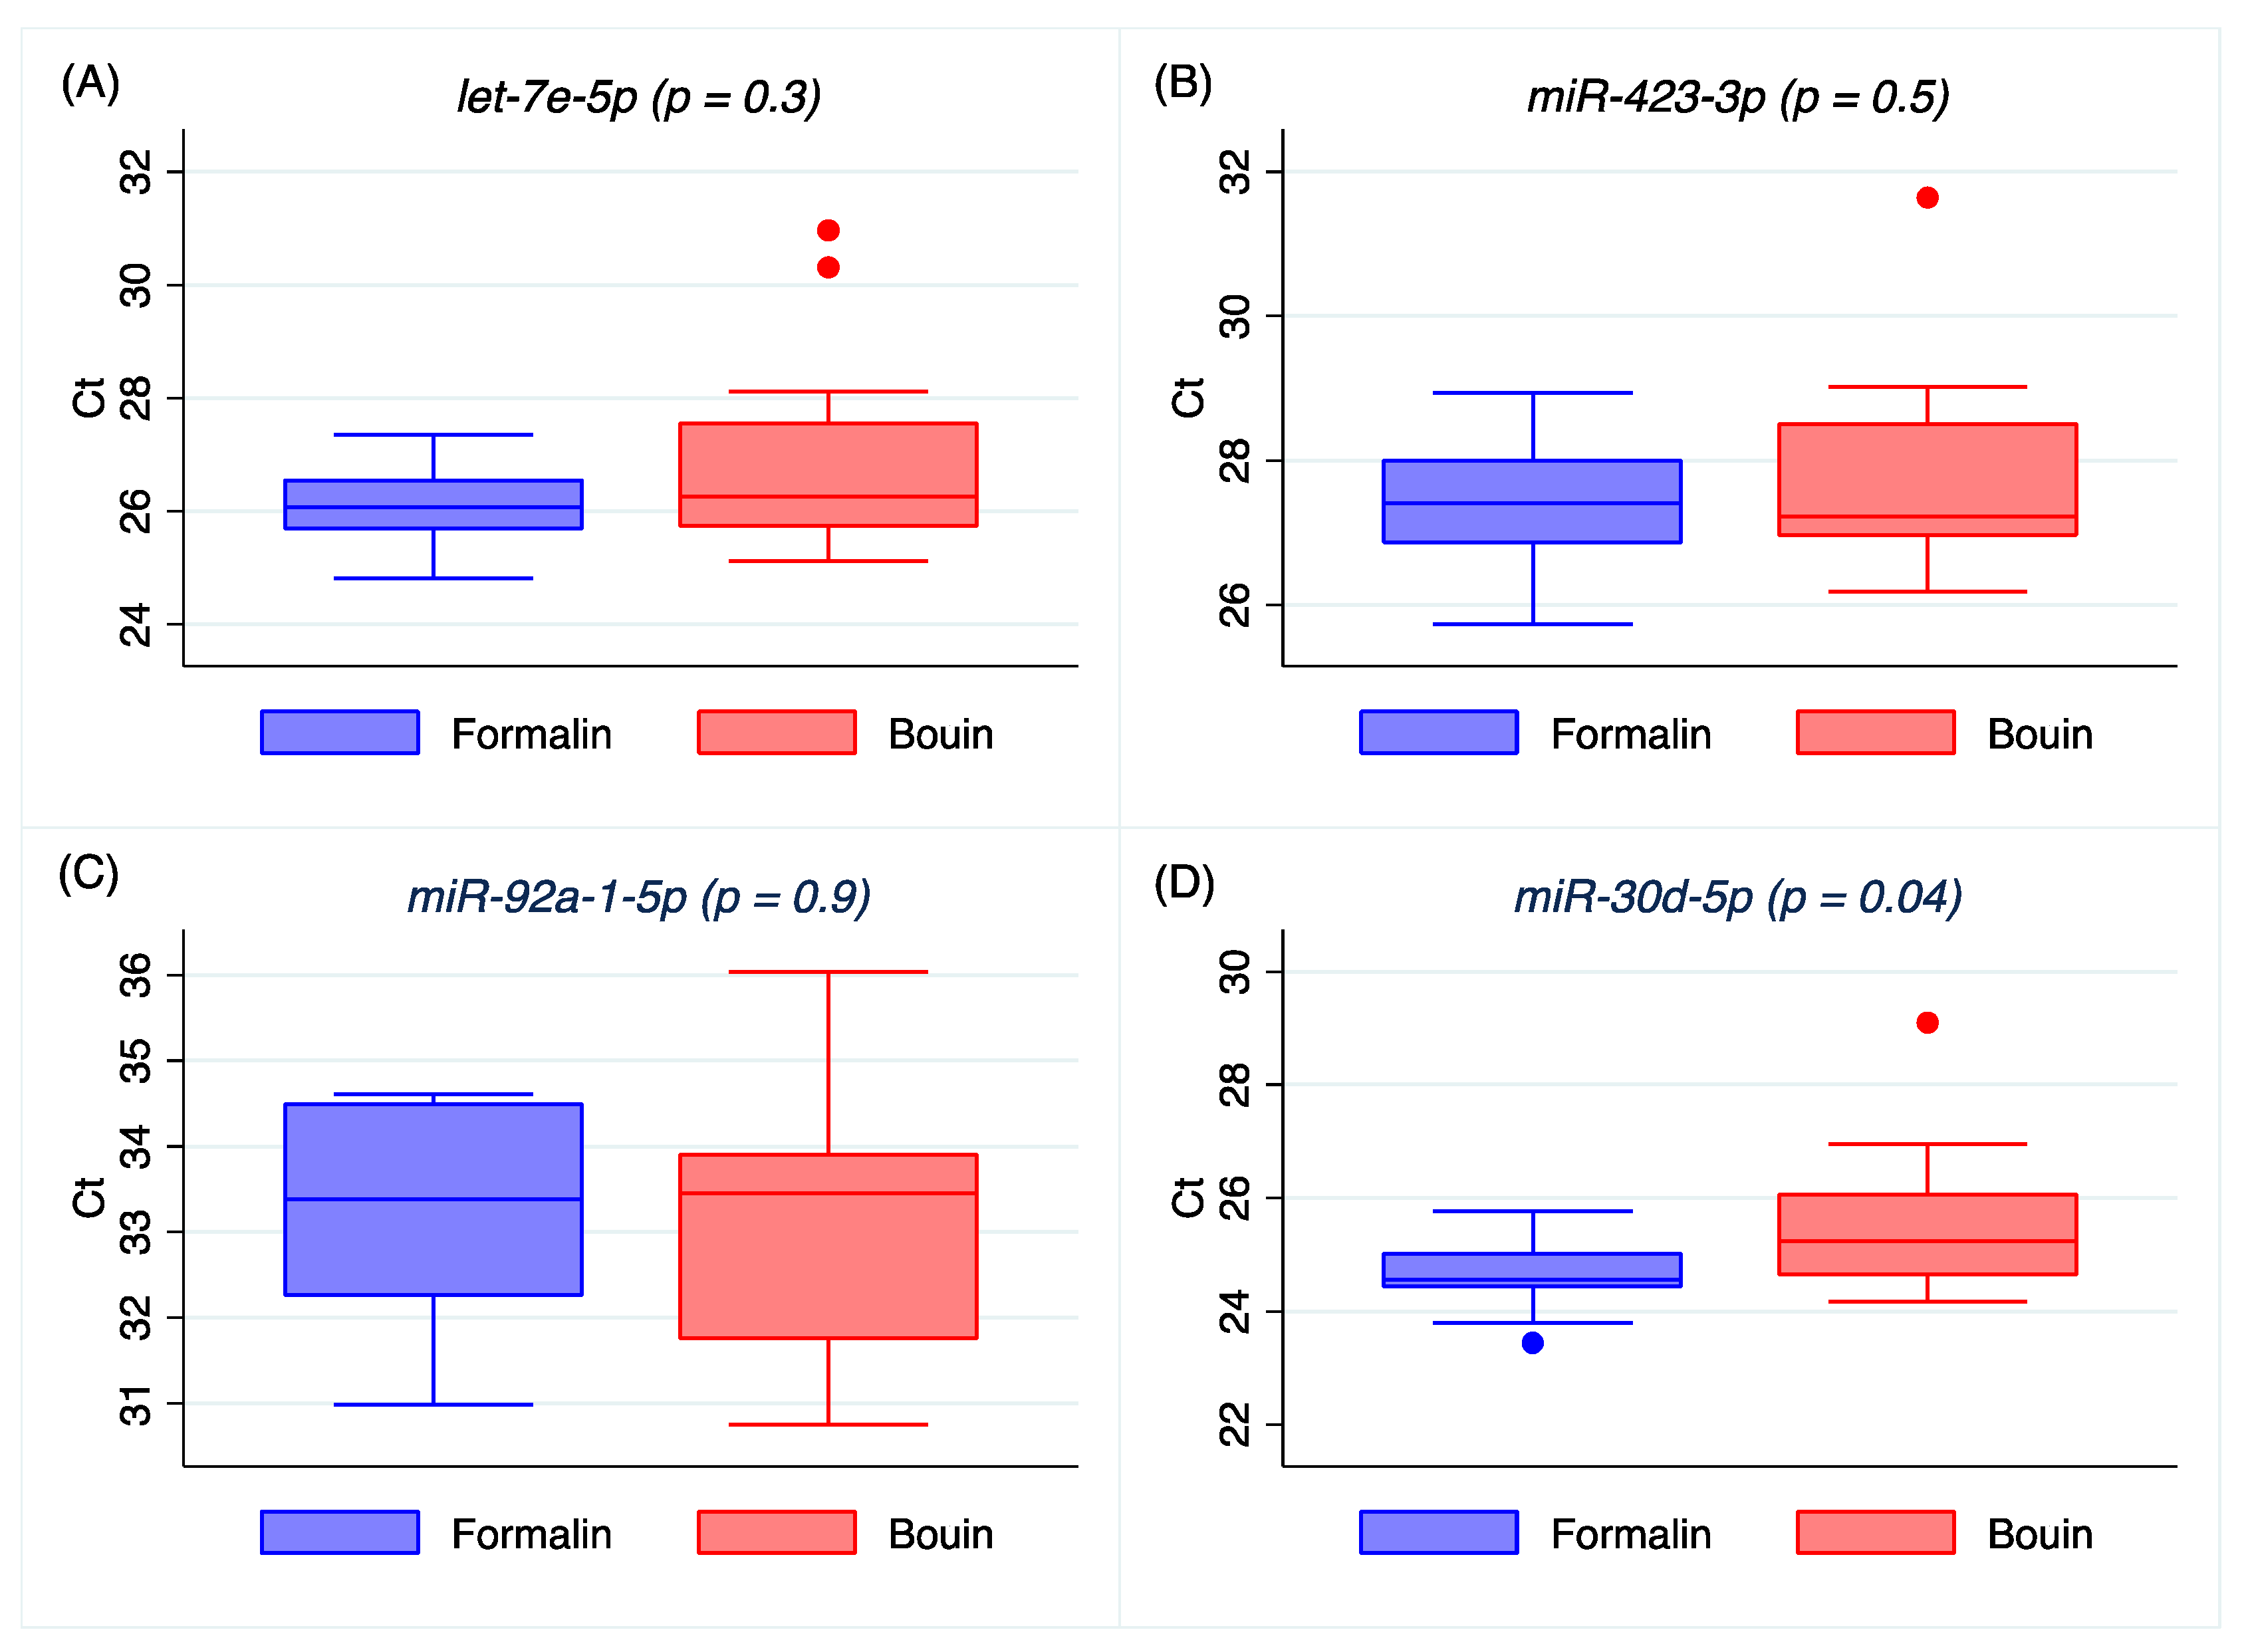
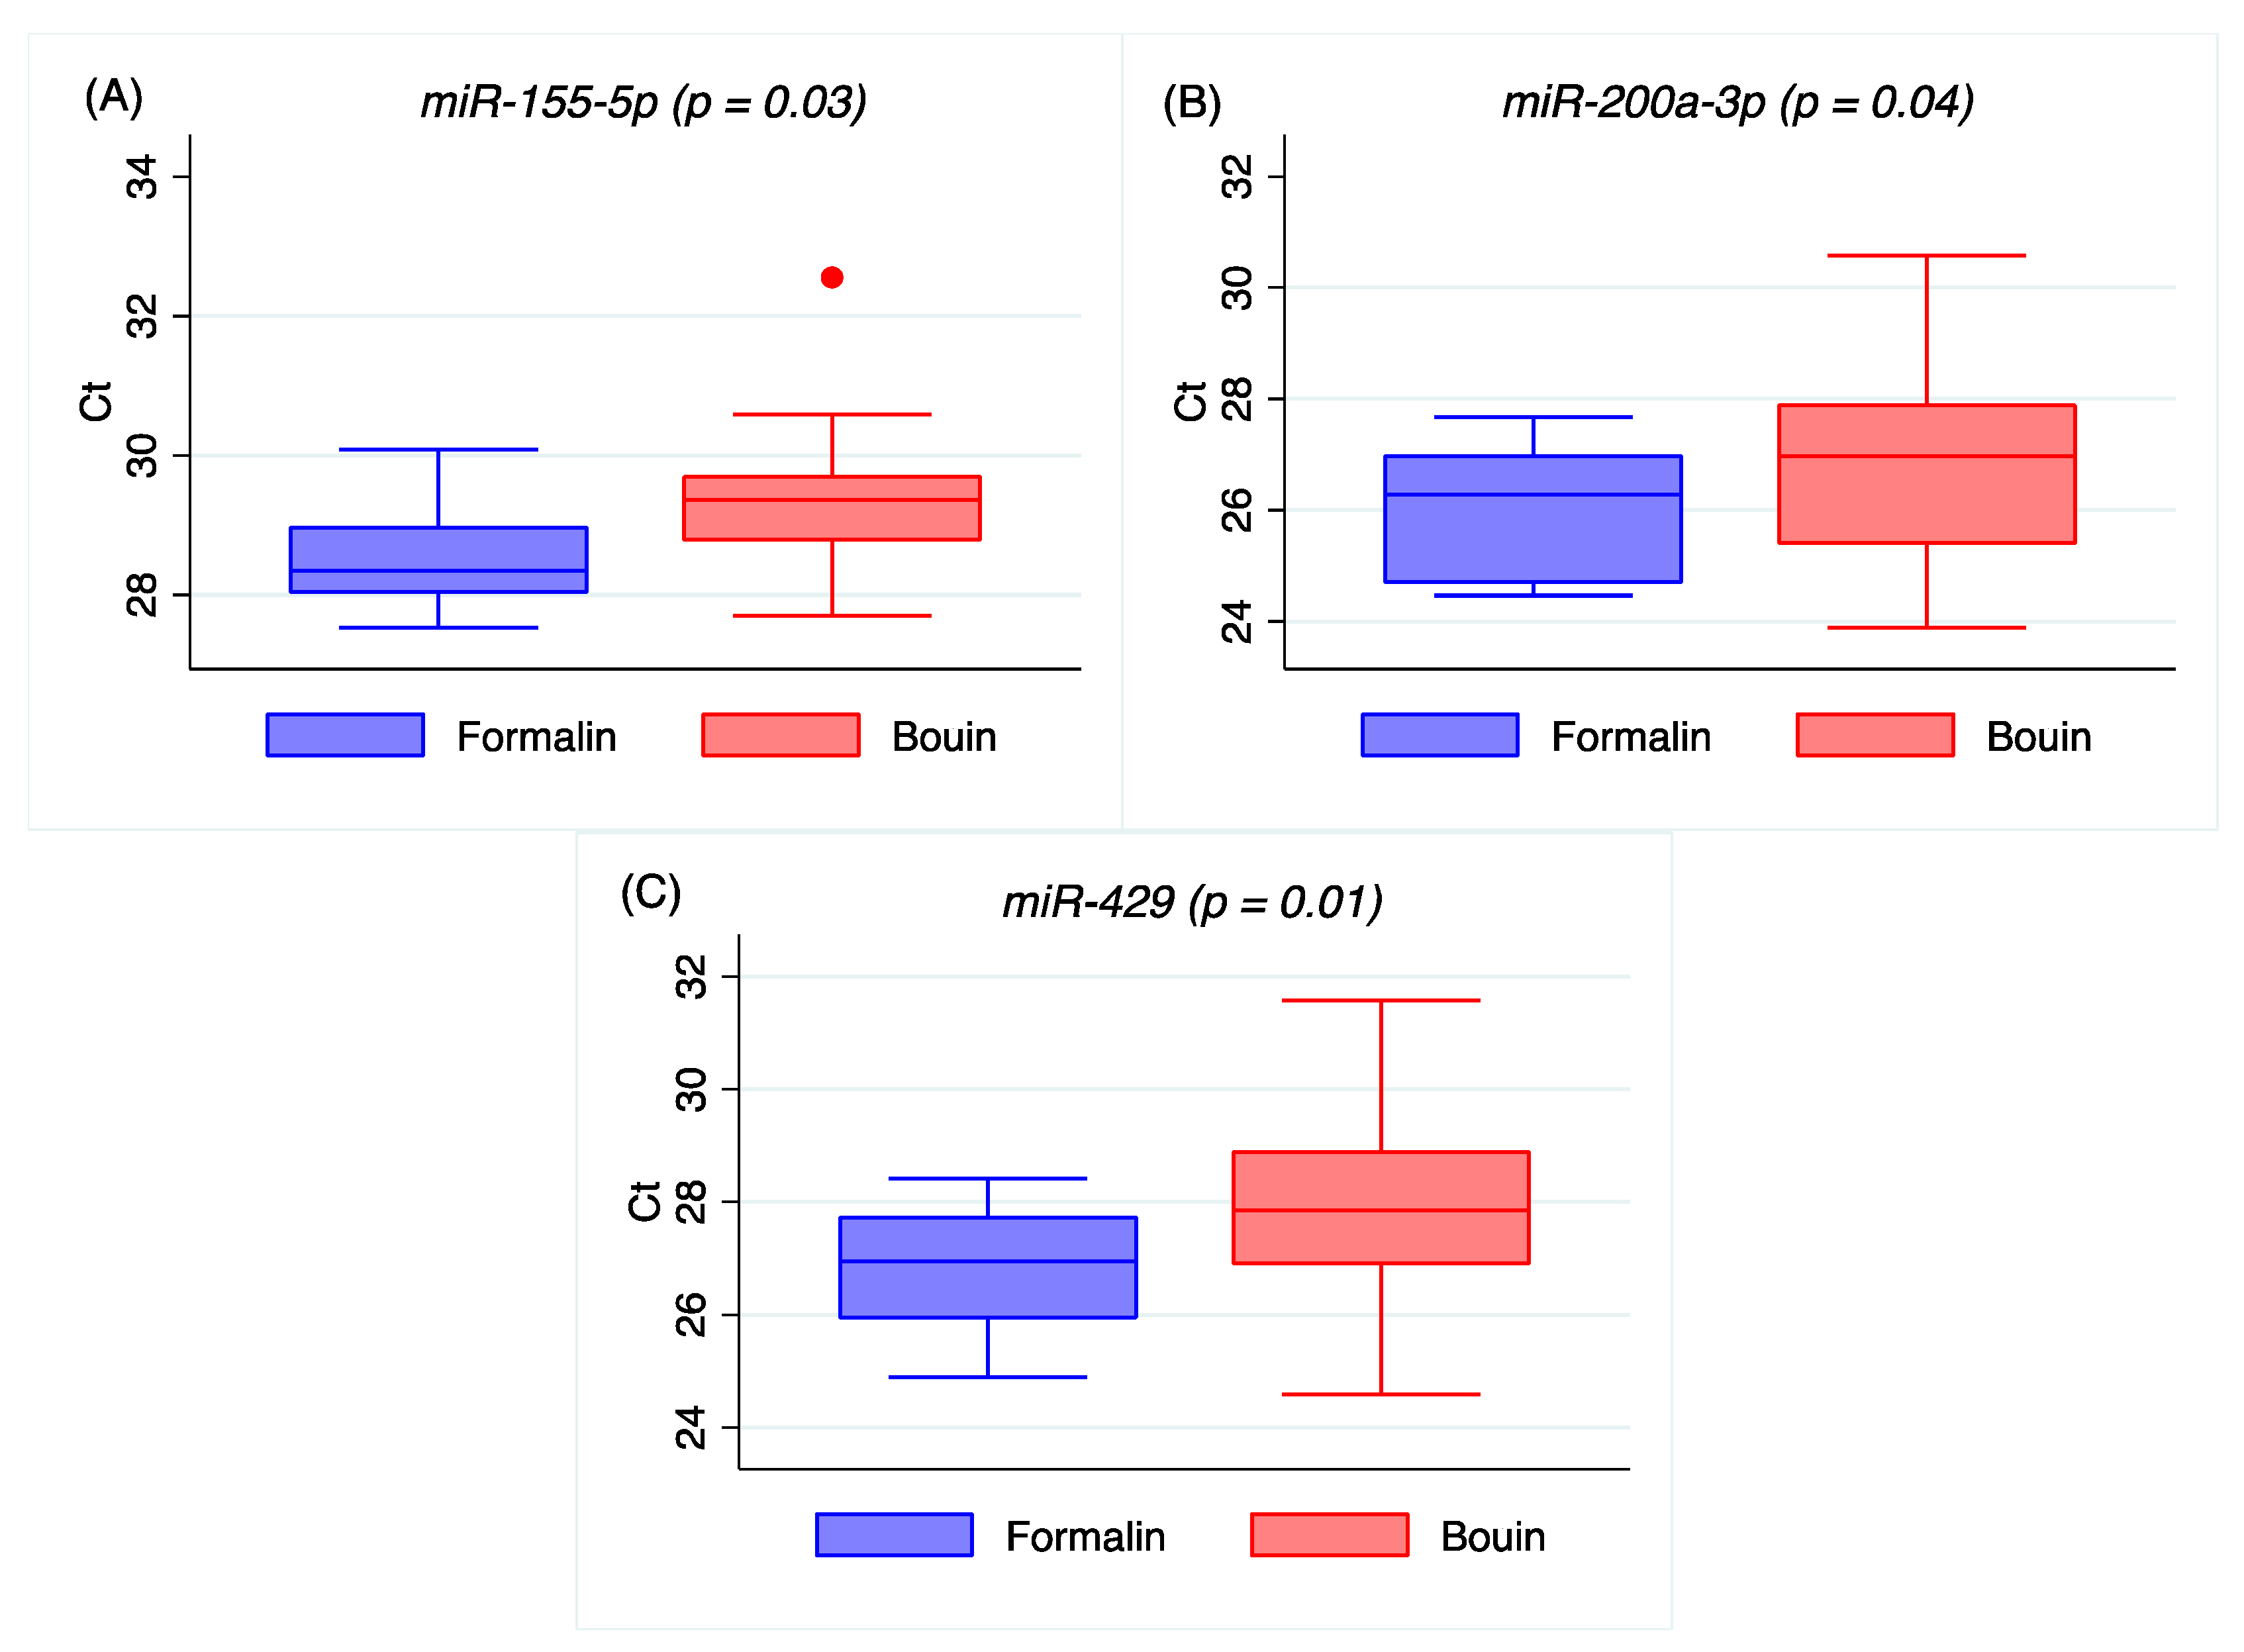
Our results on real-time PCR detection for
let-7e-5p,
miR-423-3p, and
miR-92a-1-5p show similar Ct between matched formalin and Bouin’s specimens, but not for
miR-30d-5p,
miR-155-5p,
miR-200a-3p, or
miR-429, which were detectable at significantly higher Ct in Bouin’s fixative (
Figure 2 and
Figure A2 in
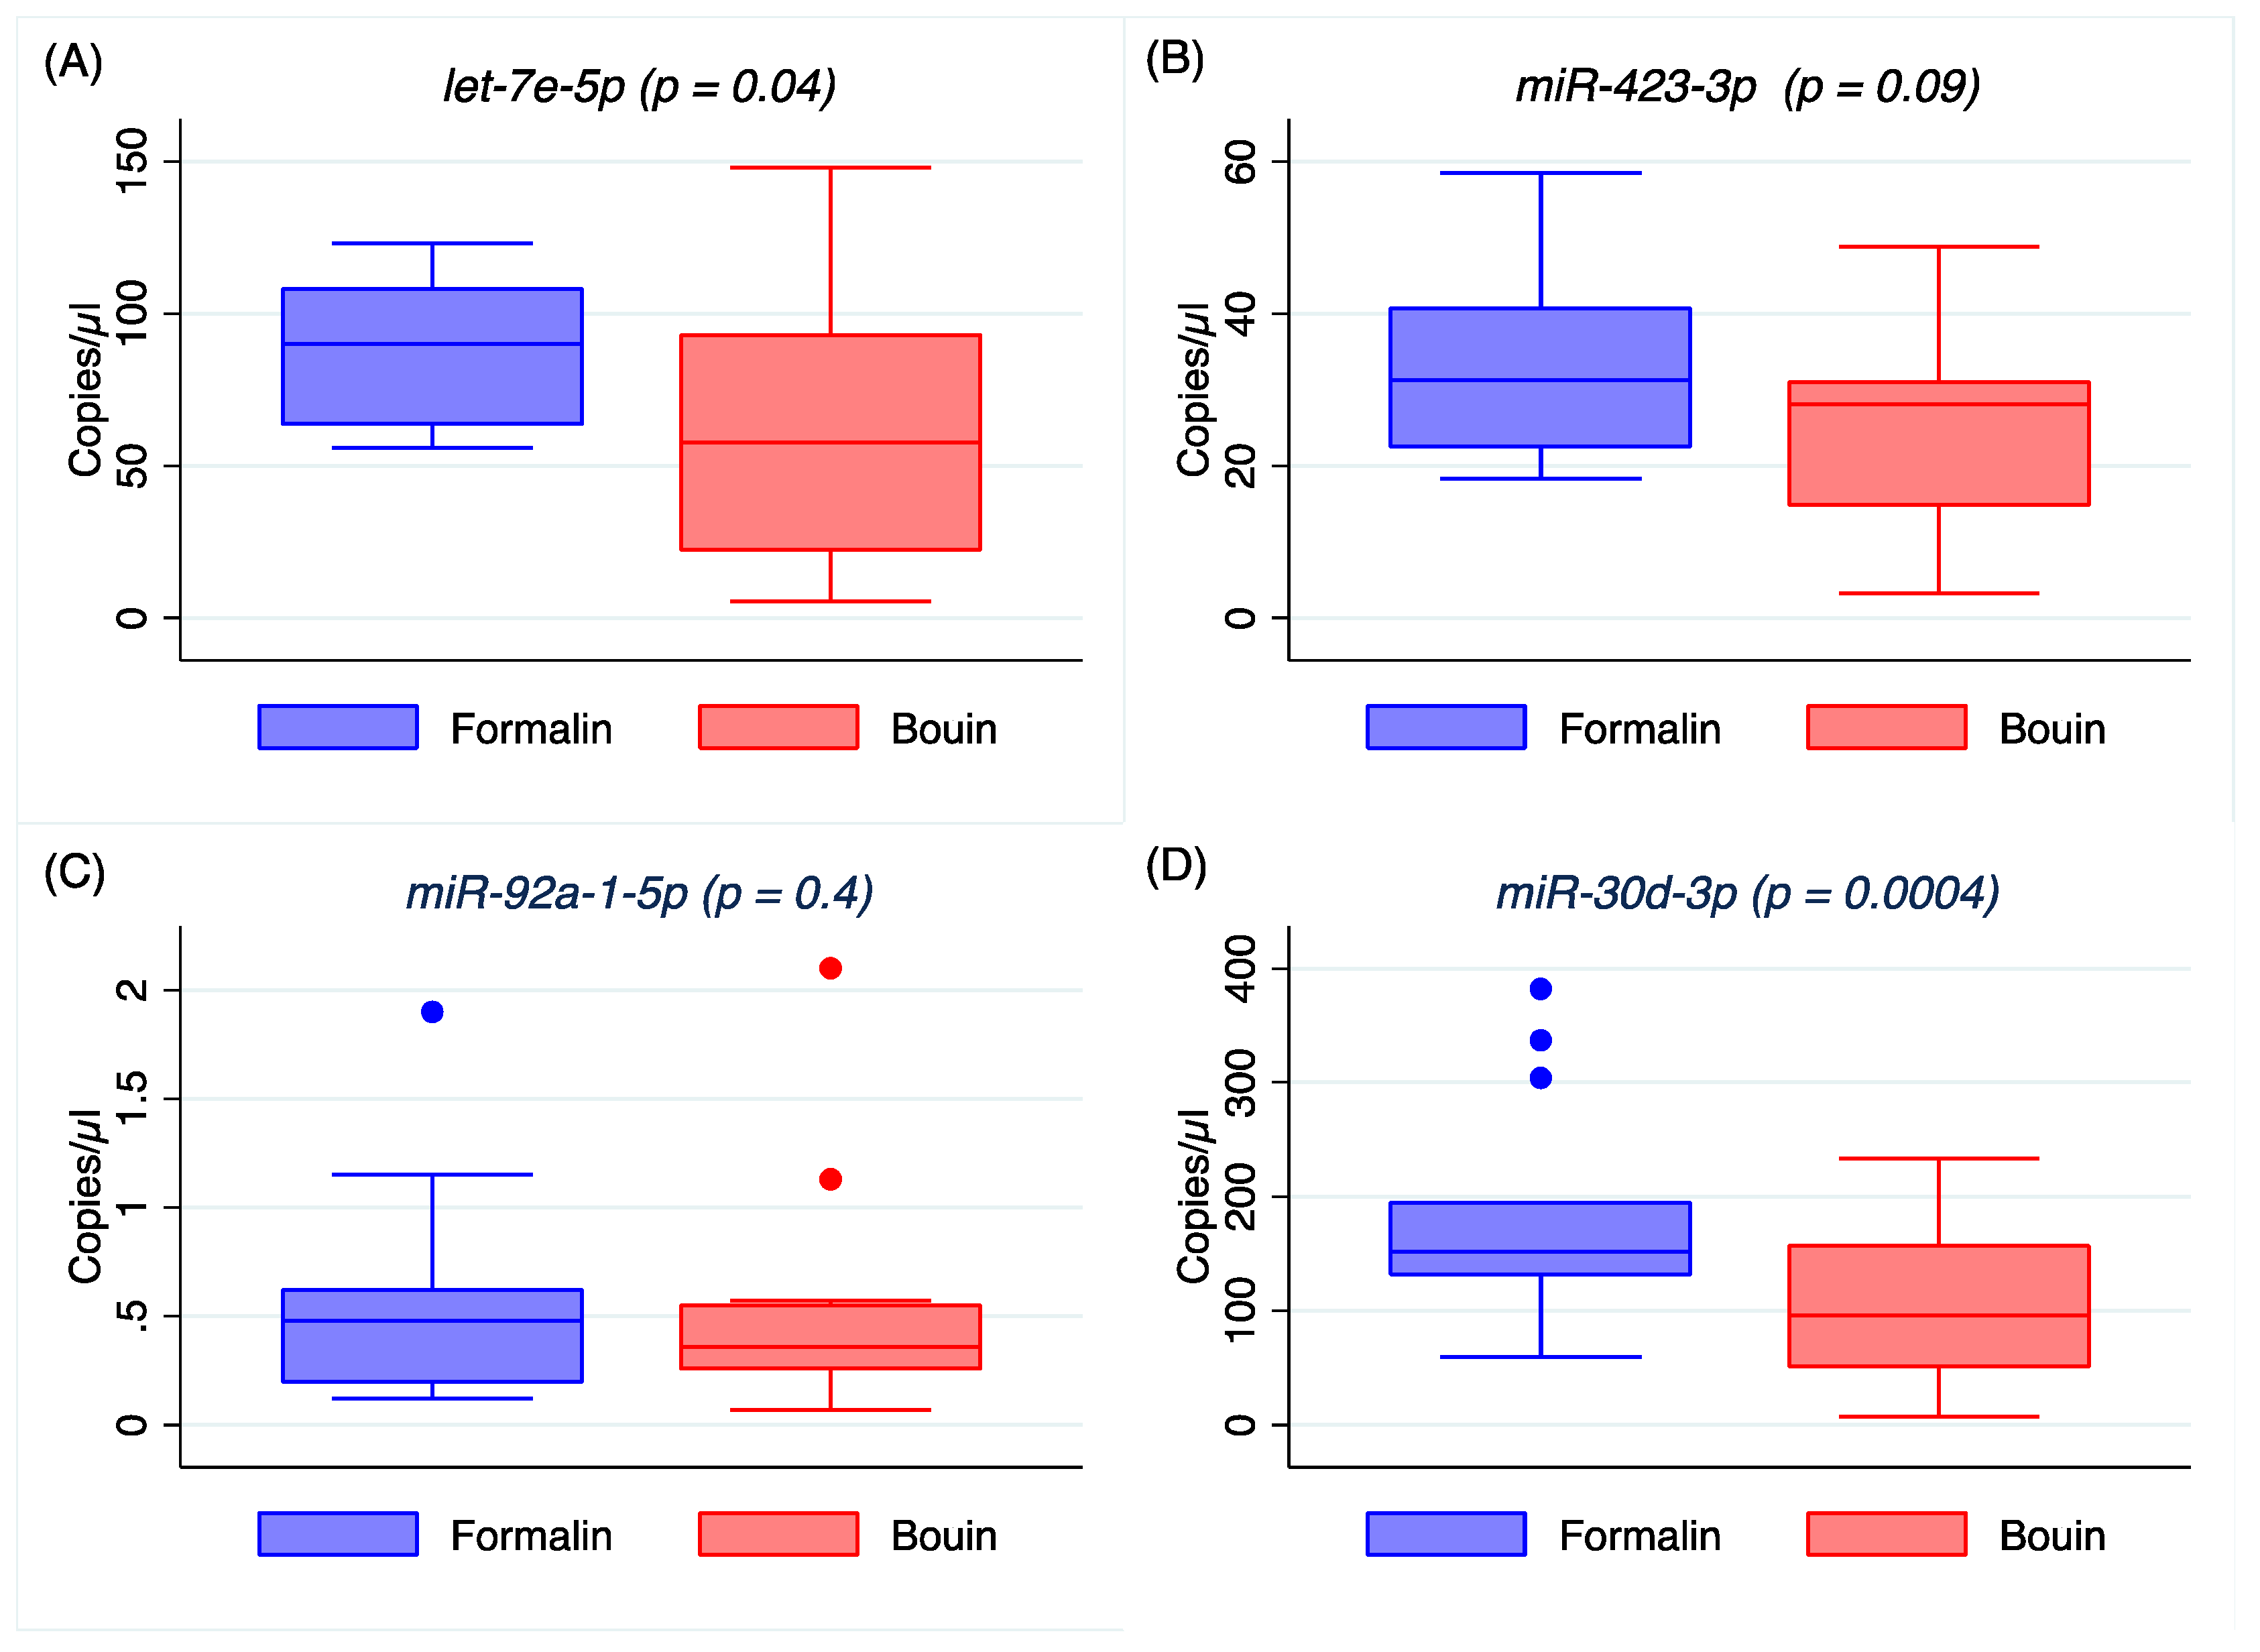
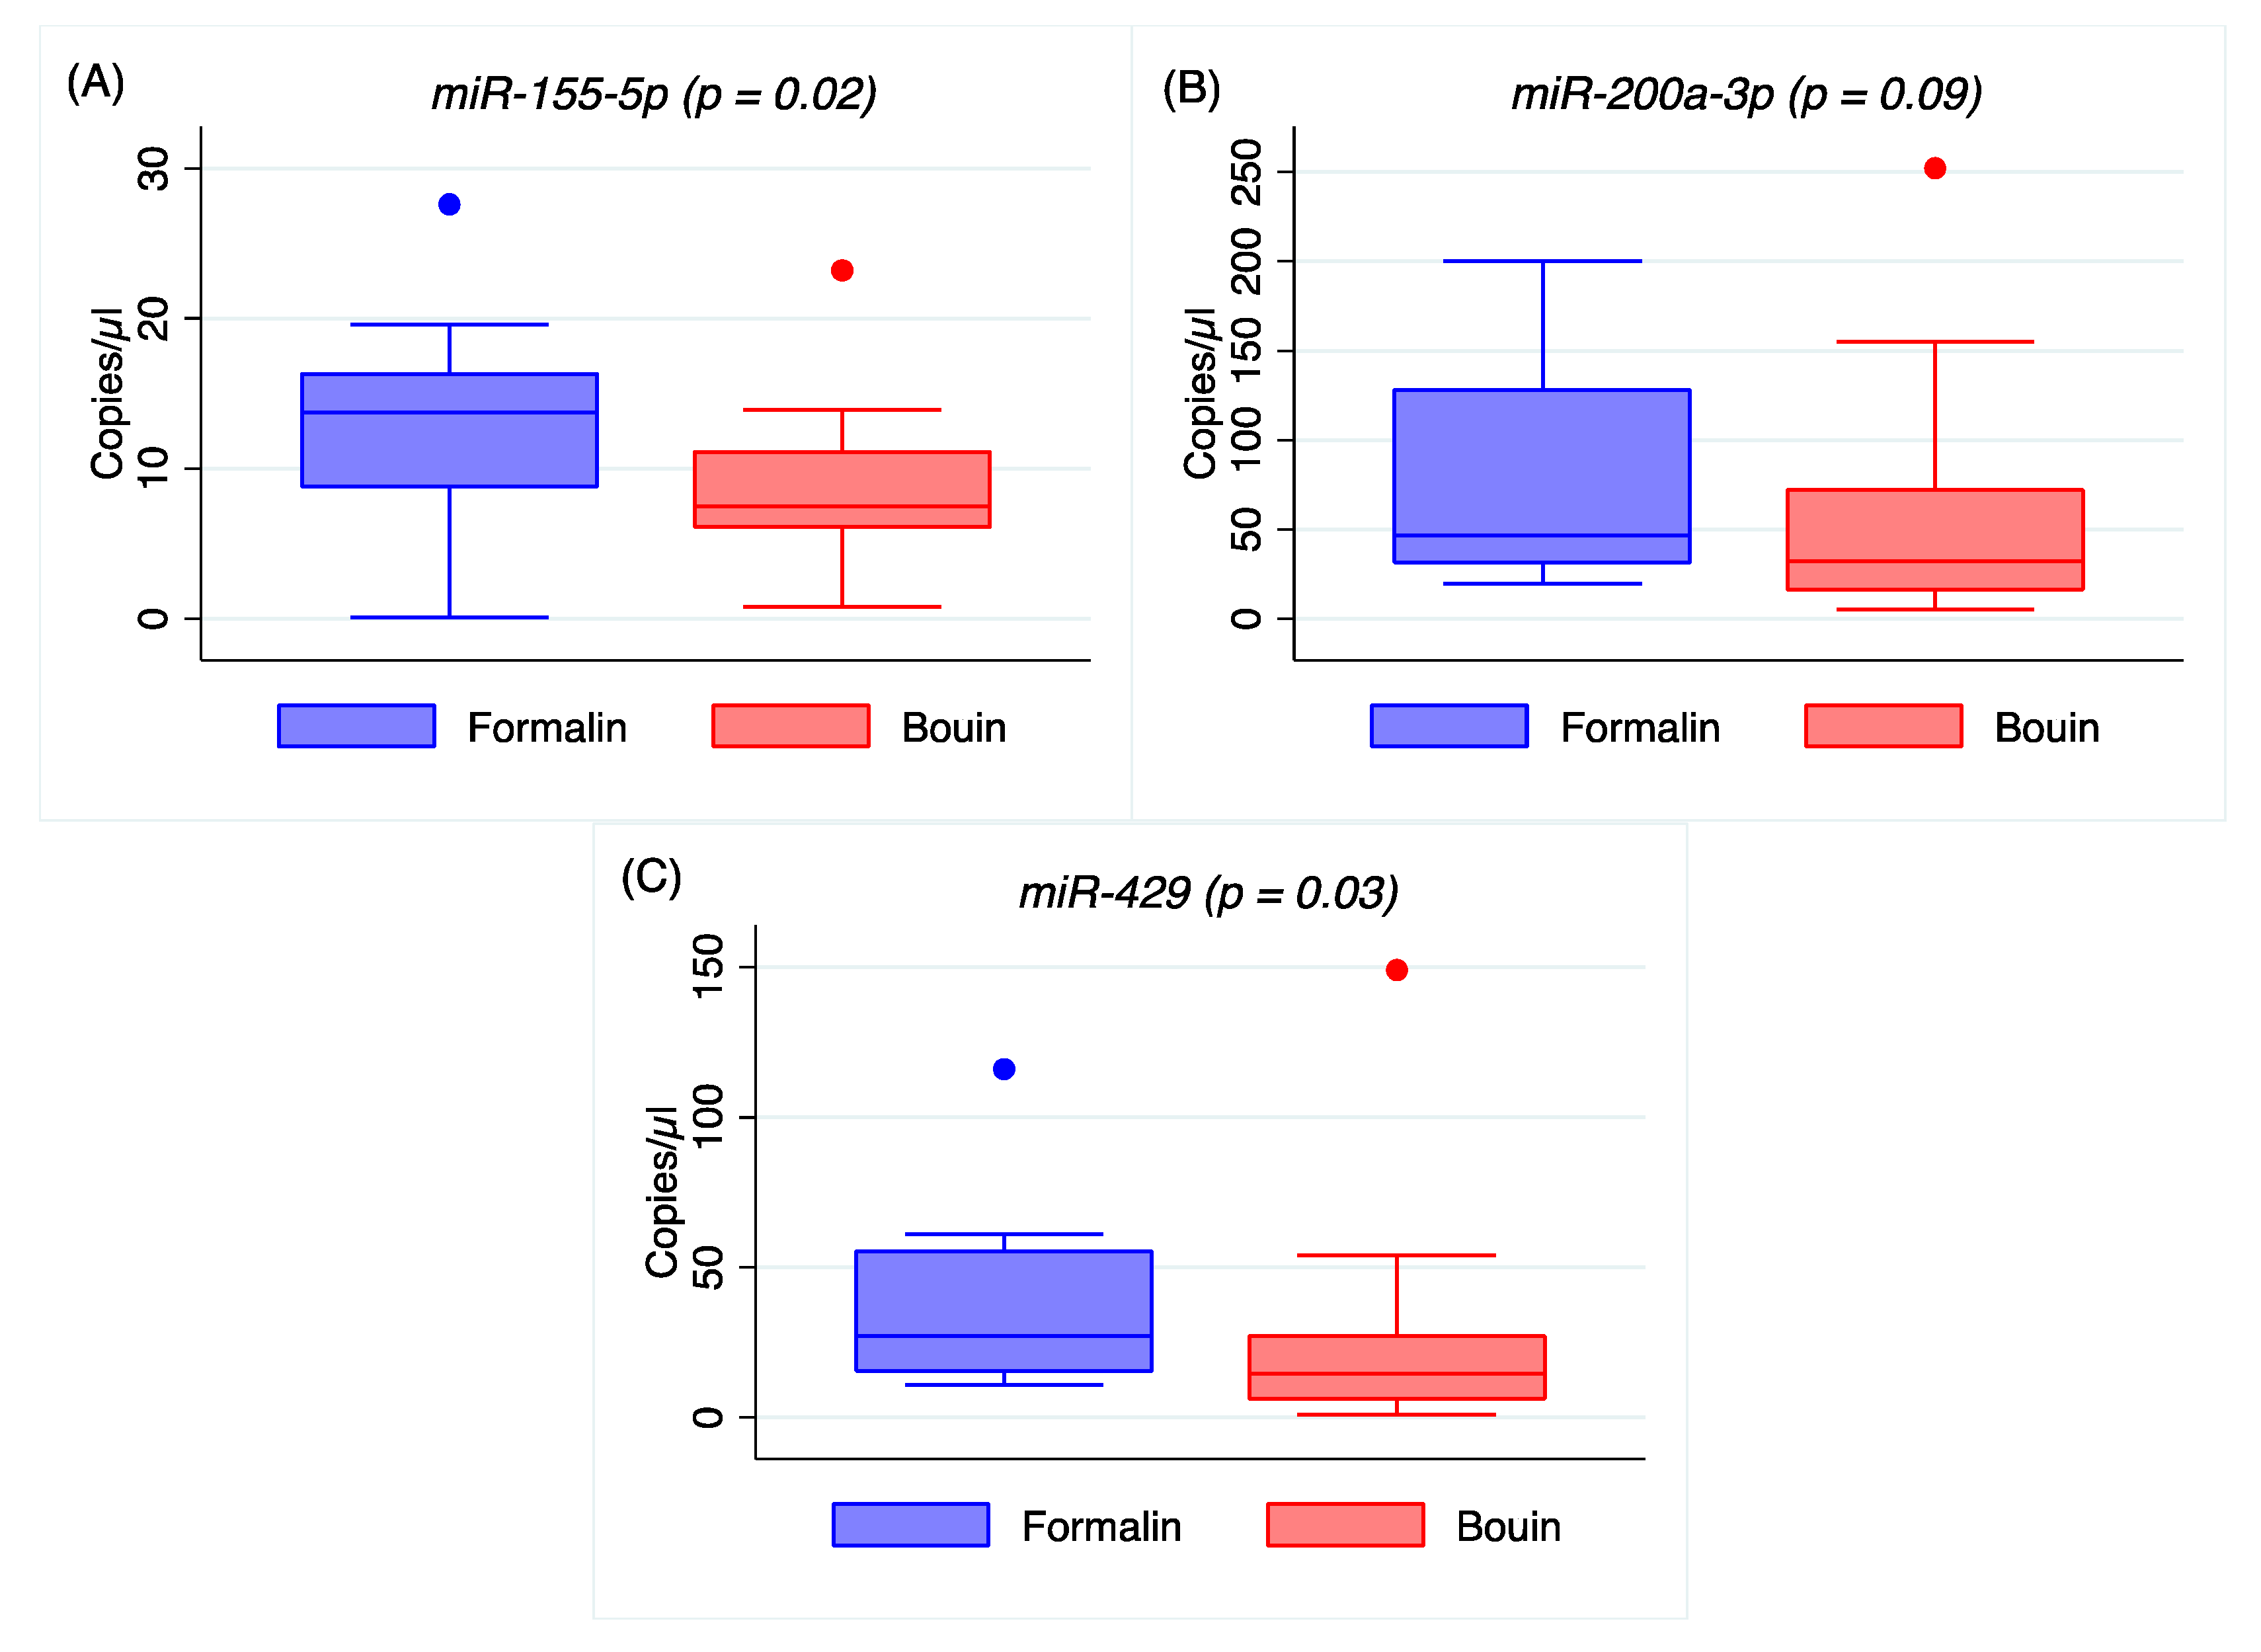
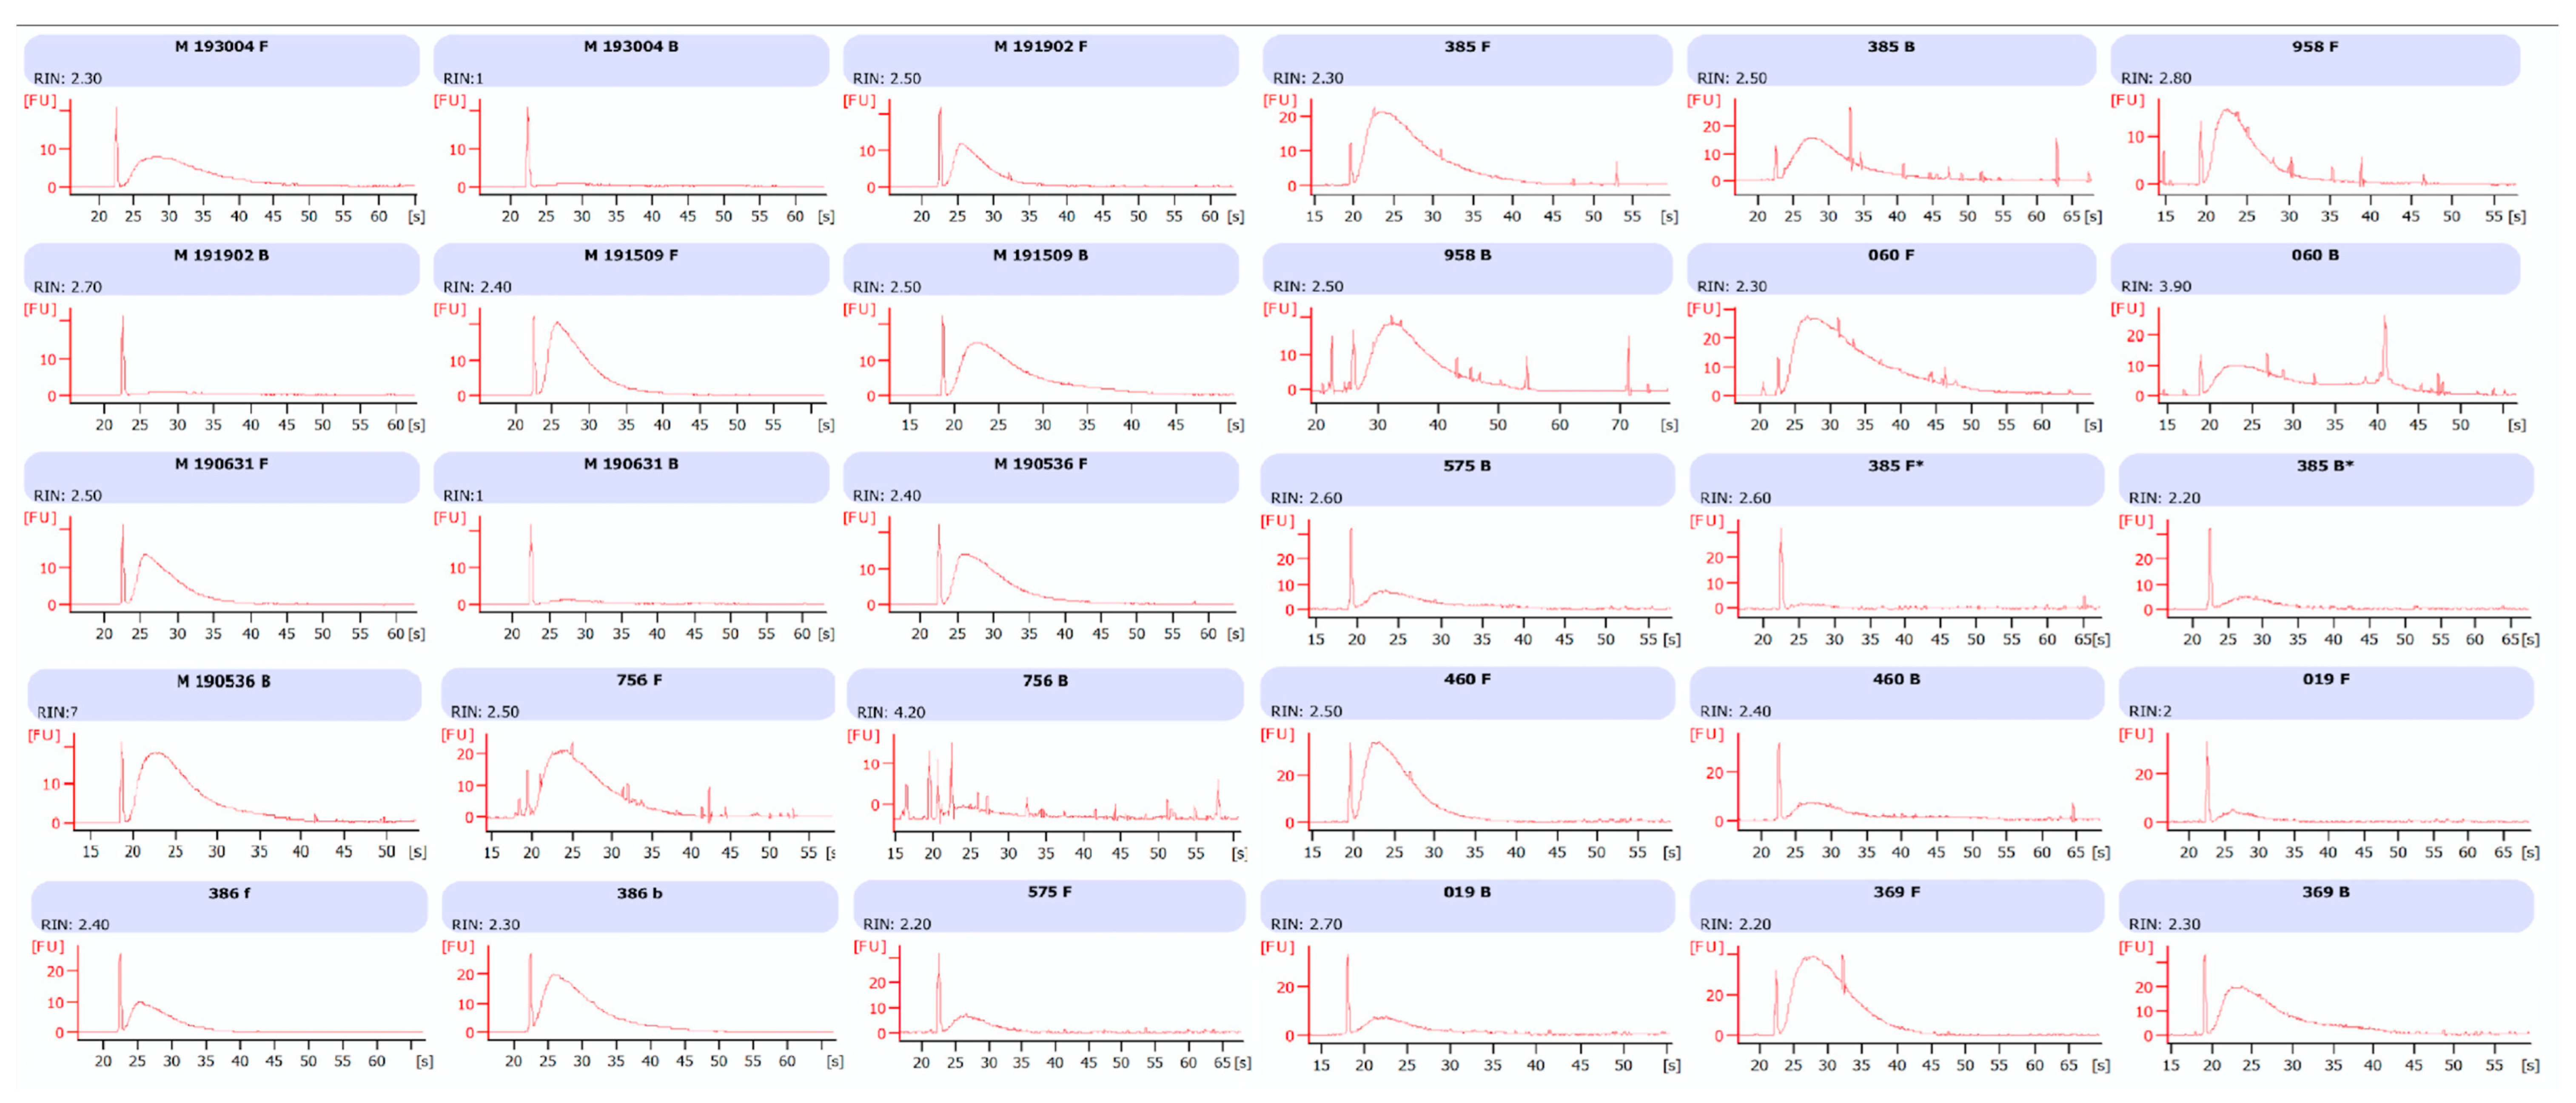
Appendix A). In addition, the coefficients of variation of all the analyzed miRNA were lower in formalin- than in Bouin’s-fixed specimens. Using matched fixed samples of the same surgical tissue in this study, the higher Ct levels detected in some miRNAs in Bouin’s-fixed tissues are presumably due to the sample degradation level. Consequently, the trend of higher Ct values and CV detected in Bouin’s is in agreement with a lower amount of transcript in such samples, which is strictly linked to the RNA fragmentation as shown by the Agilent rRNA fragmentation analysis. Therefore, our results point out lower levels of degradation caused by lower fragmentation in formalin-fixed rather than in Bouin’s-fixed specimens. Moreover, the ddPCR assessment is in agreement with higher extent of RNA fragmentation in Bouin’s samples: These samples, indeed, had lower copies/µL than formalin for all miRNAs investigated. In particular, this trend is even more evident for
miR-30d-5p because of its lower expression level in ovarian cancers. The highest fragmentation of the RNAs in Bouin’s fixative is in line with the fixative composition, which has a 9–10% concentration of formaldehyde, 5% glacial acetic acid, and 0.9% of picric acid [
19], and it is in agreement also with results reported by other authors [
3,
4,
20,
21,
22]. Only Gloghini and colleagues have demonstrated the detection of 921 base stretches by RT-PCR from both formalin- and Bouin’s-fixed tissues, but the sample fixation time was reduced to 5 hours [
23].
Real-time PCR results were significantly correlated between Bouin’s- and formalin-fixed specimens for most miRNA analyzed, but not for
let-7e-5p and
miR-155-5p, as shown by Spearman’s and regression analyses. Although a possible explanation could be related to the different sequence of the miRNA in terms of GC content (
let-7e-5p has 41% and
miR-155-5p 38%, respectively) as it seems that miRNAs with GC% of less than 40% are significantly degenerated in FFPE specimens [
24], data from
miR-200a-3p and
miR-429 (GC content 41% and 36%, respectively) do not support this hypothesis. The absence of correlation between formalin- and Bouin’s-fixed tissues for
let-7e-5p and
miR-155-5p seems to support a different preservation of those two miRNAs in Bouin’s and formalin fixatives. However, we cannot exclude that this result is an artifact stemming from the customized design of PCR assays for those two miRNAs. Regarding the analyzed fixatives, both are formalin-based, however the contribution of the nitrogenous bases modification by those fixatives is virtually unknown. It is well known that adenine is the most modified nitrogenous base after formalin fixation [
25], so it is reasonable to suppose that formalin fixation could alter the detectability of some miRNAs with higher adenine content. Given the results of rRNA on fragmentation showing a higher fragmentation in Bouin’s-fixed samples, it is reasonable to hypothesize that one possible difference between the two fixatives arises from a higher modification of RNA in formalin-fixed specimens. We acknowledge that Bouin’s fixative has a high percentage of formalin, but no data are available at present on the modification rate of adenine residues in Bouin’s-fixed nucleic acids. Given the composition of Bouin’s fixative, it is likely that the activity of formalin, including its ability to modify adenine residues by CH
2OH addition, could be inhibited by the low pH due to the presence of picric acid [
21]. In Bouin’s solution, indeed, the effects of formalin and picric and acetic acids balance each other: (i) Formalin fixes cytoplasm, hardens tissues, and prevents paraffin penetration; (ii) picric acid leaves tissue soft and coagulates cytoplasm, compensating for most the unduly effects of formalin; (iii) the tissue shrinking effect of picric acid is compensated by acetic acid [
26].
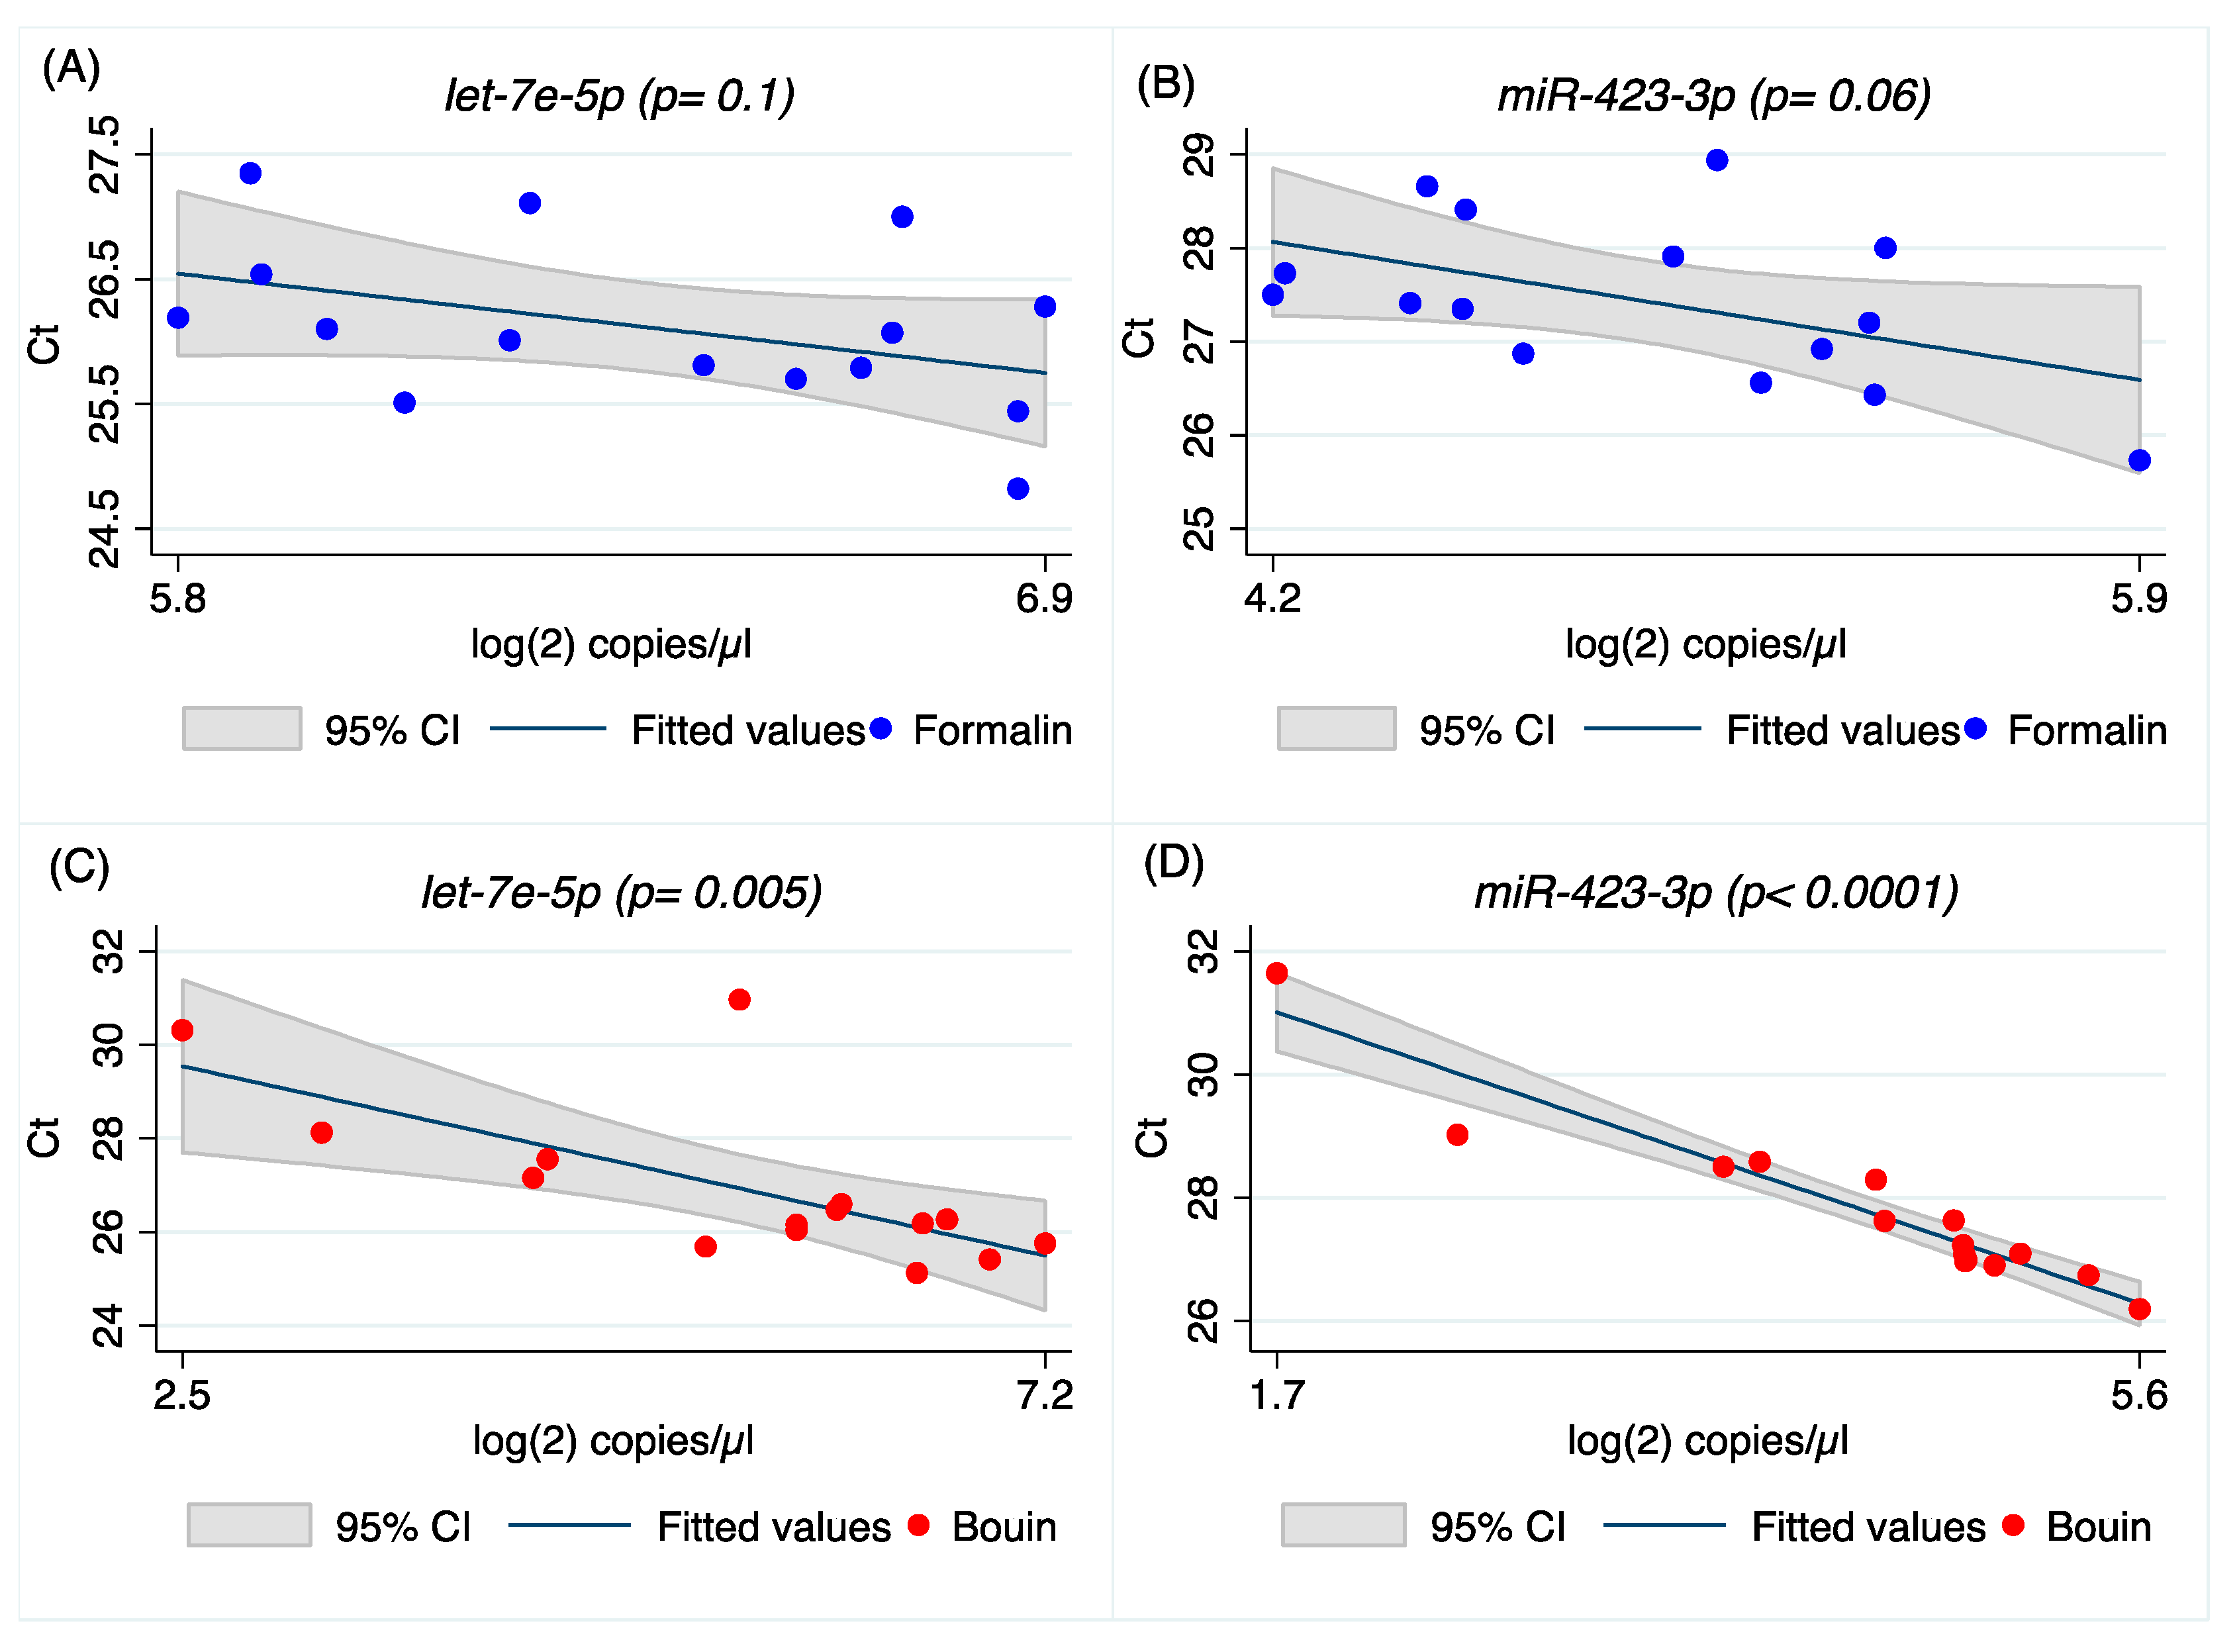
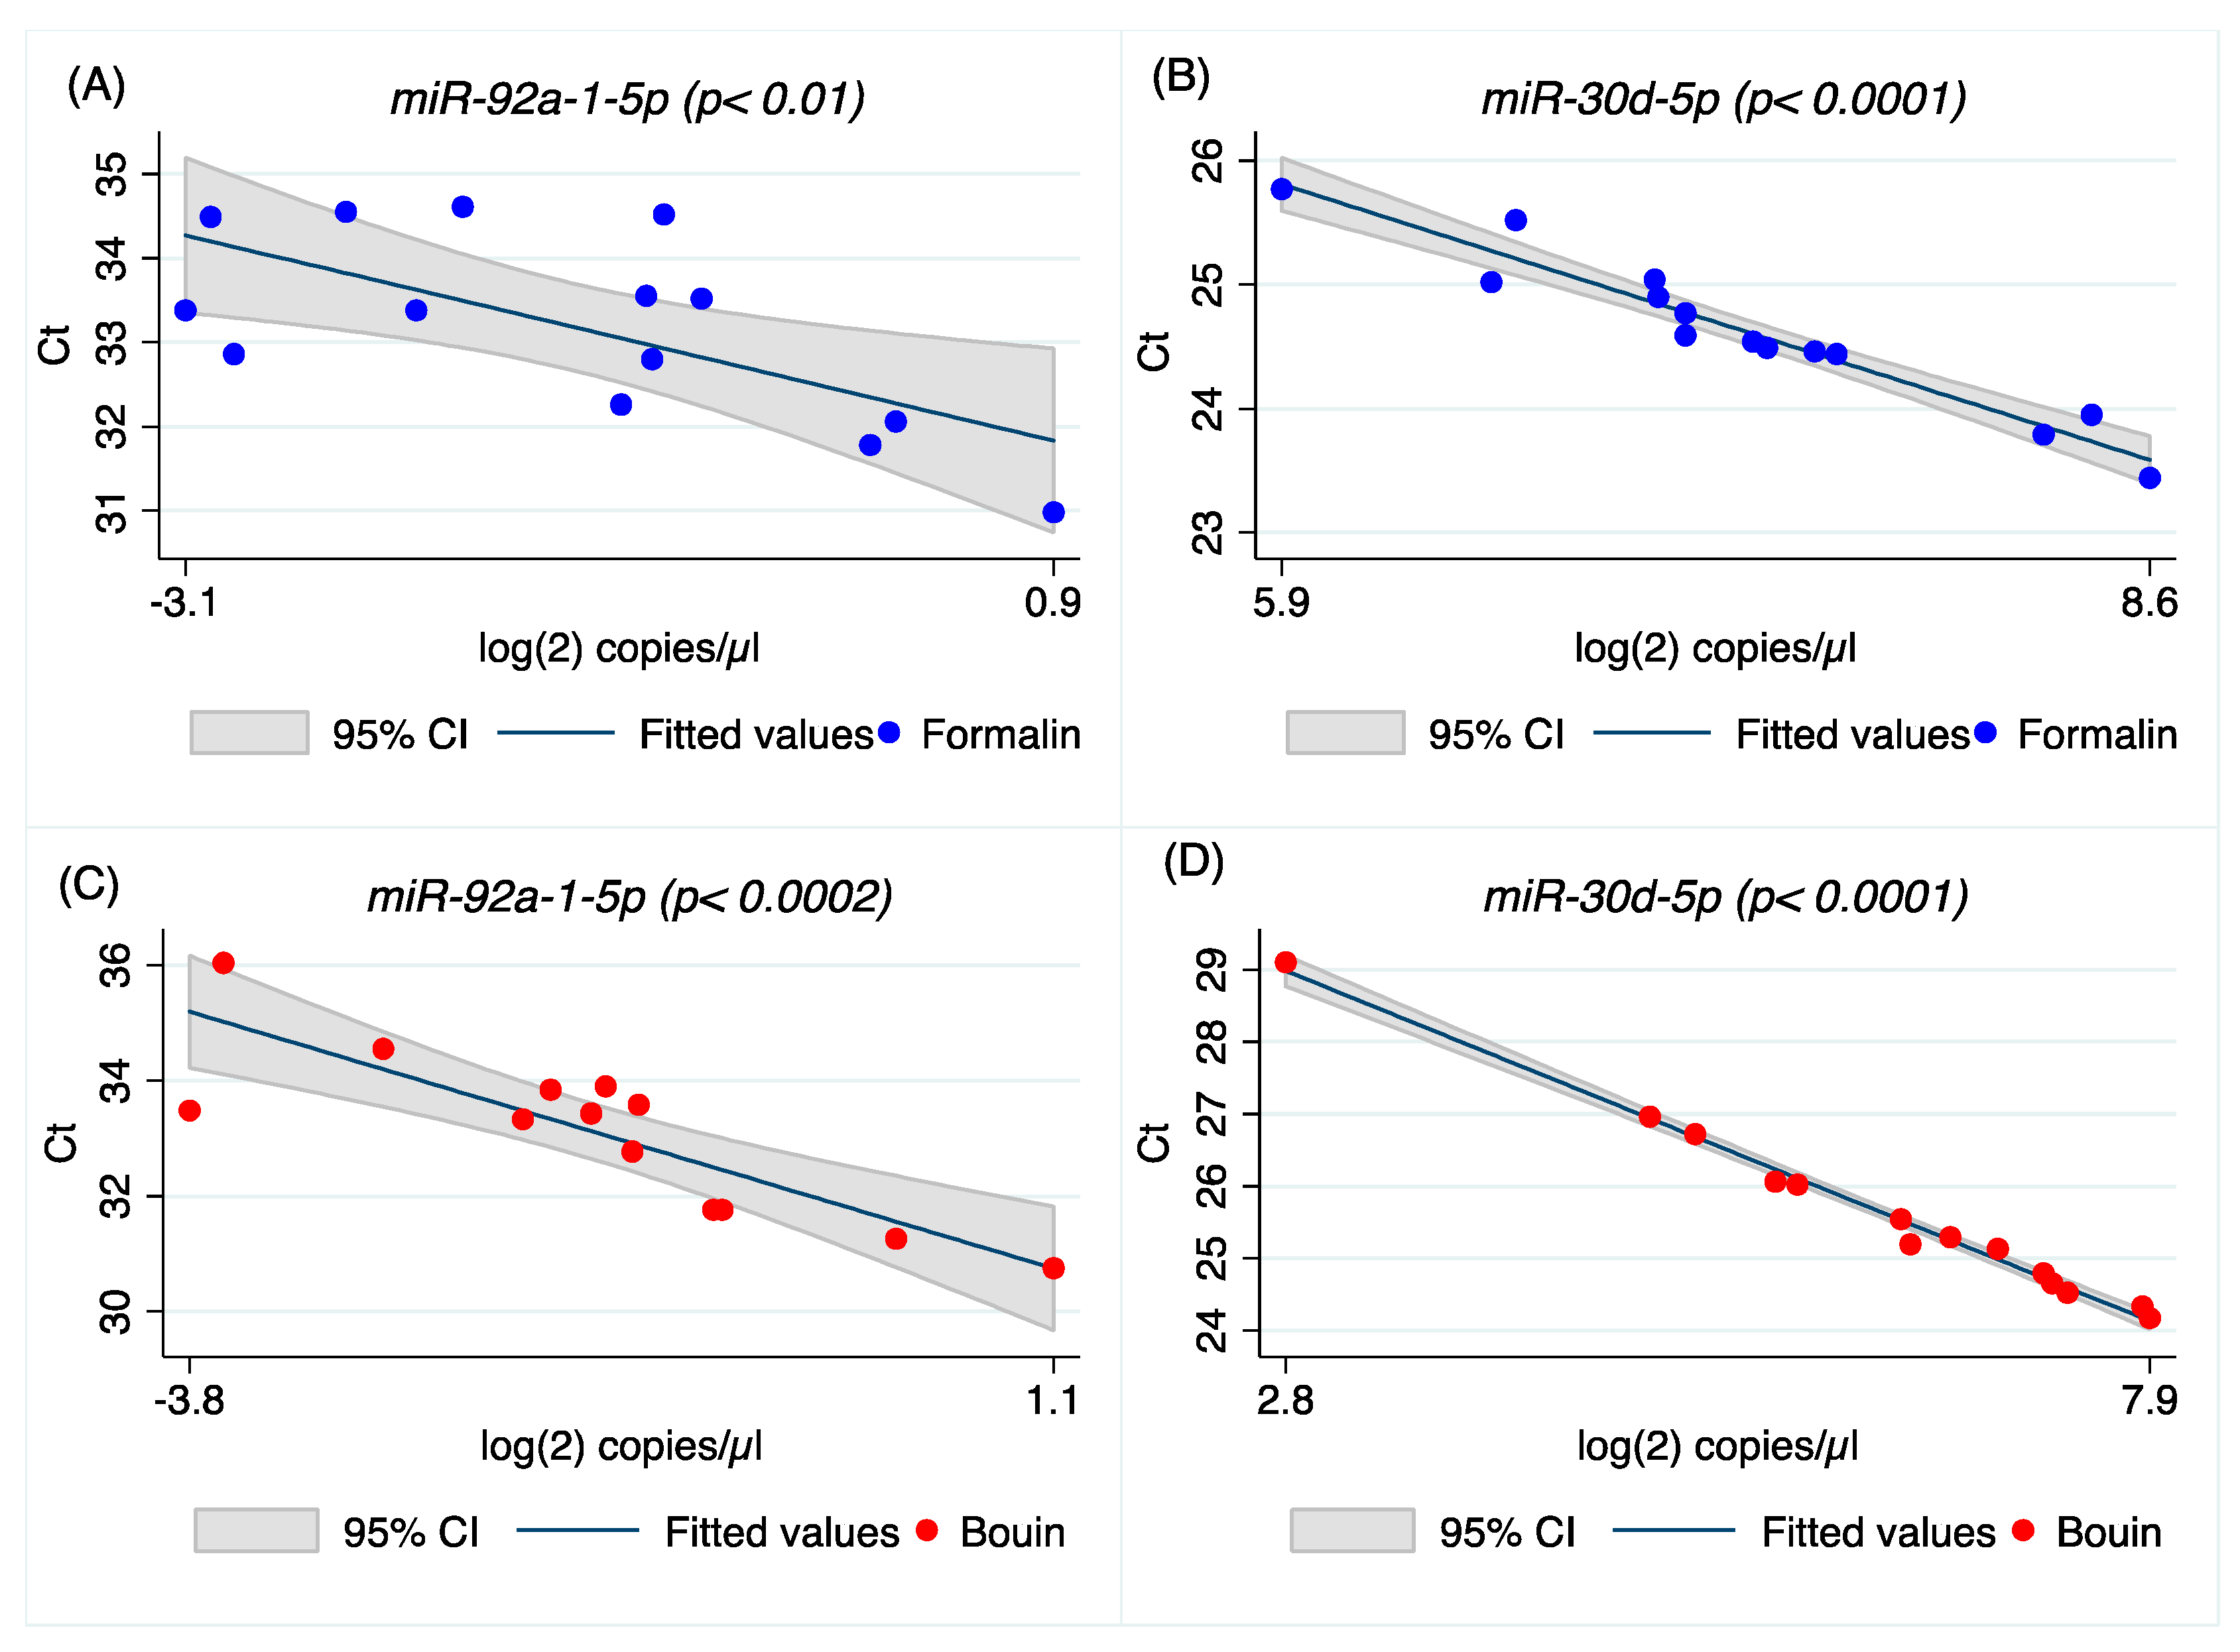
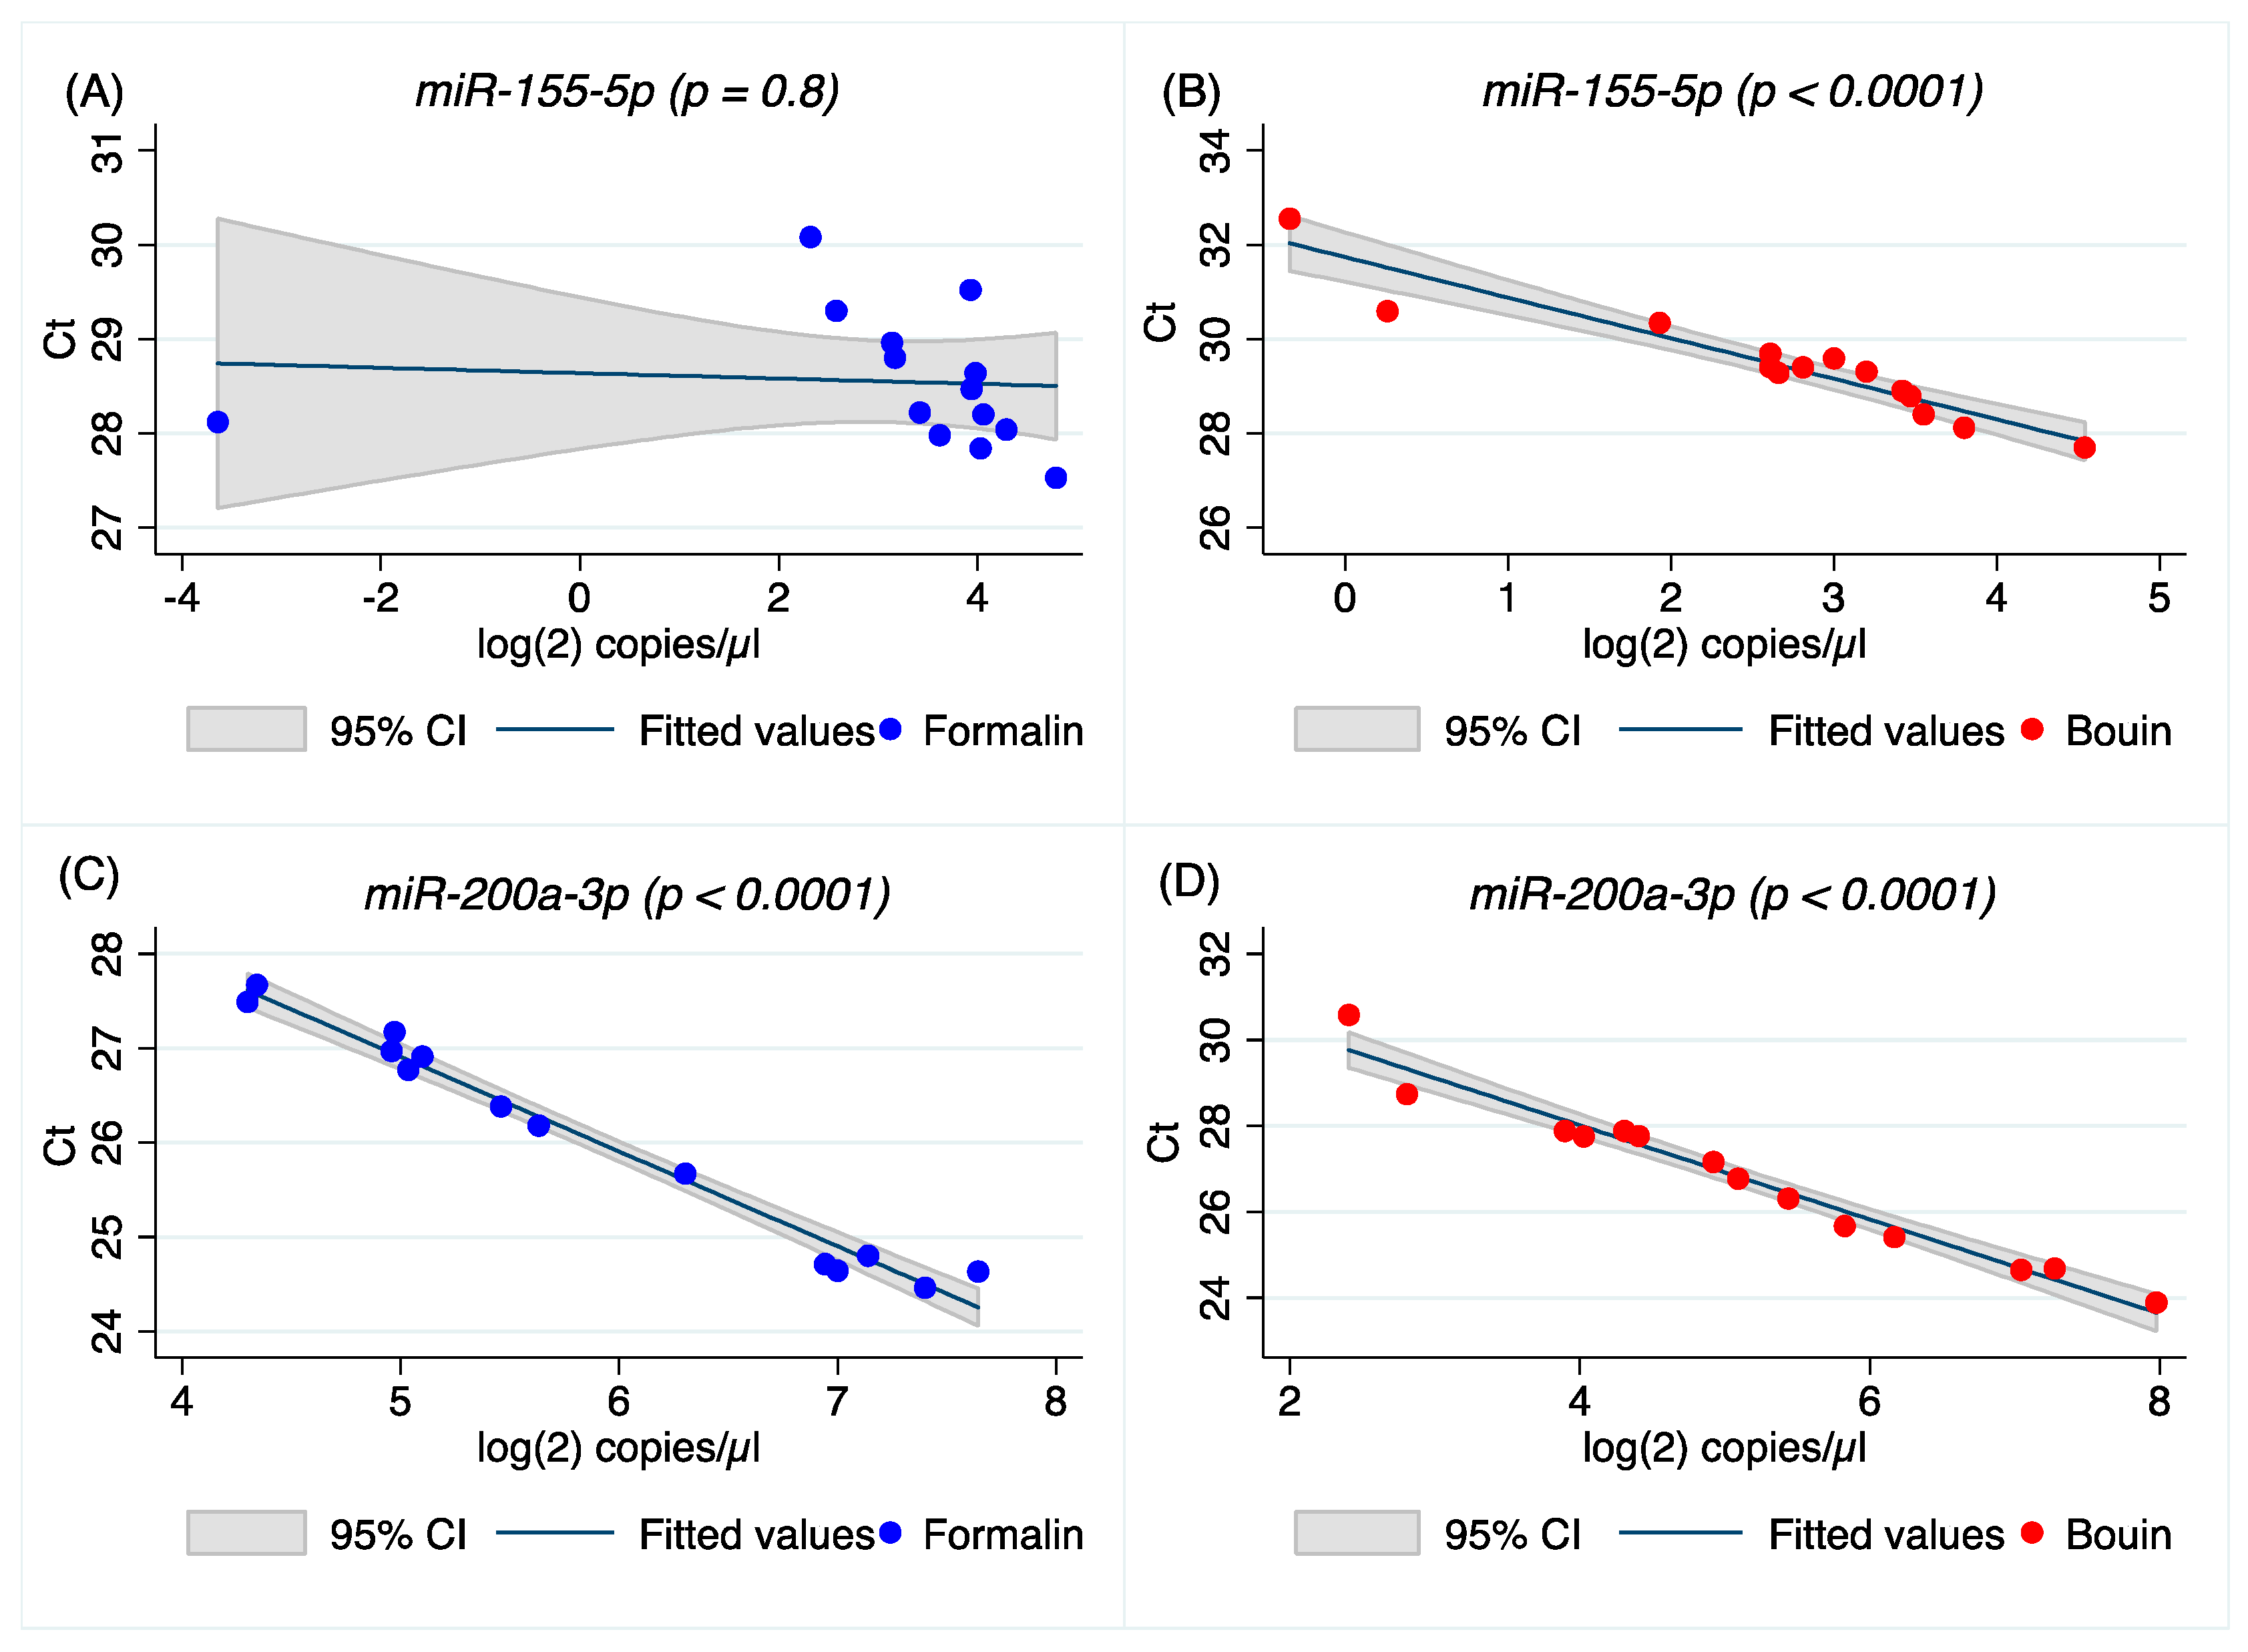
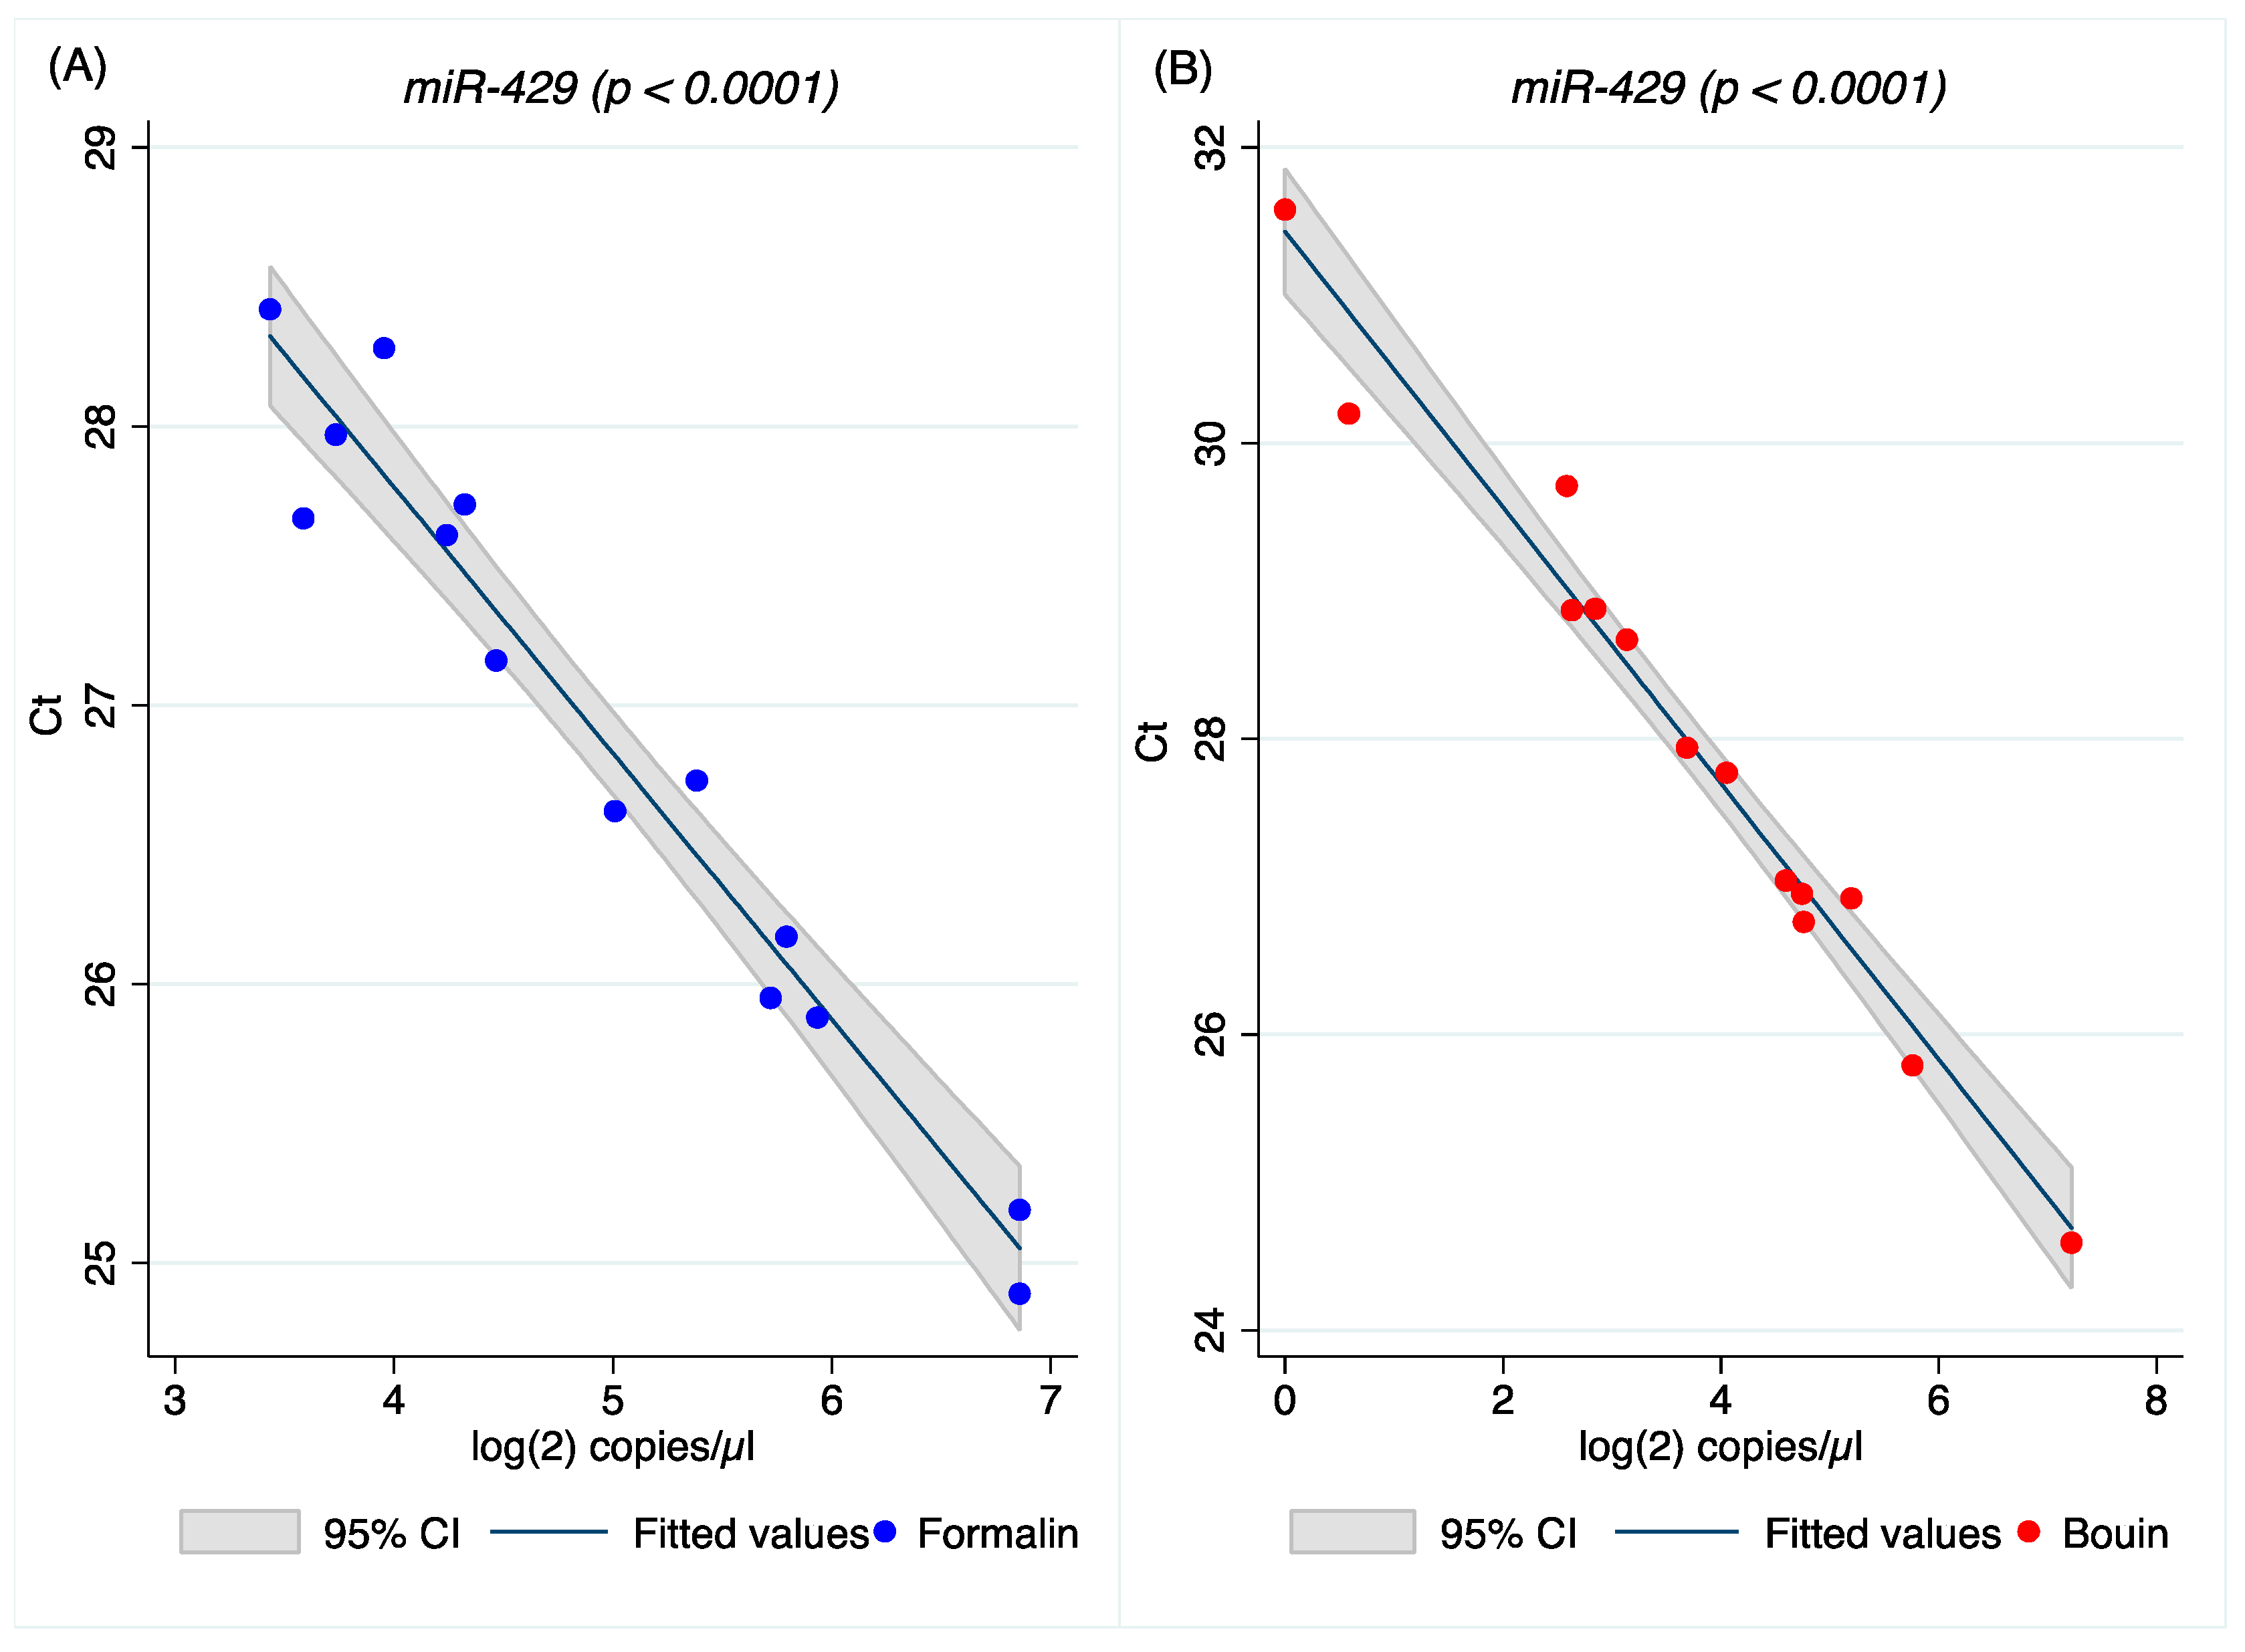
A higher correlation between ddPCR and real-time PCR results was obtained for all miRNAs investigated in Bouin’s-fixed specimens, as shown in
Figure 4,
Figure 5,
Figure A4 and
Figure A5 (the latter two in
Appendix A). In Bouin’s fixative, a lower deviation from the linear prediction and a tighter confidence interval were detected. One possible hypothesis to explain the lower correlation detected in FFPE samples could be related to a higher amount of modified bases, due to formaldehyde addition to the RNA bases that can act as a PCR inhibitor. This is evident when comparing real-time PCR results with ddPCR because the latter has already shown higher resilience to PCR inhibitors [
27]. It was already demonstrated that DNA isolated from FFPE tissue itself exhibits an inhibitory effect on PCR, leading to unstable amplification [
28]; therefore, for RNA, we hypothesize a similar behavior, presumably due to the adducts.
Bouin’s fixative consists of picric acid, acetic acid, and also formaldehyde, having both a coagulative as well as cross-linking effect on proteins [
22], with a possible minor modification of nitrogenous bases due to the acidic pH. The possible inhibitor activity of the mono-methylol adducts in formalin extracts is supported also by the lower amplification efficiencies detected in formalin compared to Bouin’s (
Table 1). Any deviation of the PCR efficiency from 1 can provide a measure of the level of PCR inhibition in the sample [
29]. Nevertheless, we acknowledge that a limitation on the abovementioned hypothesis is the small amount of RNA processed to generate cDNA (20 ng) and the high dilution used for PCR analyses (40
X).
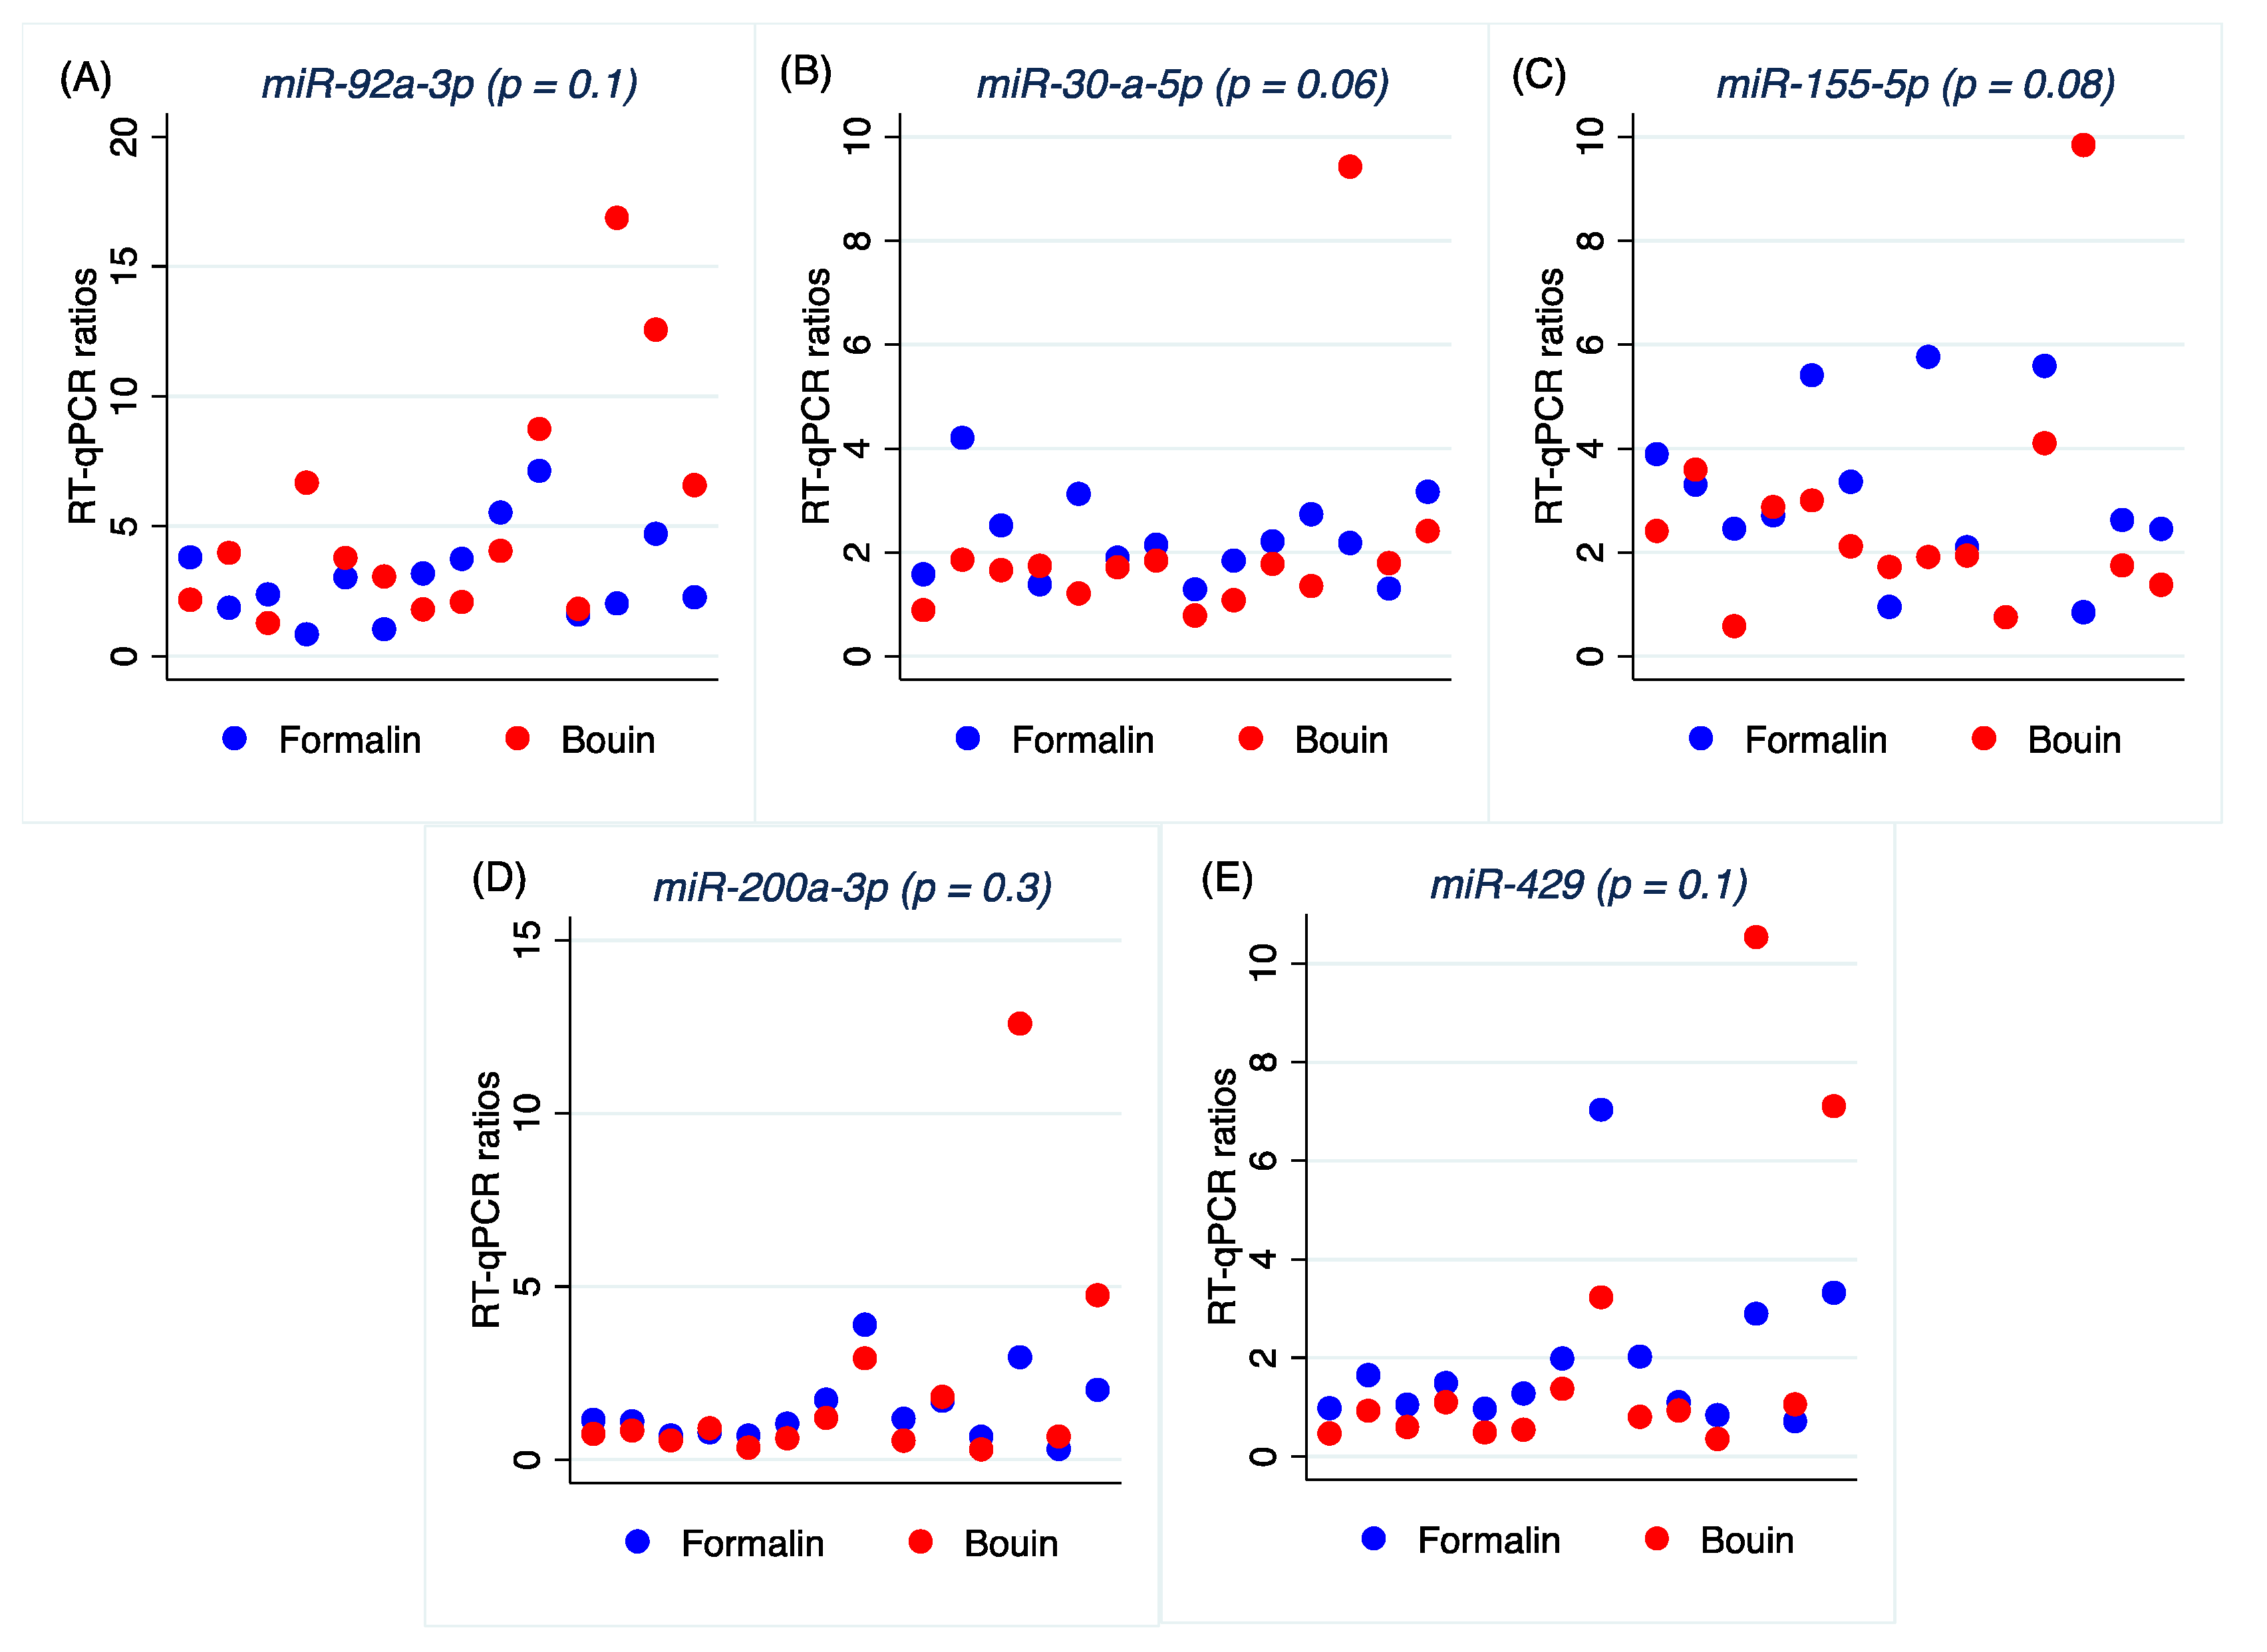
Our results show that by choosing the proper reference miRNAs with a calibrator that includes both formalin- and Bouin’s-fixed samples, it is possible to eliminate differences in the expression profiles of miRNAs and analyze in the same cohort samples processed with both fixatives. Although no significant differences were obtained in the expression profiles in formalin- and Bouin’s-fixed samples, we acknowledge that specific care should be taken for outliers and further validation studies are needed to verify that finding.
In conclusion, our results indicate that microRNAs can be analyzed in formalin- and Bouin’s-fixed samples as well. Our data support for a higher fragmentation of miRNA from Bouin’s-fixed tissues, but a possible lower level of nitrogenous bases modification by formalin. Thus, miRNA expression studies can be reliably performed by real-time PCR or, better, by ddPCR in routinely obtained pathological material fixed in formalin or Bouin’s fluid, but considering proper data normalization correcting sample-to-sample degradation.
We acknowledge as limitations of this study that no analyses have been made in fresh frozen samples for a further validation of results, and that no analyses have been carried out to test the level of adenine modification in the analyzed specimens. As a future perspective, the chemical analysis of the RNA templates obtained from Bouin’s-fixed samples is planned.
4. Materials and Methods
4.1. Samples
A total of 30 paraffin-embedded tissue blocks from 15 patients were collected at the National Cancer Institute of Aviano. Informed consent was obtained from all individual participants included in the study. The study was conducted in accordance with the Declaration of Helsinki, and it was approved by the Institutional Review Board of CRO-Aviano (protocol number 1213, 24/01/2017). For each patient, two matched tissue blocks of the same surgical specimen were retrieved, one fixed in formalin and one in Bouin’s solution, for a total of 15 matched pairs. All cases were obtained from debulking surgeries of high grade serous ovarian cancers, carried out from 2002 to 2009, of pT3c grade and stage III. HGSOC cases have been selected for the HERCULES project funded by the European Union’s Horizon 2020 research and innovation program under grant agreement No 667403. Fixation and embedding procedures were those routinely performed in the laboratory at the time of patient’s surgery with a conventional fixation for 24 h.
4.2. miRNA Isolation from Formalin- and Bouin’s-Fixed Paraffin-Embedded Tissues
From each paraffin-embedded block, one 10-μm-thick section was cut and collected into 1.5-ml microcentrifuge sterile tubes. miRNA isolation was carried out by the use of the Maxwell RSC® extractor (Promega, Madison, WI 53711-5399, USA) using a purification protocol which allows extracting miRNAs from fixed tissues as suggested by the manufacturer. In detail, tissue de-waxing was carried out by the use of 300 µL of mineral oil as provided by the Maxwell® RSC RNA FFPE kit (Promega, Madison, WI 53711-5399, USA; code AS1440). Procedures of the abovementioned kit were strictly followed for protein digestion by proteinase K and the DNAse digestion step. Afterwards, the aqueous solution of digested samples was transferred into the cartridge of the Maxwell® RSC miRNA tissue kit (Promega, Madison, WI 53711-5399, USA; code AS1460) to allow miRNA, as well as total RNA, isolation following the manufacturer’s procedures. Elution of the samples was done in 30 µL of nuclease-free water (Promega, Madison, WI 53711-5399, USA).
4.3. RNA Quantification and Quality
RNA concentration and purity were measured by Nanodrop ND 1000 spectrophotometer (Thermo Scientific, Waltham, MA 02451, USA) using 1 µL of isolated RNA. The A280/260 and A260/230 absorbance ratios were used to assess purity, considering a ratio between 1.8 and 2.0 to be pure.
RNA and miRNA integrity was estimated by microcapillary electrophoresis in an Agilent 2100 Bioanalyzer (Agilent Technology, Santa Clara, CA 95051, USA). For miRNA analysis, sample aliquots were diluted at 10 ng/µL just before use and measured in the Agilent 2100 Bioanalyzer using a Small RNA kit (Agilent Technology, Santa Clara, CA 95051, USA). The integrity of miRNA was calculated as the relative abundance of miRNA species (10–40 nt) in comparison to the total amount of small RNA fraction (10–150 nt). For RNA integrity, 1 µL of RNA was submitted to Agilent 2100 Bioanalyzer using Agilent RNA 6000 nano kit (Agilent Technology, Santa Clara, CA 95051, USA). RIN number and relative percentage of total RNA species (60–149 nt and 150–299 nt) were recorded.
4.4. cDNA Synthesis
Twenty nanograms of RNA was reverse transcribed into cDNA in 10 µL final volume, using the miRCURY LNA RT (Qiagen, Hilden, Germany) according to manufacturer’s instructions. The cDNA was then split into aliquots of 2 µL and stored at −80 °C until use. To cover the methods’ set-up and analysis, cDNA synthesis was made in duplicate with 20 ng of RNA each time.
4.5. Real-time PCR
miRNA
let-7e-5p (MIMAT0000066),
miR-423-3p (MIMAT0001340),
miR-92a-1-5p (MIMAT0004507),
miR-30d-5p (MIMAT0000245),
miR-155-5p (MIMAT0000646),
miR-200a-3p (MIMAT0000682), and
miR-429 (MIMAT0001536) were analyzed by real-time PCR.
miR-423-3p and
let-7e-5p were chosen as they have been reported to be stably expressed in high grade serous ovarian cancer [
30]. The remaining ones were chosen for their content in GC and their expression in ovarian cancers [
9,
10,
11,
12]. Complementary DNA aliquots were diluted 40x just before use, and real-time PCR was run using 4 µL of diluted cDNA corresponding to 0.4 ng of cDNA in a total reaction volume of 10 µL. The reaction mixture was composed of 1 µL of the specific miRCURY miRNA Assay primer set (Qiagen, Hilden, Germany) and 5 µL of Fast EVA Green qPCR mastermix (Biotium, Fremont, CA 94538, USA). All reactions were run in duplicate, and a negative control without cDNA was added in each run. Samples were amplified on a Mastercycler
® ep Realplex (Eppendorf, Hamburg, Germany) using the following cycling conditions: 95 °C for 10 min, 40 cycles of 95 °C for 10 s and 60 °C for 1 min. For
mi-92a-1-5p and
miR-30d-5p, an annealing-extension temperature of 56 °C was applied; for
miR-200a-3p and
miR-429, it was of 58 °C. For every miRNA tested by real-time PCR, a standardization curve was created using a pool of cDNA from Bouin’s and FFPE samples. Standard curve was generated for three points using the following dilutions: 10
x (0.4 ng/µL); 40
X (0.1 ng/µL); 160
x (0.025 ng/µL) for all the analyzed miRNAs. Standard curves were generated in duplicate for each miRNA and each pool of cDNA using 4 µL of diluted cDNA per replica. Cases with differences of Ct ≥ 0.5 cycle were repeated in triplicate.
4.6. Data Normalization
miRNA expression levels obtained by real-time qPCR were normalized using
let-7e-5p and
miR-423-3p as normalizing miRNAs, as returned by Bestkeeper software. In normalizing data, the geometric mean of
let-7e-5p and
miR-423-3p Cts was used as reference gene, while the mean of formalin and Bouin’s pooled samples was used as calibrator in the relative quantification method proposed by Livak et al. [
31].
4.7. ddPCR
Four microliters of 40x diluted cDNAs was used in each ddPCR reaction for a direct comparison with real-time PCR. The reaction mixture contained 1x final of QX200TM EvaGreen ddPCR Supermix (BioRad, Hercules, CA 94547, USA) and the miRCURY LNA PCR primer set at the appropriate concentration, which was set up experimentally for each miRNA investigated in the present study. A non-template control of deionized water was used instead of cDNA samples in each reaction. Droplet generation was performed in a QX200TM Droplet Generator (BioRad, Hercules, CA 94547, USA). The droplets’ emulsion was transferred onto a 96-well plate (Eppendorf, Hamburg, Germany), which was foil-sealed twice at 179 °C for 3 s in a PX1 PCR Plate Sealer (BioRad, Hercules, CA 94547, USA) and PCR was run in a iCycler thermocycler (BioRad, Hercules, CA 94547 USA) as follows: 95 °C for 5 min; 40 cycles of 95 °C for 30 s and 56 °C for 1 min; signal stabilization at 4 °C for 5 min and 90 °C for 5 min, and final hold at 4 °C. The annealing/extension temperature for miR-155-5p, miR-200a-3p, and miR-429 was 57 °C. After amplification, the fluorescence of each droplet was read in the QX200TM Droplet Reader (BioRad, Hercules, CA 94547, USA). Droplet digital PCR data were analyzed using QuantaSoftTM software and droplets’ count was fitted to a Poisson distribution to obtain the absolute concentration (copies/µL) of the target sequence.
4.8. Statistical Analyses
Data distribution was tested by Kurtosis test to establish the type of statistical tests (parametric or non-parametric). For normally distributed variables, the t-test for paired-data was run, while Wilcoxon signed rank test was used in case of non-normal distribution of data. Linear regression was run to establish the relationship between two variables (i.e., ddPCR and real-time PCR results). Pairwise Spearman’s rank analysis was carried out to investigate on variables’ dependence in case of non-normal data distribution.
All p-values are two-sided with values <0.05 regarded as statistically significant. Statistical analyses were performed with the Stata/SE 12 package (Stata, College Station, TX, USA).


 ,
, 


