Article

Novel Pituitary Actions of Epidermal Growth Factor: Receptor Specificity and Signal Transduction for UTS1, EGR1, and MMP13 Regulation by EGF

Hubei Provincial Engineering Laboratory for Pond Aquaculture, College of Fisheries, Huazhong Agricultural University, Wuhan 430070, China
*
Author to whom correspondence should be addressed.
Int. J. Mol. Sci. 2019, 20(20), 5172; https://doi.org/10.3390/ijms20205172
Submission received: 23 September 2019 / Revised: 12 October 2019 / Accepted: 16 October 2019 / Published: 18 October 2019
(This article belongs to the Section Biochemistry)

Abstract

:
Epidermal growth factor (EGF) is a member of the EGF-like ligands family, which plays a vital role in cell proliferation, differentiation, and folliculogenesis through binding with EGF receptors, including ErbB1 (EGFR/HER1), ErbB2 (HER2), ErbB3 (HER3), and ErbB4 (HER4). In mammals, many functional roles of EGF have been reported in the ovaries and breasts. However, little is known about the functions of EGF in the pituitary, especially in teleost. In this study, using grass carp pituitary cells as the model, we try to examine the direct pituitary actions of EGF in teleost. Firstly, transcriptomic analysis showed that 599 different expressed genes (DEGs) between the control and EGF-treatment group were mainly involved in cell proliferation, cell migration, signal transduction, and transcriptional regulation. Then, we further confirmed that EGF could significantly induce UTS1, EGR1, and MMP13 mRNA expression in a time-and dose-dependent manner. The stimulatory actions of EGF on UTS1 and EGR1 mRNA expression were mediated by the MEK1/2/ERK1/2 and PI3K/AKT/mTOR pathways coupled with both ErbB1 and ErbB2 in grass carp pituitary cells. The receptor specificity and signal transductions for the corresponding responses on MMP13 mRNA expression were also similar, except that the ErbB2 and PI3K/AKT/mTOR pathway were not involved. As we know, MMP13 could release EGF from HB-EGF. Interestingly, our data also showed that the MMPs inhibitor BB94 could suppress EGF-induced UTS1 and EGR1 mRNA expression. These results, taken together, suggest that the stimulatory actions of EGF on UTS1 and EGR1 mRNA expression could be enhanced by EGF-induced MMP13 expression in the pituitary.

1. Introduction

Epidermal growth factor (EGF) is a small protein of 6 kDa containing 53 amino acids, which comprises three disulfide bridges [1]. The biological effects of EGF are mediated mainly through four tyrosine kinase receptors, namely ErbB1 (HER1), ErbB2 (HER2), ErbB3 (HER3), and ErbB4 (HER4) [2]. EGF is a potent mitogen growth factor, and so it is involved in the process of cell growth, differentiation, proliferation, metabolism, and tumorigenesis [3]. The EGF ligand and receptor could also play an important role in the renewal of stem cells in early embryonic development, skin, liver, and gut [4]. In the hypothalamus–pituitary–adrenal (HPA) axis, EGF could regulate adrenocorticotropic hormone (ACTH) release through the up-regulation of hypothalamic corticotropin releasing hormone (CRH) [5]. At the pituitary level, EGF could stimulate luteinizing hormone (LH) release [6] and gonadotrope mitosis [7] in rats, and even increase plasma follicle-stimulating hormone (FSH) and LH levels in vivo in ewes [8]. In addition, EGF could also induce prolactin (PRL) synthesis and reduce growth hormone (GH) synthesis in rat pituitary tumor cells [9].
In zebrafish, previous studies found that EGF could significantly enhance the final maturation of the oocytes [10]. Further studies found that EGF was predominantly expressed in the oocytes, whereas epidermal growth factor receptor (EGFR) was highly detected in the follicle cells, which suggested that EGF was a potential paracrine/juxtacrine factor from the oocytes to regulate the function of the follicle cells [11]. At the pituitary level, previous studies found that the EGFR could be detected in zebrafish pituitary cells, but EGF had no effect on the expression of FSHβ, LHβ, and GH [12]. Recently, our study found that EGF could significantly induce somatolactin α (SL α) and tachykinin receptor 3 (TACR3) secretion and synthesis in grass carp pituitary cells [13]. Besides, little is known about the direct pituitary actions of EGF in teleost.
To further examine the direct pituitary actions of EGF in teleost, the primary cultured grass carp pituitary cells were used as the model. Firstly, the global pituitary actions of EGF were examined by using the RNA-Seq technique. Secondly, we further investigated the receptor specificity and signal pathways for EGF-induced Urotensin1 (UTS1) and early growth response 1 (EGR1) mRNA expression in grass carp pituitary cells. Thirdly, we also examined the direct pituitary actions of EGF in matrix metallopeptidase 13 (MMP13) and tissue inhibitor of metalloproteinase 3 (TIMP3) gene expression. Finally, we further examined the functional role of MMP13 in EGF-induced UTS1 and EGR1 gene expression in pituitary cells.

2. Results

2.1. Transcriptomic Analysis

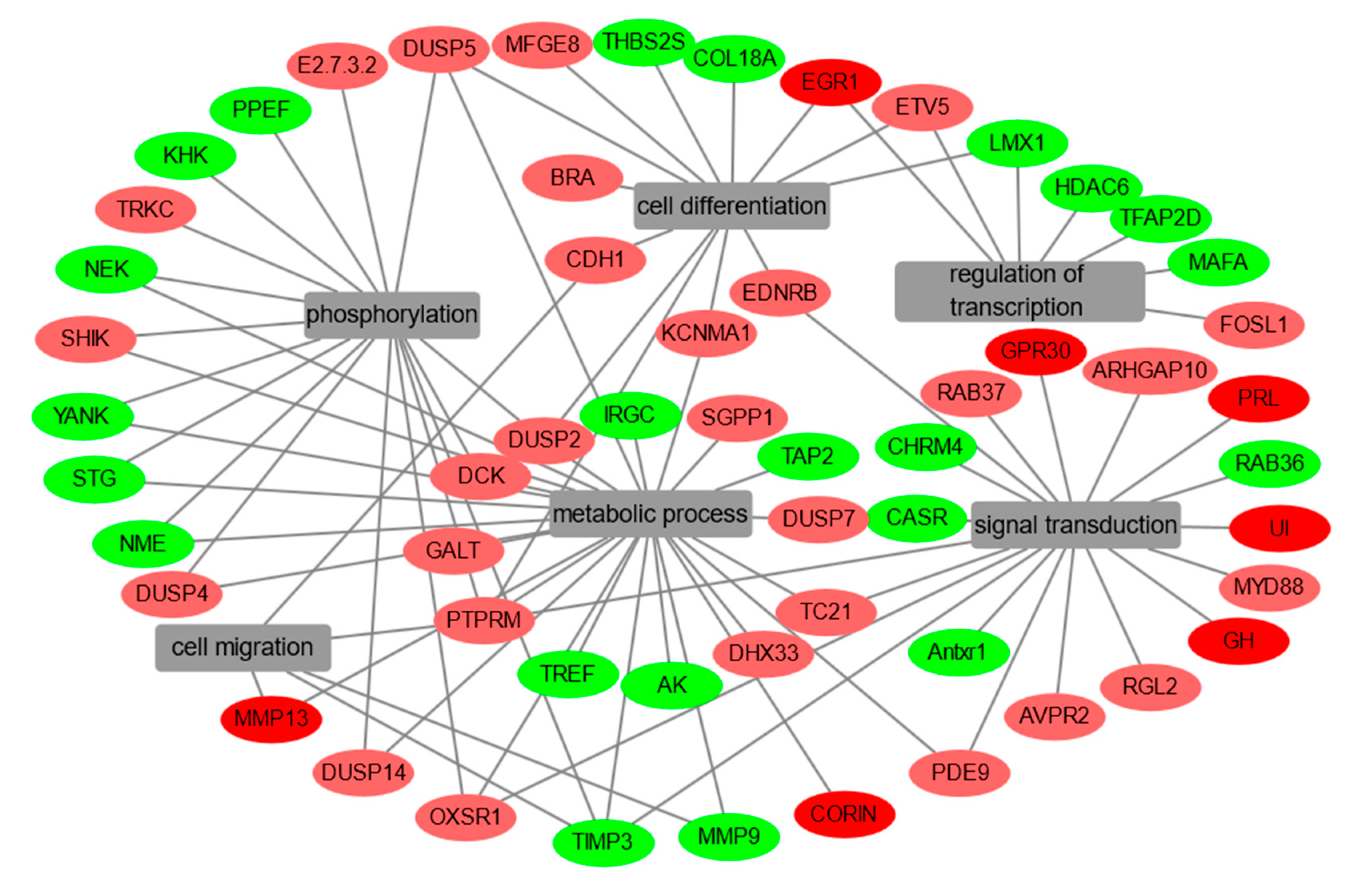
To investigate the global regulation of EGF in fish pituitary, a high-throughput transcriptome was used to compare the transcript levels between the control and EGF-treatment groups. In total, 19,486 genes were identified in grass carp pituitary cells. Compared to the control group, 599 differential expression genes (DEGs) were detected after EGF (0.5 μM)-treatment, fragments per kilobase of exon per million fragments mapped (FPKM) > 5, p < 0.05, fold change (FC) > 1.5, including 195 up-regulated DEGs and 404 down-regulated genes. GO analysis showed that these DEGs were classified in three main ontologies, including cellular component, biological process, and molecular function (Figure 1A). Within the cellular component category, the ‘integral component of membrane’, ‘cytoplasm’, ‘nucleus’, ‘transcription factor complex’, ‘membrane’, and ‘plasma membrane’ were the most enriched GO terms (Figure 1A). In addition, the most abundant groups in molecular function were ‘ATP binding’, ‘metal ion binding’, ‘zinc ion binding’, ‘GTP binding’, and ‘DNA binding transcription’ (Figure 1A). Finally, the GO enrichment analysis of biological process revealed that the top 46 up-regulated DEGs (Table 1) and top 48 down-regulated DEGs (Table 2) were involved in cell migration, cell differentiation, signal transduction, metabolic process, phosphorylation, and transcriptional regulation (Figure 2).
To further understand the direct pituitary functions of EGF, annotated pathways of DEGs were analyzed using the Kyoto Encyclopedia of Genes and Genomes (KEGG) database. The results revealed that a total of 209 DEGs were enriched in the top 10 pathways. Among them, the up-regulated DEGs were mostly enriched in ‘metabolic pathways’ and ‘pathways in cancer’, and the down-regulated DEGs were mainly enriched in ‘PI3K–Akt signaling pathway’, ‘metabolic pathway’, and ‘pathways in cancer’ (Figure 1B).

2.2. EGF-Induced Critical DEGs in Grass Carp Pituitary Cells

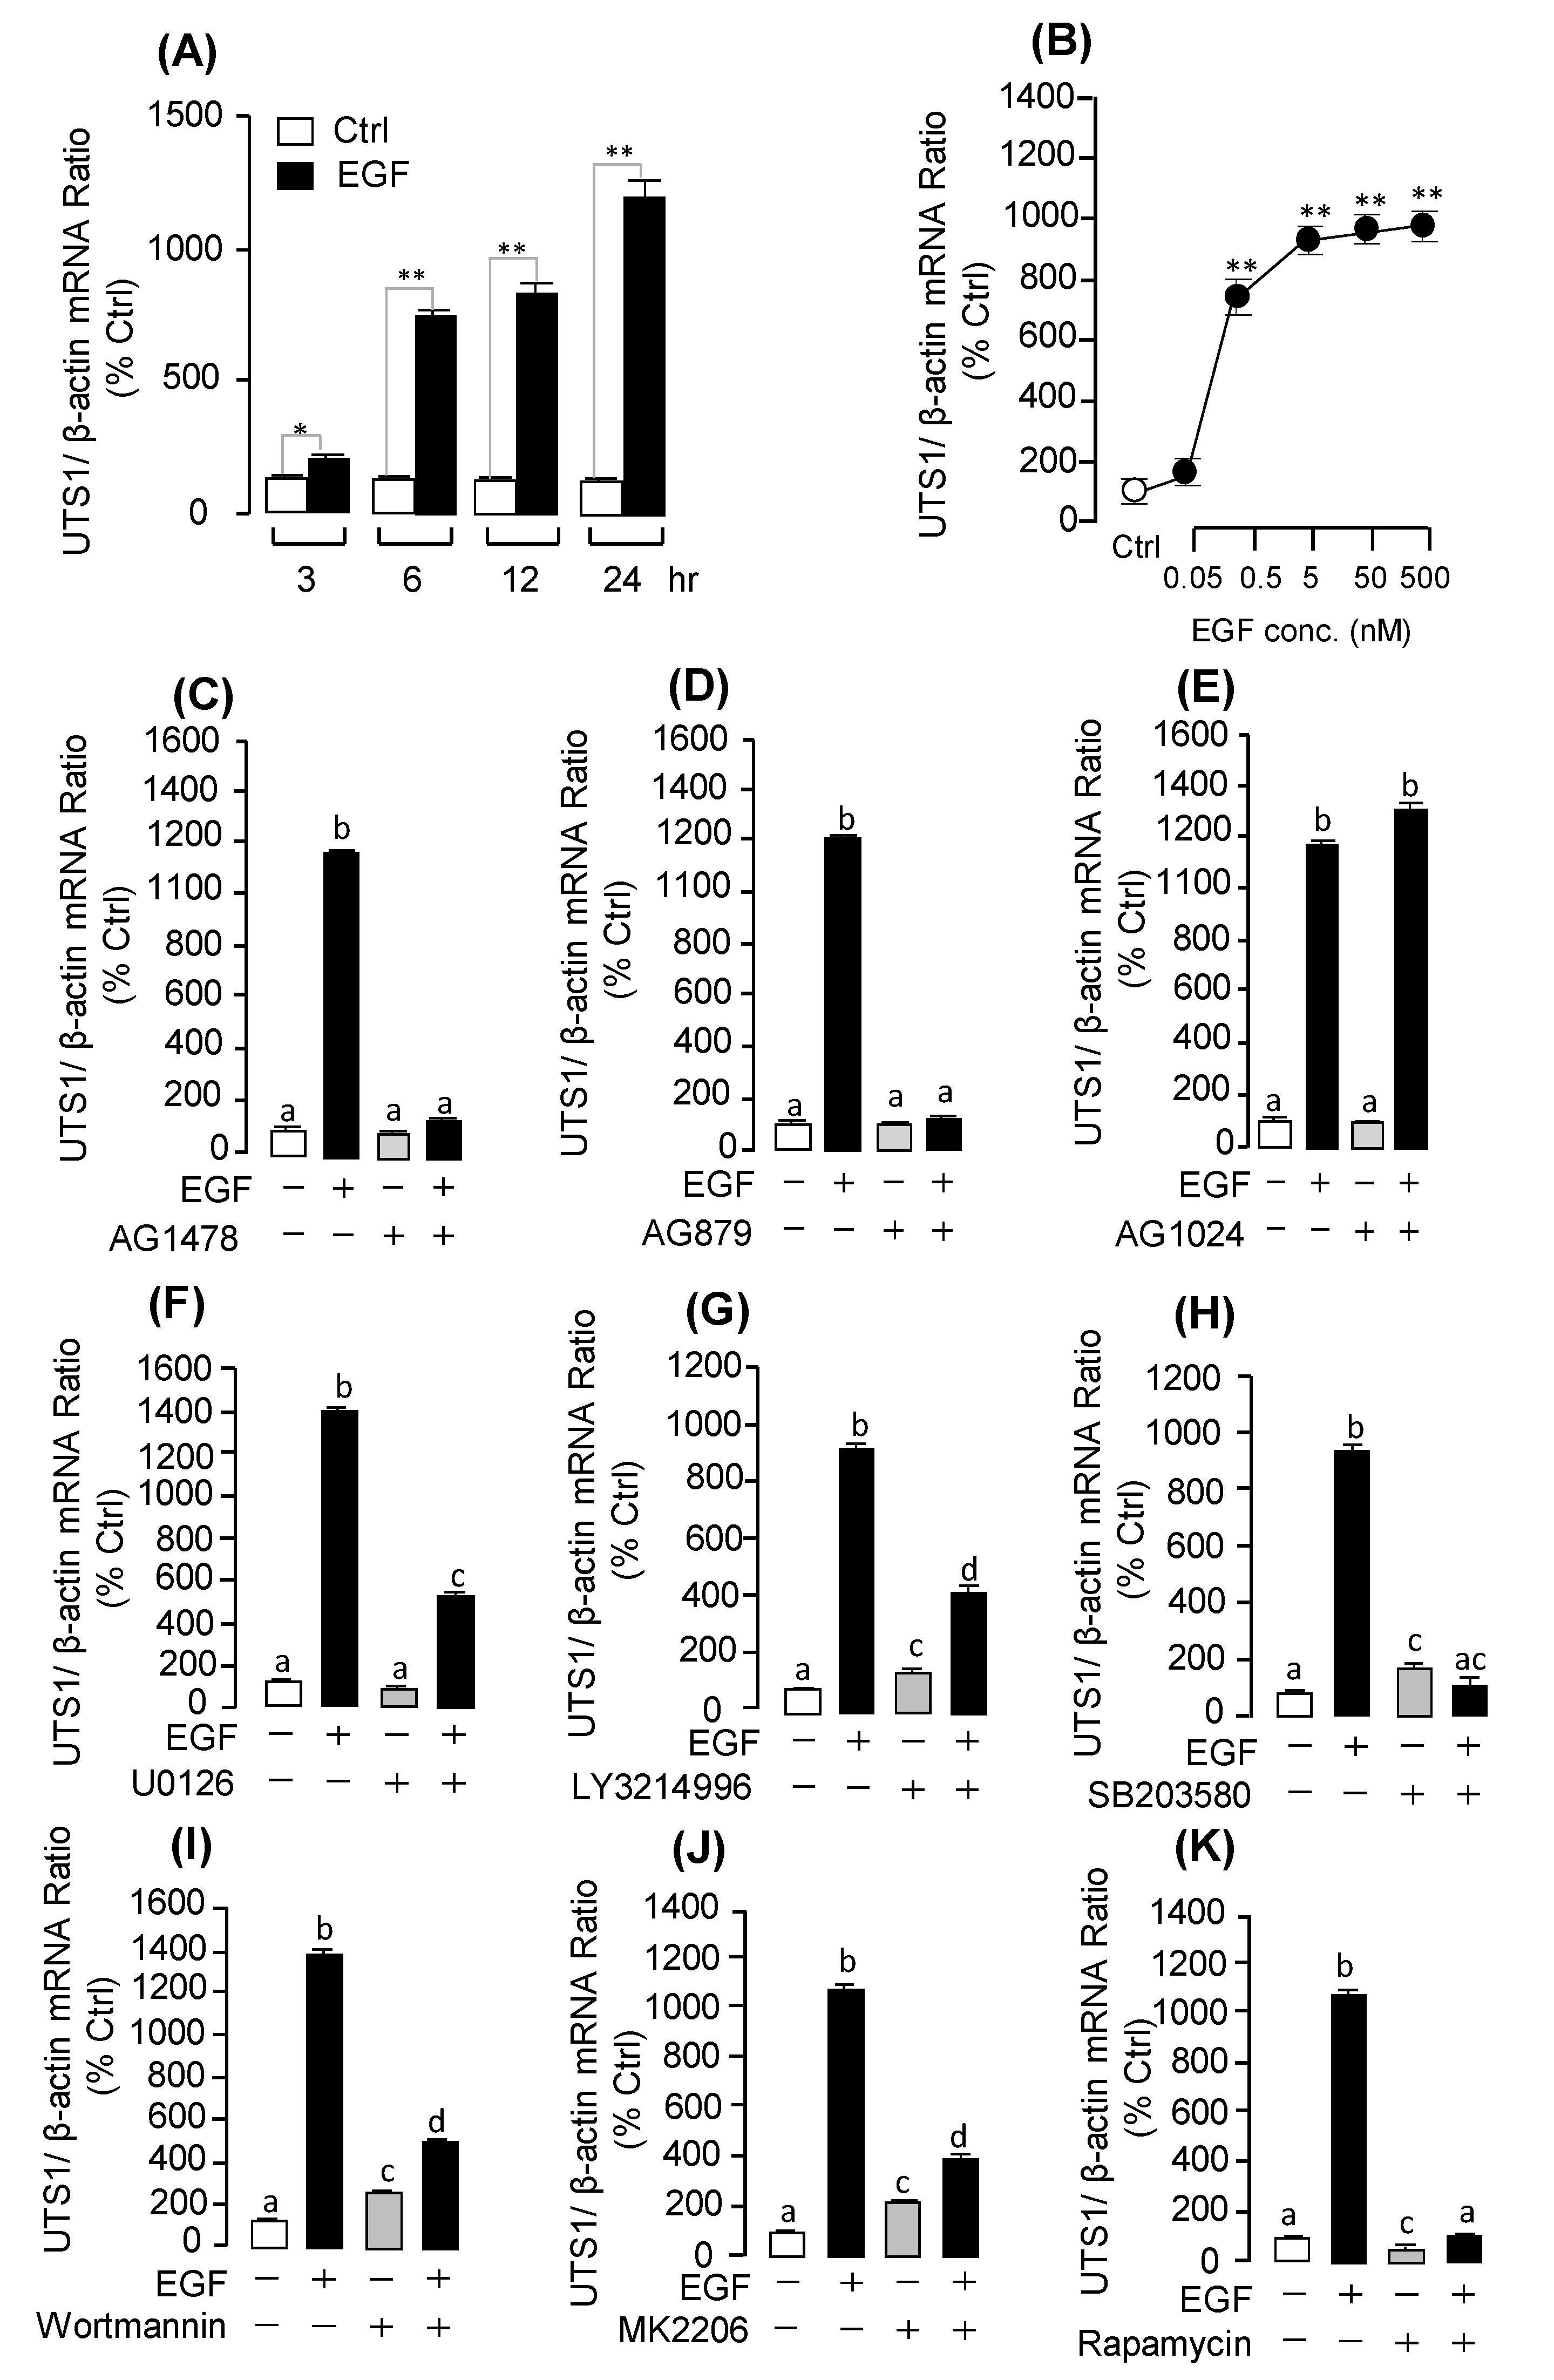
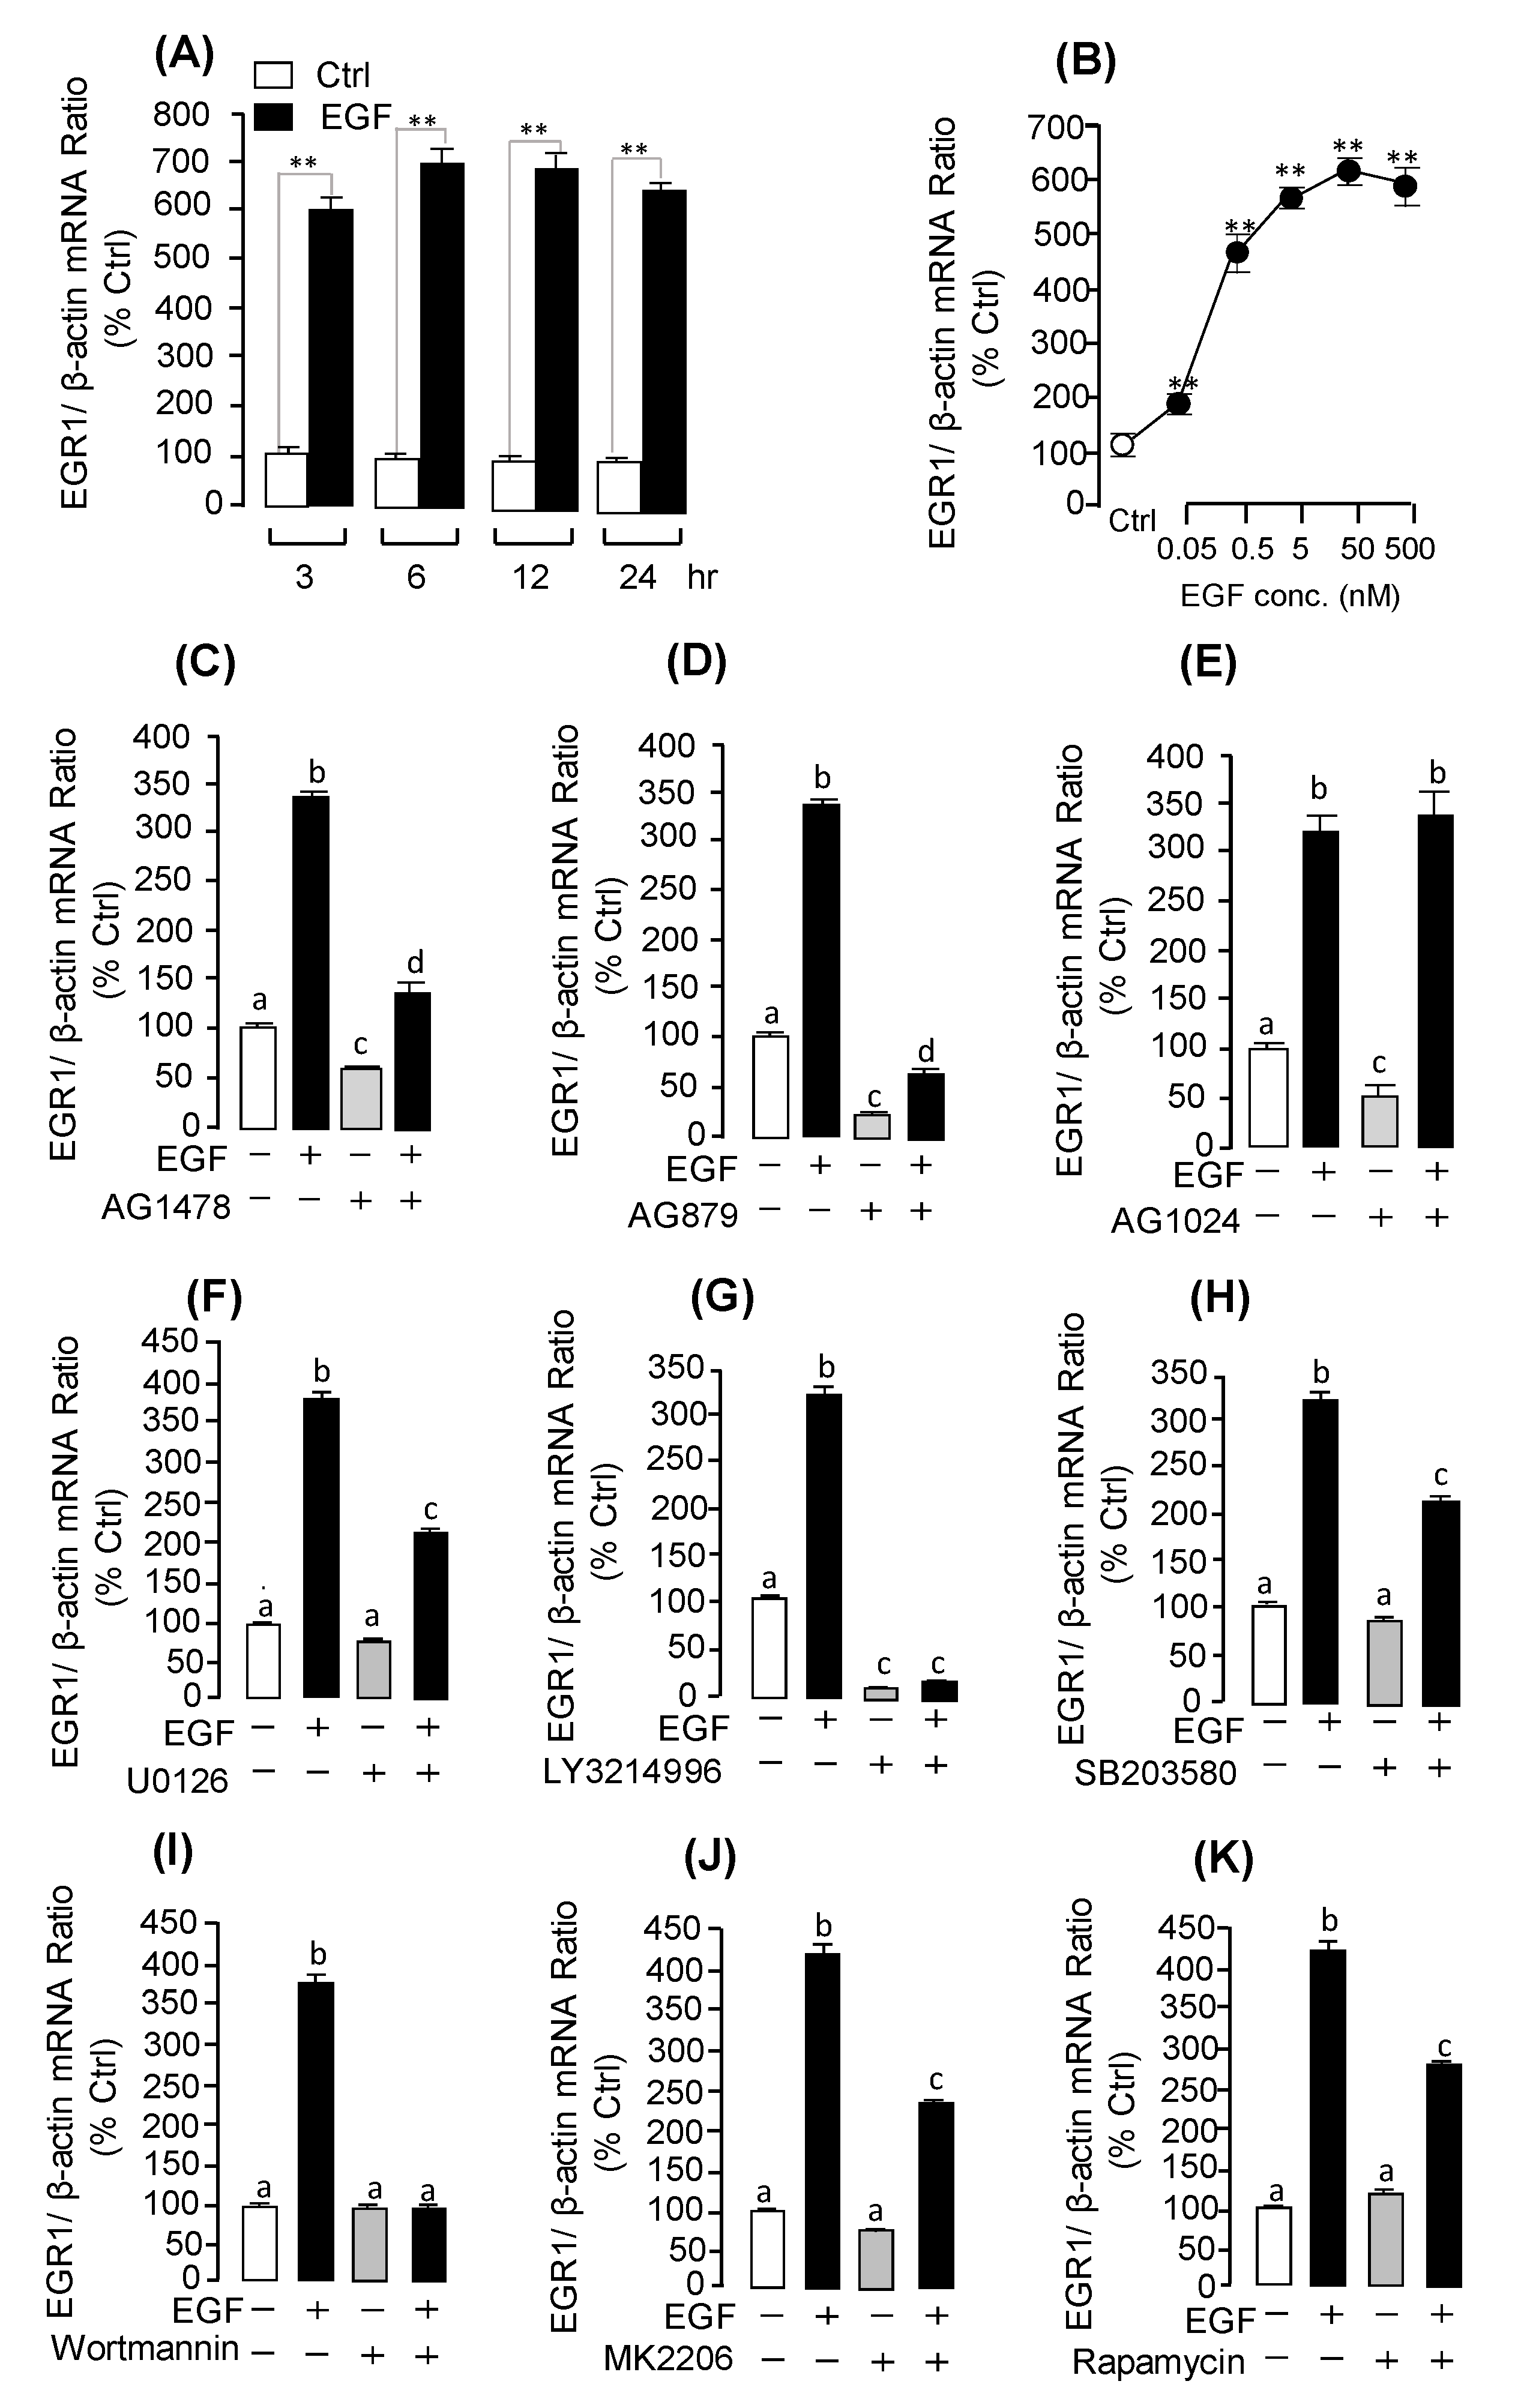
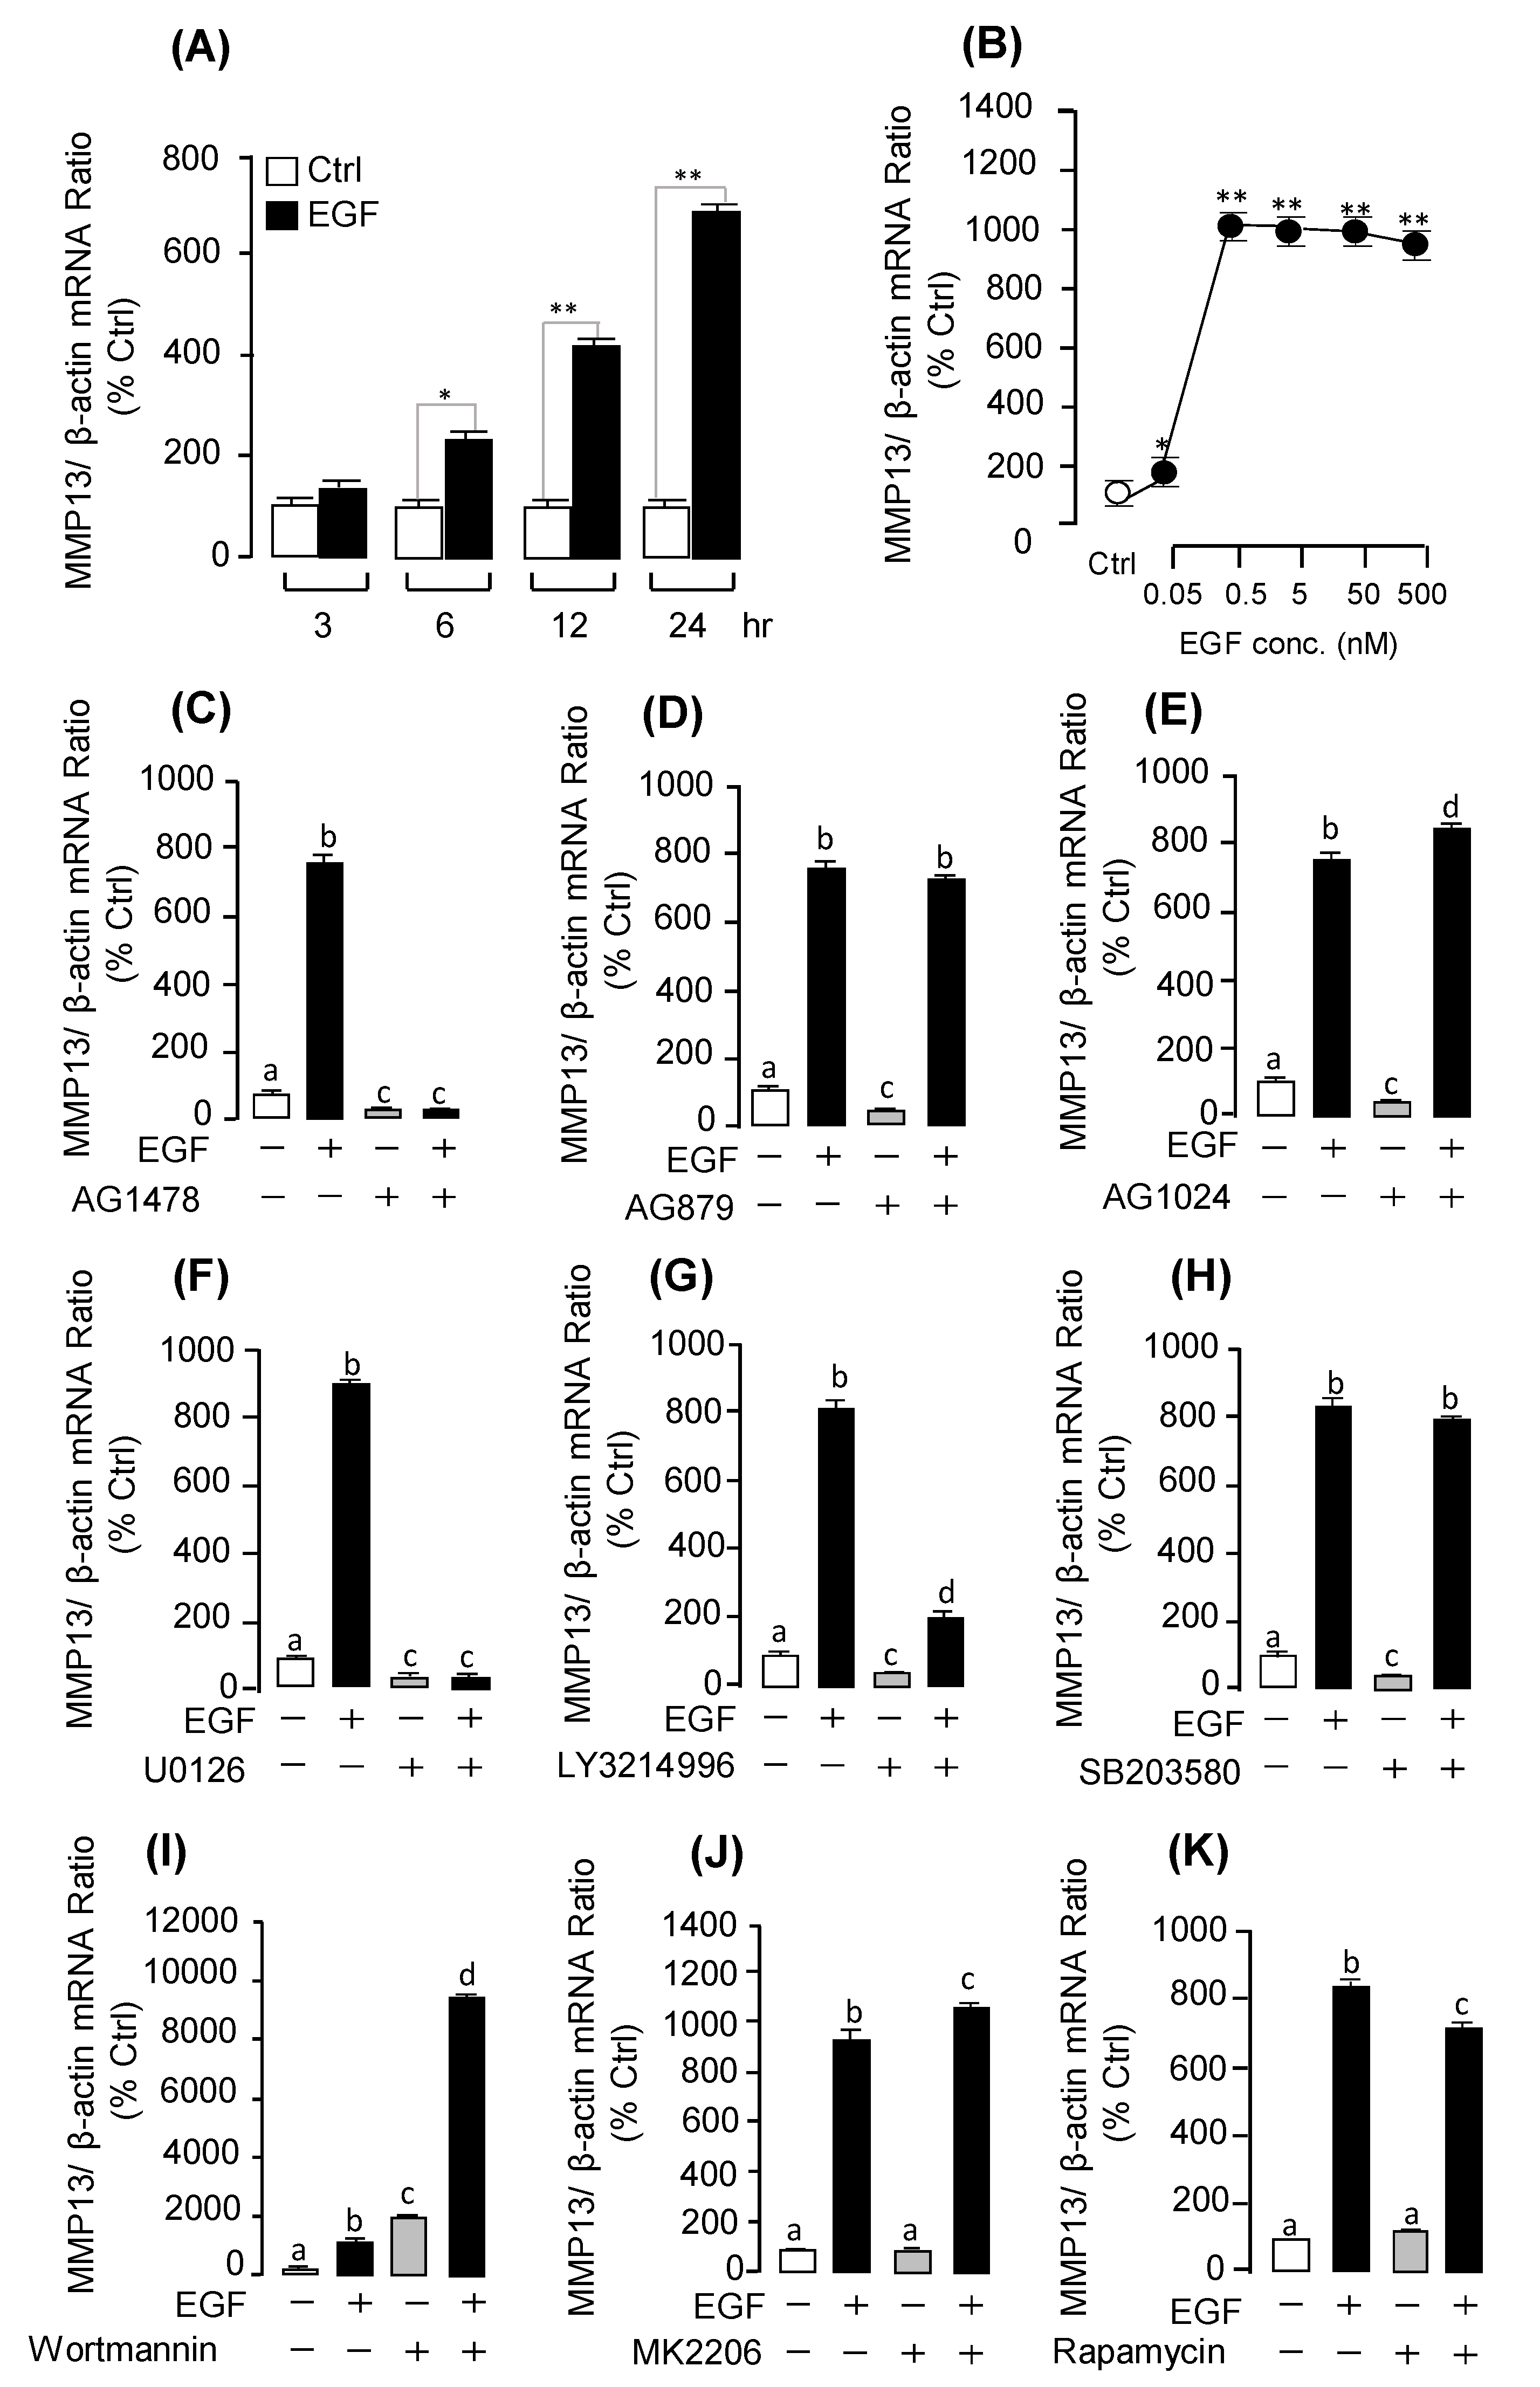
Among the DEGs identified by RNA-Seq analysis, we focused on three up-regulated DEGs: MMP13, EGR1, and UTS1. To further confirm these DEGs, we incubated the grass carp pituitary cells with EGF to detect their mRNA expression by real-time PCR. The results showed that EGF could significantly induce pituitary UTS1 (Figure 3A; Supplementary Figure S1A), EGR1 (Figure 4A; Supplementary Figure S1B), and MMP13 (Figure 5A; Supplementary Figure S1C) mRNA expression in a time-course dependent manner. In the dose-dependent experiment, the results showed that the transcript levels of UTS1 (Figure 3B), EGR1 (Figure 4B), and MMP13 (Figure 5B) were steadily increased with increasing concentrations of EGF (0.5–500 nM).

2.3. Receptor Specificity and Signal Transduction for EGF-Induced UTS1 and EGR1 Gene Expression

In this experiment, a pharmacological approach was recruited to clarify the receptor specificity for EGF-induced UTS1 and EGR1 gene expression. The results showed that the up-regulation of UTS1 and EGR1 mRNA expression was consistently observed in grass carp pituitary cells with EGF treatment for 24 h. These stimulatory effects on UTS1 mRNA expression could be totally abolished by co-treatment with the ErbB1 antagonist AG1478 (Figure 3C; Supplementary Figure S2A) or ErbB2 antagonist AG879 (Figure 3D; Supplementary Figure S2E), while the Insulin-like growth factor I receptor (IGF-IR) antagonist AG1024 was not effective in this regard (Figure 3E). Similarly, the stimulatory effects of EGF on EGR1 mRNA expression could be also blocked by simultaneous incubation with ErbB1 antagonist AG1478 (Figure 3C; Supplementary Figure S2B) or ErbB2 antagonist AG879 (Figure 3D; Supplementary Figure S2F) but not the IGF-IR antagonist AG1024 (Figure 3E).
To further elucidate the post-receptor signaling mechanism involved in the up-regulation of UTS1 and EGR1 mRNA expression by EGF, various pharmacological inhibitors targeting different signaling pathways were recruited. As a first step, cotreatment with the MEK1/2 inhibitor U0126, ERK1/2 inhibitor LY3214996, or p38MAPK inhibitor SB203580 could all block the stimulatory effects of EGF on UTS1 (Figure 3F,G,H; Supplementary Figure S3A) and EGR1 (Figure 4F,G,H; Supplementary Figure S3C) mRNA expression. In the parallel experiments, EGF-induced UTS1 and EGR1 expression were also tested with the inhibitors for individual components of the PI3K/AKT/mTOR pathway. In this case, EGF-induced UTS1 (Figure 3I,J,K; Supplementary Figure S3B) and EGR1 (Figure 4I,J,K; Supplementary Figure S3D) mRNA expression could be suppressed/totally abolished by co-treatment with the PI3K inhibitor Wortmannin, AKT inhibitor MK2206, or mTOR inhibitor Rapamycin.

2.4. Receptor Specificity and Signal Transduction for EGF-Induced MMP13 mRNA Expression

To clarify the receptor specificity and signal transduction for EGF-induced MMP13 mRNA expression, a pharmacological approach was used. As shown in Figure 5, the stimulatory effects of EGF on MMP13 could be blocked by simultaneous incubation with ErbB1 antagonist AG1478 (Figure 5C; Supplementary Figure S2C), but not ErbB2 antagonist AG879 (Figure 5D; Supplementary Figure S2G) and the IGF-IR antagonist AG1024 (Figure 5E). With the use of pharmacological blockers targeting different signaling pathways, the signal transduction mechanisms for the up-regulation of MMP13 mRNA expression were examined. The stimulatory effects of EGF on MMP13 mRNA expression were notably dispelled by simultaneous incubation with the MEK1/2 inhibitor U0126 (Figure 5F; Supplementary Figure S3E), or ERK inhibitor LY3214996 (Figure 5G), but not with the PI3K inhibitor Wortmannin (Figure 5I; Supplementary Figure S3F), AKT inhibitor MK2206 (Figure 5J), or mTOR inhibitor Rapamycin (Figure 5K). To further confirm whether MEK/ERK cascades were involved in EGF-induced post-receptor signaling, the effects of EGF and EGFR inhibitor AG1478 treatment on ERK phosphorylation were tested in grass carp pituitary cells. As shown in Supplemental Figure S4, EGF could significantly induce the phosphorylation of ERK in grass carp pituitary cells. In addition, EGFR inhibitor AG1478 could significantly block EGF-induced ERK phosphorylation.

2.5. Functional Role of MMP13 in EGF-Induced UTS1 and EGR1

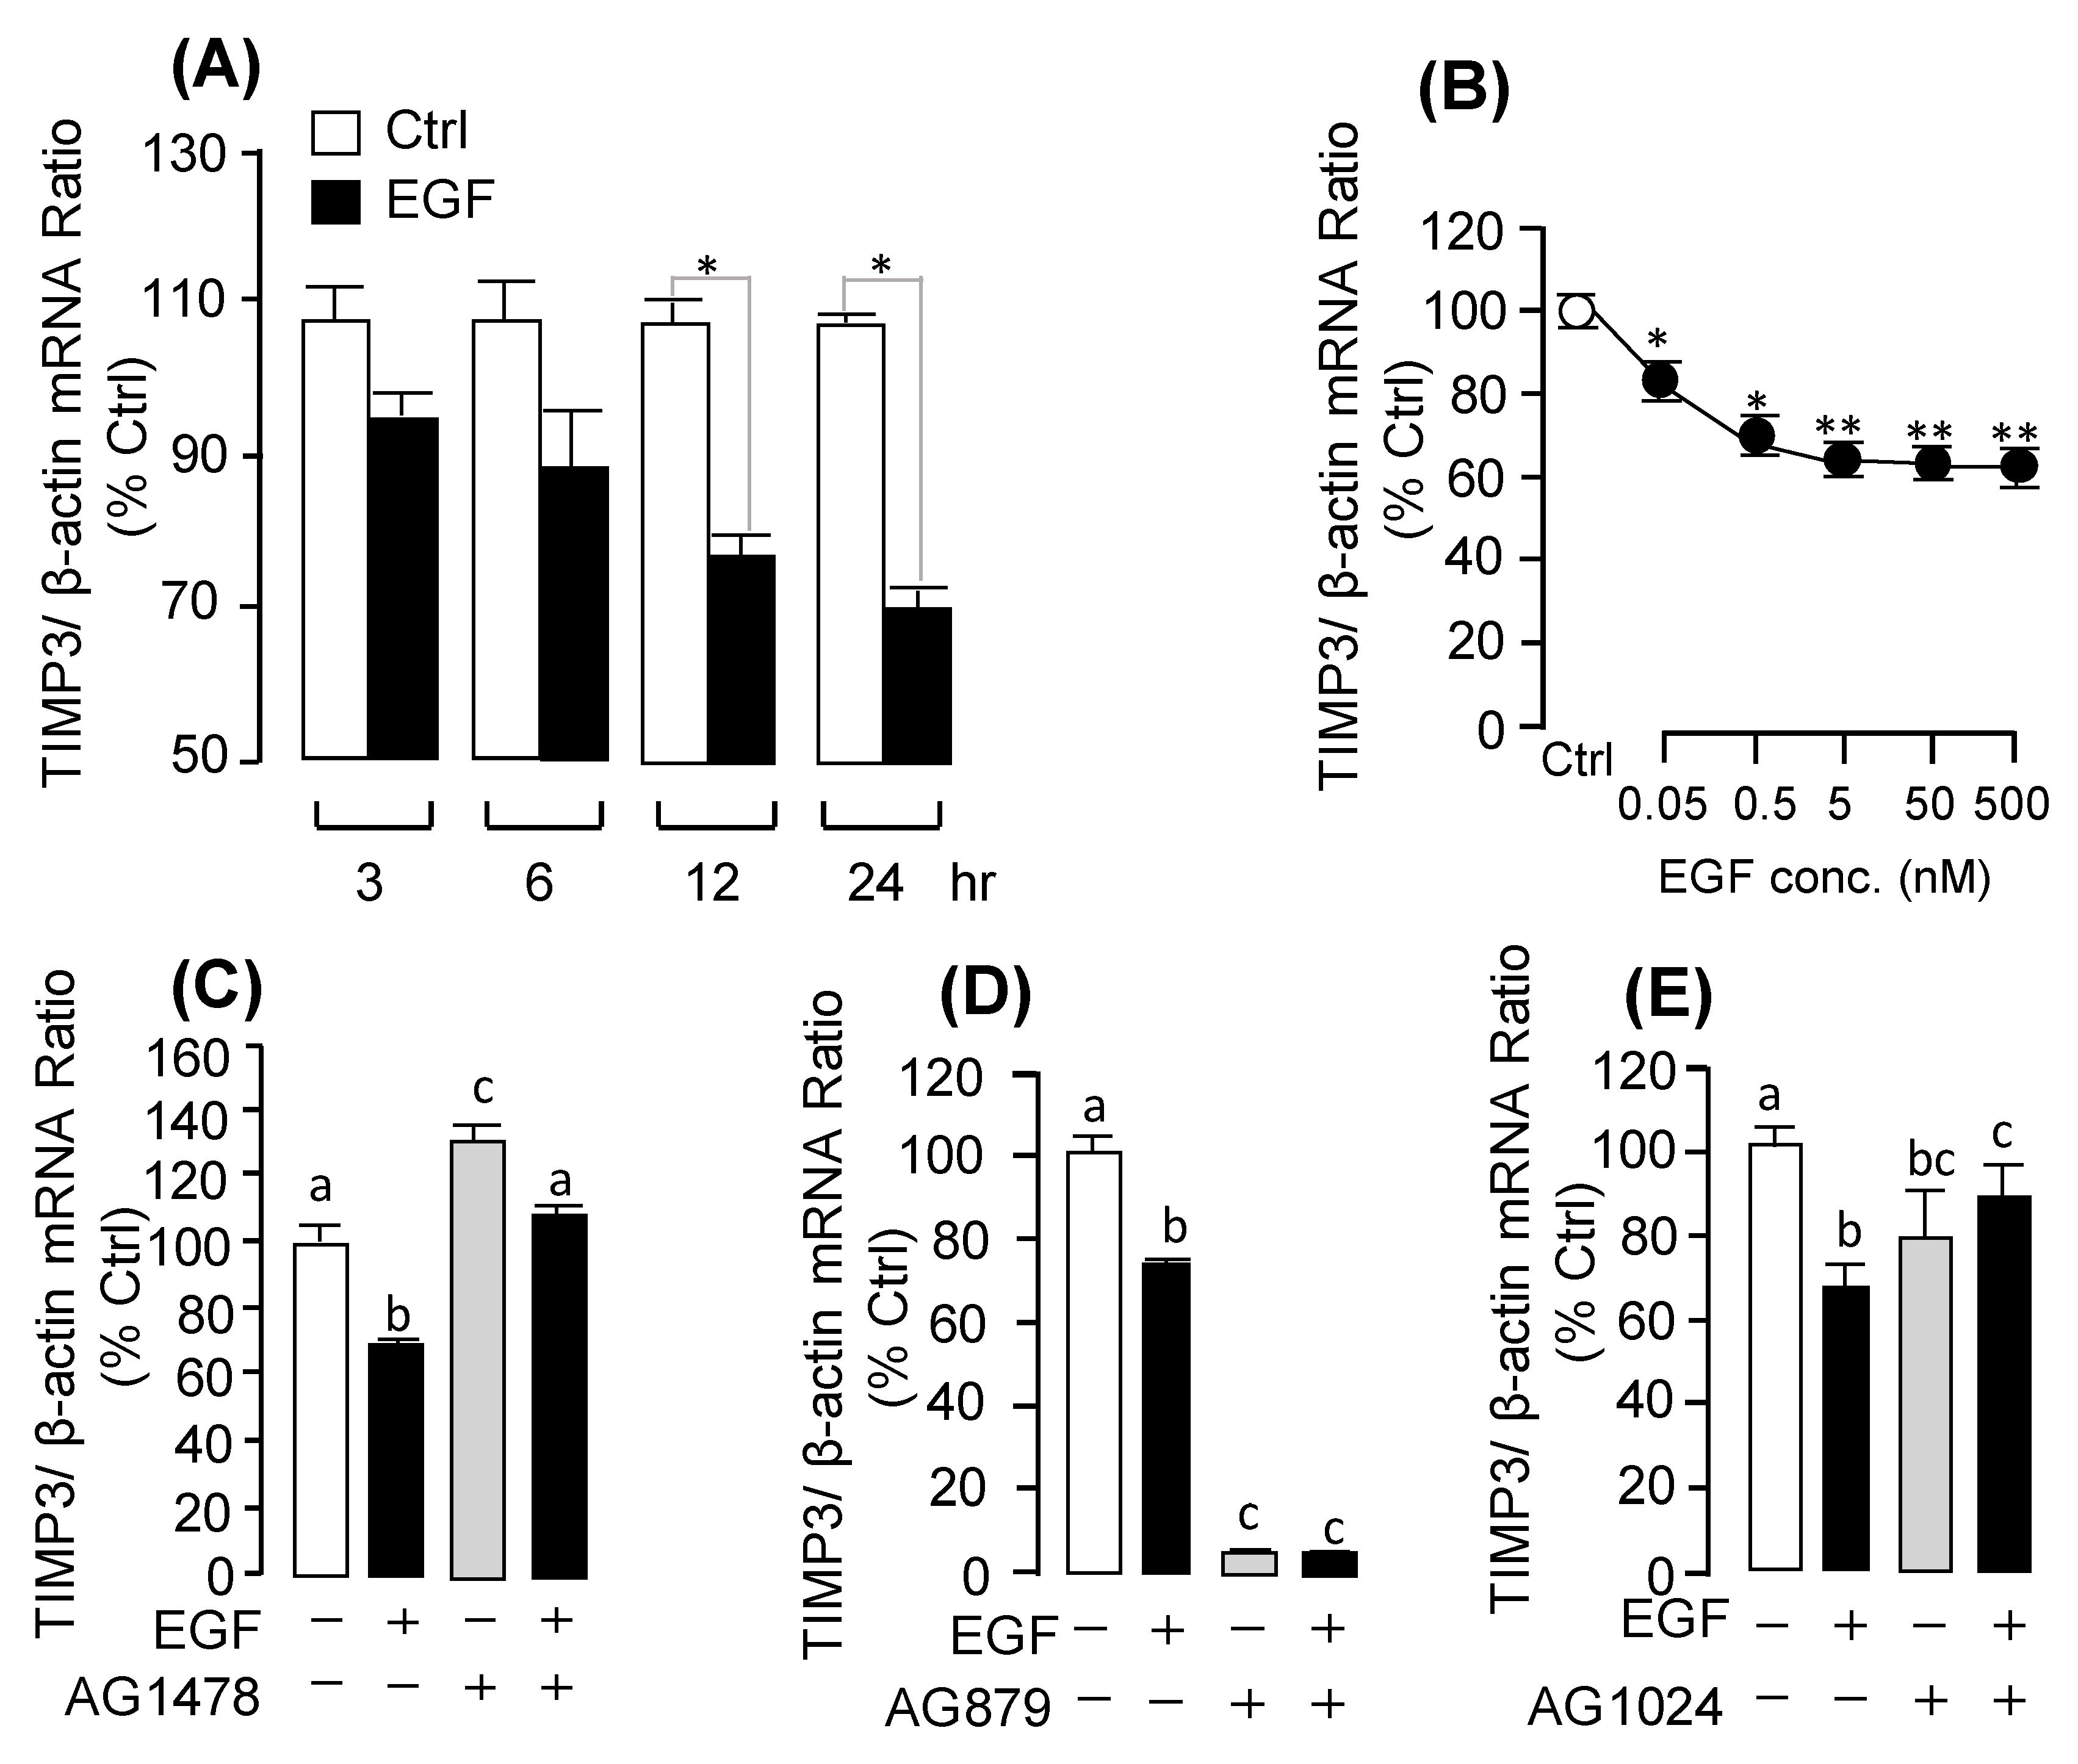
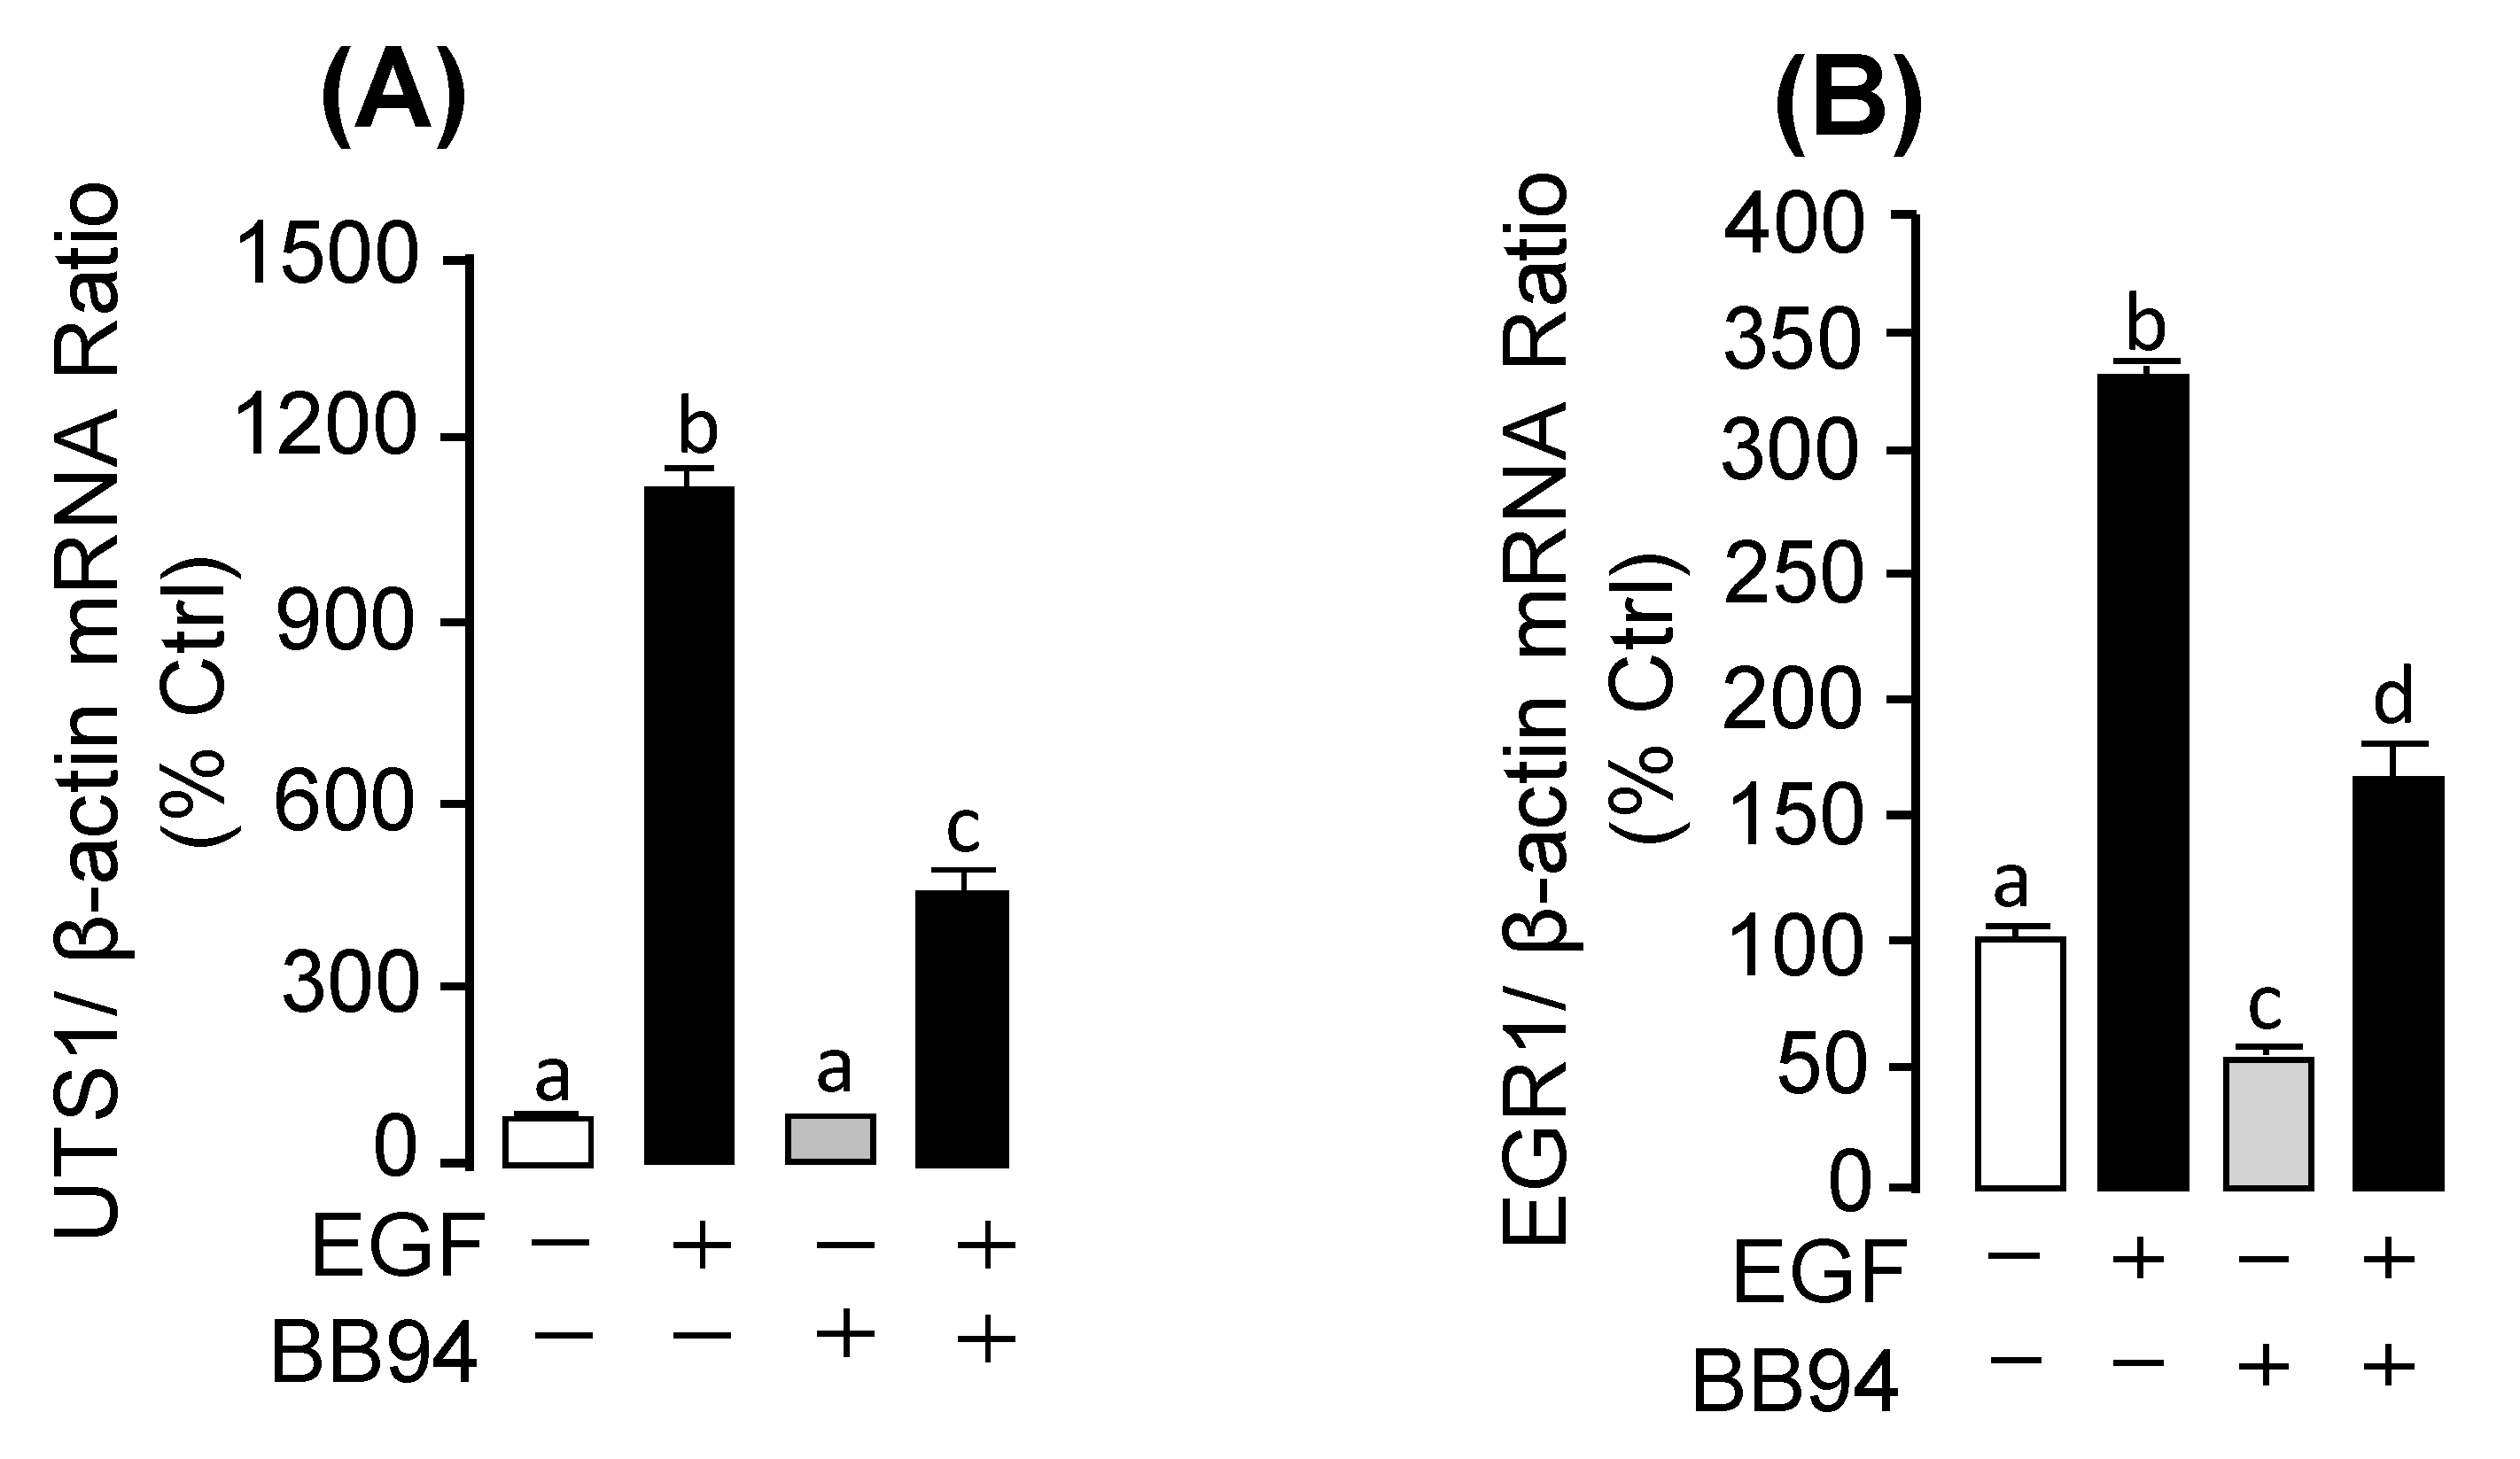
Previous studies have reported that TIMP3 is the endogenous inhibitor for MMP13. Interestingly, our present study found that EGF could inhibit the pituitary TIMP3 mRNA expression in a time-course (Figure 6A; Supplementary Figure S1D) and dose-dependent manner (Figure 6B). For the receptor specificity, the EGF-inhibited TIMP3 mRNA expression could be recovered by co-treatment with ErbB1 antagonist AG1478 (Figure 6C), but not with the ErbB2 antagonist AG879 (Figure 6D) or IGF-IR antagonist AG1024 (Figure 6E). Furthermore, the EGF-induced UTS1 or EGR1 mRNA expression could be abolished by co-treatment with MMP inhibitor BB94 (Figure 7A,B).

3. Discussion

Previous studies have reported that EGF could play an important role in mammalian pituitary [14]. However, little is known about the pituitary actions of EGF in lower vertebrate. Grass carp (Ctenopharyngodon idellus) is the most important aquaculture species in China, with a total production of 5.50 million tonnes in 2018 [15]. As we know, the pituitary is the crucial organ for the regulation of reproduction and growth in teleost, so it will be important to clear the pituitary actions of EGF in teleost. Using grass carp as a model, transcriptomic analysis showed that EGF could induce 195 genes and inhibit 404 genes. These DEGs were involved in cell migration, cell differentiation, signal transduction, metabolic process, phosphorylation, and transcriptional regulation. Similarly, in mammals, previous studies have also reported that EGF could regulate several pituitary functions, including cell proliferation, cell migration [7], and gland tumorigenesis [16].
CRH plays an important role in the HPA system in regulating stress physiology [17]. UTS1 was firstly isolated and purified from white sucker and common carp [18]. Further studies found that fish UTS1 had a closed structural and biological homology with ovine CRH and the frog skin peptide sauvagine [19]. In addition, the UTS1 could also induce ACTH release in mammalian and fish pituitary [20]. Previous studies have found that EGF could induce hypothalamic CRH release [5]. In the present study, we found that EGF could directly induce UTS1 mRNA expression in grass carp pituitary cells. These results suggest that EGF could also be involved in stress physiology mediated by UTS1 in grass carp pituitary. In addition, our present study also found that EGF could induce EGR1 mRNA expression in grass carp pituitary cells. EGR1 is a member of the immediate early gene family of transcription factors, which could regulate a wide variety of transcripts [21]. EGR1 could also be stimulated by many environmental signals, including growth factors [22]. A previous study reported that EGF-induced EGR1 expression could be involved in the down-regulation of matrix metallopeptidase 9 (MMP9) expression in lymphoma cells [23]. These results suggest that EGF could induce EGR1 expression to regulate several physiological functions in teleost pituitary.
MMP13, also called collagenase 3, is a member of the matrix metalloproteinase (MMPs) family, which is involved in embryonic development, reproduction, tissue remodeling, as well as disease processes [24,25,26]. In the present study, we found that EGF could induce pituitary MMP13 mRNA expression, but reduce TIMP3 mRNA expression in grass carp pituitary cells. TIMP3 is a member of tissue inhibitor of metalloproteinases (TIMP) gene family, which are the endogenous protein inhibitors of the MMPs family [27]. These results suggest that EGF could not only directly induce pituitary MMP13 mRNA expression, but could further enhance MMP13 expression via reducing its endogenous inhibitor TIMP3 expression in grass carp pituitary. In addition, previous studies reported that the activated MMPs could release EGF from heparin-bound EGF (HB-EGF) [28]. Interestingly, our present study found that BB94, which was the inhibitor of MMPs, could partially suppress EGF-induced EGR1 and UTS1 mRNA expression in grass carp pituitary cells. Based on these results, it is reasonable for us to speculate that EGF-induced MMP13 mRNA expression might be involved in the up-regulation of UTS1 and EGR1 mRNA expression by EGF in grass carp pituitary cells.
EGF receptors are transmembrane glycoprotein receptors containing an extracellular ligand-binding domain and an intracellular tyrosine kinase domain [29]. A previous study demonstrated that ErbB1 and ErbB2 have both been abundantly detected in normal pituitary corticotroph cells [30], but ErbB3 and ErbB4 were hardly detected in normal or tumoral corticotrophs [5]. Similarly, our previous study also found that both ErbB1 and ErbB2 were abundantly expressed in grass carp pituitary, but ErbB3 and ErbB4 were hardly detected in the pituitary [13]. In the present study, we found that EGF could induce UTS1 and EGR1 mRNA expression via the activation of both ErbB1 and ErbB2 in grass carp pituitary cells. Interestingly, EGF-regulated MMP13 and TIMP3 mRNA expression could only be mediated by ErbB1, but not ErbB2. Previous studies reported that ErbB1 could be activated by binding to growth factors of the EGF family [31]. However, ErbB2 has no ligand, it could bind with other activated ErbB receptors (ErbB1 or ErbB3) to form the highly active heterodimer [32,33]. Besides, the ErbB2 receptor could be activated by a ligand-independent mechanism, such as it could undergo the pH-dependent autophosphorylation [34]. These results suggest that EGF-induced pituitary UTS1 and EGR1 mRNA expression might be mediated by ErbB1/ErbB2 heterodimers, but EGF-regulated MMP13 and TIMP3 mRNA expression should be mediated by ErbB1 homodimers in teleost pituitary. For the post-receptor signaling pathway, our results found that EGF-induced UTS1 and EGR1 mRNA expression were coupled with the PI3K/AKT/mTOR and MEK1/2/ERK1/2 pathways. However, EGF-induced MMP13 mRNA expression was only mediated by the MEK1/2/ERK1/2 pathway, but not PI3K/AKT/mTOR pathway. Similarly, a previous study also reported that only the MEK1/2/ERK1/2 pathway was involved in EGF-induced MMP13 mRNA expression in gastric cancer cells [35]. These results, taken together, suggest that MEK1/2/ERK1/2 should be the critical signal transduction pathway in the up-regulation of MMP13 by EGF. Recently, MMP13 has emerged as a key target for the treatment of tumors [36]. These findings raise the possibility that MEK1/2 and ERK1/2 should be the critical signal transduction factors in EGF-induced tumors. In addition, it is confusing that the PI3K inhibitor Wortmannin could hugely induce MMP13 mRNA expression in grass carp pituitary cells. We speculated that some factors in the pituitary could inhibit MMP13 mRNA expression via the PI3K pathway, so the Wortmannin could induce pituitary MMP13 expression through blocking these inhibitory actions.
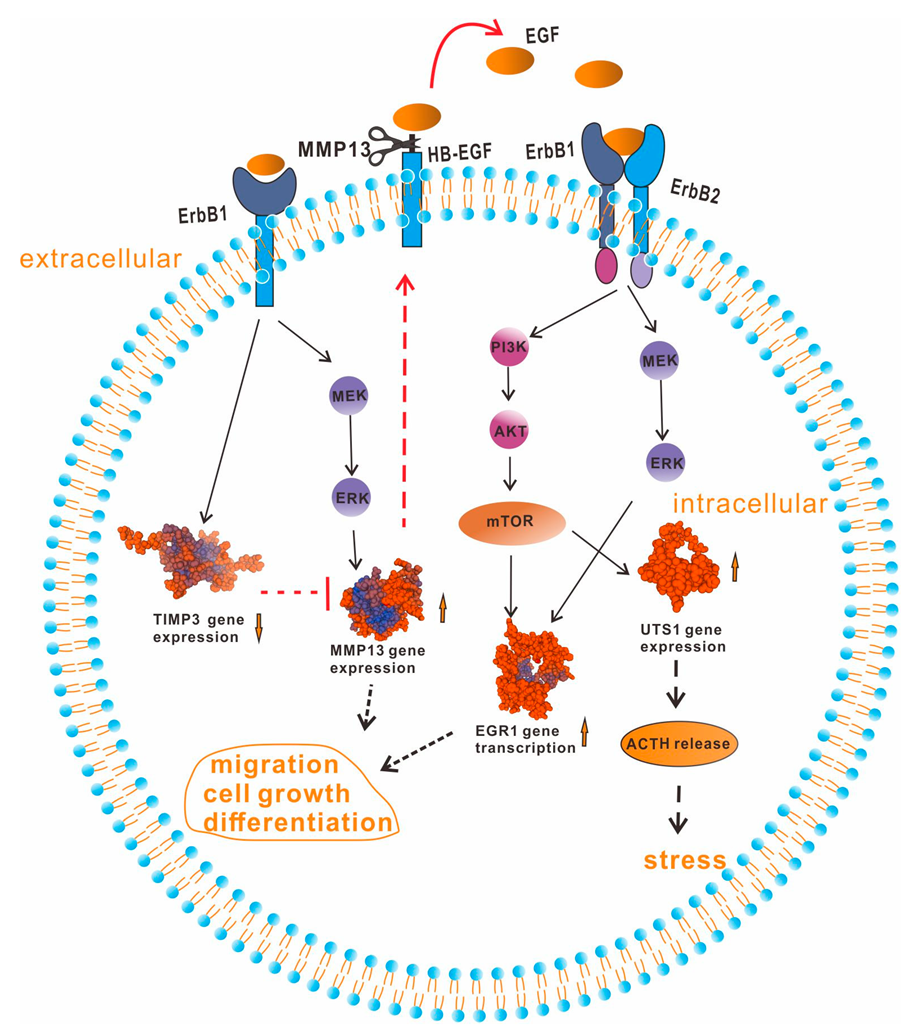
In summary, our present study tried to examine the global pituitary actions of EGF in grass carp pituitary cells. Based on the transcriptomic analysis, EGF could significantly regulate 599 DEGs, which were involved in cell migration, cell differentiation, signal transduction, metabolic process, and phosphorylation. Then, we focused on three critical EGF-induced DEGs, namely UTS1, EGR1, and MMP13. Firstly, we found that EGF could significantly induce UTS1 and EGR1 mRNA expression via the activation of both ErbB1 and ErbB2 in grass carp pituitary cells. However, EGF-regulated MMP13 and TIMP3 mRNA expression were only mediated by ErbB1. The stimulatory actions of UTS1 and EGR1 mRNA expression were mediated by the PI3K/AKT/mTOR and MEK1/2/ERK1/2 pathways (Figure 8). The signaling mechanisms for MMP13 responses were also similar, except that PI3K/AKT/mTOR was not involved. As we know, MMP13 could release EGF from HB-EGF. In addition, our results found that the MMPs inhibitor BB94 could suppress EGF-induced EGR1 and UTS1 mRNA expression in grass carp pituitary cells. These results, taken together, suggest that EGF-induced MMP13 mRNA expression might be involved in the up-regulation of UTS1 and EGR1 mRNA expression by EGF in grass carp pituitary cells (Figure 8).

4. Materials and Methods

4.1. Animals and Chemicals

One-year-old grass carps (1+) (Ctenopharyngodon idellus) with a body weight (BW) of 1.0–1.5 kg were bought from local markets and kept in the aquaria at 20 ± 2 °C for seven days and without feeding for at least three days prior to use in the experiment. To prepare the pituitary cells, grass carps were anesthetized in well-aerated water containing 0.05% MS-222 (Sigma, St. Louis, MO, USA) according to the protocol approved by the committee for animal use at Huazhong Agricultural University (Ethical Approval No. HBAC20091138; Date: 15 November 2009). Human EGF was purchased from GenScript Corporation (Nanjing, China) and dissolved in double-distilled deionized water and stored as 0.1 mM stocks in small aliquots at −80 °C. The pharmacological agents for receptor specificity and signal pathways (listed in Supplemental Table S1) were prepared as 10 mM frozen stocks in small aliquots and diluted with pre-warmed culture medium to appropriate concentrations 15 min prior to drug treatment.

4.2. Cell Culture, RNA Extraction and cDNA Library Construction

The grass carp pituitaries were rinsed three times with Hanks Balanced Salt Solution (HBSS; 400 mg KCl, 600 mg KH2PO4, 350 mg NaHCO2, 8 g NaCl, 48 mg Na2HPO4, and 1 g D-Glucose in 1 L ddH2O), and dispersed by trypsin/DNase II digestion method [37]. Then, grass carp pituitary cells were seeded in 24-well culture plates at a density of 2.5 × 10⁶ cells/well/mL at 28 °C under 5% CO2 for 15~18 h in plating medium. After that, the pituitary cells were incubated with EGF dissolved in testing medium for 24 h. Total RNA were harvested from the plate by adding 500 μL of Trizol reagent (Invitrogen, Carlsbad, CA, USA) to each well and shaking the plate for 10 min at 160~170 rpm on the shaker. The RNA was treated with DNase I to remove contaminating genomic DNA. The concentration and sample purity of total RNA were estimated using a Nanodrop 2000 spectrophotometer, and the quality of RNA was analyzed on an Agilent 2100 Bioanalyzer using the RNA 6000 Nano kit (Agilent Technologies, Santa Clara, CA, USA). Then, the RNA (RIN > 8.0) samples were sent to Majorbio Genome Center (Shanghai, China) for library preparation by TruSeq™ RNA sample prep Kit (Illumina, San Diego, CA, USA) and sequencing on HiSeq4000 (Illumina). A read depth of 600 million 150-bp single end reads was selected. An average of ~90% of the reads mapped to the grass carp genome (http://bioinfo.ihb.ac.cn/gcgd). All raw-sequence read data were deposited in NCBI Sequence Read Archive (SRA)2 with accession number SRP148383.

4.3. Differential Expression Genes (DEGs) Analysis and Functional Enrichment

Clean data could be obtained by removing read operations containing adapters, poly-N, and low-quality reads from the raw data. High-quality clean reads were mapped to the grass carp genome using TopHat v2.0 (http://ccb.jhu.edu/software/tophat/index.shtml). In different samples, gene expression levels were estimated by the number of fragments per kilobase transcript (FPKM). The read counts were further normalized into FPKM values. The fold changes were calculated by using RSEM software v 1.2.7 [38] and the DEGs were analyzed by using the R Bioconductor package, edgeR which calculated assuming a negative binomial distribution for the transcript level. The p-value was used to set the threshold for the differential gene expression test. The threshold of the p-value in multiple tests was determined by the value for the false discovery rate (FDR) [39]. DEGs were screened with a cut-off conditions of fold change (FC) > 1.5, p < 0.05 and FDR < 0.001. Functional annotation of gene ontology (GO) terms was analyzed by using Blast2GO software (https://www.blast2go.com/) [40], and GO functional classification of unigenes were analyzed by using WEGO 2.0 software (http://wego.genomics.org.cn/) [41]. Functional enrichment analysis, including GO and KEGG, was performed using Goatools (or KOBAS) software (https://github.com/tanghaibao/GOatools) [42].

4.4. Real-Time Quantitative PCR Validation

Grass carp pituitary cells were seeded in 24-well culture plates at a density of 2.5 million/mL/well and incubated with test substances for the duration as indicated. After drug treatment, the total RNA was isolated from pituitary cells by Trizol reagent (Invitrogen) and reversely transcribed by HifairTM III 1st Strand cDNA Synthesis Kit (gDNA digester plus) (Yeasen Biotech, Shanghai, China). After RNA isolated and reversely transcribed, the ABI 7500 real-time PCR system was used to detect the mRNA transcription of MMP13, UTS1, EGR1, and TIMP3 with specific primers (see Supplementary Table S2 for primer sequences and PCR condition). In these experiments, plasmid DNA containing the gene coding sequence was subjected to gradient dilution as a standard for data calibration. In addition, parallel real-time PCR of β-actin was used as an internal control. The specific methods for dose- and time-dependent experiment, receptor specificity, signal transduction of EGF-induced UTS1, EGR1 and MMP13 mRNA expression could see Supplementary Methods in Supplemental Materials.

4.5. Data Transformation and Statistical Analysis

In this experiment, for real-time PCR of MMP13, UTS1, EGR1, and TIMP3 mRNA, standard curves with dynamic range of 105 and correlation coefficient > 0.95 were used for data calibration with ABI7500 software (Applied Biosystems, USA). MMP13, TIMP3, EGR1, and UTS1 mRNA data were normalized with β-actin transcript level, and then were transformed as a percentage of the mean value in the control group without drug treatment (as “%Ctrl”). In the present study, the eight replicates (expressed as Mean ± SEM) were pooled results from two individual experiments prior to statistical analysis; all data were tested for normality of distribution using the Shapiro–Wilk normality test. One-way ANOVA and two-way ANOVA were used to test the significant difference according to different experiments. The differences between groups were considered as significant at p < 0.05 (“*”) or highly significant at p < 0.01 (“**”). The groups denoted by different letters represent a significant difference at p < 0.05.

Supplementary Materials

Supplementary materials can be found at https://www.mdpi.com/1422-0067/20/20/5172/s1.

Author Contributions

Data curation, Q.H.; Formal analysis, C.Y.; Funding acquisition, G.H.; Methodology, Q.H., S.X. and L.Z.; Resources, L.Z.; Software, S.X., C.Y. and J.J.; Supervision, G.H.; Writing—original draft, Q.H.; Writing—review and editing, G.H.

Funding

Funding support was provided by NSFC Grant (31602130) and the Fundamental Research Funds for the Central University (2662019PY006). The project was also supported by Natural Science Foundation of Hubei province to G.H. (ZRMS2017001203).

Acknowledgments

This article is dedicated to Anderson OL Wong (The University of Hong Kong) for his genuine interest in training young scientists in the field of comparative endocrinology.

Conflicts of Interest

The authors declare no conflicts of interest. The funders had no role in the design of the study; in the collection, analyses, or interpretation of data; in the writing of the manuscript, or in the decision to publish the results.

Abbreviations

ACTHadrenocorticotropic hormone
Aktprotein kinase B
CRHhypothalamic corticotropin releasing hormone
DEGsdifferential expression genes
EGFepidermal growth factor
EGFRepidermal growth factor receptor
EGR1early growth response 1
ERKextracellular signal-regulated kinase
FSHfollicle-stimulating hormone
GHgrowth hormone
GOgene ontology
HB-EGFHeparin-binding EGF-like growth factor
HPAhypothalamus-pituitary-adrenal
IGFinsulin-like growth factor
KEGGKyoto Encyclopedia of Genes and Genomes
LHluteinizing hormone
MEKMethyl Ethyl Ketone
MAPKmitogen-activated protein kinase
MMP13matrix metallopeptidase 13
MMP9matrix metallopeptidase 9
mTORmammalian target of rapamycin
PI3Kphosphatidylinositol-3-kinase
PRLprolactin
SLαsomatolactin α
TACR3tachykinin receptor 3
UTS1urotensin 1

References

  1. McGee, E.A. Initial and Cyclic Recruitment of Ovarian Follicles. Endocr. Rev. 2000, 21, 200–214. [Google Scholar] [CrossRef] [PubMed]
  2. Wilson, K.J.; Gilmore, J.L.; Foley, J.; Lemmon, M.A.; Ii, D.J.R. Functional selectivity of egf family peptide growth factors: Implications for cancer. Pharmacol. Ther. 2009, 122, 1–8. [Google Scholar] [CrossRef] [PubMed]
  3. Liu, A.; Flores, C.; Kinkead, T.; Carboni, A.; Menon, M.; Seethalakshmi, L. Effects of Sialoadenectomy and Epidermal Growth Factor on Testicular Function of Sexually Mature Male Mice. J. Urol. 1994, 152, 554–561. [Google Scholar] [CrossRef]
  4. Normanno, N.; De Luca, A.; Bianco, C.; Strizzi, L.; Mancino, M.; Maiello, M.R.; Carotenuto, A.; De Feo, G.; Caponigro, F.; Salomon, D.S. Epidermal growth factor receptor (EGFR) signaling in cancer. Gene 2006, 366, 2–16. [Google Scholar] [CrossRef]
  5. Luger, A.; Calogero, A.E.; Kalogeras, K.; Gallucci, W.T.; Gold, P.W.; Loriaux, D.L.; Chrousos, G.P. Interaction of Epidermal Growth Factor with the Hypothalamic-Pituitary-Adrenal Axis: Potential Physiologic Relevance. J. Clin. Endocrinol. Metab. 1988, 66, 334–337. [Google Scholar] [CrossRef]
  6. Przylipiak, A.; Kiesel, L.; Rabe, T.; Helm, K.; Przylipiak, M.; Runnebaum, B. Epidermal growth factor stimulates luteinizing hormone and arachidonic acid release in rat pituitary cells. Mol. Cell. Endocrinol. 1988, 57, 157–162. [Google Scholar] [CrossRef]
  7. Childs, G.V.; Armstrong, J. Sites of Epidermal Growth Factor Synthesis and Action in the Pituitary: Paracrine and Autocrine Interactions. Clin. Exp. Pharmacol. Physiol. 2001, 28, 249–252. [Google Scholar] [CrossRef]
  8. Radford, H.M.; Panaretto, B.A.; Avenell, J.A.; Turnbull, K.E. Effect of mouse epidermal growth factor on plasma concentrations of FSH, LH and progesterone and on oestrus, ovulation and ovulation rate in Merino ewes. Reproduction 1987, 80, 383–393. [Google Scholar] [CrossRef] [Green Version]
  9. Johnson, L.K.; Baxter, J.D.; Vlodavsky, I.; Gospodarowicz, D. Epidermal growth factor and expression of specific genes: Effects on cultured rat pituitary cells are dissociable from the mitogenic response. Proc. Natl. Acad. Sci. USA 1980, 77, 394–398. [Google Scholar] [CrossRef]
  10. Pang, Y. Epidermal Growth Factor and TGF Promote Zebrafish Oocyte Maturation in Vitro: Potential Role of the Ovarian Activin Regulatory System. Endocrinology 2002, 143, 47–54. [Google Scholar] [CrossRef]
  11. Wang, Y.; Ge, W. Cloning of Epidermal Growth Factor (EGF) and EGF Receptor from the Zebrafish Ovary: Evidence for EGF as a Potential Paracrine Factor from the Oocyte to Regulate Activin/Follistatin System in the Follicle Cells1. Boil. Reprod. 2004, 71, 749–760. [Google Scholar] [CrossRef] [PubMed] [Green Version]
  12. Lin, S.-W.; Ge, W. Differential regulation of gonadotropins (FSH and LH) and growth hormone (GH) by neuroendocrine, endocrine, and paracrine factors in the zebrafish—An in vitro approach. Gen. Comp. Endocrinol. 2009, 160, 183–193. [Google Scholar] [CrossRef] [PubMed]
  13. Qin, X.; Ye, C.; Zhou, X.; Jia, J.; Xu, S.; Hu, Q.; Hu, G. NK3R Mediates the EGF-Induced SLα Secretion and mRNA Expression in Grass Carp Pituitary. Int. J. Mol. Sci. 2019, 20, 91. [Google Scholar] [CrossRef] [PubMed]
  14. Birman, P.; Michard, M.; Li, J.Y.; Peillon, F.; Bression, D. Epidermal Growth Factor-Binding Sites, Present in Normal Human and Rat Pituitaries, Are Absent in Human Pituitary Adenomas. J. Clin. Endocrinol. Metab. 1987, 65, 275–281. [Google Scholar] [CrossRef]
  15. Fisheries Bureau of Agriculture Ministry of China. China Fisheries Yearbook; China Agriculture Press: Beijing, China, 2019.
  16. Minematsu, T.; Miyai, S.; Kajiya, H.; Suzuki, M.; Sanno, N.; Takekoshi, S.; Teramoto, A.; Osamura, R.Y. Recent Progress in Studies of Pituitary Tumor Pathogenesis. Endocrine 2005, 28, 37–42. [Google Scholar] [CrossRef]
  17. Holsboer, F.; Spengler, D.; Heuser, I. The role of corticotropin-releasing hormone in the pathogenesis of Cushing’s disease, anorexia nervosa, alcoholism, affective disorders and dementia. Prog. Brain Res. 1992, 93, 385–417. [Google Scholar]
  18. Horne, B.L.; Lederis, K. Separation of urotensins I and II by density gradient centrifugation. Can. Fed. Biol. Soc. 1973, 16, 105. [Google Scholar]
  19. Lederis, K.; Letter, A.; McMaster, D.; Moore, G.; Schlesinger, D. Complete amino acid sequence of urotensin I, a hypotensive and corticotropin-releasing neuropeptide from Catostomus. Science 1982, 218, 162–165. [Google Scholar] [CrossRef]
  20. Lederis, K.; Letter, A.; McMaster, D.; Ichikawa, T.; MacCannell, K.L.; Kobayashi, Y.; Rivier, J.; Rivier, C.; Vale, W.; Fryer, J. Isolation, analysis of structure, synthesis, and biological actions of urotensin I neuropeptides. Can. J. Biochem. Cell Boil. 1983, 61, 602–614. [Google Scholar] [CrossRef]
  21. Gashler, A. Early growth response protein 1(Egr-1): Prototype of z zinc-finger family of transcription factors. Prog. Nucleic Acid Res. Mol. Biol. 1995, 50, 191–224. [Google Scholar]
  22. Thiel, G.; Cibelli, G. Regulation of life and death by the zinc finger transcription factor Egr-1. J. Cell. Physiol. 2002, 193, 287–292. [Google Scholar] [CrossRef] [PubMed]
  23. Bouchard, F.; Bélanger, S.D.; Biron-Pain, K.; St-Pierre, Y. EGR-1 activation by EGF inhibits MMP-9 expression and lymphoma growth. Blood 2010, 116, 759–766. [Google Scholar] [CrossRef] [PubMed] [Green Version]
  24. Takaishi, H.; Kimura, T.; Dalal, S.; Okada, Y.; D’Armiento, J. Joint diseases and matrix metalloproteinases: A role for MMP-13. Curr. Pharm. Biotechnol. 2008, 9, 47–54. [Google Scholar] [CrossRef] [PubMed]
  25. Vincenti, M.P.; Brinckerhoff, C.E. Transcriptional regulation of collagenase (mmp-1, mmp-13) genes in arthritis: Integration of complex signaling pathways for the recruitment of gene-specific transcription factors. Arthritis Res. 2002, 4, 157–164. [Google Scholar] [CrossRef]
  26. Balbin, M.; Pendas, A.M.; Uría, J.A.; Jiménez, M.G.; Freije, J.P.; Freije, J.M.; López-Otín, C.; Lopez-Otin, C. Expression and regulation of collagenase-3 (MMP-13) in human malignant tumors. APMIS 1999, 107, 45–53. [Google Scholar] [CrossRef]
  27. Murphy, G. Tissue inhibitors of metalloproteinases. Genome Biol. 2012, 12, 233. [Google Scholar] [CrossRef]
  28. Köse, M. GPCRs and EGFR—Cross-talk of membrane receptors in cancer. Bioorganic Med. Chem. Lett. 2017, 27, 3611–3620. [Google Scholar]
  29. Ferguson, K.M.; Berger, M.B.; Mendrola, J.M.; Cho, H.-S.; Leahy, D.J.; Lemmon, M.; Lemmon, M. EGF Activates Its Receptor by Removing Interactions that Autoinhibit Ectodomain Dimerization. Mol. Cell 2003, 11, 507–517. [Google Scholar] [CrossRef]
  30. Cooper, O.; Vlotides, G.; Fukuoka, H.; Greene, M.I.; Melmed, S. Expression and function of ErbB receptors and ligands in the pituitary. Endocr. Relat. Cancer 2011, 18, R197–R211. [Google Scholar] [CrossRef] [Green Version]
  31. Olayioye, M.A.; Neve, R.M.; Lane, H.A.; Hynes, N.E. The ErbB signaling network: Receptor heterodimerization in development and cancer. EMBO J. 2000, 19, 3159–3167. [Google Scholar] [CrossRef]
  32. Cho, H.-S.; Mason, K.; Ramyar, K.X.; Stanley, A.M.; Gabelli, S.B.; Denney, D.W.; Leahy, D.J. Structure of the extracellular region of HER2 alone and in complex with the Herceptin Fab. Nature 2003, 421, 756. [Google Scholar] [CrossRef] [PubMed]
  33. Graus-Porta, D.; Beerli, R.R.; Daly, J.M.; Hynes, N.E. ErbB-2, the preferred heterodimerization partner of all ErbB receptors, is a mediator of lateral signaling. EMBO J. 1997, 16, 1647–1655. [Google Scholar] [CrossRef] [PubMed]
  34. Serova, O.V.; Chachina, N.A.; Gantsova, E.A.; Popova, N.V.; Petrenko, A.G.; Deyev, I.E. Autophosphorylation of Orphan Receptor ERBB2 Can Be Induced by Extracellular Treatment with Mildly Alkaline Media. Int. J. Mol. Sci. 2019, 20, 1515. [Google Scholar] [CrossRef] [PubMed]
  35. Ye, Y.; Zhou, X.; Li, X.; Tang, Y.; Sun, Y.; Fang, J. Inhibition of epidermal growth factor receptor signaling prohibits metastasis of gastric cancer via downregulation of MMP7 and MMP13. Tumor Boil. 2014, 35, 10891–10896. [Google Scholar] [CrossRef] [PubMed]
  36. Meierjohann, S.; Hufnagel, A.; Wende, E.; Kleinschmidt, M.; Wolf, K.; Friedl, P.; Gaubatz, S.; Schartl, M. MMP13 mediates cell cycle progression in melanocytes and melanoma cells: In vitro studies of migration and proliferation. Mol. Cancer 2010, 9, 201. [Google Scholar] [CrossRef] [PubMed]
  37. Wong, A.; Ng, S.; Lee, E.; Leung, R.; Ho, W. Somatostatin Inhibits (d-Arg6, Pro9-NEt) Salmon Gonadotropin-Releasing Hormone- and Dopamine D1-Stimulated Growth Hormone Release from Perifused Pituitary Cells of Chinese Grass Carp,Ctenopharyngodon idellus. Gen. Comp. Endocrinol. 1998, 110, 29–45. [Google Scholar] [CrossRef]
  38. Li, B.; Dewey, C.N. RSEM: Accurate transcript quantification from RNA-Seq data with or without a reference genome. BMC Bioinform. 2011, 12, 323. [Google Scholar] [CrossRef]
  39. Benjamini, Y.; Drai, D.; Elmer, G.; Kafkafi, N.; Golani, I. Controlling the false discovery rate in behavior genetics research. Behav. Brain Res. 2001, 125, 279–284. [Google Scholar] [CrossRef] [Green Version]
  40. Conesa, A.; Götz, S.; García-Gómez, J.M.; Terol, J.; Talón, M.; Robles, M. Blast2GO: A universal tool for annotation, visualization and analysis in functional genomics research. Bioinformatics 2005, 21, 3674–3676. [Google Scholar] [CrossRef]
  41. Ye, J.; Fang, L.; Zheng, H.; Zhang, Y.; Chen, J.; Zhang, Z.; Wang, J.; Li, S.; Li, R.; Bolund, L.; et al. WEGO: A web tool for plotting GO annotations. Nucleic Acids Res. 2006, 34, W293–W297. [Google Scholar] [CrossRef]
  42. Xie, C.; Mao, X.; Huang, J.; Ding, Y.; Wu, J.; Dong, S.; Kong, L.; Gao, G.; Li, C.-Y.; Wei, L. KOBAS 2.0: A web server for annotation and identification of enriched pathways and diseases. Nucleic Acids Res. 2011, 39, W316–W322. [Google Scholar] [CrossRef] [PubMed]
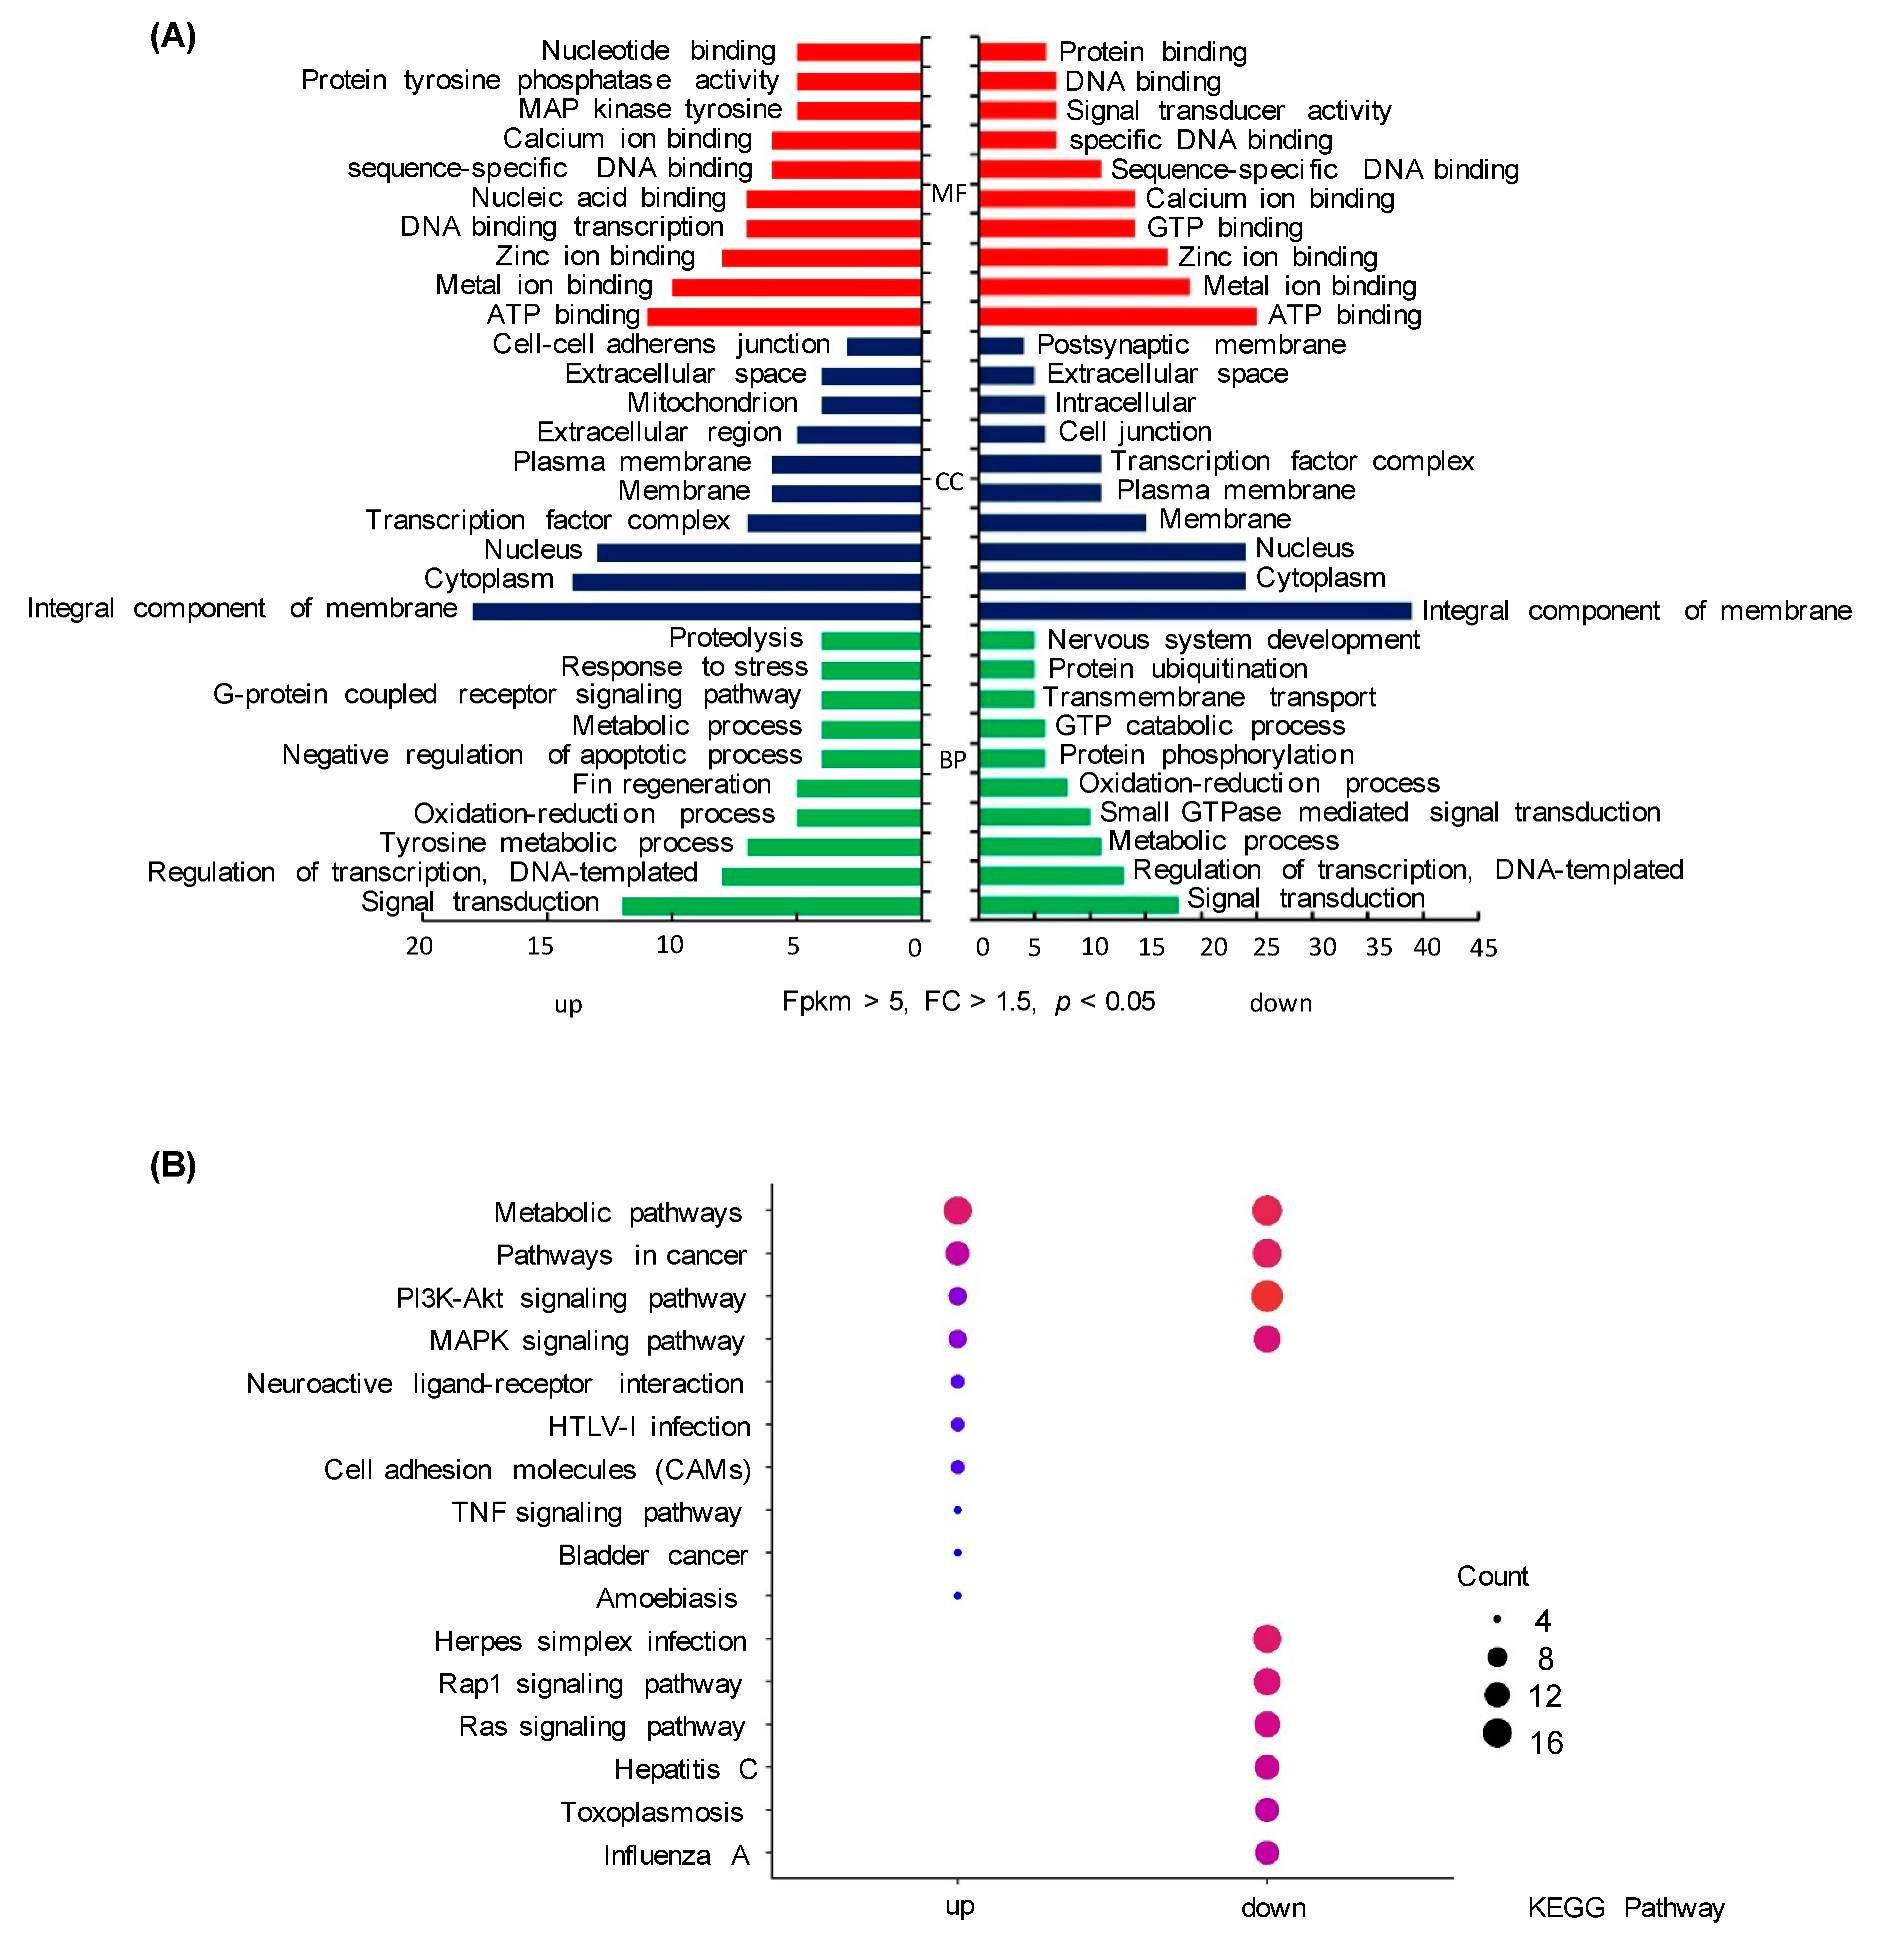
Figure 1. Gene ontology (GO) and Kyoto Encyclopedia of Genes and Genomes (KEGG) analysis. (A) GO classification of the assembled differential expression genes (DEGs) of grass carp pituitary cells into molecular function, biological function, cellular component. (B) KEGG pathway enrichment analysis for DEGs in grass carp pituitary. Statistics of the top 10 enriched pathways for DEGs of up and down regulation. Up, up-regulated genes; down, down-regulated genes; count, the number of DEGs.
Ijms 20 05172 g001
Figure 2. DEGs were enriched in the biological process of cell migration, cell differentiation, signal transduction, metabolic process, phosphorylation, and regulation of transcription in grass carp pituitary cells cultured by EGF treatment. Red indicates that the gene is increased, green indicates the gene is decreased in abundance relative to the control group and grey in the caption indicates the categories of biological process.
Ijms 20 05172 g002
Figure 3. Synergistic effects of EGF on UTS1 mRNA expression and receptor specificity and post-receptor signal pathway of EGF (0.5 μM)-induced UTS1 mRNA expression in grass carp pituitary cells. (A) Time course of EGF (0.5 μM) treatment on UTS1 mRNA expression. (B) Effect of EGF concentration (0.05–500 nM)-induced on UTS1 mRNA expression in grass carp pituitary cells. (CE) Effects of ErbB1 antagonist AG1478, ErbB2 antagonist AG879, and IGF receptor antagonist AG1024 on EGF-induced UTS1 mRNA expression, respectively. (FH) The effects of EGF (0.5 μM) induced UTS1 mRNA transcription with the MEK inhibitor U0126 (10 μM), ERK1/2 inhibitor LY3214996 (10 μM), and p38MAPK inhibitor SB203580, respectively. (IK) Co-treatment with the PI3K inhibitor Wortmannin (10 μM), AKT inhibitor MK2206 (10 μM), and mTOR inhibitor Rapamycin (10 μM) on EGF (0.5 μm)-induced UTS1 mRNA expression for 24 h, respectively. After drug treatment, total RNA was isolated and used for real-time PCR of UTS1 mRNA expression. The differences between groups were considered as significant at p < 0.05 (“*”) or highly significant at p < 0.01 (“**”). The groups denoted by different letters represent a significant difference at p < 0.05.
Ijms 20 05172 g003
Figure 4. EGF induced EGR1 mRNA expression in grass carp pituitary cells, including receptor specificity and signal transduction pathways. (A) In the time course experiment, pituitary cells were treated with EGF (0.5 μM). (B) In the dose experiment, pituitary cells were cultured with EGF (0.05–500 nM). (CE) Receptor specificity of EGF (0.5 µM)-induced EGR1 mRNA expression; effects of ErbB1 antagonist AG1478 (10 µM), ErbB2 antagonist AG879 (10 µM), and IGF receptor antagonist AG1024 (10 µM) on EGR1 mRNA expression for 24 h, respectively. (FH) Signal transduction of EGR1 mRNA expression induced by EGF (0.5 μM) in grass carp pituitary cells. The effects of UTS1 mRNA transcription induced by EGF (0.5 μM) with EGF (0.5 μM) in the presence or absence of the MEK inhibitor U0126 (10 μM), ERK1/2 inhibitor LY3214996 (10 μM), or p38MAPK inhibitor SB203580 (10 μM), respectively. (IK) The effects of EGF (0.5 μM) induced EGR1 mRNA expression with the PI3K inhibitor Wortmannin (10 μM), AKT inhibitor MK2206 (10 μM), or mTOR inhibitor Rapamycin (10 μM) by EGF (0.5 μM)-induced EGR1 mRNA expression for 24 h, respectively. After drug treatment, total RNA was isolated and used for real-time PCR of UTS1 mRNA expression. The differences between groups were considered as highly significant at p < 0.01 (“**”). The groups denoted by different letters represent a significant difference at p < 0.05.
Ijms 20 05172 g004
Figure 5. EGF induced MMP13 mRNA expression and receptor specificity and signal transduction mechanism in grass carp pituitary cells. (A) Pituitary cells were treated with EGF (0.5 μM) in a time dependent manner. (B) dose-dependent manner of EGF (0.05–500 nM) induced MMP13 mRNA expression, respectively. (CE) Effects of ErbB1 antagonist AG1478 (10 µM), ErbB2 antagonist AG879 (10 µM), and IGF receptor antagonist AG1024 (10 µM) on MMP13 mRNA expression for 24 h, respectively. (FH) Signal transduction of EGF-induced MMP13 mRNA expression in grass carp pituitary cells. Co-treatment of 24 h with the MEK blocker U0126 (10 μM), ERK1/2 inhibitor LY3214996 (10 μM), or p38MAPK inhibitor SB203580(10 μM) induced MMP13 mRNA expression was examined in grass carp pituitary cells, respectively. (IK) Co-treatment of 24 h with the PI3K inhibitor Wortmannin (10 μM), AKT inhibitor MK2206 (10 μM), and mTOR inhibitor Rapamycin (10 μM) induced MMP13 mRNA expression was examined, respectively. After drug treatment, total RNA was isolated for real-time PCR of MMP13 mRNA expression. The differences between groups were considered as significant at p < 0.05 (“*”) or highly significant at p < 0.01 (“**”). The groups denoted by different letters represent a significant difference at p < 0.05.
Ijms 20 05172 g005
Figure 6. EGF induced TIMP3 mRNA expression and receptor specificity in grass carp pituitary. (A) Time course of EGF (0.5 μM) treatment on TIMP3 mRNA expression. (B) Effect of EGF concentration (0.05–500 nM)-induced on TIMP3 mRNA expression in grass carp pituitary cells. (CE) Effects of ErbB1 antagonist AG1478 (10 µM), ErbB2 antagonist AG879 (10 µM), and IGF receptor antagonist AG1024 (10 µM) on TIMP3 mRNA expression for 24 h, respectively. After drug treatment, total RNA was isolated for real-time PCR of MMP13 mRNA expression. In the data present (mean ± SEM), the differences between groups were considered as significant at p < 0.05 (“*”) or highly significant at p < 0.01 (“**”). The groups denoted by different letters represent a significant difference at p < 0.05.
Ijms 20 05172 g006
Figure 7. The functional role of in EGF-induced UTS1 and EGR1 in grass carp pituitary. (A) Effect of the inhibitor of MMPs BB94 (10 µM) on UTS1 mRNA expression. (B) Effect of the inhibitor of MMPs BB94 (10 µM) on EGR1 mRNA expression. After drug treatment, total RNA was isolated for real-time PCR of UTS1 and EGR1 mRNA expression. In the data present (mean ± SEM), the differences between groups were considered as significant at p < 0.05 with different letters.
Ijms 20 05172 g007
Figure 8. Working modal of EGF-induced UTS1, EGR1, MMP13, and TIMP3 regulation in grass carp pituitary. EGF induced UTS1 and EGR1 mRNA expression were mediated by the PI3K/AKT/mTOR and MEK1/2/ERK1/2 pathways coupled with both ErbB1 and ErbB2. EGF-induced MMP13 mRNA expression was only through the MEK1/2/ERK1/2 pathway coupled with ErbB1 and inhibited TIMP3 mRNA expression via ErbB1. EGF-induced MMP13 might be involved in the up-regulation of UTS1 and EGR1 mRNA expression by EGF in grass carp pituitary cells. The solid arrows indicated that the actions were verified by our study, the dotted arrows indicated that the actions were verified basing on the references. And the dotted “T” represented the inhibited action basing on the references.
Ijms 20 05172 g008
Table 1. Up-regulated genes by epidermal growth factor (EGF) in grass carp pituitary cells.
GeneFCp-ValueDescriptionMolecular Function
DHX331.811.39 × 10−3DEAH-box helicase 33ATP binding, helicase activity
E2.7.3.22.044.99 × 10−8Creatine kinase M-typeATP binding, kinase activity
DCK1.748.70 × 10−4Deoxycytidine kinaseATP binding, nucleoside kinase activity
MFGE82.111.05 × 10−38Rho GTPase-activating protein 10Calcium ion binding
KCNMA11.73.82 × 10−11Calcium-activated potassium channel subunit alphaCalcium-activated potassium channel activity
SGPP11.855.09 × 10−14Sphingosine-1-phosphate phosphatase 1Catalytic activity
COX6B1.91.39 × 10−5Cytochrome c oxidase subunit 6B1Cytochrome-c oxidase activity
EGR13.752.20 × 10−151Early growth response protein 1DNA binding,metal ion binding
EDNRB1.741.01 × 10−10Endothelin B receptorEndothelin receptor activity
ETV51.77.60 × 10−16ETS translocation variant 5Equence-specific DNA binding
FABP72.939.81 × 10−15Fatty acid-binding protein, brainFatty acid binding,transporter activity
CDH13.536.37 × 10−7Cadherin-1G-protein alpha-subunit binding
RAB372.125.92 × 10−9Ras-related protein Rab-37GTP binding
RRAS21.992.19 × 10−9Ras-related protein R-Ras2GTP binding
ARHGAP101.938.35 × 10−11Rho GTPase-activating protein 10Gtpase activator activity
RGL21.759.95 × 10−28Ral guanine nucleotide dissociation stimulatorGuanyl-nucleotide exchange factor activity
UTS124.997.16 × 10−149Urotensin1Hormone activity
Slα1.832.80 × 10−49SomatolactinHormone activity
PRL1.861.09 × 10−51ProlactinHormone activity
HasA1.797.90 × 10−10Hyaluronan synthase 2Hyaluronan synthase activity
CDKAL11.73.56 × 10−2CDK5 regulatory subunit-associated protein 1-like 1Kdo transferase activity
PDE92.329.56 × 10−59High affinity cGMP-specific 3Metal ion binding
GALNT121.792.06 × 10−19Polypeptide N-acetylgalactosaminyltransferase 12Metal ion binding, transferase activity
MMP13289.60.00Collagenase 3Metalloendopeptidase activity
NTRK32.092.62 × 10−6_Neurotrophin receptor activity
CADM41.869.31 × 10−32Cell adhesion molecule 4Protein binding
STK401.972.60 × 10−27threonine-protein kinase 40Protein serine/threonine kinase activity
Dusp141.826.61 × 10−18Dual specificity protein phosphatase 14 Protein tyrosine phosphatase activity
Dusp22.289.33 × 10−18Dual specificity protein phosphatase 2Protein tyrosine phosphatase activity
Dusp42.464.73 × 10−16Dual specificity protein phosphatase 4Protein tyrosine phosphatase activity
Dusp51.837.81 × 10−6Dual specificity protein phosphatase 5Protein tyrosine phosphatase activity
Dusp72.087.58 × 10−31Dual specificity protein phosphatase 7 Protein tyrosine phosphatase activity
OXSR12.851.93 × 10−14Serine-proteinkinase OSR1Receptor signaling protein kinase activity
CORIN5.224.15 × 10−47Corin, serine peptidaseSerine-type endopeptidase activity
SERPINB2.051.85 × 10−3Leukocyte elastase inhibitorSerine-type endopeptidase inhibitor activity
KRT22.145.43 × 10−17Keratin, type II cytoskeletal 8Structural molecule activity
CPLX3_41.71.02 × 10−4Complexin-3Syntaxin binding
TPMT1.682.34 × 10−3Thiopurine S-methyltransferaseThiopurine S-methyltransferase activity
FOSL12.465.59 × 10−47Fos-related antigen 1Transcription factor activity
BRA, T21.12 × 10−6Brachyury protein homolog ATranscription regulatory region DNA binding
PTPRM1.783.30 × 10−12Receptor-type tyrosine-protein phosphatase muTransmembrane receptor activity
RNF1441.721.73 × 10−10Probable E3 ubiquitin-protein ligase RNF144A-ATubulin-glycine ligase activity
MYD881.683.04 × 10−13Myeloid differentiation primary response protein MyD88Tyrosine kinase activity
AVPR21.946.54 × 10−10Vasopressin V2 receptorVasopressin receptor activity
GALT2.391.18 × 10−3Galactose-1-phosphate uridylyltransferaseZinc ion binding
ZCCHC91.741.44 × 10−2Zinc finger CCHC domain-containing protein 9Zinc ion binding, nucleic acid binding
FC: fold change.
Table 2. Down-regulated genes by EGF in grass carp pituitary cells.
GeneFCp-ValueDescriptionMolecular Function
TER0.55 1.69 × 10⁻⁵Very-long-chain enoyl-CoA reductaseActing on the CH-CH group of donors
ADCY60.49 1.5 × 10⁻²⁰Adenylate cyclase type 6Adenylate cyclase activity
NRIP20.50 8.4×10⁻¹⁵Nuclear receptor-interacting protein 2Aspartic-type endopeptidase activity
SEK0.36 7.2 × 10⁻³⁵Ephrin type-A receptor 3ATP binding
Hsc700.52 1.1 × 10⁻²¹Heat shock cognate 70ATP binding
Hsp700.55 6.03 × 10⁻⁸Heat shock protein70 ATP binding
CDH110.38 2.2 × 10−40Cadherin-11Calcium ion binding
CHP20.51 0.000023Calcineurin B homologous protein 1Calcium ion binding
PH-40.50 6.3 × 10⁻⁹Transmembrane prolyl 4-hydroxylaseCalcium ion binding
E4.2.1.10.53 2.3 × 10⁻¹¹Carbonic anhydrase 2Carbonate dehydratase activity, zinc ion binding
KCNC10.51 4.1 × 10⁻⁸_Delayed rectifier potassium channel activity
RYBP0.58 1.84 × 10⁻¹³RING1 and YY1-binding protein ADNA binding
EIF2AK20.57 1.5 × 10⁻⁶Eukaryotic translation initiation factor 2-alpha kinase 2Double-stranded RNA adenosine deaminase activity
THBS10.56 5.83 × 10⁻²³Thrombospondin-1Extracellular matrix binding
NTSR10.50 7.1 × 10⁻⁸Neurotensin receptor type 1G-protein coupled neurotensin receptor activity
RAB39B0.57 0.00158Ras-related protein Rab-39BGTP binding
REM20.44 6.6 × 10⁻²⁰GTP-binding protein REM 2GTP binding
RND30.56 9.36 × 10⁻⁷Rho-related GTP-binding protein RhoEGTP binding
RIG-I0.57 5.4 × 10⁻⁸Probable ATP-dependent RNA helicase DDX58Helicase activity, nucleic acid binding
CYP4V0.29 6.2 × 10−36Cytochrome P450 4V2Heme binding, iron ion binding
RAC30.42 2 × 10⁻⁷p21-Rac3; Flags: PrecursorHydrolase activity
LPL0.31 2.7×10−55Lipoprotein lipaseLipoprotein lipase activity
GALNT130.46 0.000016Polypeptide GalNAc transferase 13Metal ion binding
DNAJA40.54 1.1 × 10⁻⁷DNA J homolog subfamily A member 4Metal ion binding, heat shock protein binding
GTF3A0.54 2.17 × 10⁻¹⁰General transcription factor IIIAMetal ion binding,nucleic acid binding
PARP7S0.57 2.26 × 10⁻⁶Poly (ADP-ribose) polymerase family, member 12bMetal ion binding
IFT540.58 4.74 × 10⁻⁷TRAF3-interacting protein 1Microtubule binding
TIMP30.58 1.43 × 10⁻¹³Tissue inhibitor of metalloproteinase 3_
ACTC10.52 1.5 × 10⁻¹⁰Actin, alpha cardiac muscle 1Myosin binding
DDX580.54 0.00001DEAD box protein 58Nucleic acid binding
NKTR0.53 4.2 × 10⁻¹⁷NK-tumor recognition proteinPeptidyl-prolyl cis-trans isomerase activity
MOX440.53 2.8 × 10⁻¹⁰CD53 moleculeProtein binding
CCK40.52 1.8 × 10⁻¹³Protein tyrosine kinase 7Protein tyrosine kinase activity
SIAH10.47 1.6 × 10⁻¹¹Siah E3 ubiquitin protein ligase 1Protein-glycine ligase activity
ITGB20.41 1.9 × 10⁻³⁴Integrin beta-2Receptor activity
NOTCH0.53 7.4 × 10⁻¹²Notch 1 extracellular truncationReceptor activity, calcium ion binding
NRP20.36 3.3 × 10−46Neuropilin-2Semaphorin receptor activity
NFKB10.56 0.00635Nuclear factor NF-kappa-B p105 subunitDNA binding transcription factor activity
IAT7E0.57 0.003GalNAc alpha-2,6-sialyltransferase IIISialyltransferase activity
SLC1A30.46 6 × 10−43Excitatory amino acid transporter 1Sodium:dicarboxylate symporter activity
UGT0.47 4.9×10⁻¹⁷UDP-glucuronosyltransferase 1-1Transferase activity
B4GALT30.55 4.51 × 10⁻⁷Beta-1,4-galactosyltransferase 3Transferase activity, transferring glycosyl groups
NTRK20.52 7.5 × 10⁻¹²NT-3 growth factors receptorTransmembrane receptor protein tyrosine kinase activity
SLC16A70.36 7.2 × 10−63Monocarboxylate transporter 2Transmembrane transporter activity
SV20.43 6.1 × 10⁻¹⁷Synaptic vesicle glycoprotein 2BTransmembrane transporter activity
RNF410.33 3.2 × 10⁻³⁰Ligand of Numb protein X 4Ubiquitin-protein transferase activity
SFRP20.43 9.4 × 10⁻³⁰Secreted frizzled-related protein 2Wnt-protein binding
AMZ20.54 0.002Archaemetzincin-2Zinc ion binding