2.1. Analysis of Spectroscopic Effects
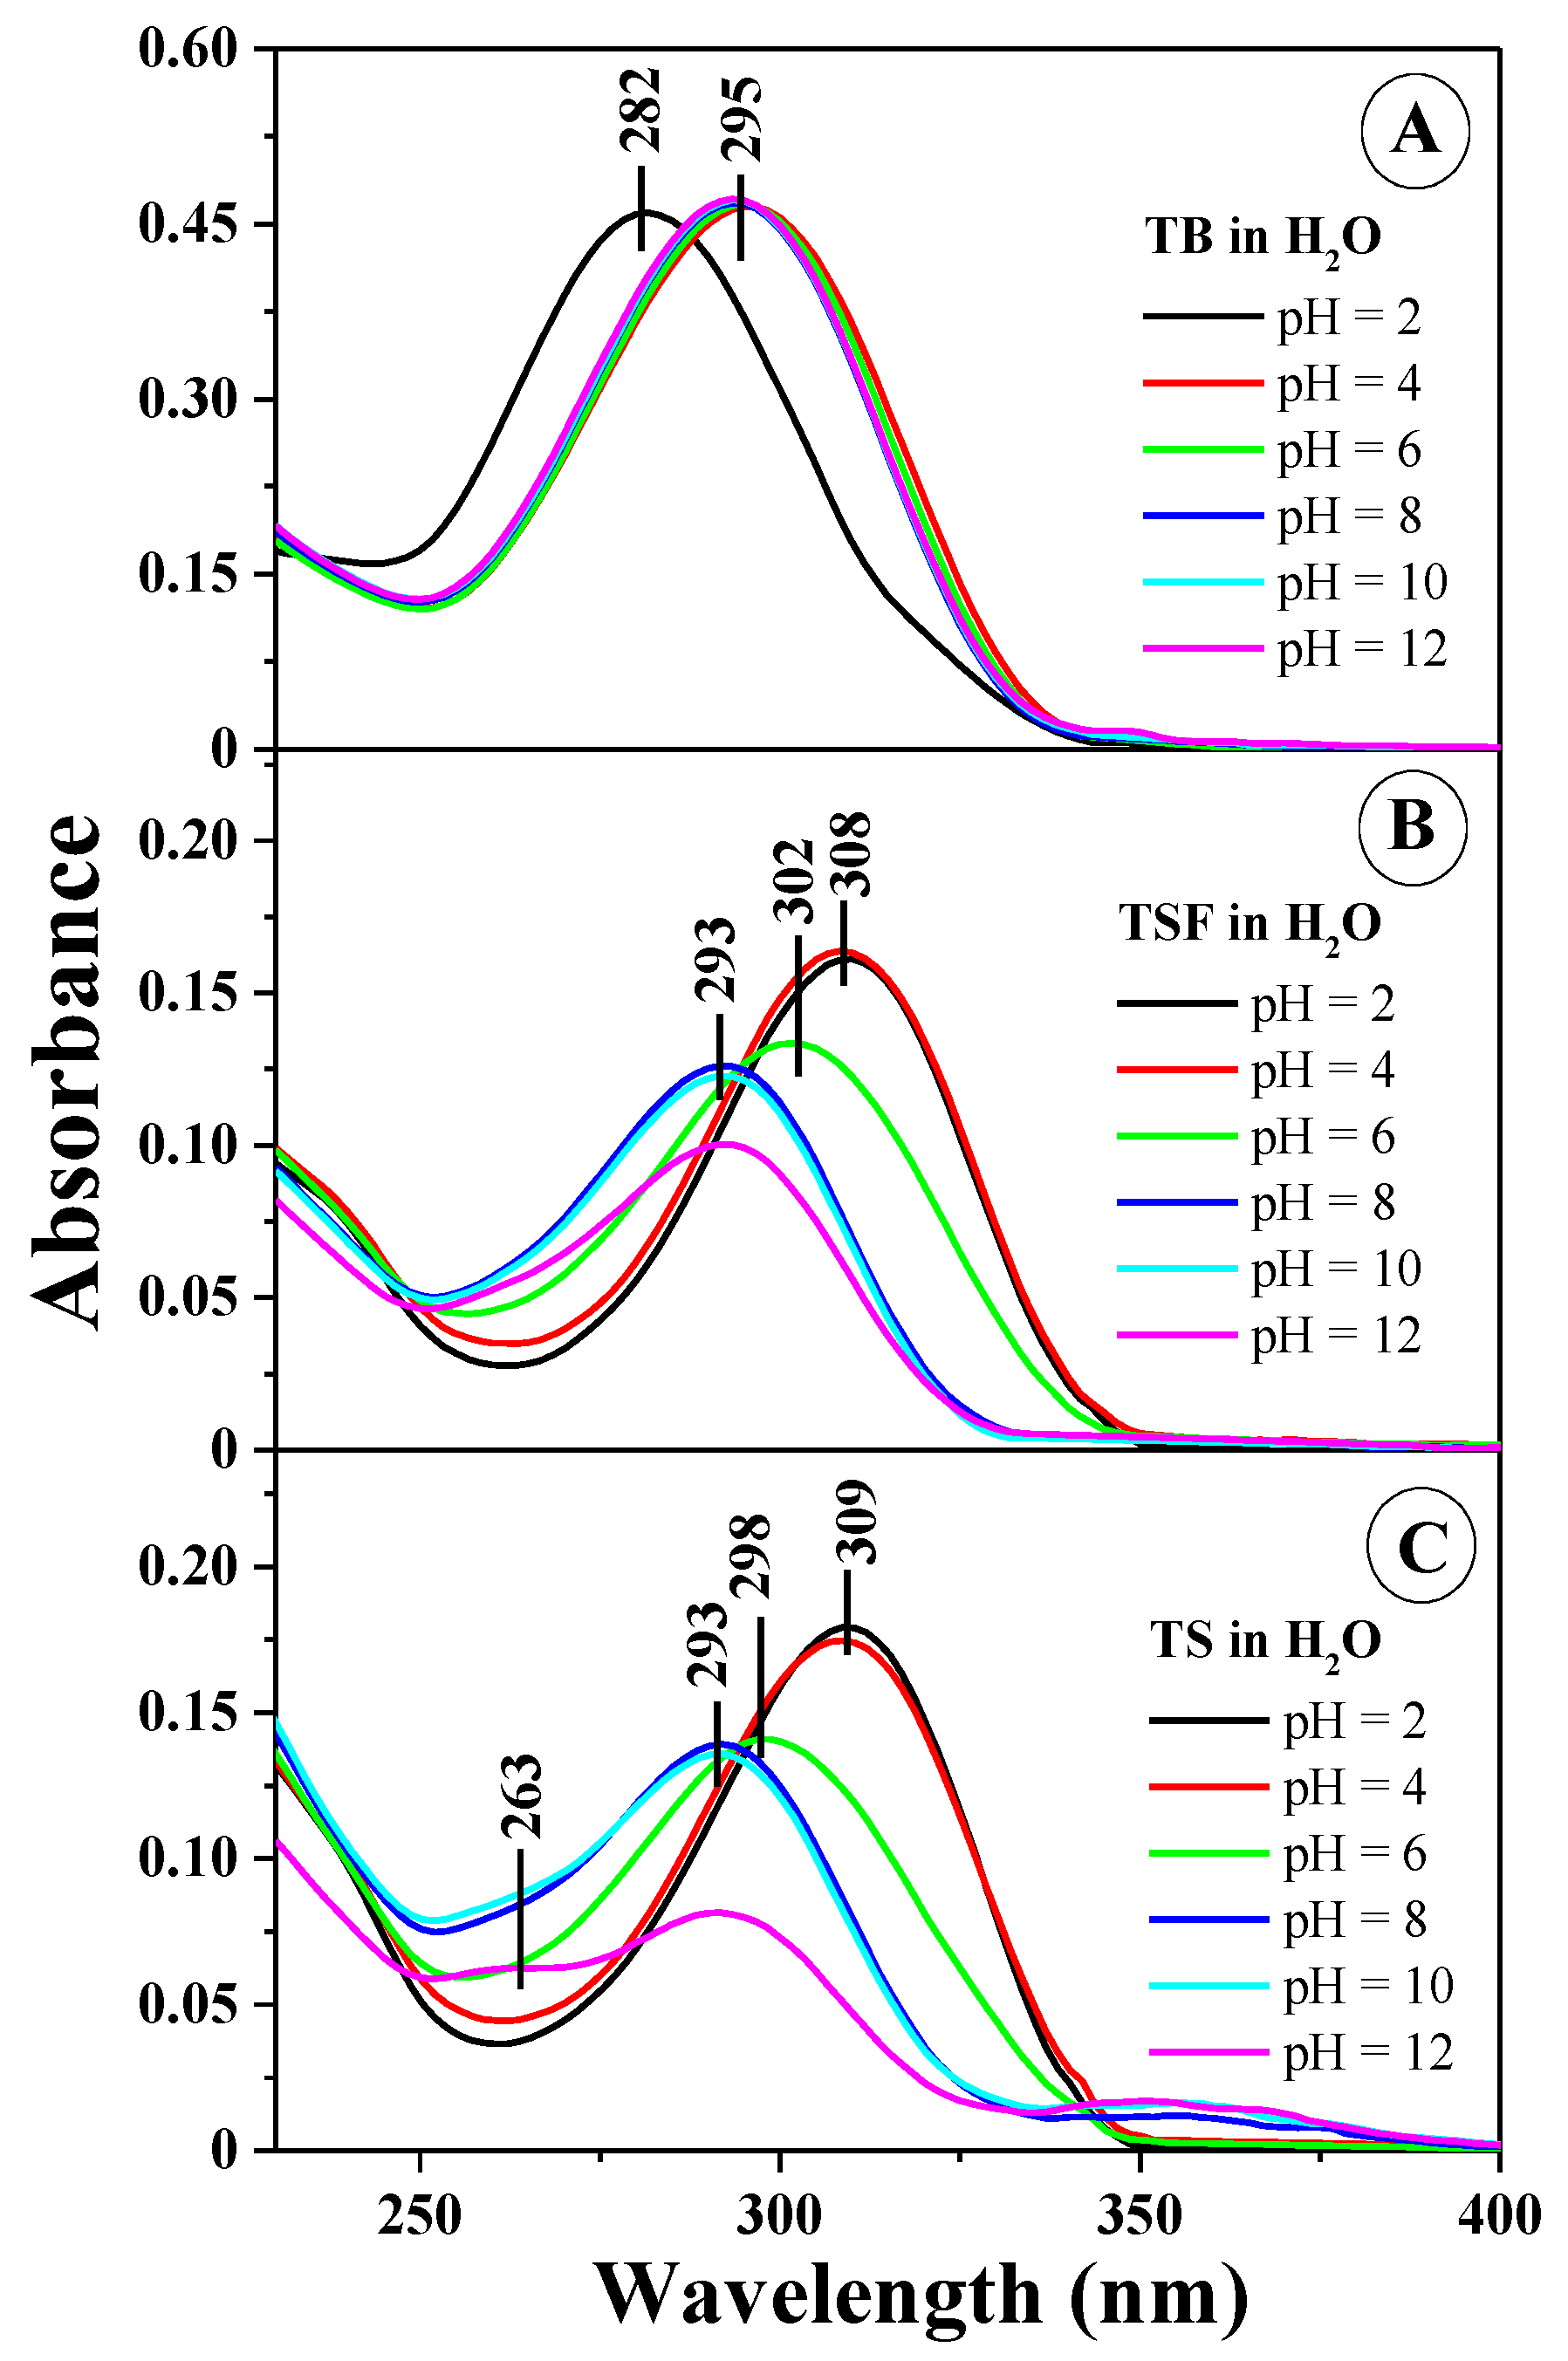
Figure 1 presents the electronic absorption spectra for the 1,3,4-thiadiazoles selected for the study, at varying concentrations of hydrogen ions in the aqueous solution used, respectively for TB in
Figure 1A, TSF in
Figure 1B, and TS in
Figure 1C (for clarity of the presentation, spectra for pH 2, 4, 6, 8, 10, and 12 were selected).
The obtained results indicate very clear changes in the shape of the spectra, particularly in the region significant to physiological values. For the solvents used in the study, the positions of the absorption and fluorescence maxima as well as the respective Stokes shifts are presented in
Table S1 (see the
Supplementary Materials). As clearly visible in
Figure 1B,C, the dissociation of the –OH group from the resorcylic ring in the ortho position (
Scheme 1C,E) results in a clear hypsochromic spectral shift by 301 cm
−1 for TSF and 303 cm
−1 for TS in the case of spectra observed at pH 12, and bathochromic shift by 1016 cm
−1 for TSF and 684 cm
−1 for TS in the case of spectra observed at pH 2 (as well as pH 1) relative to the spectra of the same compounds at pH 7. For TB,
Figure 1A reveals only a slight shift of the bands within the pH range of 6–12 (without the –OH group in the resorcylic system). As evident in the case of all analyzed analogues, the process of ionization may also be accompanied by the processes of compound aggregation [
23,
24]. At pH of approximately 6–8 (depending on the substituent), a very clear broadening of the absorption spectrum can be observed (mainly) for TS and TSF (the effects are significantly less prominent for TB) (
Figure 1A), indicating the possible presence of forms other than the monomeric spectral forms of the analyzed structures [
9]. In the case of TS and TSF spectra at pH ~2, the spectral absorption is the least pronounced, which may suggest a significant prevalence of aggregated forms in the case of these analogues (see
Figure 1B,C). Meanwhile, no such drastic decrease of the absorbance level was observed for TB within the same range and it was significantly higher at the same pH (compared to TS and TSF). This also clearly evidences the influence of the structure of compounds selected for the study on the manner in which aggregated molecular structures are formed. In the case of TB at pH 2, the compound’s absorbance was slightly decreased relative to other spectra recorded for higher pH, suggesting an increase in the number of the analogue’s monomeric forms. In the case of TS and TSF, such behavior was not observed in the studied concentration range, which may confirm the fact that the molecules of those analogues interact more strongly and are therefore able to form more durable aggregated forms (
Scheme 1B,D,E). It is also noteworthy that in the case of TB at pH 2, the spectrum shifts (primarily) towards the shorter wavelengths, which, according to Kasha’s exciton splitting theory, may suggest the presence of card pack analogues (the most likely for this analogue). Moreover, for low pH values it cannot be excluded that the thiadiazole ring is subject to protonation and an ionic form with the -N
+-H group is formed in all the studied analogues. The effect was most evident in the case of TB but was also present for TS and TSF, although the latter two analogues containing an –OH group may additionally be subject to head to tail aggregation as well. This was reflected in the absorption spectra where the long wavelength spectra registered for this analogue revealed a clear broadening of the bands. In the case of TSF, we observed what most likely was a greater equilibrium between the respective types of aggregation together with molecule ionization, whereas for TS, we recorded a band with the maximum at approx. 350 nm, evidencing the possible presence of aggregated structures even larger than dimers.
Moreover, in the case of TS a (fairly) clear isosbestic point could be observed at approx. 345 nm, which may suggest that the transfer between the respective aggregation forms in the compound is highly fluid (and the molecules are susceptible to such interactions). For the band located in the long wavelength side, this points to a stronger aggregation (head to tail) whose level is most likely constant at a low pH. The intensity of bands evidencing the aggregation effects occurring in the selected analogues is also significantly correlated with the structure of the very substituent group in the resorcylic ring bound to the 1,3,4-thiadiazole ring.
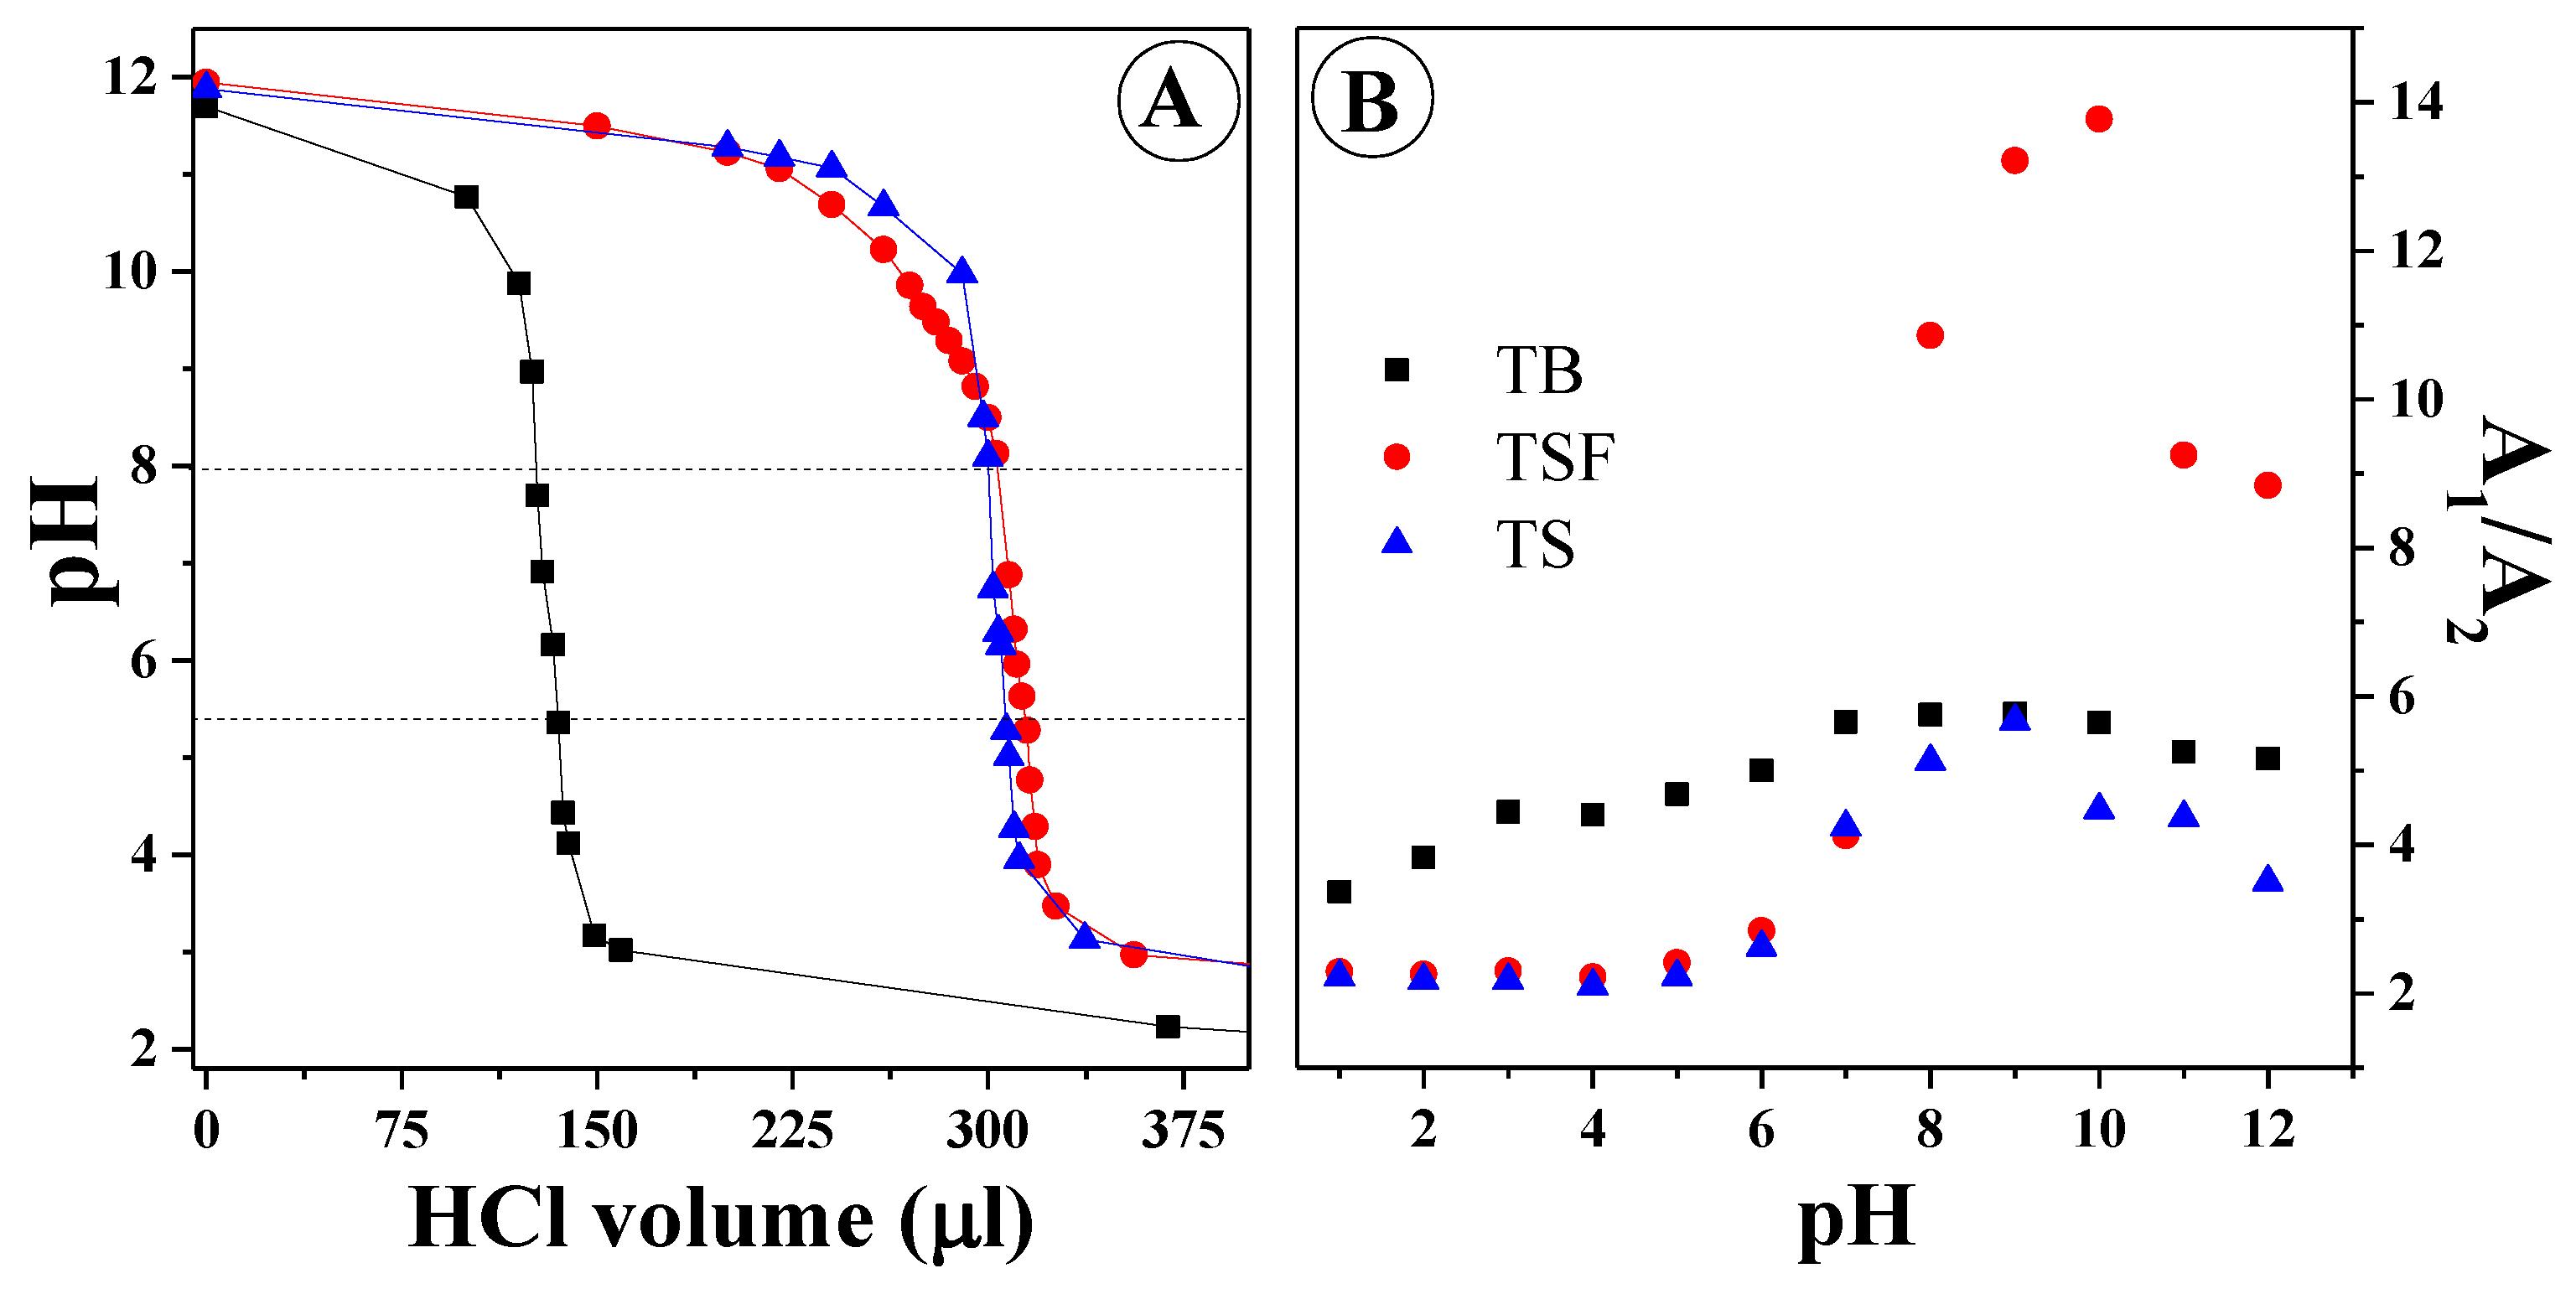
Figure 2A presents the titration pH-metric curves and pK points for the ionization-related –OH groups in the resorcylic ring of TS and TB, as well as the pK points for all compounds for the -N
+-H group.
In the case of TS and TSF, the pK for the –O
− group was, respectively, 7.35 and 7.02, and for the –N
+-H group, the pK for all the compounds was approx. 4.85. For pK higher than the larger of the above, we observed for the respective analogues (TS and TSF) the prevalence of forms with the –OH group, whereas for pK below the lower of the above, for each analogue the prevalence of forms with the –N
+-H group was observed.
Figure 2B presents the ratio of absorbance intensity at approx. 309–330 nm in all compounds relative to changes in the pH of the aqueous solution. It can be observed that for pH from 1 to approx. 7, TS and TSF clearly showed a drastic transition between the forms with the aforementioned groups subject to ionization (-O
− and –N
+-H). The most significant change was observed for TSF (for which we could probably observe the greatest equilibrium/transfer between the respective types of ionized forms that could undergo the given types of aggregation) and the changes were also relatively clearly manifested for TS. In the case of TB, the changes of this type were the least extensive, as confirmed by the observations in
Figure 1A. The significant reduction of this ratio in the case of TS and TSF further confirms the occurrence of the aggregation effects discussed above. It also corroborates the conclusion that the process of nitrogen atom protonation was in equilibrium and did not affect the intensity of the ratio for the selected 1,3,4-thiadiazole analogues within the pH range of 1 to approx. 5/6.
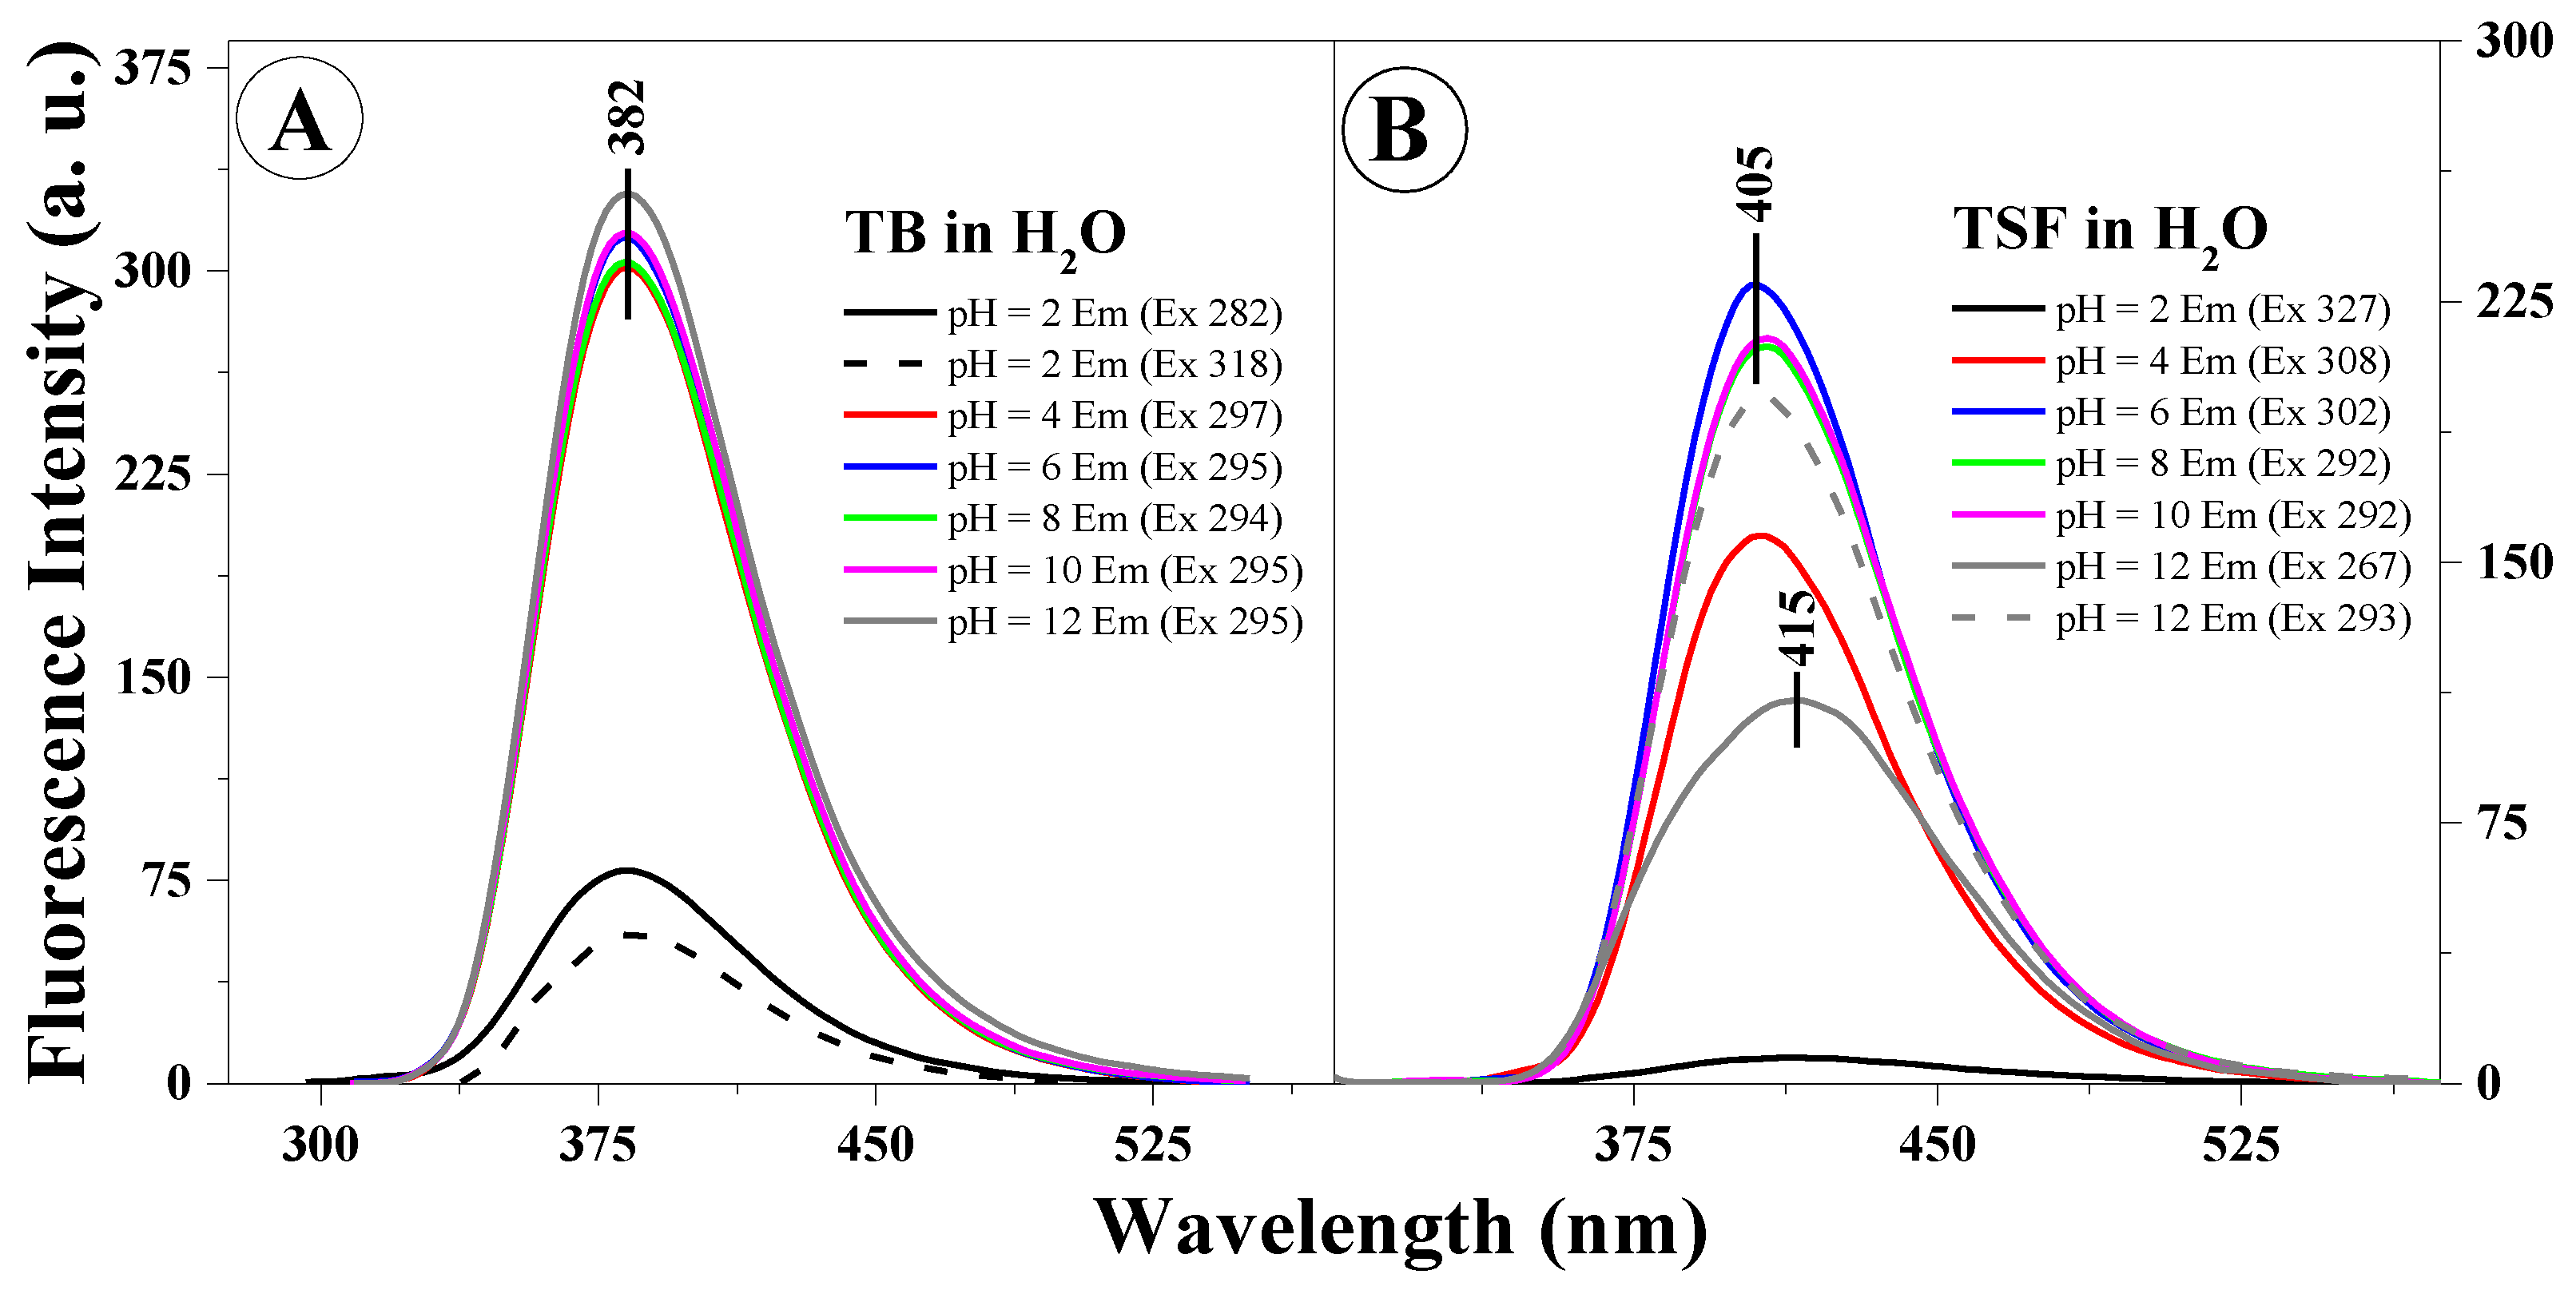
Figure 3A,B presents example fluorescence emission spectra for TB (
Figure 3A) and TSF (
Figure 3B) corresponding to the respective absorption spectra.
The excitation wavelength for all the analyzed samples corresponds to the absorption spectra maximum (
Figure 1A,B). In the case of the fluorescence emission spectra in TB, we observed virtually no shifts relative to changes in the solution pH or excitation wavelength (at the maximum characteristic of monomeric or aggregated forms), only significant, pH-dependent changes in intensity (the intensity of fluorescence decreased with decreasing solution pH). In
Figure 3B, presenting the fluorescence emission spectra for TSF, we observed both a slight shift of the fluorescence emission bands correlating to the pH of the analyzed solution, and changes in emission intensity as well as a noticeable change in the band shape depending on the excitation wavelength, which confirms the possible presence of both respective ionized forms and specific spectral forms (i.e., monomeric or aggregated forms or for example, dimers). We can therefore clearly observe the influence on the location of the emission band maximum for the given compound relative to the structure of the substituent group. However, in all the presented fluorescence emission spectra, a single fluorescence band was observed with the maximum at approx. 382 nm (TB) or 405 nm and approx. 415 nm (for TSF). It is noteworthy that in the case of the selected analogues, changing the concentration of hydrogen ions in the medium has a significant impact on the stability of the excited state of the given molecule in the particular solvent. It is noteworthy that in the case of selected analogues TB and TSF the emission observed is predominant in their monomeric forms.
However, the most interesting effects observed in the presented study were those presented in
Figure 4A–F.
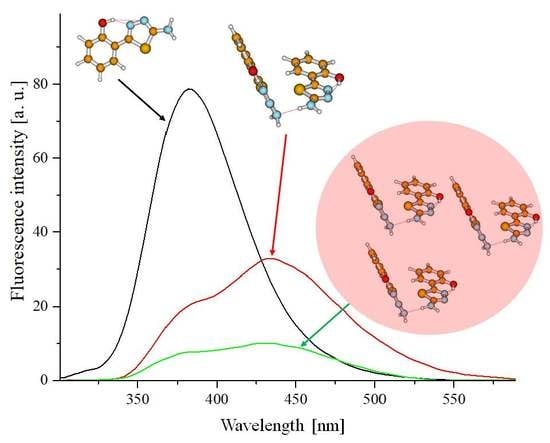
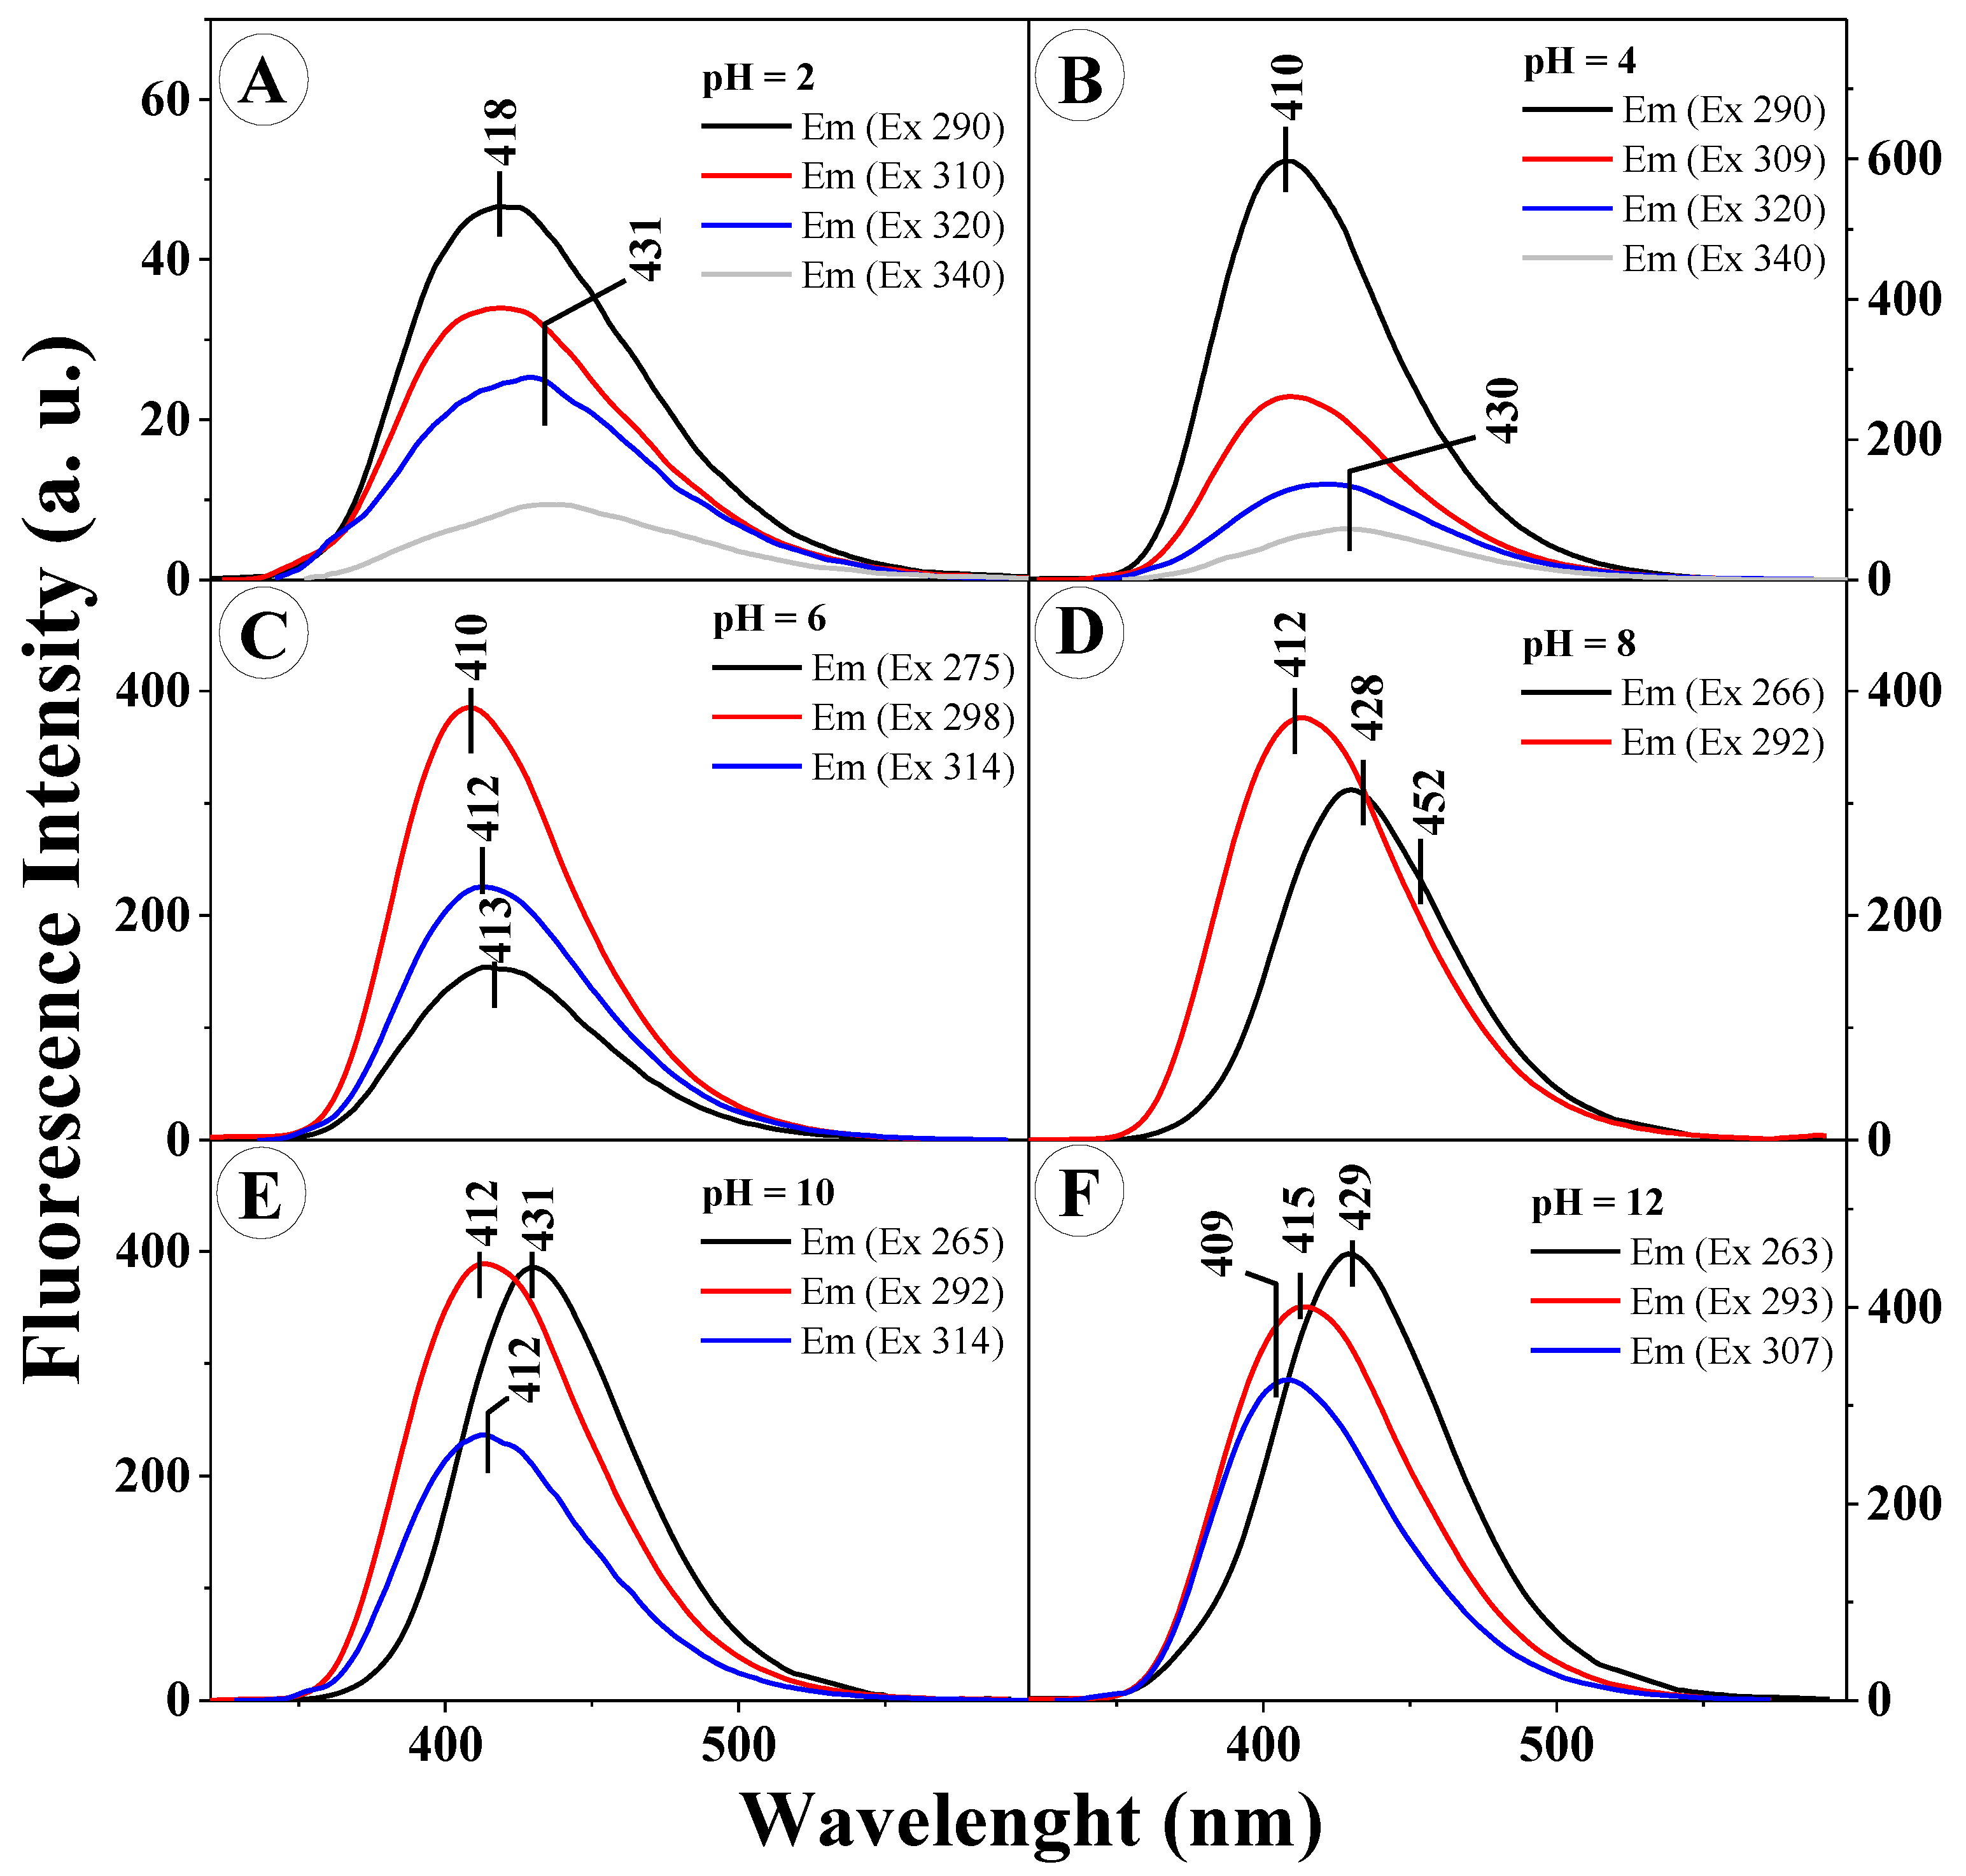
In order to provide a further, more in-depth insight into the character of the molecular interactions occurring for TS in aqueous solutions of varying pH (at pH levels corresponding to the results in
Figure 1C), its respective emission spectra were presented for various excitation values. As can be clearly noticed, for different excitation wavelengths (corresponding to the absorption spectra in
Figure 1) we observed the emergence of several fluorescence emission bands, shifted relative to each other, or the effect of dual fluorescence in the case of pH 2 and 4 (grey line in
Figure 4A,B) for the excitation wavelength corresponding to the aggregated form, such as a dimer (in the head to tail layout). For all the presented spectra, the excitation wavelength used corresponded to the prevalence of the monomeric form (short-wave excitation at the wavelength of approx. 290 nm) and the prevalence of the aggregated form (excitation in the long wavelength side of the spectrum).
Figure 4A,B presents the emission spectra for TS at the pH of 2 and 4, respectively. Noticeably, after excitation with the wavelength corresponding to the maximum of the emission spectrum and the maximum characteristic of aggregated forms, the emission spectrum produced a clearly visible dual fluorescence effect (grey line). For pH higher than 5, depending on the length of the excitation wave, we observed clear shifts of the fluorescence emission spectra but with only single emission bands. It should be pointed out, however, that said bands overlapped to a considerable extent and their emission maxima corresponded to the first or second emission band from
Figure 4A,B. One should also mention the very clearly visible correlation between the varying locations of the emission bands and the excitation wavelengths applied. Depending on the excitation wavelength used (on the short wavelength side approx. 290 nm or on the long wavelength side approx. 320 nm) aggregated forms of a specific type were more commonly excited, respectively card pack or head to tail forms (as further confirmed in the TD-DFT calculations). Naturally, the emergence of the respective aggregation forms was, in this case, closely related to the particular solution pH, which will be further discussed in the following part of this paper. The technique of resonance light scattering (RLS) allows a highly probable identification of the effects related to the given type of chromophoric aggregation of the studied analogues [
25], as well as the differing character of such aggregation interactions.
Based on the exciton splitting theory and by employing quantum-mechanical TD-DFT calculations, we were able to conclude that the emergence of the very interesting and atypical spectral shifts in the emission spectra registered for TSF and, most notably, the effect of dual fluorescence observed for TS in the pH range of 1–4, was significantly influenced by the presence of different aggregation forms, specifically card pack aggregation (more characteristic for short wavelength excitation) and head to tail aggregation (characteristic for long wavelength excitation) of the analyzed molecules. Furthermore, by using the spectral shift in the absorption spectra in combination with the mechanism provided by the exciton splitting theory, we were also able to calculate the distances between adjacent chromophores of the analyzed molecules [
23,
26]. So, for the potential TB dimers, the distance between adjacent chromophores obtained in the calculations was approx. ~3.67 Å, whereas for TSF that distance was approx. ~3.61 Å [
26]. In the case of TS, the distance was the smallest at approx. ~3.52 Å. Thus, in the case of TS and TSF, aggregational interactions very strongly influence the observed fluorescence effects.
To recapitulate at this point, one should strongly emphasize the impact on the observed spectral effects (in particular in the emission spectra of TS and TSF) of such factors as, above all, the phenomenon of molecular aggregation (of two types) and difference in the substituent structure of the respective compounds (which naturally partially correlates with the former of the two factors).
We can therefore preliminarily posit that the fluorescence emission spectra of the analyzed compounds under high pH conditions are dominated by the emission from monomeric forms; various ionized forms, and at low pH, in the case of TS/TSF, form the two aforementioned aggregated forms. For TS, at pH lower than 5, the aggregation processes may, given the prevalence of card pack aggregative interactions, also trigger effects related to intermolecular charge transfer (CT), which influence the dual character of emission spectra, as confirmed in the conducted TD-DFT calculations as well as, most importantly, calculations of the dipole moment in the ground and excited state (described below).
Emission in the case of excitation was registered at the wavelengths corresponding to the maxima of the respective fluorescence emission spectra in
Figure 3A,B. The much higher selectivity of the fluorescence excitation spectra compared to the electronic absorption spectra facilitates the excitation of a specific molecular form or compound in the analyzed analogue. In other words, the fluorescence excitation spectra allow the excitation of a specific spectral form of the compound (e.g., the monomer, dimer, etc.).
Figure S1A presents the fluorescence excitation spectra for TB at the selected pH levels (corresponding to the results discussed above). It can be observed that in the case of TB, virtually only the band characteristic for the compound’s monomeric forms was observed (varying in intensity depending on the pH). However, said bands were quite significantly widened, which suggests that even in the case of this analogue the effects of aggregative interactions may be observed.
Figure S1B for TSF presents, apart from the band with the maximum at approx. 300 nm, a very clearly visible band on the long wavelength side with the maximum at approx. 360 nm, varying in intensity depending on the excitation wavelength (short or long wave excitation, as described above) and pH, characteristic for aggregated forms emerging in correlation with the presence of this particular ionic form of the compound. So, in the case of TSF we observed the highest intensity of fluorescence excitation bands in the region associated with aggregation (head to tail, long wave). As already mentioned, the fluorescence emission spectra for TSF revealed, in correlation with the solution pH, bands that were partially overlapping and shifted relative to each other.
For TS,
Figure S2 presents excitation spectra analogical to those observed in TB and TSF and presented in
Figure S1, at varying pH levels of the aqueous solution (analogically to the emission spectra in
Figure 4). Similarly, to TSF, in the case of TS we observed, depending on the pH and excitation wavelength, band enhancement on the long wave side (which evidences the prevalence of card pack aggregation). As visible in the excitation spectra, bands originating from the aggregated forms are more strongly evidenced for pH levels at which the emissions spectra showed effects related to dual fluorescence, i.e. pH 2 or 4.
Within these pH ranges, the spectra show a significantly increased half-value width relative to other pH levels, which clearly suggests the presence of other than monomeric forms of the compound. Thus, for TS (and to a considerable extent also TSF) we can observe the strongest effects related to exciton splitting at the main energetic level S0, which induces the respective changes in the fluorescence emission spectra. In the pH ranges where the effects of dual fluorescence or multiple bands significantly shifted relative to each other are not observed, the excitation spectra at wavelengths corresponding to the respective forms of the analyzed compounds are fairly consistently overlapping within practically the entire wavelength range.
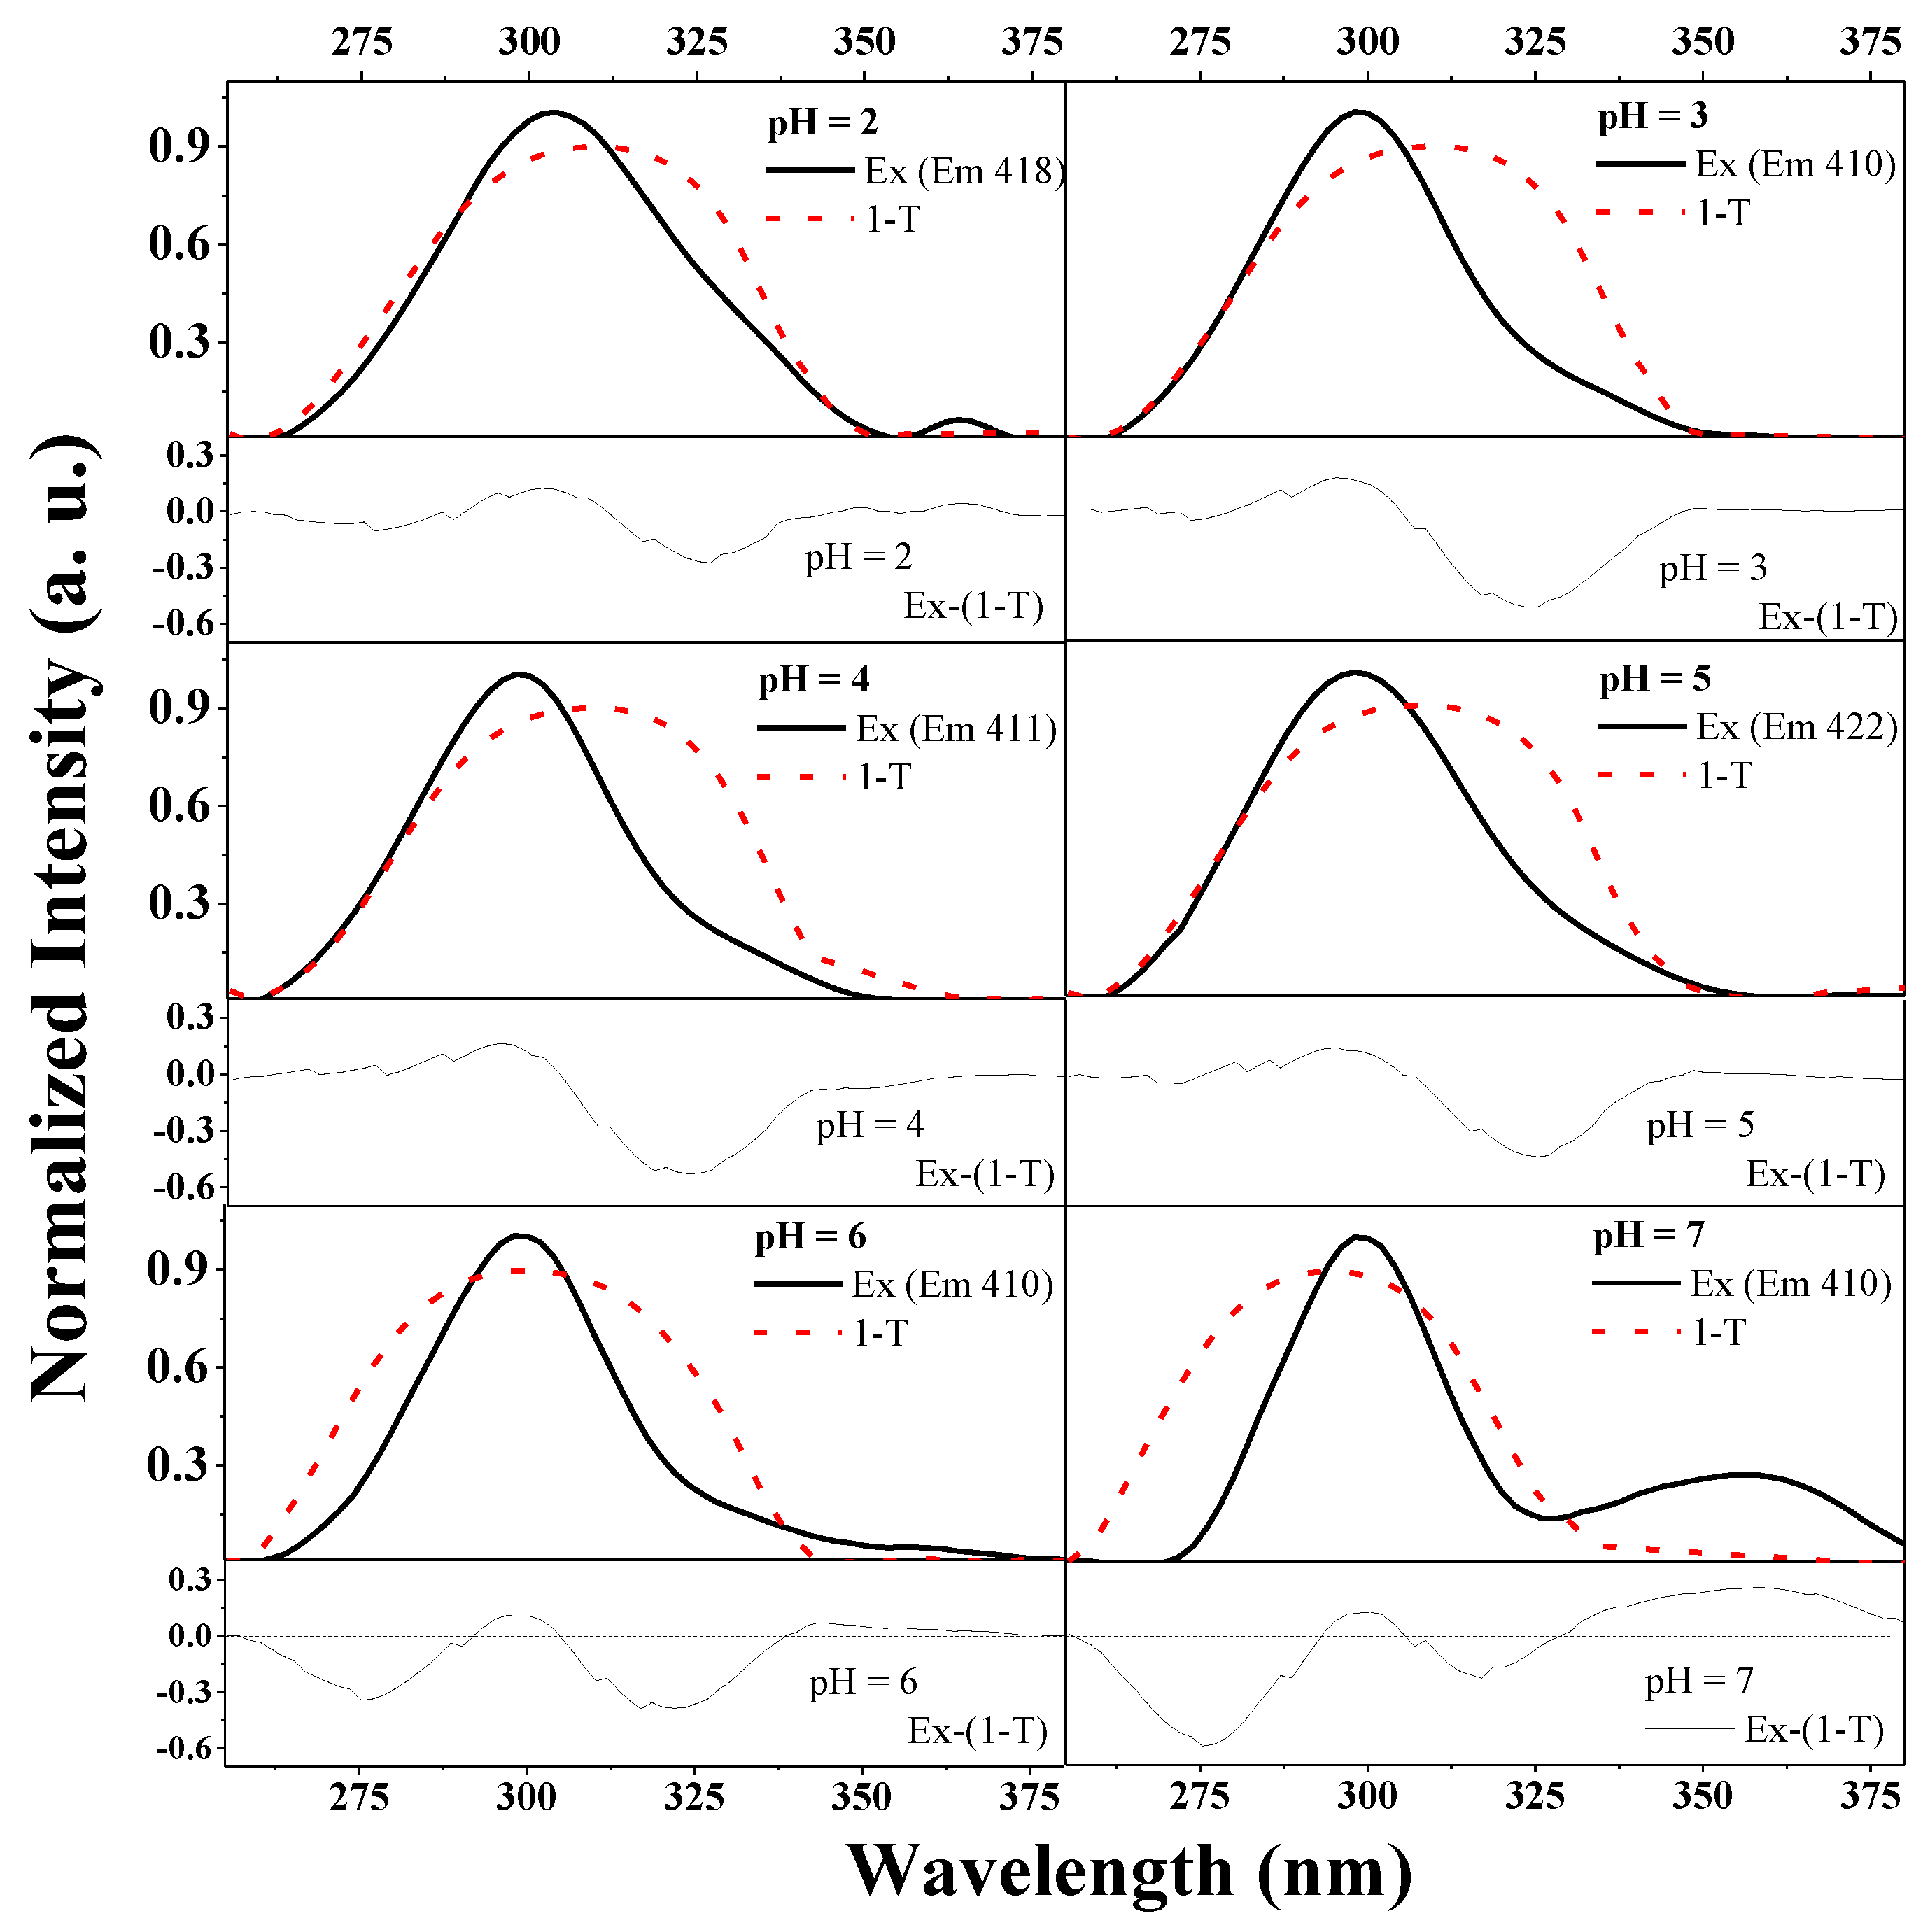
To emphasize the influence of the type of aggregation on the observed fluorescence effects, one needs only to carefully analyze the results presented in
Figure 5.
The figure illustrates the overlap between the normalized excitation spectra (presented in
Figure S2 for TS) and the 1-T spectra for this compound (T: transmission) and the differential spectra under each respective panel (Ex-(1-T)). Such a presentation of the spectra allows us to observe the impact that a certain type of aggregation has on the aforementioned fluorescence effects. For the pH levels at which the effect of dual fluorescence is present, we observed band enhancement (in the differential spectra) on the long wave side (characteristic of head to tail aggregation) (e.g., for pH 2–5). Whereas, with increasing pH (at 6 two types of aggregation are evident and the enhancement is present on both sides), already at the level of pH 6, we observed increased enhancement on the short wave side, which implies the prevalence of head to tail aggregation, and in the emission spectra, the disappearance of effects related to dual fluorescence emission.
To recapitulate, based on the theory of exciton splitting, the characteristic long wave bands should, in the case of the analyzed analogues, be associated with various types of aggregated forms, as further confirmed by the RLS spectra (presented in
Figure 6 and
Figure SA3).
According to the exciton splitting theory, the observed shifts are related to the prevalence of card pack aggregation, long wave enhancement, and in TB with head to tail aggregation [
23]. Based on the above, it can be inferred that the observed fluorescence effects are certainly related to the effect of molecular aggregation taking place in the used solutions of varying pH. In the case of TS, the card pack aggregation facilitates the emergence of intermolecular CT states (as confirmed by dipole moment calculations discussed later in the text), whereas in TSF molecules, due to the structure of its substituent group, despite the most likely very heavy card pack aggregation the preference is also for head to tail aggregative interactions and a charge shift evidenced by the split of the fluorescence emission spectra into two bands characteristic of the respective electronic states.
As the subsequent research step, in order to confirm one of the main (and necessary) factors influencing the effects observed in the fluorescence spectra (i.e., aggregation), spectral RLS measurements were conducted (∆λ = 0) for the selected derivatives in the entire pH range.
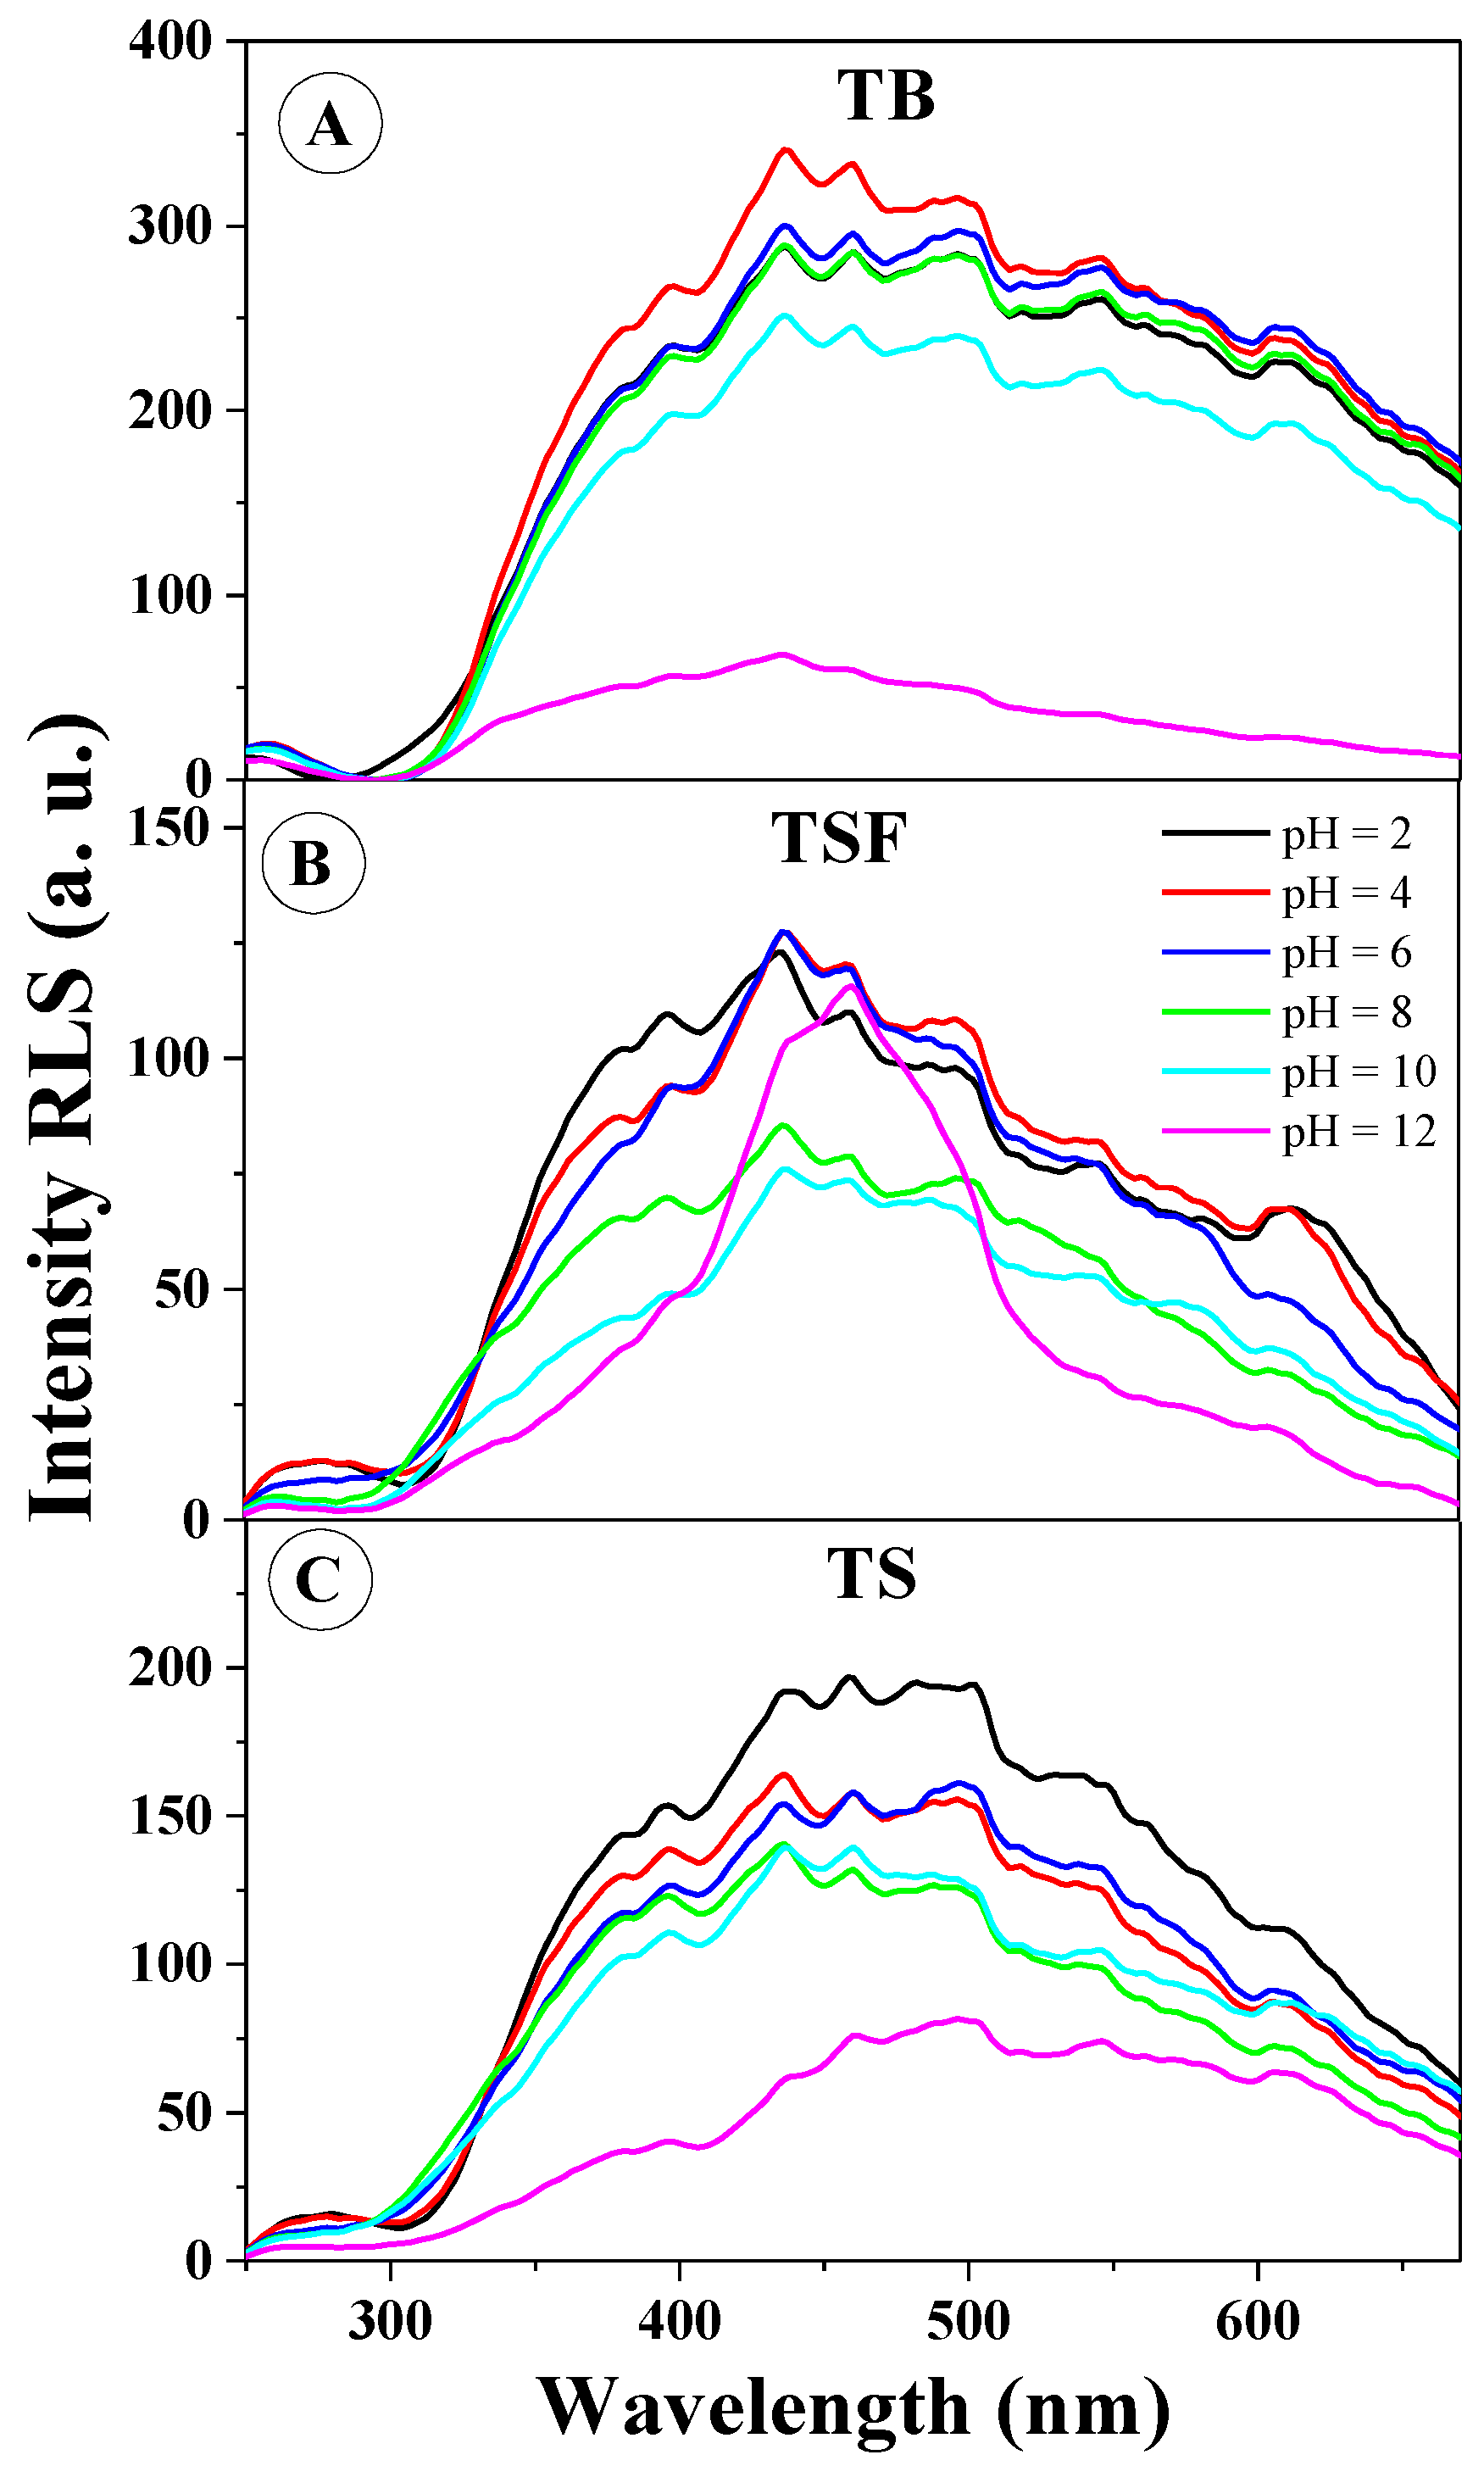
Figure 6 presents the RLS spectra for TB (
Figure 6A), TSF (
Figure 6B), and TS (
Figure 6C). As provided in the literature, the occurrence of RLS spectra should usually be associated with chromophoric aggregation of the interacting molecular systems [
25]. It is clearly apparent that the RLS spectra confirm the above assumption related to the significant impact of aggregation effects on the changes in fluorescence spectra observed above.
Figure 6A illustrates the presence of RLS bands for TB in practically the entire pH range; however, the spectra (except only high pH in the range of 10–12) only slightly differ from each other, similarly to fluorescence emission spectra for this compound relative to the changing pH.
Figure 6B presents the RLS spectra for TSF at selected pH levels; the tendency here is very similar to that observed for TB, however, in this case the shifts recorded in the emission spectra are considerably more significant (and the shape of RLS spectra for TSF is considerably different than in the case of TB, which suggests the presence of different aggregation forms). In
Figure 6C, similarly to the other analogues (presented in
Figure 6A,B), RLS spectra are also clearly present in practically the entire range of hydrogen ion concentrations (slightly less prominent at high pH). One should emphasize at this point that RLS spectra were observed for all the analyzed analogues, irrespective of the changes observed previously in the emission fluorescence spectra. Within the wavelength range of 350 to 420 nm, we registered the most significant changes in RLS scattering for the studied analogues, which corroborates the significant participation of head to tail aggregation in the observed aggregative effects, as already discussed in the context of absorption and fluorescence excitation spectra. The effects are very evident in
Figure S3, representing the ratio of RLS scattering intensity at the wavelength of approx. 436 nm relative to pH, where one can directly observe that RLS spectra are present practically in the entire range of pH levels.
In summary, it is noteworthy at this point that the RLS spectra related to chromophoric aggregation of the analyzed molecules are very characteristic and clearly correlate the observed fluorescence effects with various types of said aggregation. However, it should also be emphasized that the same is not the only factor determining the observed fluorescence effects as very intensive RLS bands were also observed for TB where, as discussed in the context of previous experiments, we observed no significant changes in the fluorescence emission spectra relative to the emergence of dual fluorescence or presence of multiple fluorescence emission bands partially shifted relative to each other. The oscillative structure of the observed RLS bands evidences the abundance of aggregated structures of varying sizes in the analyzed compounds [
25] and may confirm our earlier assumptions regarding the presence of different aggregated forms of the analyzed molecules. In the pH range in which a greater aggregation tendency of molecules is observed, the effects of broadening the emission band or its significant shift or other dual fluorescence emissions-related effects are observed much faster. Both the excitation and RLS spectra explicitly relate these two factors together. The aggregation process with appropriate molecular structure (and above all the application of its conformation) can cause changes in fluorescence emission spectra.
Nonetheless, it can be concluded with considerable certainty that in the case of the observed fluorescence effects, aggregation is a factor necessary for their emergence. The above hypothesis is corroborated by the results presented in
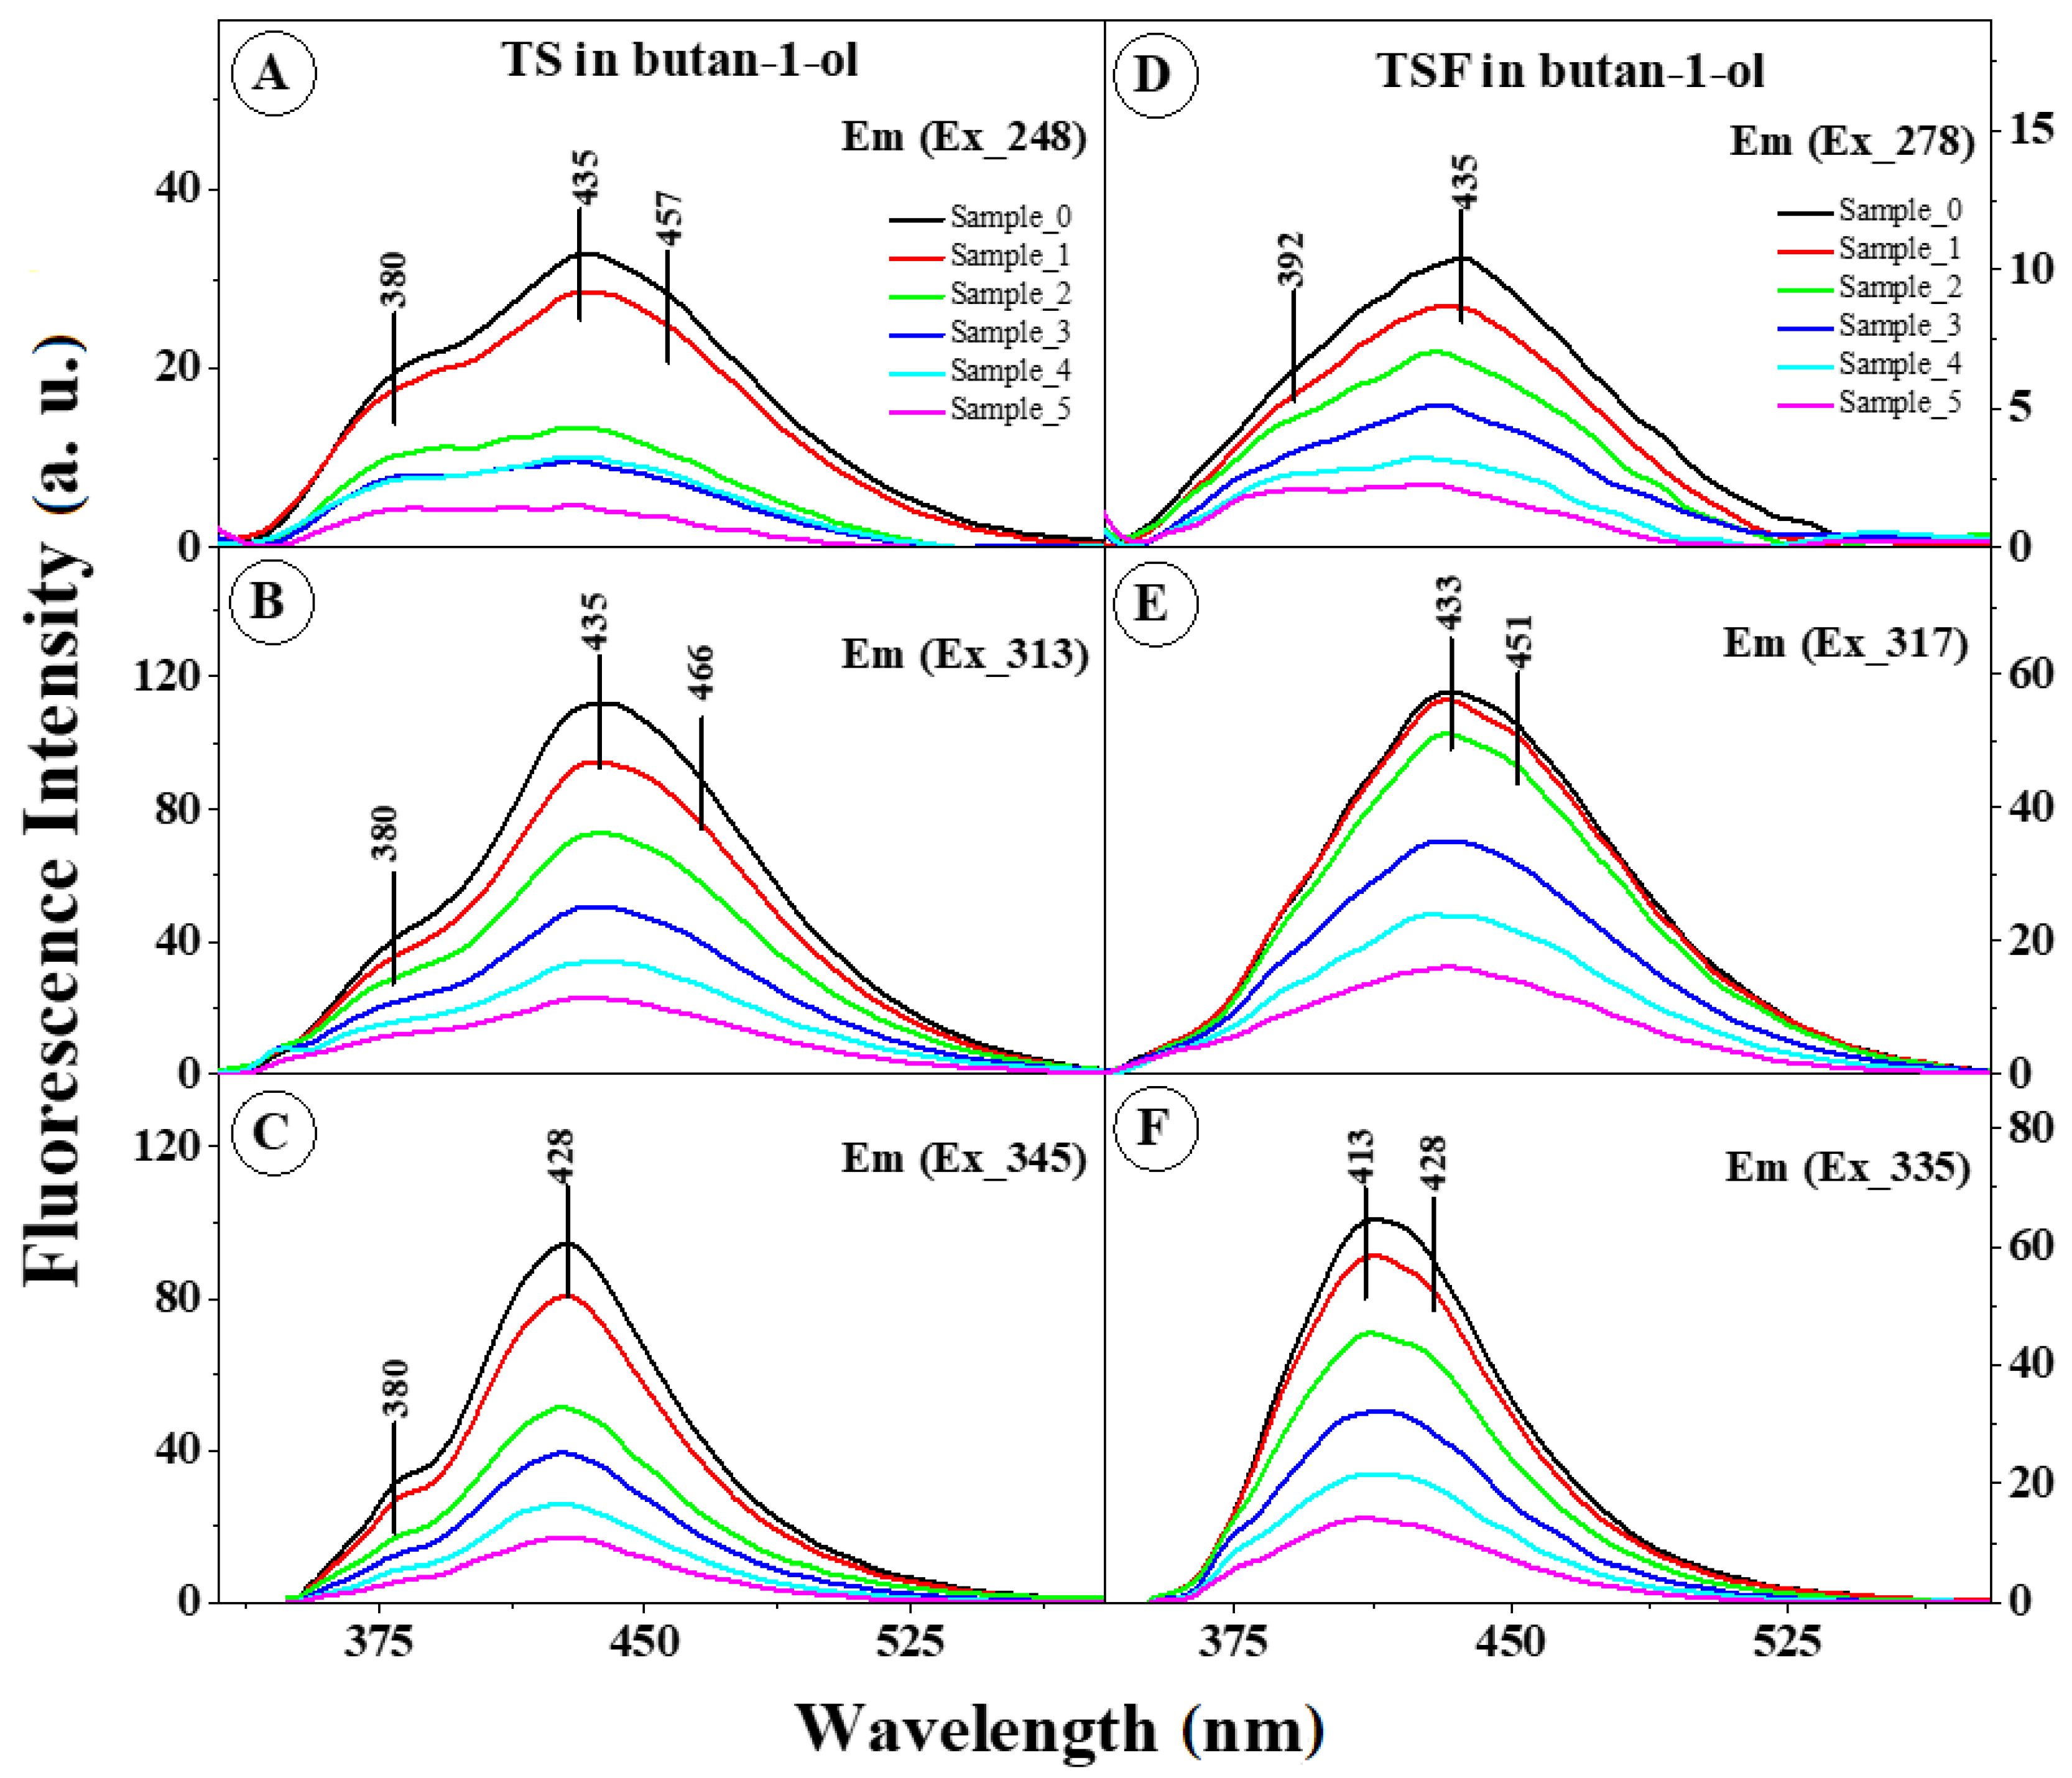
Figure 7A–F as well as in
Figure S4A,B.
Figure 7A–C presents the fluorescence emission spectra for TS at three different excitation wavelengths (248 nm, 313 nm, and 345 nm, respectively) relative to the concentration of the analyzed compound. It can be observed that regardless of the length of the excitation wave, with increasing compound concentration the emission also grows significantly at approx. 435 nm in the dual fluorescence spectrum. This clearly evidences the impact of aggregation effects on the studied fluorescence effects. An analogical experiment was conducted for the TSF derivative (i.e., one involving three excitation wavelengths and variable compound concentrations). We observed, firstly, that the bands with the maximum at 413 nm (
Figure 7F) and 433 nm (
Figure 7E) showed a significant loss in intensity with the increasing concentration but nonetheless remained present. Secondly, even for TSF (where spectra measured for varying pH did not show this effect) we observed a clear effect of dual fluorescence in
Figure 7D under short wave excitation (e.g., sample 5). Furthermore, it is important to notice that more intensive short-wave emission was observed under short wave excitation in the region characteristic of head to tail aggregation enhancing the card pack aggregation, which is clearly visible in
Figure S4 (black dots on both panels).
In order to better understand the mechanism of the spectral shifts described above (
Figure 1,
Figure 3,
Figure 4) as well as the fluorescence effects observed in the compounds, as shown in
Figure S5 and
Figure 6A, we presented the correlation between Stokes electronic transition π→π* and the changes in the function of polarity fluctuations
as well as
F(
ε,
n) which describe changes in the polarity/polarizability of the solvent used.
Firstly, as can be observed for all selected compounds (
Figure S5, Figure S5A), the slopes of the lines are positive for all the solvents used, which usually signifies an increase in the dipole moment of the excited molecule and may suggest that its direction is preserved during the electron transition. This fairly clearly evidences the possibility of CT between the molecules triggered by aggregation interactions, causing the particular observed fluorescence effects, such as dual emission in the case of TS. Furthermore, it confirms the significant impact of aggregation effects on the non-specific interactions taking place between the molecules of the analyzed compounds. Furthermore, the somewhat irregular linear dependencies observed in the presented relationships (
Figure S6B) largely confirm the possibility of triggering aggregative interactions by hydrogen bonds, particularly in environments where dual fluorescence emission or two separate, largely overlapping, emission bands are observed. The presence of solvent molecules modifies the absorption and fluorescence spectra of the analyzed compounds, usually leading to shifts in the locations of their maxima towards longer, less frequently shorter wavelengths. However, the presence of hydrogen bonds (triggering aggregation which may influence CT-related effects) may lead to significant departures from that model [
27]. Furthermore, one should also consider the fact that in systems such as these studied here, we observe a continuous equilibrium between the formation of intermolecular and intramolecular hydrogen bonds. The former lead to the formation of aggregated systems (firstly of the dimer type), as clearly evidenced by the changing intensity of RLS spectra and fluorescence excitation spectra.
Most notably, however, one should take into account the results of dipole moment calculations performed for the analyzed molecules in ground and excited states based on their respective absorption and fluorescence emission spectra in correlation with Reichardt’s [
28] and Kawski’s methods [
29], respectively, Equation (2) and Equations (5)–(7). The most important factors pertinent to those calculations are presented in
Table 1 for the former and
Table 2 for the latter method, for comparison and corroboration of the results.
As we can see, the most significant changes of the dipole moment of the analyzed molecules (between the ground and excited states) were observed for TS molecules and TSF, the compounds whose fluorescence emission spectra revealed the most interesting fluorescence effects (depending on the excitation, either two largely overlapping fluorescence emission bands or dual fluorescence). The above calculations confirmed in this case that CT occurred between the analyzed molecules. In the case of TB and TS we observed the ratio in the dipole moment between the excited and ground states of 1.50 whereas in the case of TSF the difference increased to 1.62 (D). Results of the above calculations confirm the significant influence of the structure of the substituent system on the observed fluorescence effects. They also suggest that an important effect of solvatochromic shifts entails the intersection of states with varying distributions of electronic density dictated by the polarity of the respective medium. In polar solvents, electronic states with high dipole moments (often in fact the CT states) are stabilized relative to the states with low dipole moments. If such states are characterized by similar energies, a change in the polarity/polarizability of the medium may lead to a reversal of the states’ order. Since photochemical properties are determined by the character of the lowest excited state of the given multiplicity (Kasha’s rule), they can be (as observed in the present study) subject to very significant changes with the solvent’s polarity.
2.2. Fluorescence Lifetime Analysis
In the subsequent part of the study on the mechanism of molecular interactions inducing the respective fluorescence effects in the emission spectra, as presented above in
Table S3 (and
Figure S7), we considered the results of time-resolved measurements of fluorescence lifetimes conducted for all analyzed analogues in the full range of pH levels.
The methodology is presented and described in detail in
Section 3 (
Section 3.5). Fluorescence decay for TSF was single-exponential. The measured fluorescence lifetime was between 0.37 and 5.43 ns, depending on the pH of the solvent (the correlation is presented in
Figure S7). A clearly visible reduction of the fluorescence lifetime was observed for pH < 4.
The correlation between fluorescence decay and pH observed for TS is similar to that obtained for TSF. For pH <4, we recorded a significant reduction of the fluorescence lifetime. Moreover, for this analogue we observed two exponential fluorescence decay at pH = 2, which suggests the possible presence of more than one molecular form in the solution. The measured fluorescence lifetime for the main component, 1.64 ns, fits in well with the observed decrease of the parameter at low pH levels, with the share of this component estimated at 72%. The fluorescence lifetime recorded for the second component was considerably shorter (0.29 ns). At pH within the range of 4–12, the fluorescence lifetime for the TS analogue was decisively shorter than in the case of TSF but similarly to the latter, it remained at a roughly constant level.
In the entire range of pH values, the fluorescence lifetime recorded for TB was the shortest among all three analogues (0.1–0.18). In the case of this analogue, the second constituent, with the fluorescence decay time of 1.2 ns and relative share in total fluorescence estimated as 11%–20%, was observed both at low (pH = 2) and high (pH = 11,12) pH levels. Clearly, aggregation which triggers the effects associated with dual fluorescence takes place in TS and TSF in practically the whole range of pH values (the lifetime remains at a fairly constant level). For TB, at pH lower than 7, we observed a far more prominent presence of the second constituent in the overall lifetime, which indicates the existence of spectral forms other than aggregates. The reasonability of using fluorescence lifetime measurements in this paper is worth emphasizing. In particular, due to the process related CT, a significant increase in the average fluorescence lifetime is observed. Hence, the effect of dual fluorescence reported in this work, allowed for the discovery of noticeable changes in the fluorescence lifetime of the fluorophore, which together with noticeable aggregation processes, fully confirms our hypotheses.
To recapitulate the deliberations so far, it should be emphasized that (as largely corroborated by the results of quantum-mechanical calculations) effects observed in the case of TS and TSF molecules (in high concentrations) are triggered primarily by the intermolecular phenomenon of charge transfer (CT) enforced (or facilitated) in this particular case by the phenomenon of molecular aggregation of a given type (e.g., head to tail or card pack). Also, the structure of the substituent group on the side of the resorcylic system significantly influences the described overlap of two phenomena.
Figure 8 (and
Table 3) provides a schematic, structural presentation of the TS
− molecule, TSH molecule, TSH
2+ and sample TS dimer as optimized using B3LYP/aug-cc-pVDZ and polarizable continuum model (PCM) with water used as the solvent.
Table 4 summaries the main predictions regarding the excited state energetics of these species.
The main computational findings are as follows. Firstly, the TS molecule in the form of TS
−, TSH, and TSH
2+ has a single, low-lying and intensive excited state responsible for the shape of its absorption and emission spectra (
Table 3,
Figure 8A–C). However, in the case of the TSH molecule, the situation changes drastically. The TS molecule may form a hydrogen bond both within its own structure, which in itself affects its spectroscopic properties, as well as with the molecules of the medium. Hence the single intensive TS state is split in two in this case. This results in a more complex, dual structure of the TS absorption spectra, as observed in
Figure 1, where the absorption spectra reveal band widening on the long wave side. The subsequent analyzed TS dimer, (TSH)
2 is only one of many potentially possible types of aggregates (as already discussed and described above in the context of the experiments), therefore the results should be treated as only semi-quantitative (although significant as a theoretical confirmation of the experimental results). Nonetheless, the calculations offer a certain insight into the experimentally analyzed photophysics. As shown in
Figure 8, the structure of the TS dimer includes an intermolecular hydrogen bond, apart from the possible intramolecular hydrogen bonds characteristic of monomers. The interaction between monomers splits the two excited states of the TS molecule into four dimer states which transfer intensity onto the respective bands present in the fluorescence emission spectra (
Figure 3 and
Figure 4). This fact has a significant bearing on the absorption spectra and may in fact be key to the overall fluorescence behavior. In one of the discussed dimeric states the energy of vertical emission is very strongly shifted towards red (bolded in
Table 3), which may account for the observed dual fluorescence; the high energy band is monomeric whereas the low energy band is dimeric.
Also, it is worth mentioning that the dual fluorescence observed in the selected 1,3,4-thiadiazole analogues may occur via a pathway other than that proposed in this work (two independent modes of action may be possible). Based on the DFT calculations, the investigated compounds in their ground state occur solely as enol tautomers. Excitation of the enol form would likely enable an additional and independent process resulting in dual fluorescence emission. Once in the excited state either cis or trans-enol the enol form may tautomerize to the excited keto-form, which in turn may emit the long wavelength fluorescence.
Since the high concentrations are characteristic of aggregation-related dual fluorescence effects, this second and independent process may be dominant at low concentrations. The possibility of such mechanism is justified by the lack of clear differences between absorption spectra of the investigated derivatives recorded in series of various organic solvents. Moreover, according to our preliminary calculations, the energy differences between the excited enol and excited keto form are relatively small, which is consistent with the proposed relaxation pathway.
In a conclusion, the hypothetical second mechanism is proposed on the basis of preliminary calculations and relies upon an excitation of the neutral TS molecule, which in its ground state occurs as enol tautomer. The excitation of the enolic TS results either in straightforward fluorescence emission from the excited enol tautomer (higher energy emission band) or the excited keto tautomer is formed as result of proton (hydrogen) transfer from the phenolic –OH to the nearest thiadiazole nitrogen atom. The excited state of such keto tautomer is energetically similar to that of the excited enol and may emit photons manifesting as the second (lower energy) emission band, with subsequent return to the enolic form characteristic of the ground state.
The proton transfer into one of the nitrogen atoms is favored by the conformation in which the phenolic –OH resides near the N rather than S atom of the thiadiazole ring. Based on crystal structures reported to date [
7], such conformation is highly likely.

 ,
, 


