A Gene Signature of Survival Prediction for Kidney Renal Cell Carcinoma by Multi-Omic Data Analysis


Abstract
:1. Introduction
2. Results
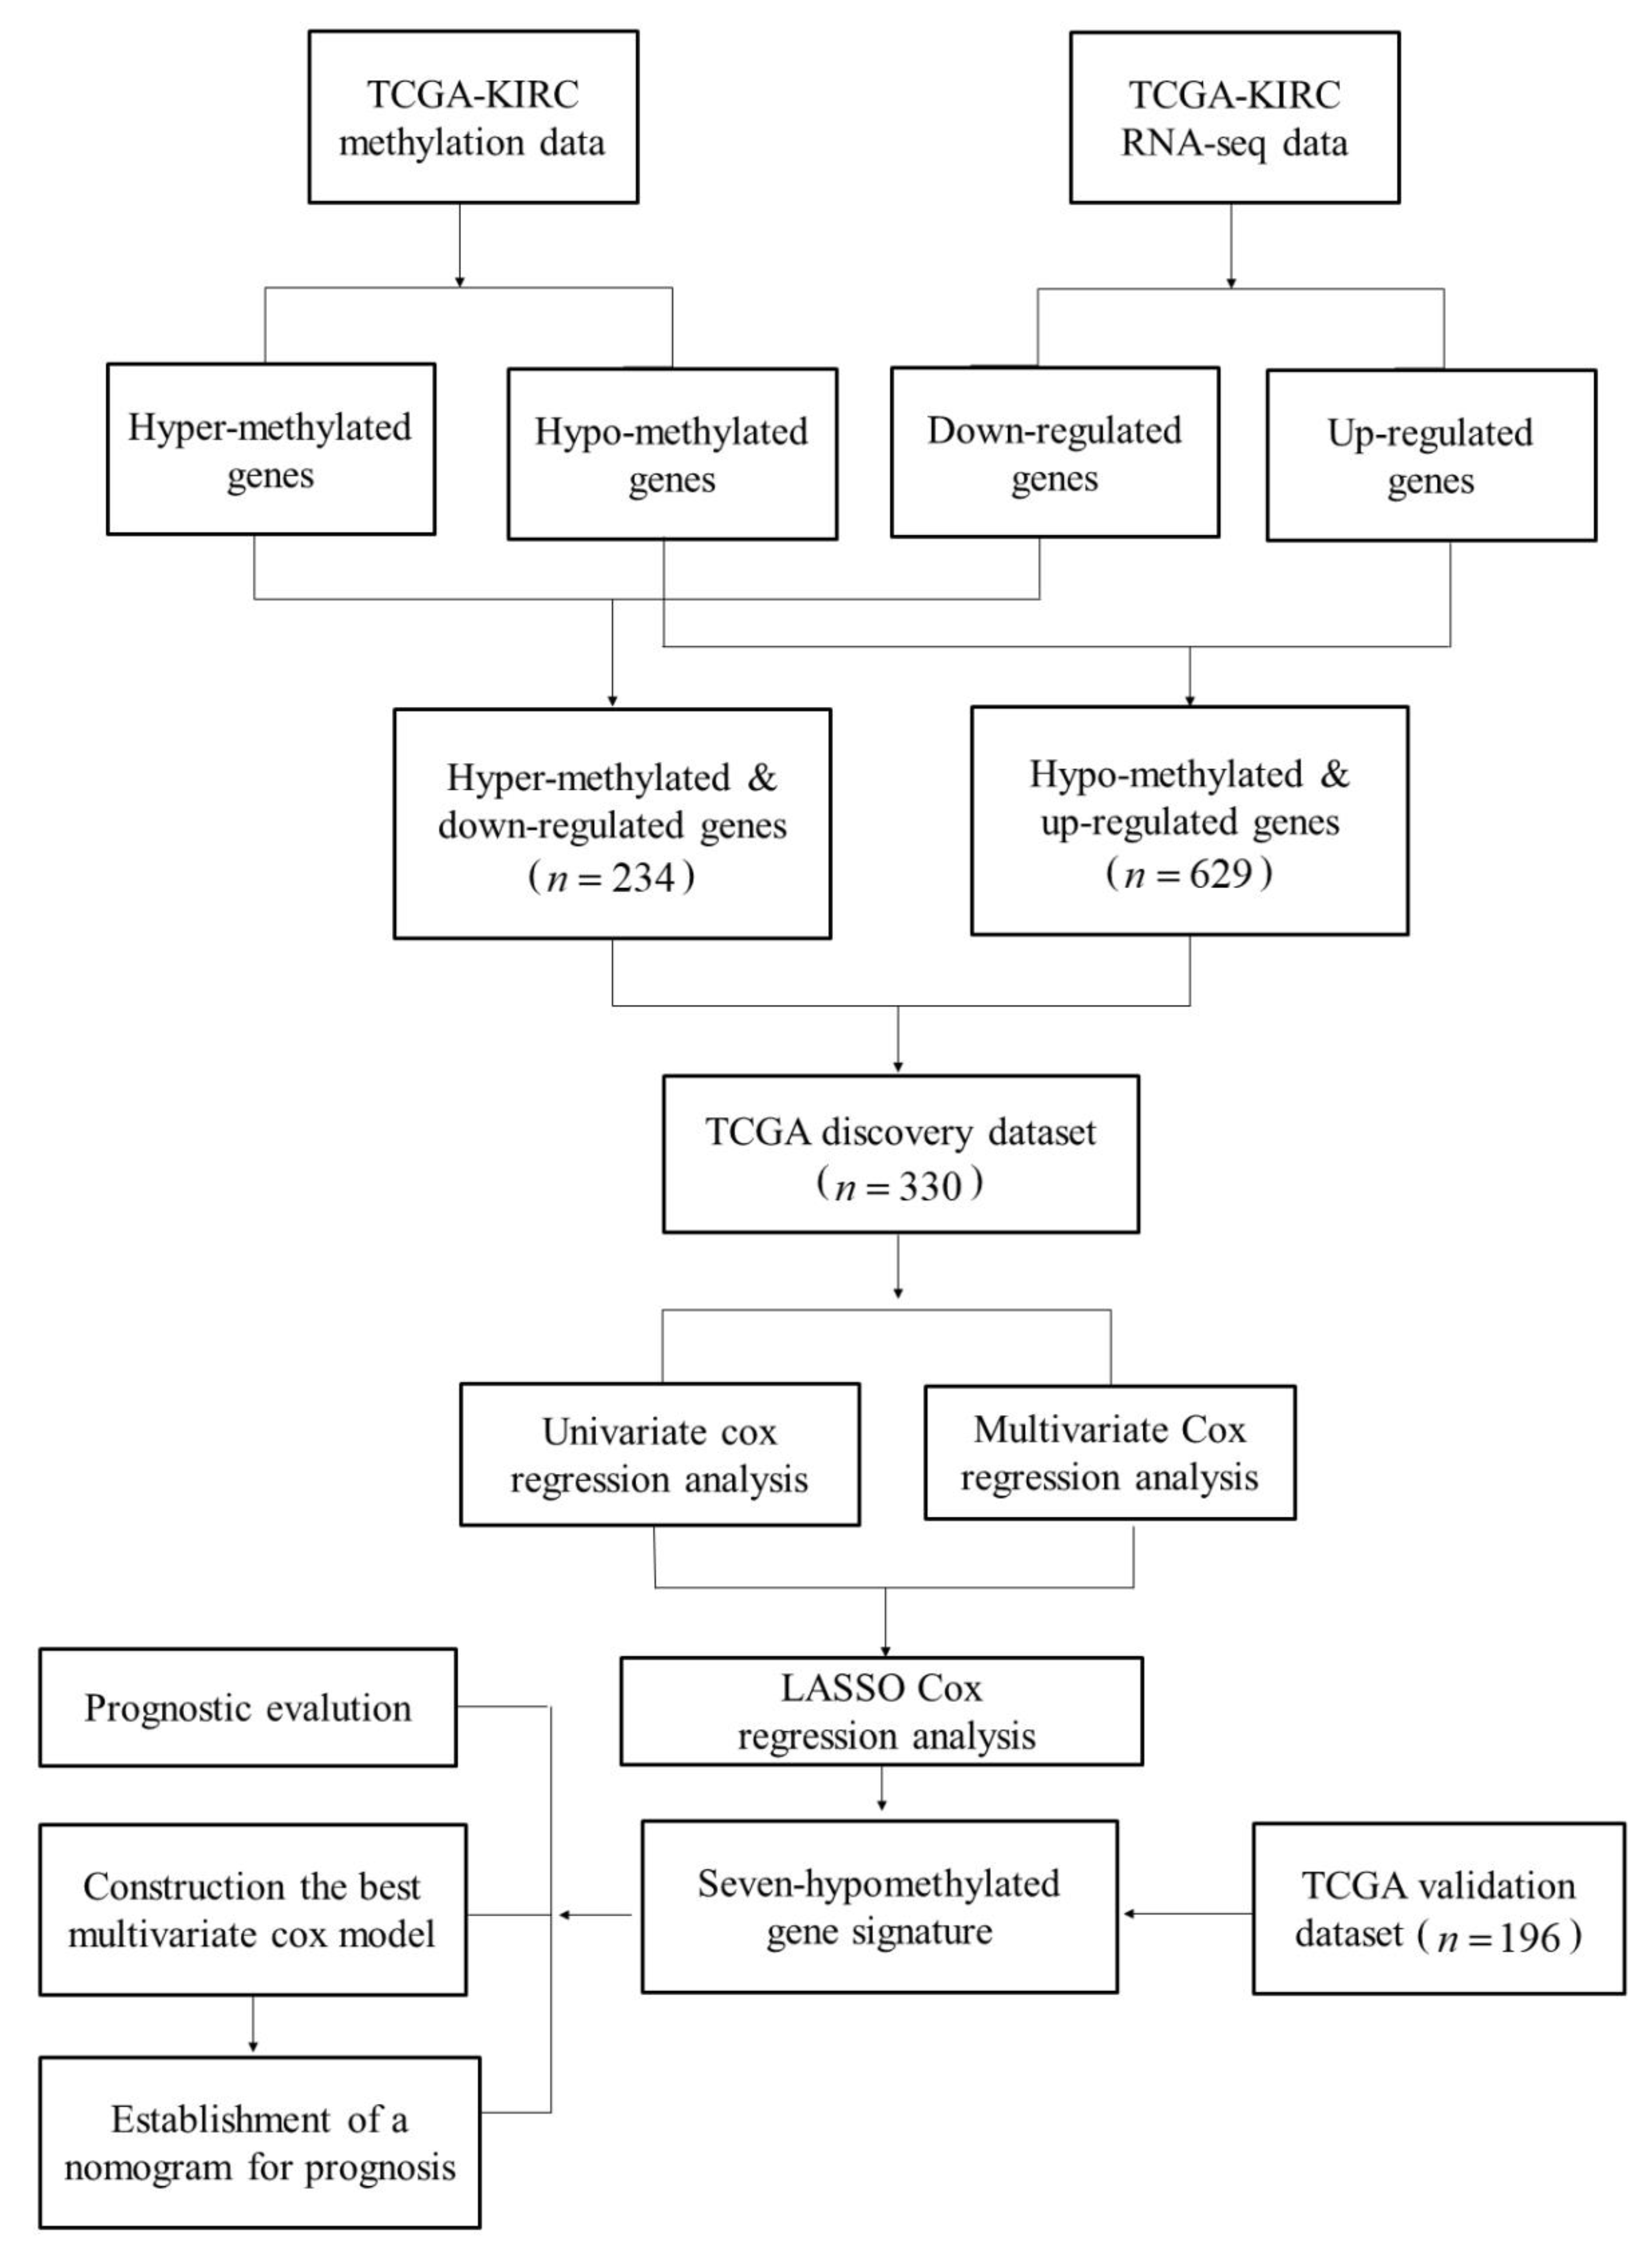
2.1. Summary of Datasets
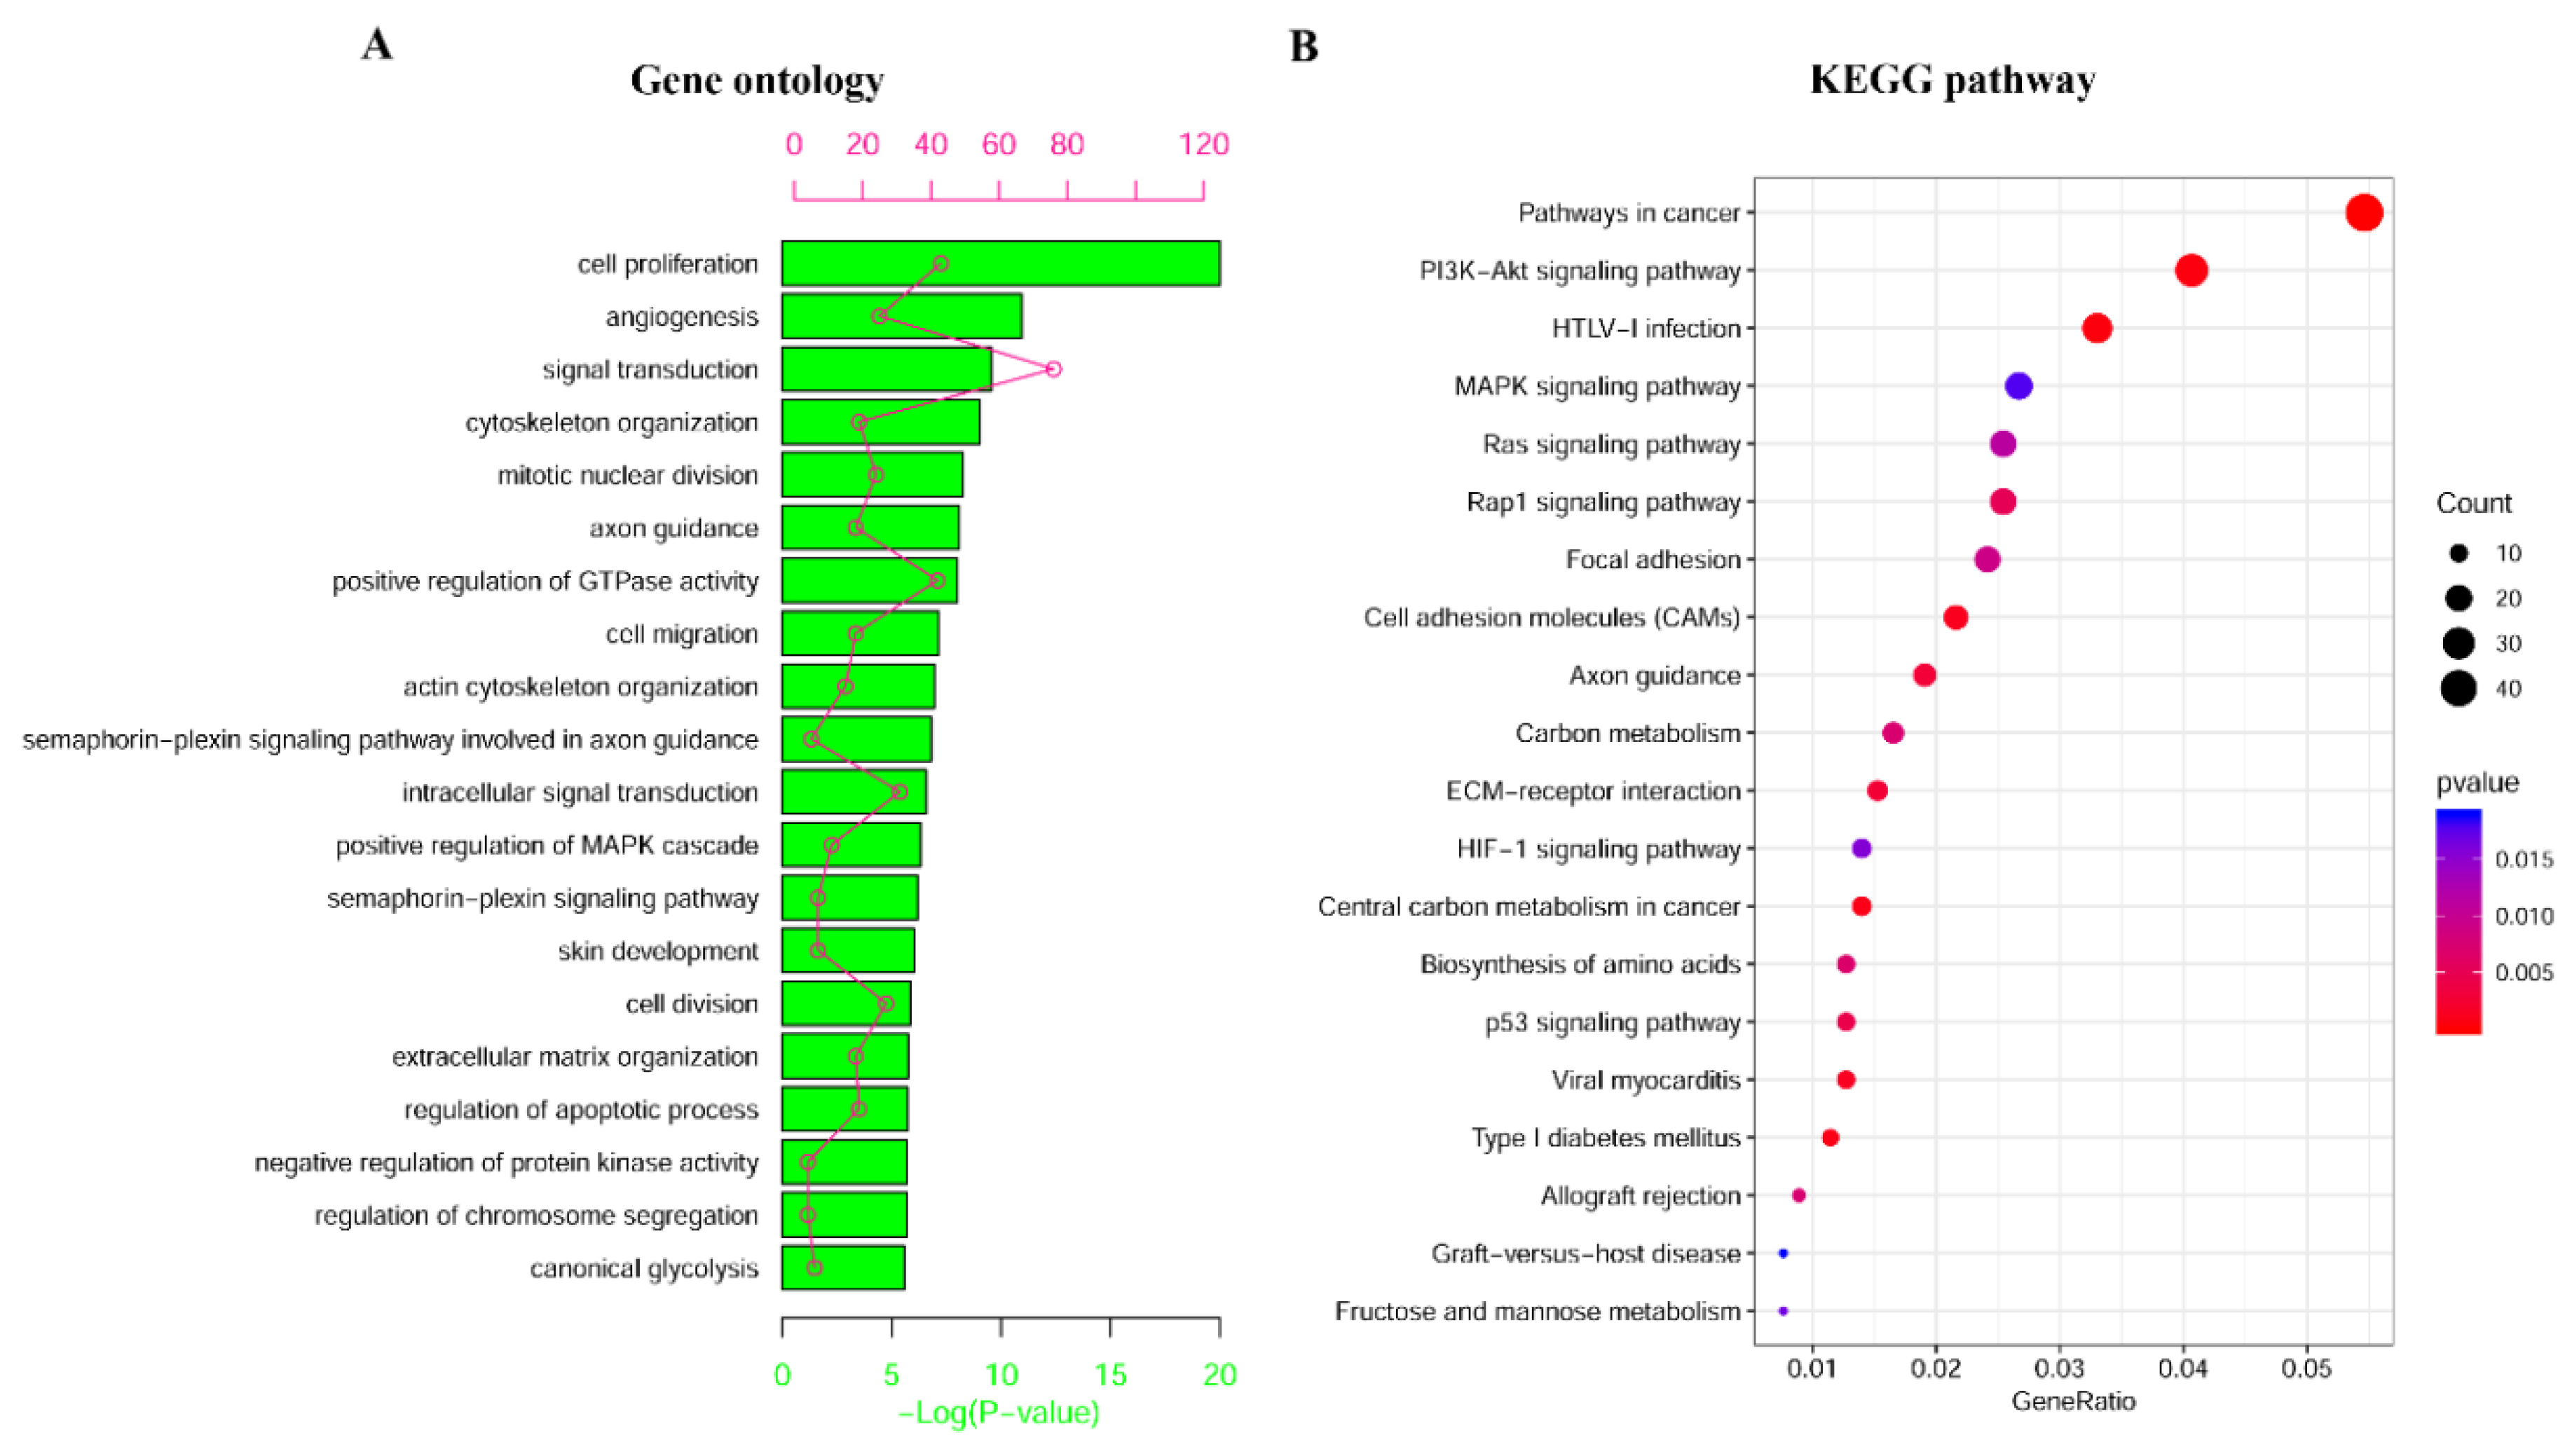
2.2. Identification and Enrichment Analysis of Methylated Differentially Expressed Genes (MDEGs) in Kidney Renal Cell Carcinoma (KIRC)
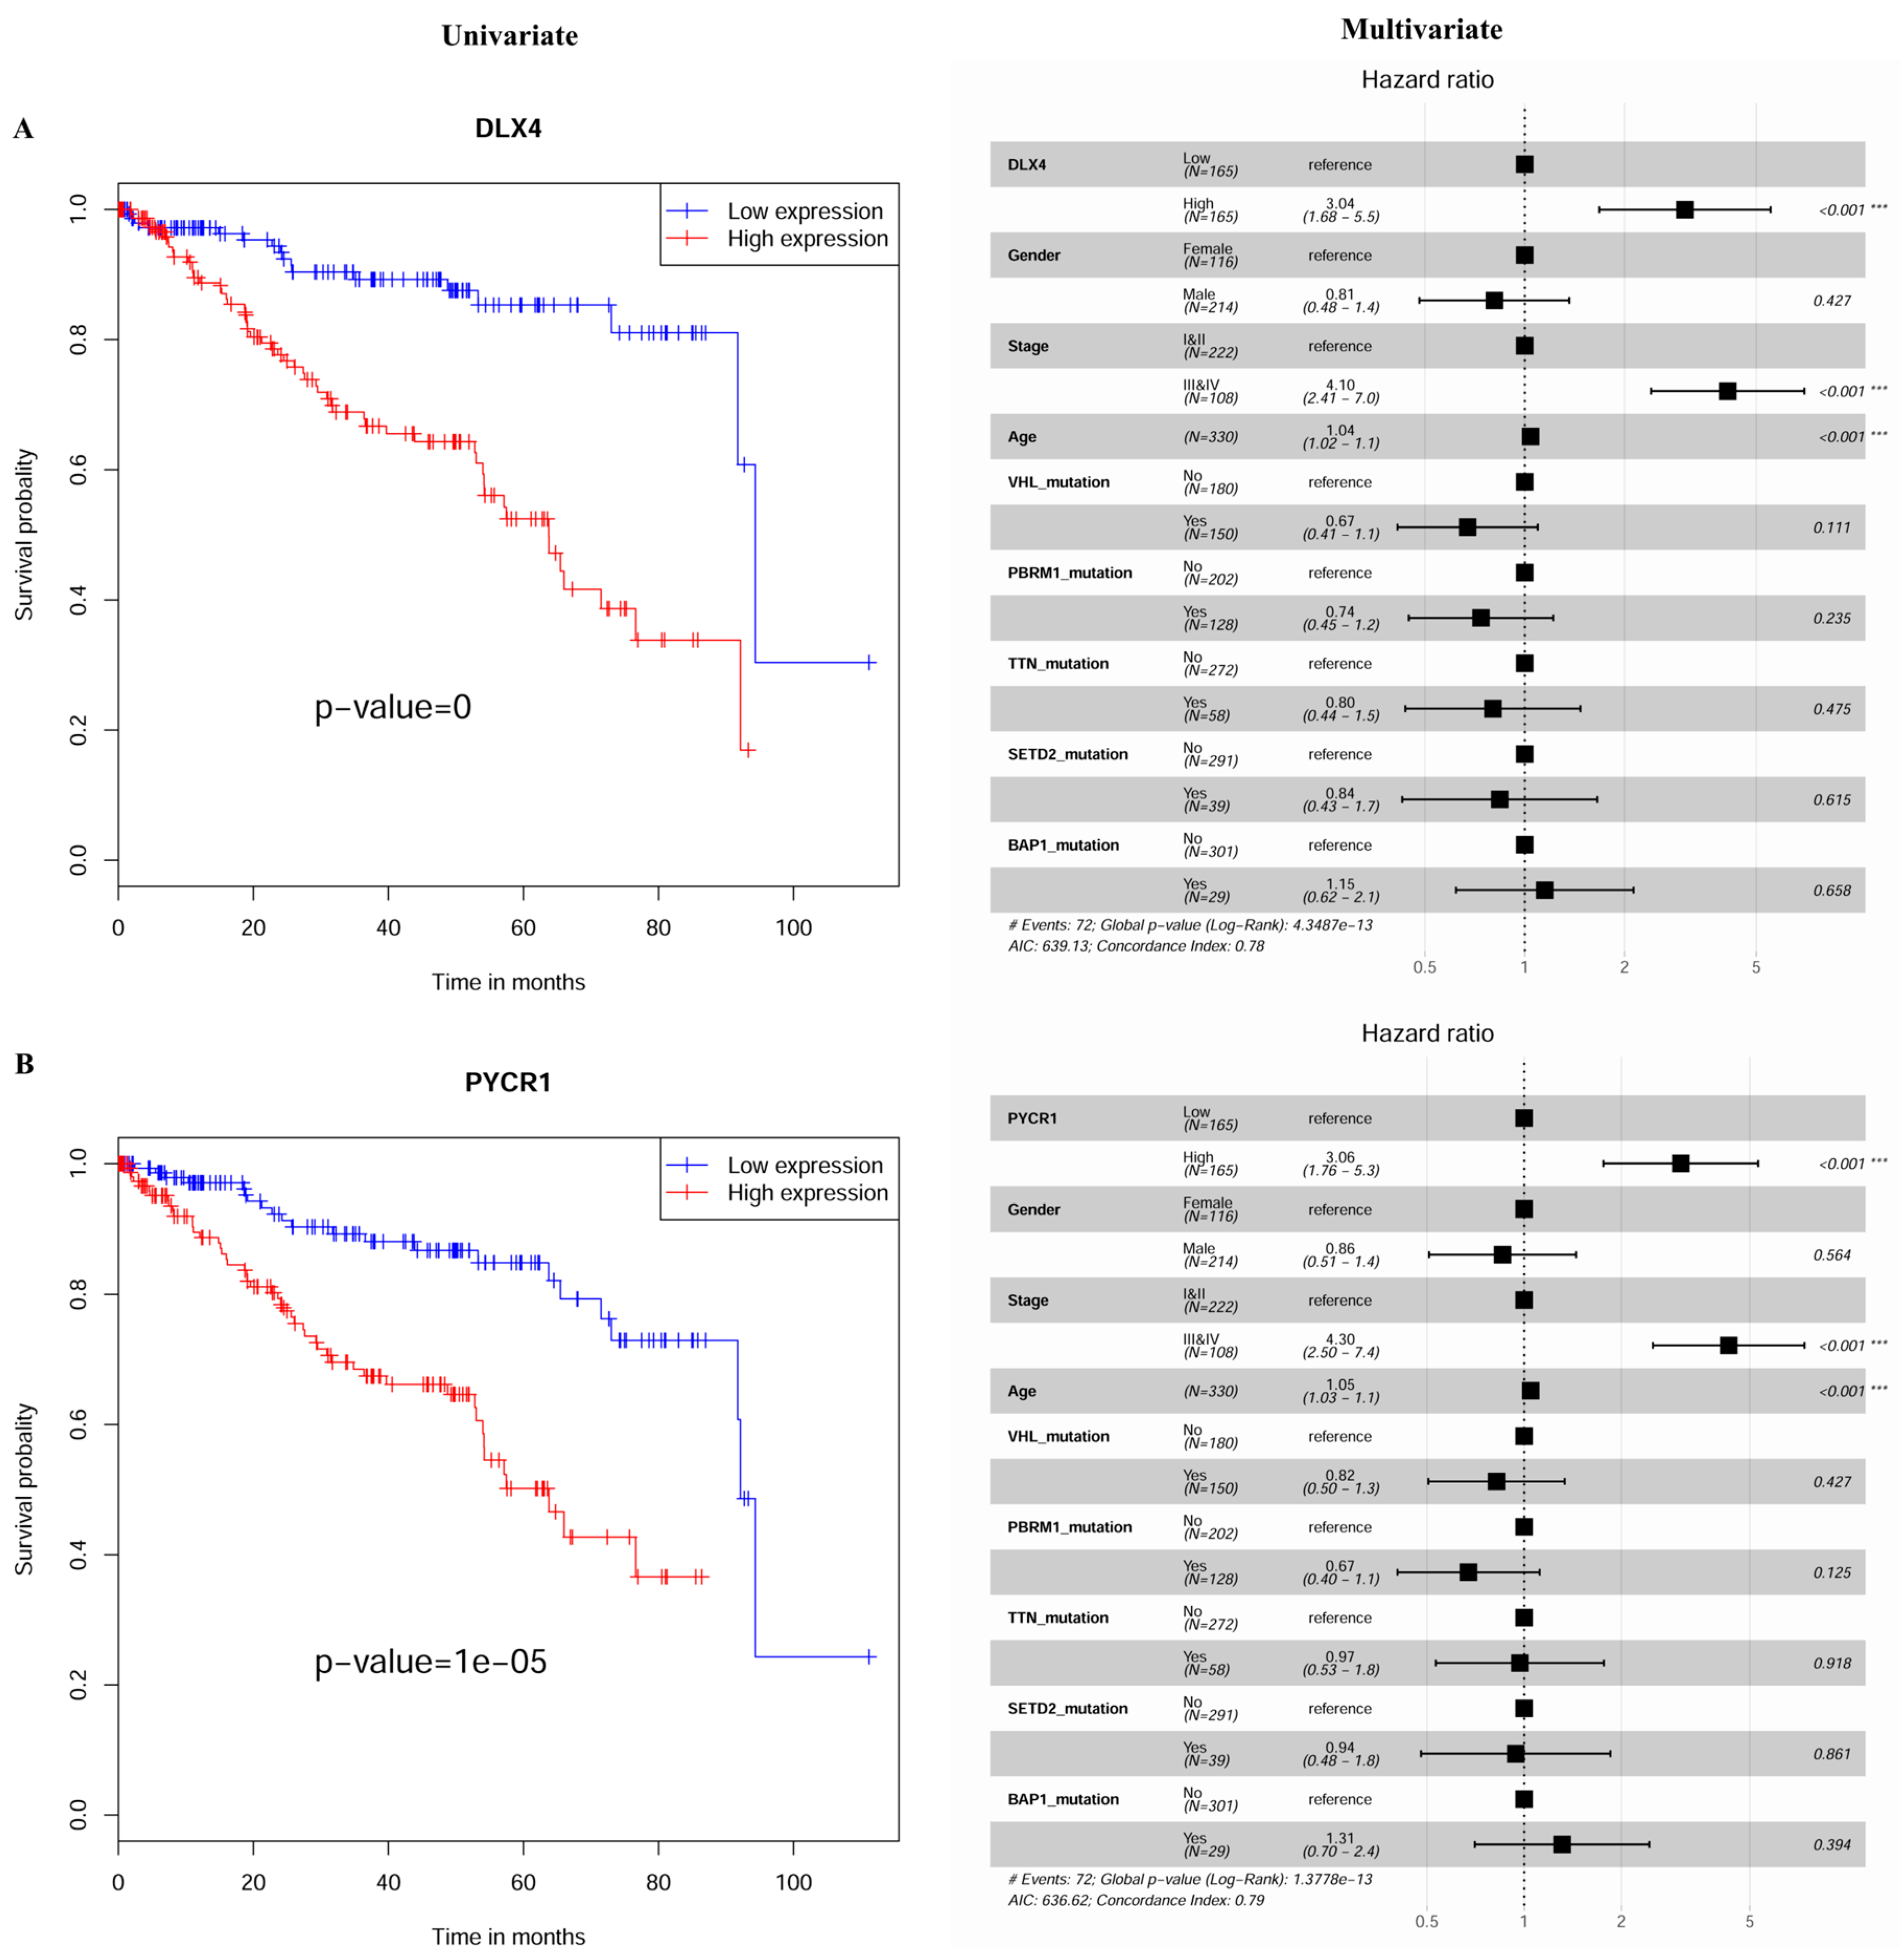
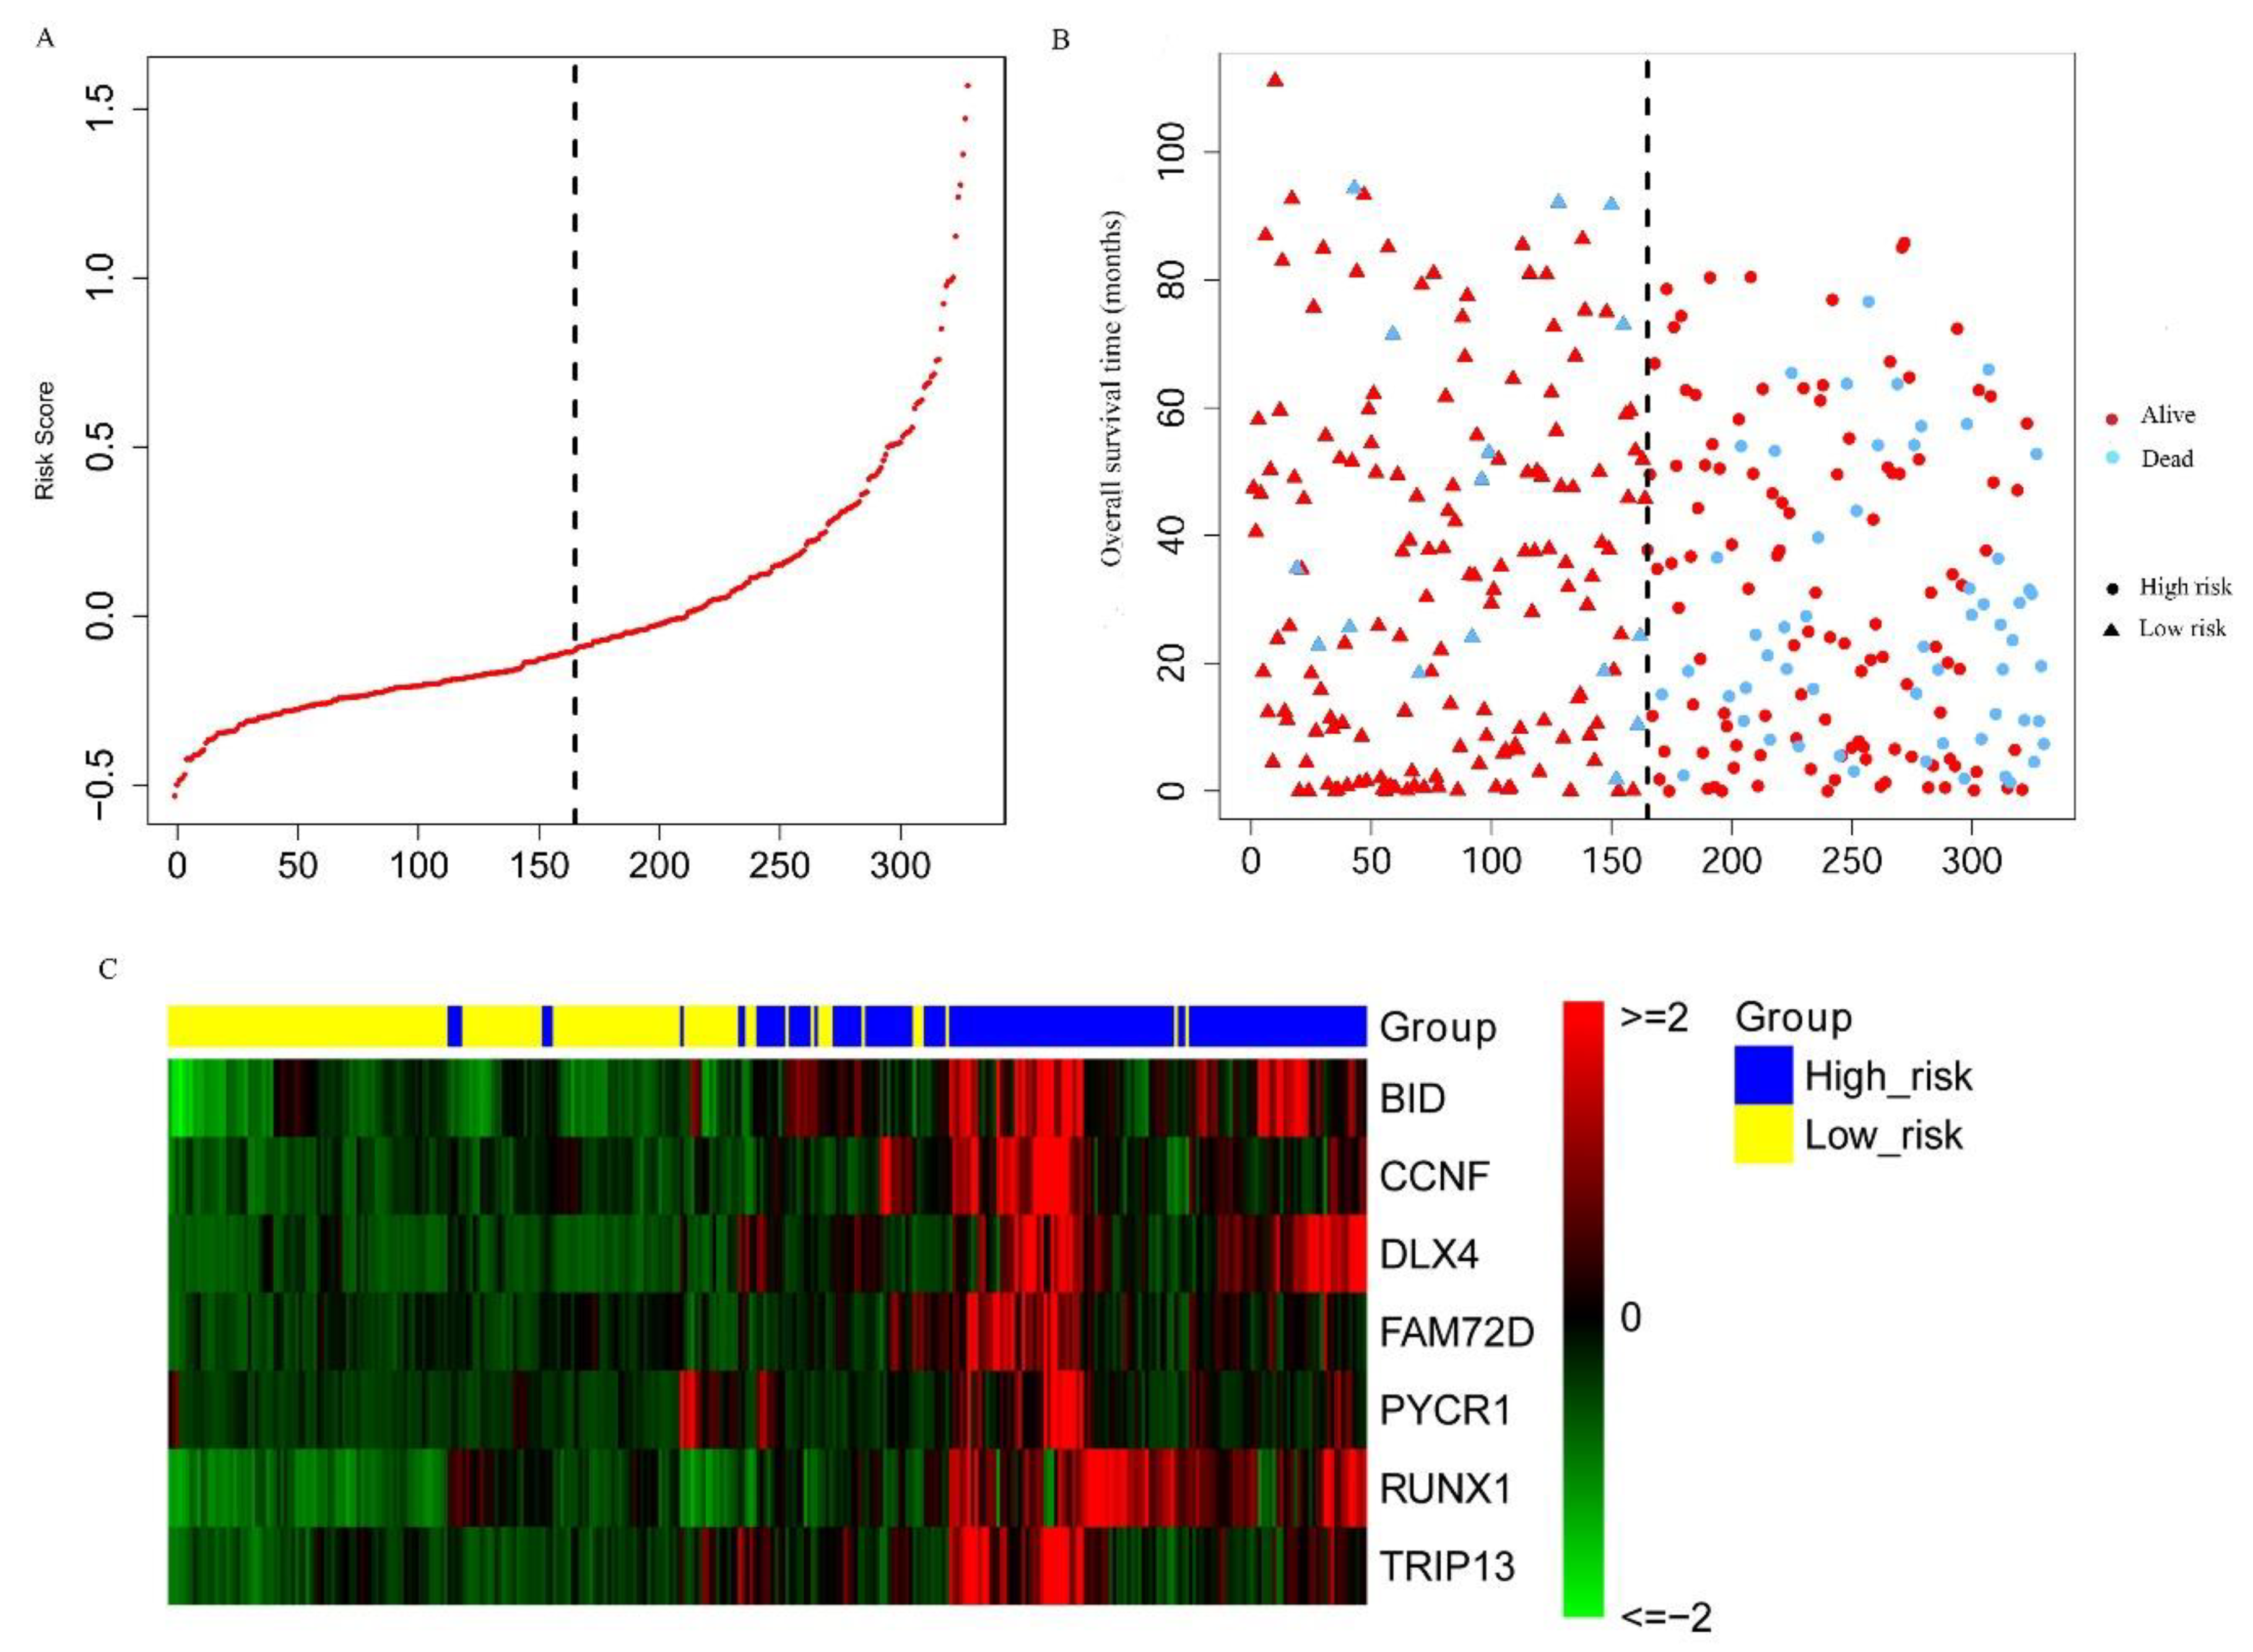
2.3. Construction and Assessment of a Prognostic Risk score Model for KIRC
2.4. Establishment of a Nomogram for Overall Survival (OS) Prediction in KIRC
3. Discussion
4. Materials and Methods
4.1. Datasets and Networks
4.2. Identification of Differentially Expressed Genes (DEGs) with an Altered DNA Methylation Status in KIRC
4.3. Functional and Pathway Enrichment Analyses
4.4. Establishment of the MDEG Signature for Prognosis of KIRC
4.5. Statistical Analysis
5. Conclusions
Supplementary Materials
Author Contributions
Funding
Conflicts of Interest
References
- Shuch, B.; Amin, A.; Armstrong, A.J.; Eble, J.N.; Ficarra, V.; Lopez-Beltran, A.; Martignoni, G.; Rini, B.I.; Kutikov, A. Understanding pathologic variants of renal cell carcinoma: Distilling therapeutic opportunities from biologic complexity. Eur. Urol. 2015, 67, 85–97. [Google Scholar] [CrossRef] [PubMed]
- Gray, E.R.; Harris, G.T. Renal Cell Carcinoma: Diagnosis and Management. Am. Fam. Phys. 2019, 99, 179–184. [Google Scholar]
- Shen, C.; Kaelin, W.G., Jr. The VHL/HIF axis in clear cell renal carcinoma. Semin. Cancer Biol. 2013, 23, 18–25. [Google Scholar] [CrossRef] [PubMed]
- Nyhan, M.J.; O’Sullivan, G.C.; McKenna, S.L. Role of the VHL (von Hippel-Lindau) gene in renal cancer: A multifunctional tumour suppressor. Biochem. Soc. Trans. 2008, 36, 472–478. [Google Scholar] [CrossRef] [PubMed]
- Atkins, M.B.; Tannir, N.M. Current and emerging therapies for first-line treatment of metastatic clear cell renal cell carcinoma. Cancer Treat. Rev. 2018, 70, 127–137. [Google Scholar] [CrossRef]
- Alonso-Gordoa, T.; Garcia-Bermejo, M.L.; Grande, E.; Garrido, P.; Carrato, A.; Molina-Cerrillo, J. Targeting tyrosine kinases in renal cell carcinoma: ‘New Bullets against Old Guys’. Int. J. Mol. Sci. 2019, 20, 1901. [Google Scholar] [CrossRef]
- Bihr, S.; Ohashi, R.; Moore, A.L.; Ruschoff, J.H.; Beisel, C.; Hermanns, T.; Mischo, A.; Corro, C.; Beyer, J.; Beerenwinkel, N.; et al. Expression and mutation patterns of PBRM1, BAP1 and SETD2 mirror specific evolutionary subtypes in clear cell renal cell carcinoma. Neoplasia 2019, 21, 247–256. [Google Scholar] [CrossRef]
- Kim, B.J.; Kim, J.H.; Kim, H.S.; Zang, D.Y. Prognostic and predictive value of VHL gene alteration in renal cell carcinoma: A meta-analysis and review. Oncotarget 2017, 8, 13979–13985. [Google Scholar] [CrossRef]
- Wang, X.Y.; Wang, Z.; Huang, J.B.; Ren, X.D.; Ye, D.; Zhu, W.W.; Qin, L.X. Tissue-specific significance of BAP1 gene mutation in prognostic prediction and molecular taxonomy among different types of cancer. Tumour Biol. 2017, 39. [Google Scholar] [CrossRef]
- Liu, L.; Guo, R.B.; Zhang, X.; Liang, Y.R.; Kong, F.; Wang, J.; Xu, Z.H. Loss of SETD2, but not H3K36me3, correlates with aggressive clinicopathological features of clear cell renal cell carcinoma patients. Biosci. Trends 2017, 11, 214–220. [Google Scholar] [CrossRef]
- Wang, Z.; Peng, S.; Guo, L.; Xie, H.; Wang, A.; Shang, Z.; Niu, Y. Prognostic and clinicopathological value of PBRM1 expression in renal cell carcinoma. Clin. Chim. Acta 2018, 486, 9–17. [Google Scholar] [CrossRef] [PubMed]
- Frank, I.; Blute, M.L.; Cheville, J.C.; Lohse, C.M.; Weaver, A.L.; Zincke, H. An outcome prediction model for patients with clear cell renal cell carcinoma treated with radical nephrectomy based on tumor stage, size, grade and necrosis: The SSIGN score. J. Urol. 2002, 168, 2395–2400. [Google Scholar] [CrossRef]
- Martinez-Salamanca, J.I.; Huang, W.C.; Millan, I.; Bertini, R.; Bianco, F.J.; Carballido, J.A.; Ciancio, G.; Hernandez, C.; Herranz, F.; Haferkamp, A.; et al. International renal cell carcinoma-venous thrombus, prognostic impact of the 2009 UICC/AJCC TNM staging system for renal cell carcinoma with venous extension. Eur. Urol. 2011, 59, 120–127. [Google Scholar] [CrossRef] [PubMed]
- Li, P.; Liu, J.; Li, J.; Liu, P. DNA methylation of CRB3 is a prognostic biomarker in clear cell renal cell carcinoma. Mol. Biol. Rep. 2019, 46, 4377–4383. [Google Scholar] [CrossRef]
- Ricketts, C.J.; Hill, V.K.; Linehan, W.M. Tumor-Specific hypermethylation of epigenetic biomarkers, including SFRP1, predicts for poorer survival in patients from the TCGA Kidney Renal Clear Cell Carcinoma (KIRC) project. PLoS ONE 2014, 9, e85621. [Google Scholar] [CrossRef]
- Kim, Y.J.; Jang, W.; Piao, X.M.; Yoon, H.Y.; Byun, Y.J.; Kim, J.S.; Kim, S.M.; Lee, S.K.; Seo, S.P.; Kang, H.W.; et al. ZNF492 and GPR149 methylation patterns as prognostic markers for clear cell renal cell carcinoma: Arraybased DNA methylation profiling. Oncol. Rep. 2019, 42, 453–460. [Google Scholar] [CrossRef]
- Wang, Y.; Ruan, Z.; Yu, S.; Tian, T.; Liang, X.; Jing, L.; Li, W.; Wang, X.; Xiang, L.; Claret, F.X.; et al. A four-methylated mRNA signature-based risk score system predicts survival in patients with hepatocellular carcinoma. Aging 2019, 11, 160–173. [Google Scholar] [CrossRef]
- Chen, H.M.; Kong, Y.; Yao, Q.; Zhang, X.; Fu, Y.N.; Li, J.; Liu, C.; Wang, Z. Three hypomethylated genes were associated with poor overall survival in pancreatic cancer patients. Aging 2019, 11, 885–897. [Google Scholar] [CrossRef]
- Gao, Z.; Zhang, D.; Duan, Y.; Yan, L.; Fan, Y.D.; Fang, Z.Q.; Liu, Z.X. A five-gene signature predicts overall survival of patients with papillary renal cell carcinoma. PLoS ONE 2019, 14, e0211491. [Google Scholar] [CrossRef]
- Wu, J.; Jin, S.; Gu, W.; Wan, F.; Zhang, H.; Shi, G.; Qu, Y.; Ye, D. Construction and validation of a 9-gene signature for predicting prognosis in stage III clear cell renal cell carcinoma. Front. Oncol. 2019, 9, 152. [Google Scholar] [CrossRef]
- Huang, Z.; Zhan, X.; Xiang, S.; Johnson, T.S.; Helm, B.; Yu, C.Y.; Zhang, J.; Salama, P.; Rizkalla, M.; Han, Z.; et al. SALMON: Survival analysis learning with multi-omics neural networks on breast cancer. Front. Genet. 2019, 10, 166. [Google Scholar] [CrossRef] [PubMed]
- Mishra, N.K.; Southekal, S.; Guda, C. Survival analysis of multi-omics data identifies potential prognostic markers of pancreatic ductal adenocarcinoma. Front. Genet. 2019, 10, 624. [Google Scholar] [CrossRef] [PubMed]
- Benjamini, Y.; Hochberg, Y. Controlling the false discovery rate: A practical and powerful approach to multiple testing. J. Royal Stat. Soc. Ser. B 1995, 57, 289–300. [Google Scholar] [CrossRef]
- Love, M.I.; Huber, W.; Anders, S. Moderated estimation of fold change and dispersion for RNA-seq data with DESeq2. Genome Biol. 2014, 15, 550. [Google Scholar] [CrossRef]
- Martini, M.; de Santis, M.C.; Braccini, L.; Gulluni, F.; Hirsch, E. PI3K/AKT signaling pathway and cancer: An updated review. Ann. Med. 2014, 46, 372–383. [Google Scholar] [CrossRef]
- Guo, H.; German, P.; Bai, S.; Barnes, S.; Guo, W.; Qi, X.; Lou, H.; Liang, J.; Jonasch, E.; Mills, G.B.; et al. The PI3K/AKT pathway and renal cell carcinoma. J. Genet. Genom. 2015, 42, 343–353. [Google Scholar] [CrossRef]
- Okegawa, T.; Pong, R.C.; Li, Y.; Hsieh, J.T. The role of cell adhesion molecule in cancer progression and its application in cancer therapy. Acta Biochim. Pol. 2004, 51, 445–457. [Google Scholar]
- Nagata, M.; Sakurai-Yageta, M.; Yamada, D.; Goto, A.; Ito, A.; Fukuhara, H.; Kume, H.; Morikawa, T.; Fukayama, M.; Homma, Y.; et al. Aberrations of a cell adhesion molecule CADM4 in renal clear cell carcinoma. Int. J. Cancer 2012, 130, 1329–1337. [Google Scholar] [CrossRef]
- Pupa, S.M.; Menard, S.; Forti, S.; Tagliabue, E. New insights into the role of extracellular matrix during tumor onset and progression. J. Cell. Physiol. 2002, 192, 259–267. [Google Scholar] [CrossRef]
- Grieshammer, U.; Le, M.; Plump, A.S.; Wang, F.; Tessier-Lavigne, M.; Martin, G.R. SLIT2-mediated ROBO2 signaling restricts kidney induction to a single site. Dev. Cell 2004, 6, 709–717. [Google Scholar] [CrossRef]
- Gurova, K.V.; Hill, J.E.; Razorenova, O.V.; Chumakov, P.M.; Gudkov, A.V. P53 pathway in renal cell carcinoma is repressed by a dominant mechanism. Cancer Res. 2004, 64, 1951–1958. [Google Scholar] [CrossRef] [PubMed]
- Zhang, Y.L.; Wang, R.C.; Cheng, K.; Ring, B.Z.; Su, L. Roles of Rap1 signaling in tumor cell migration and invasion. Cancer Biol. Med. 2017, 14, 90–99. [Google Scholar] [PubMed]
- Hakimi, A.A.; Reznik, E.; Lee, C.H.; Creighton, C.J.; Brannon, A.R.; Luna, A.; Aksoy, B.A.; Liu, E.M.; Shen, R.; Lee, W.; et al. An integrated metabolic atlas of clear cell renal cell carcinoma. Cancer Cell 2016, 29, 104–116. [Google Scholar] [CrossRef] [PubMed] [Green Version]
- Maziveyi, M.; Alahari, S.K. Cell matrix adhesions in cancer: The proteins that form the glue. Oncotarget 2017, 8, 48471–48487. [Google Scholar] [CrossRef] [PubMed] [Green Version]
- Zenonos, K.; Kyprianou, K. RAS signaling pathways, mutations and their role in colorectal cancer. World J. Gastrointest. Oncol. 2013, 5, 97–101. [Google Scholar] [CrossRef] [PubMed]
- Gudas, L.J.; Fu, L.; Minton, D.R.; Mongan, N.P.; Nanus, D.M. The role of HIF1α in renal cell carcinoma tumorigenesis. J. Mol. Med. 2014, 92, 825–836. [Google Scholar] [CrossRef] [PubMed]
- Salinas-Sanchez, A.S.; Serrano-Oviedo, L.; Nam-Cha, S.Y.; Roche-Losada, O.; Sanchez-Prieto, R.; Gimenez-Bachs, J.M. Prognostic value of the VHL, HIF-1 alpha, and VEGF signaling pathway and associated MAPK (ERK1/2 and ERK5) pathways in clear-cell renal cell carcinoma: A long-term study. Clin. Genitourin. Cancer 2017, 15, E923–E933. [Google Scholar] [CrossRef]
- Huang, D.; Ding, Y.; Luo, W.M.; Bender, S.; Qian, C.N.; Kort, E.; Zhang, Z.F.; VandenBeldt, K.; Duesbery, N.S.; Resau, J.H.; et al. Inhibition of MAPK kinase signaling pathways suppressed renal cell carcinoma growth and angiogenesis in vivo. Cancer Res. 2008, 68, 81–88. [Google Scholar] [CrossRef] [Green Version]
- Tun, H.W.; Marlow, L.A.; von Roemeling, C.A.; Cooper, S.J.; Kreinest, P.; Wu, K.; Luxon, B.A.; Sinha, M.; Anastasiadis, P.Z.; Copland, J.A. Pathway signature and cellular differentiation in clear cell renal cell carcinoma. PLoS ONE 2010, 5, e10696. [Google Scholar] [CrossRef]
- Kantari, C.; Walczak, H. Caspase-8 and Bid: Caught in the act between death receptors and mitochondria. Biochimica Biophysica Acta Mol. Cell Res. 2011, 1813, 558–563. [Google Scholar] [CrossRef] [Green Version]
- Liu, Y.; Bertram, C.C.; Shi, Q.; Zinkel, S.S. Proapoptotic Bid mediates the Atr-directed DNA damage response to replicative stress. Cell Death Differ. 2011, 18, 841–852. [Google Scholar] [CrossRef] [PubMed]
- Orzechowska, E.J.; Girstun, A.; Staron, K.; Trzcinska-Danielewicz, J. Synergy of BID with doxorubicin in the killing of cancer cells. Oncol. Rep. 2015, 33, 2143–2150. [Google Scholar] [CrossRef] [PubMed]
- Gobe, G.; Rubin, M.; Williams, G.; Sawczuk, I.; Buttyan, R. Apoptosis and expression of Bcl-2, Bcl-XL, and Bax in renal cell carcinomas. Cancer Investig. 2002, 20, 324–332. [Google Scholar] [CrossRef] [PubMed]
- Sinicrope, F.A.; Rego, R.L.; Foster, N.R.; Thibodeau, S.N.; Alberts, S.R.; Windschitl, H.E.; Sargent, D.J. Proapoptotic Bad and Bid protein expression predict survival in stages II and III colon cancers. Clin. Cancer Res. 2008, 14, 4128–4133. [Google Scholar] [CrossRef] [Green Version]
- Fu, J.; Qiu, H.; Cai, M.; Pan, Y.; Cao, Y.; Liu, L.; Yun, J.; Zhang, C.Z. Low cyclin F expression in hepatocellular carcinoma associates with poor differentiation and unfavorable prognosis. Cancer Sci. 2013, 104, 508–515. [Google Scholar] [CrossRef]
- Deshmukh, R.S.; Das, S. Cyclin F controls glioma progression by regulation of IDH1-R132H expression. Ann. Oncol. 2017, 28, 174. [Google Scholar] [CrossRef]
- Gagat, M.; Krajewski, A.; Grzanka, D.; Grzanka, A. Potential role of cyclin F mRNA expression in the survival of skin melanoma patients: Comprehensive analysis of the pathways altered due to cyclin F upregulation. Oncol. Rep. 2018, 40, 123–144. [Google Scholar] [CrossRef] [Green Version]
- Jeong, J.; Naab, T.J.; Fernandez, A.I.; Ongkeko, M.S.; Makambi, K.H.; Blancato, J.K. Homeoprotein DLX4 expression is increased in inflammatory breast cancer cases from an urban African-American population. Oncotarget 2018, 9, 31253–31263. [Google Scholar] [CrossRef]
- Haga, S.B.; Fu, S.; Karp, J.E.; Ross, D.D.; Williams, D.M.; Hankins, W.D.; Behm, F.; Ruscetti, F.W.; Chang, M.; Smith, B.D.; et al. BP1, a new homeobox gene, is frequently expressed in acute leukemias. Leukemia 2000, 14, 1867–1875. [Google Scholar] [CrossRef] [Green Version]
- Schwartz, A.M.; Man, Y.G.; Rezaei, M.K.; Simmens, S.J.; Berg, P.E. BP1, a homeoprotein, is significantly expressed in prostate adenocarcinoma and is concordant with prostatic intraepithelial neoplasia. Mod. Pathol. 2009, 22, 1–6. [Google Scholar] [CrossRef]
- Hara, F.; Samuel, S.; Liu, J.; Rosen, D.; Langley, R.R.; Naora, H. A homeobox gene related to Drosophila distal-less promotes ovarian tumorigenicity by inducing expression of vascular endothelial growth factor and fibroblast growth factor-2. Am. J. Pathol. 2007, 170, 1594–1606. [Google Scholar] [CrossRef] [PubMed] [Green Version]
- Yu, M.; Wan, Y.; Zou, Q. Prognostic significance of BP1 mRNA expression level in patients with non-small cell lung cancer. Clin. Biochem. 2008, 41, 824–830. [Google Scholar] [CrossRef] [PubMed]
- Zhang, L.; Yang, M.; Gan, L.; He, T.; Xiao, X.; Stewart, M.D.; Liu, X.; Yang, L.; Zhang, T.; Zhao, Y.; et al. DLX4 upregulates TWIST and enhances tumor migration, invasion and metastasis. Int. J. Biol. Sci. 2012, 8, 1178–1187. [Google Scholar] [CrossRef] [PubMed]
- Rahane, C.S.; Kutzner, A.; Heese, K. A cancer tissue-specific FAM72 expression profile defines a novel glioblastoma multiform (GBM) gene-mutation signature. J. Neurooncol. 2019, 141, 57–70. [Google Scholar] [CrossRef] [PubMed]
- Dastsooz, H.; Cereda, M.; Donna, D.; Oliviero, S. A comprehensive bioinformatics analysis of UBE2C in cancers. Int. J. Mol. Sci. 2019, 20, 2228. [Google Scholar] [CrossRef] [Green Version]
- Possemato, R.; Marks, K.M.; Shaul, Y.D.; Pacold, M.E.; Kim, D.; Birsoy, K.; Sethumadhavan, S.; Woo, H.K.; Jang, H.G.; Jha, A.K.; et al. Functional genomics reveal that the serine synthesis pathway is essential in breast cancer. Nature 2011, 476, 346–350. [Google Scholar] [CrossRef] [Green Version]
- Ernst, T.; Hergenhahn, M.; Kenzelmann, M.; Cohen, C.D.; Bonrouhi, M.; Weninger, A.; Klaren, R.; Grone, E.F.; Wiesel, M.; Gudemann, C.; et al. Decrease and gain of gene expression are equally discriminatory markers for prostate carcinoma: A gene expression analysis on total and microdissected prostate tissue. Am. J. Pathol. 2002, 160, 2169–2180. [Google Scholar] [CrossRef]
- Wang, D.; Wang, L.; Zhang, Y.; Yan, Z.; Liu, L.; Chen, G. PYCR1 promotes the progression of non-small-cell lung cancer under the negative regulation of miR-488. Biomed. Pharmacother. 2019, 111, 588–595. [Google Scholar] [CrossRef]
- Zeng, T.; Zhu, L.; Liao, M.; Zhuo, W.; Yang, S.; Wu, W.; Wang, D. Knockdown of PYCR1 inhibits cell proliferation and colony formation via cell cycle arrest and apoptosis in prostate cancer. Med. Oncol. 2017, 34, 27. [Google Scholar] [CrossRef]
- Ding, J.; Kuo, M.L.; Su, L.; Xue, L.; Luh, F.; Zhang, H.; Wang, J.; Lin, T.G.; Zhang, K.; Chu, P.; et al. Human mitochondrial pyrroline-5-carboxylate reductase 1 promotes invasiveness and impacts survival in breast cancers. Carcinogenesis 2017, 38, 519–531. [Google Scholar] [CrossRef]
- Sakakura, C.; Hagiwara, A.; Mivagawa, K.; Nakashima, S.; Yoshikawa, T.; Kin, S.; Nakase, Y.; Ito, K.; Yamagishi, H.; Yazumi, S.; et al. Frequent downregulation of the runt domain transcription factors RUNX1, RUNX3 and their cofactor CBFB in gastric cancer. Int. J. Cancer 2005, 113, 221–228. [Google Scholar]
- Miyagawa, K.; Sakakura, C.; Nakashima, S.; Yoshikawa, T.; Kin, S.; Nakase, Y.; Ito, K.; Yamagishi, H.; Ida, H.; Yazumi, S.; et al. Down-regulation of RUNX1, RUNX3 and CBFbeta in hepatocellular carcinomas in an early stage of hepatocarcinogenesis. Anticancer Res. 2006, 26, 3633–3643. [Google Scholar] [PubMed]
- Huang, S.P.; Lan, Y.H.; Lu, T.L.; Pao, J.B.; Chang, T.Y.; Lee, H.Z.; Yang, W.H.; Hsieh, C.J.; Chen, L.M.; Huang, L.C.; et al. Clinical significance of runt-related transcription factor 1 polymorphism in prostate cancer. BJU Int. 2011, 107, 486–492. [Google Scholar] [CrossRef] [PubMed]
- Slattery, M.L.; Lundgreen, A.; Herrick, J.S.; Caan, B.J.; Potter, J.D.; Wolff, R.K. Associations between genetic variation in RUNX1, RUNX2, RUNX3, MAPK1 and eIF4E and risk of colon and rectal cancer: Additional support for a TGF-beta-signaling pathway. Carcinogenesis 2011, 32, 318–326. [Google Scholar] [CrossRef]
- Xiong, Z.; Yu, H.; Ding, Y.; Feng, C.; Wei, H.; Tao, S.; Huang, D.; Zheng, S.L.; Sun, J.; Xu, J.; et al. RNA sequencing reveals upregulation of RUNX1-RUNX1T1 gene signatures in clear cell renal cell carcinoma. Biomed. Res. Int. 2014, 2014, 450621. [Google Scholar] [CrossRef] [Green Version]
- Galichon, P. Epithelial signaling through the RUNX1/AKT Pathway: A new therapeutic target in kidney fibrosis. Ebiomedicine 2018, 32, 5. [Google Scholar] [CrossRef]
- Sheng, N.Q.; Yan, L.; Wu, K.; You, W.Q.; Gong, J.F.; Hu, L.D.; Tan, G.W.; Chen, H.Q.; Wang, Z.G. TRIP13 promotes tumor growth and is associated with poor prognosis in colorectal cancer. Cell Death Dis. 2018, 9, 402. [Google Scholar] [CrossRef]
- Dong, L.M.; Ding, H.L.; Li, Y.P.; Xue, D.W.; Li, Z.; Liu, Y.L.; Zhang, T.; Zhou, J.; Wang, P. TRIP13 is a predictor for poor prognosis and regulates cell proliferation, migration and invasion in prostate cancer. Int. J. Biol. Macromol. 2019, 121, 200–206. [Google Scholar] [CrossRef]
- Yao, J.N.; Zhang, X.X.; Li, J.H.; Zhao, D.Y.; Gao, B.; Zhou, H.N.; Gao, S.L.; Zhang, L.F. Silencing TRIP13 inhibits cell growth and metastasis of hepatocellular carcinoma by activating of TGF-beta 1/smad3. Cancer Cell Int. 2018, 18, 208. [Google Scholar] [CrossRef]
- Pressly, J.D.; Hama, T.; Brien, S.O.; Regner, K.R.; Park, F. TRIP13-deficient tubular epithelial cells are susceptible to apoptosis following acute kidney injury. Sci. Rep. 2017, 7, 43196. [Google Scholar] [CrossRef] [Green Version]
- Rothman, K.J. No adjustments are needed for multiple comparisons. Epidemiology 1990, 1, 43–46. [Google Scholar] [CrossRef] [PubMed] [Green Version]
- Peduzzi, P.; Concato, J.; Feinstein, A.R.; Holford, T.R. Importance of events per independent variable in proportional hazards regression analysis. II. Accuracy and precision of regression estimates. J. Clin. Epidemiol. 1995, 48, 1503–1510. [Google Scholar] [CrossRef]
- Vittinghoff, E.; McCulloch, C.E. Relaxing the rule of ten events per variable in logistic and cox regression. Am. J. Epidemiol. 2007, 165, 710–718. [Google Scholar] [CrossRef] [PubMed] [Green Version]
- Tian, Y.; Morris, T.J.; Webster, A.P.; Yang, Z.; Beck, S.; Feber, A.; Teschendorff, A.E. ChAMP: Updated methylation analysis pipeline for Illumina BEADCHIPS. Bioinformatics 2017, 33, 3982–3984. [Google Scholar] [CrossRef] [PubMed] [Green Version]
- Morris, T.J.; Butcher, L.M.; Feber, A.; Teschendorff, A.E.; Chakravarthy, A.R.; Wojdacz, T.K.; Beck, S. ChAMP: 450k chip analysis methylation pipeline. Bioinformatics 2014, 30, 428–430. [Google Scholar] [CrossRef]
- Huang Da, W.; Sherman, B.T.; Lempicki, R.A. Systematic and integrative analysis of large gene lists using DAVID bioinformatics resources. Nat. Protoc. 2009, 4, 44–57. [Google Scholar] [CrossRef]
- Valentini, V.; van Stiphout, R.G.; Lammering, G.; Gambacorta, M.A.; Barba, M.C.; Bebenek, M.; Bonnetain, F.; Bosset, J.F.; Bujko, K.; Cionini, L.; et al. Nomograms for predicting local recurrence, distant metastases, and overall survival for patients with locally advanced rectal cancer on the basis of European randomized clinical trials. J. Clin. Oncol. 2011, 29, 3163–3172. [Google Scholar] [CrossRef]


| Characteristic | TCGA Discovery Dataset (n = 330) | TCGA Validation Dataset (n = 196) | ||
|---|---|---|---|---|
| No. | % | No. | % | |
| Status | ||||
| Alive | 258 | 78.2 | 109 | 55.6 |
| Dead | 72 | 21.8 | 87 | 44.4 |
| Sex | ||||
| Male | 214 | 64.8 | 127 | 64.8 |
| Female | 116 | 35.2 | 69 | 35.2 |
| Tumor stage | ||||
| Stages I and II | 222 | 67.3 | 98 | 50.0 |
| Stages III and IV | 108 | 32.7 | 98 | 50.0 |
| Age, years | ||||
| Median | 60 | — | 62 | — |
| Range | 26–90 | — | 34–85 | — |
| Non-silent mutations in VHL (Von Hippel–Lindau Tumor Suppressor) | ||||
| Yes | 150 | 45.5 | — | — |
| No | 180 | 54.5 | — | — |
| Non-silent mutations in PBRM1 (Polybromo 1) | ||||
| Yes | 128 | 38.8 | — | — |
| No | 202 | 61.2 | — | — |
| Non-silent mutations in TTN (Titin) | ||||
| Yes | 58 | 17.6 | — | — |
| No | 272 | 82.4 | — | — |
| Non-silent mutations in SETD2 (SET Domain Containing 2) | ||||
| Yes | 39 | 11.8 | — | — |
| No | 291 | 88.2 | — | — |
| Non-silent mutations in BAP1 (BRCA1 Associated Protein 1) | ||||
| Yes | 29 | 8.8 | — | — |
| No | 301 | 91.2 | — | — |
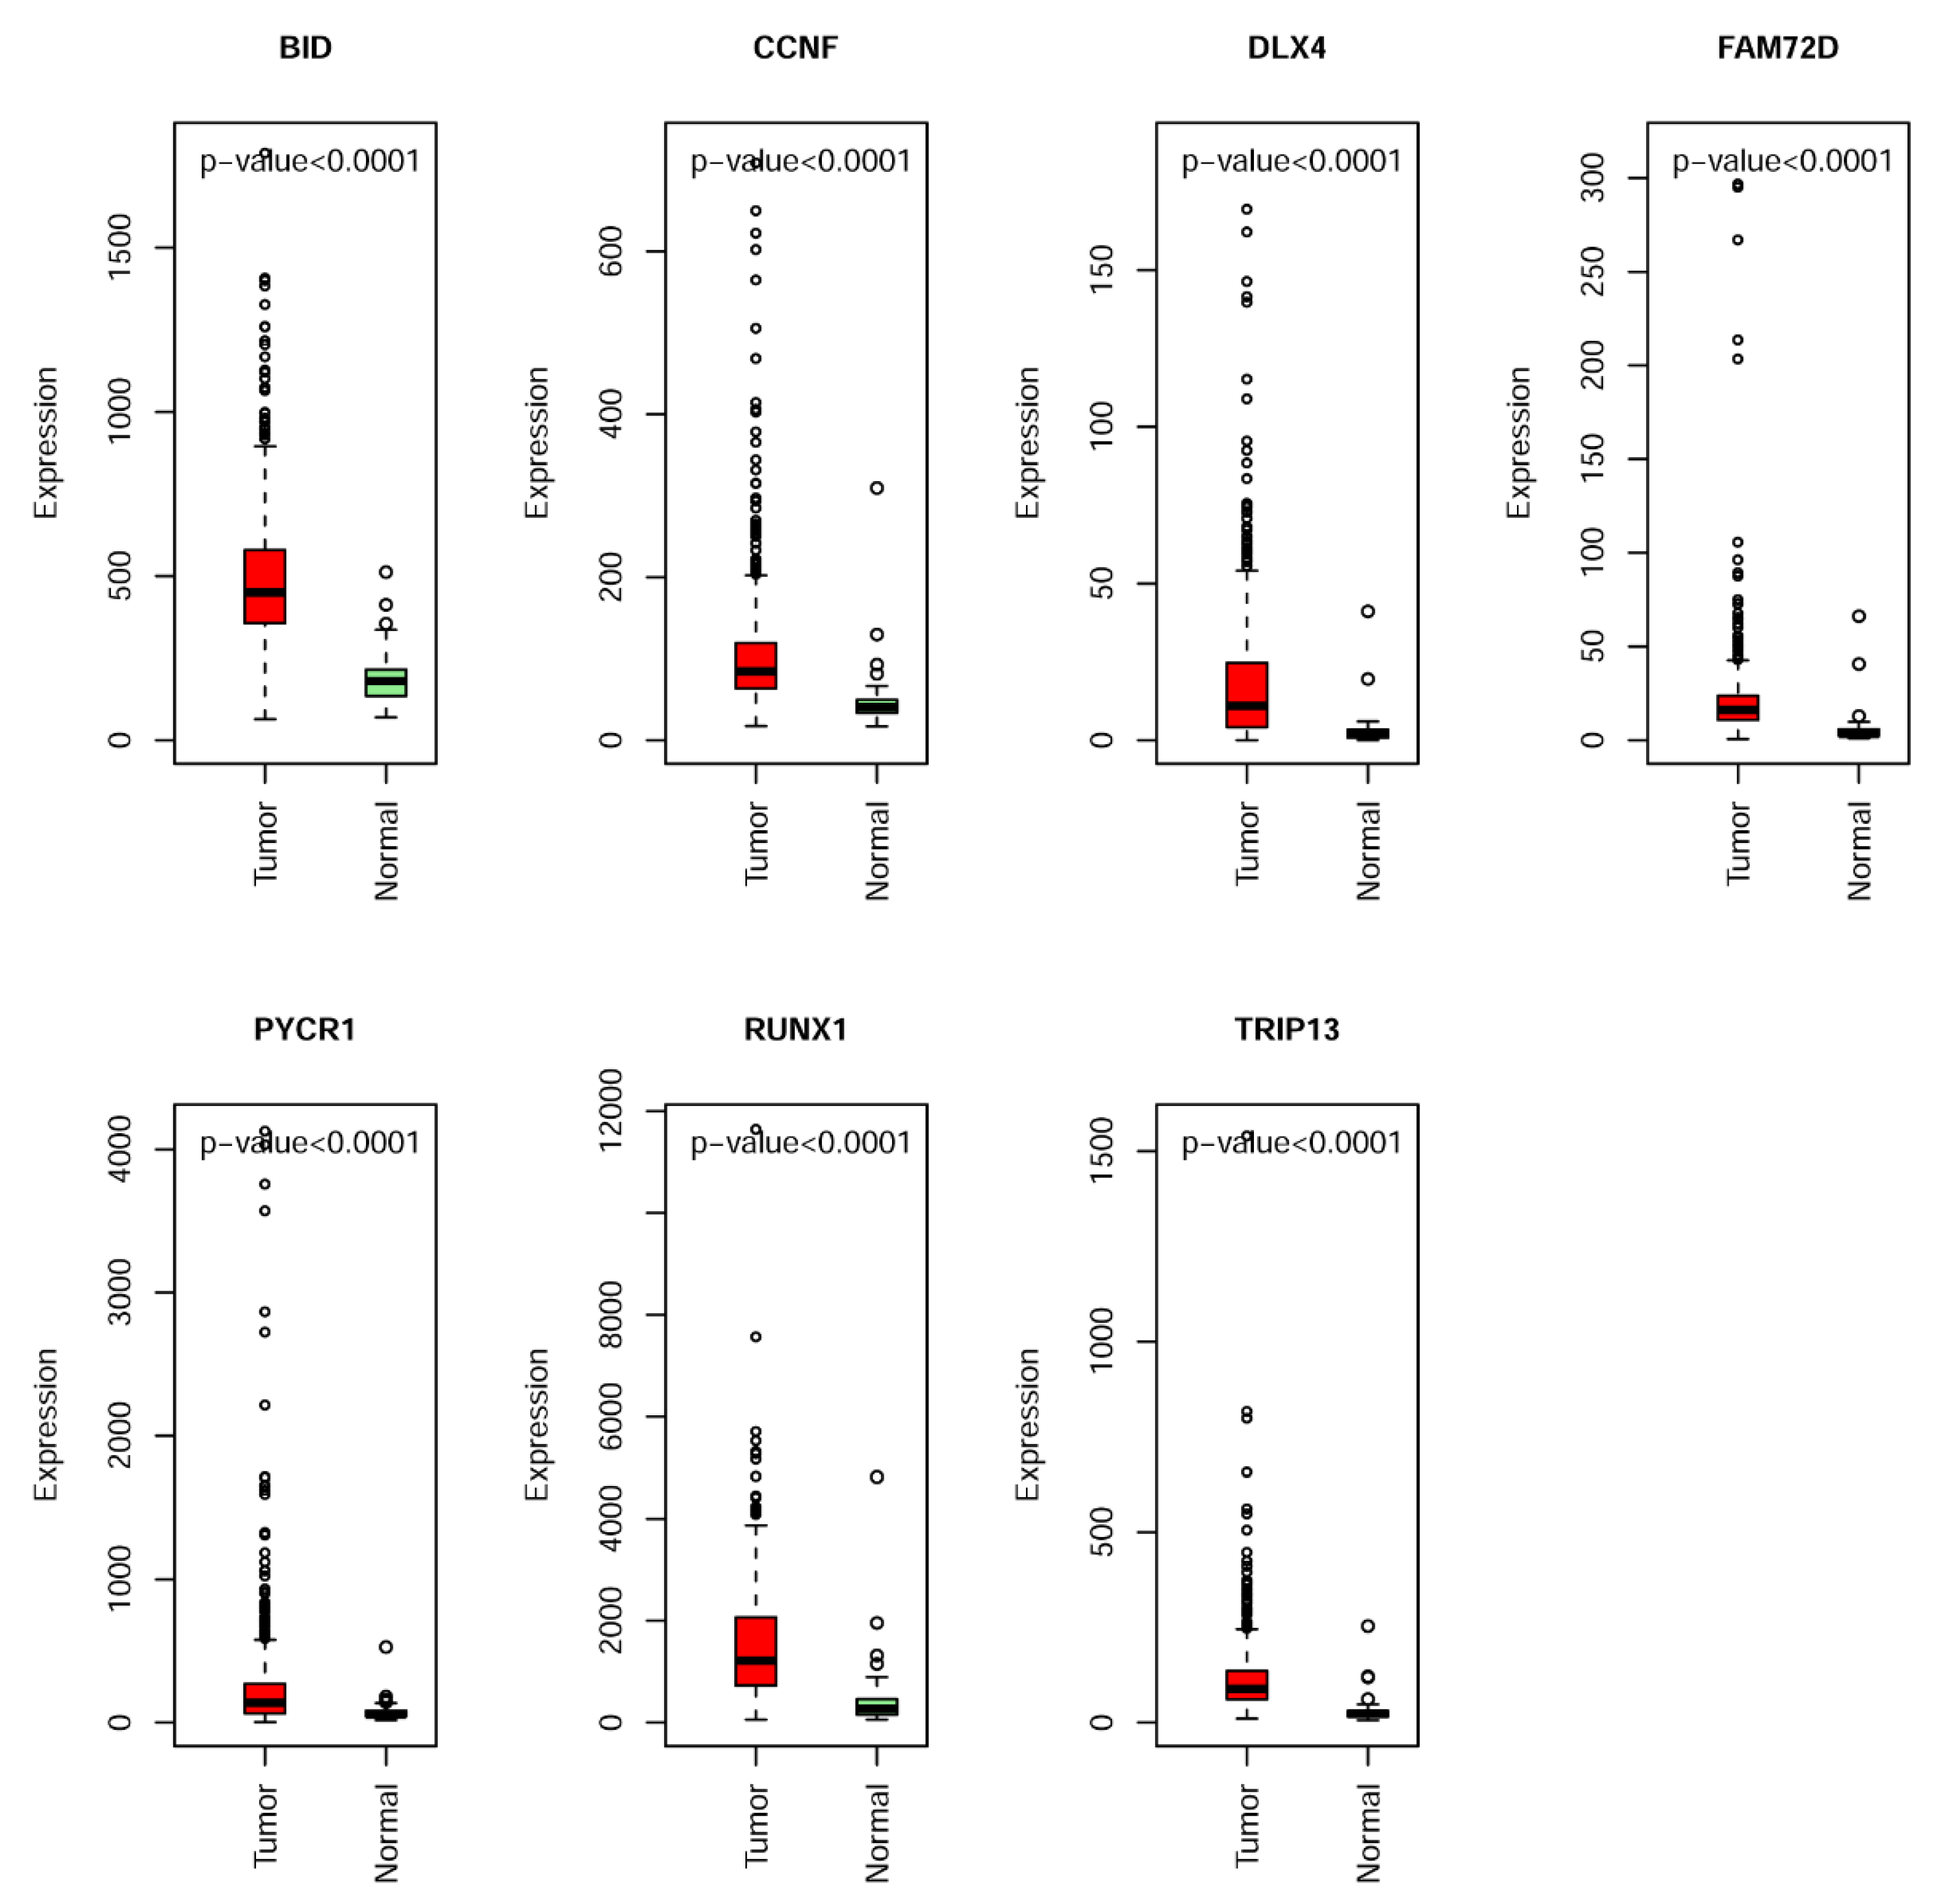
| No. | Genes | Description | Univariate Analysis | Multivariate Analysis |
|---|---|---|---|---|
| Modality p Value | Modality p Value | |||
| 1 | BID | BH3 Interacting Domain Death Agonist | 6.50 × 10⁻⁴ | 0.025 |
| 2 | CCNF | Cyclin F | 8.00 × 10⁻⁵ | 0.001 |
| 3 | DLX4 | Distal-Less Homeobox 4 | 0 | <0.001 |
| 4 | FAM72D | Family with Sequence Similarity 72 Member D | 4.74 × 10⁻³ | 0.011 |
| 5 | PYCR1 | Pyrroline-5-Carboxylate Reductase 1 | 1.00 × 10⁻⁵ | <0.001 |
| 6 | RUNX1 | Runt Related Transcription Factor 1 | 4.00 × 10⁻⁵ | <0.001 |
| 7 | TRIP13 | Thyroid Hormone Receptor Interactor 13 | 1.40 × 10⁻⁴ | 0.009 |
| Variables | Univariate Analysis | Best Multivariate Model | |||||||
|---|---|---|---|---|---|---|---|---|---|
| Value | HR | 95%C.I. | Modality | Model | HR | 95%C.I. | modality | model | |
| p Value | p Value | p Value | p Value | ||||||
| (Wald) | (Log-Rank) | (Wald) | (Log-Rank) | ||||||
| Tumor stage (ref = I and II) | III and IV | 4.69 | 2.84–7.75 | 1.48 × 10⁻⁹ | 3.00 × 10⁻¹¹ | 3.47 | 2.06–5.84 | 2.80 × 10⁻⁶ | <2.00 × 10⁻¹⁶ |
| Age | — | 1.04 | 1.02–1.06 | 2.25 × 10⁻⁵ | 2.00 × 10⁻⁵ | 1.04 | 1.02–1.07 | 3.62 × 10⁻⁵ | |
| Risk group (Ref = low risk) | High risk | 5.15 | 2.81–9.45 | 1.17 × 10⁻⁷ | 4.00 × 10⁻⁹ | 3.92 | 2.08–7.38 | 2.25 × 10⁻⁵ | |
| Non-silent mutations in VHL (ref = No) | Yes | 0.77 | 0.48–1.23 | 0.28 | 0.3 | 0.68 | 0.43–1.10 | 0.11 | |
| Non-silent mutations in PBRM1 (ref = No) | Yes | 0.83 | 0.51–1.34 | 0.44 | 0.4 | ||||
| Non-silent mutations in TTN (ref = No) | Yes | 1.24 | 0.70–2.21 | 0.46 | 0.5 | ||||
| Non-silent mutations in SETD2 (ref = No) | Yes | 1.44 | 0.77–2.69 | 0.25 | 0.2 | ||||
| Non-silent mutations in BAP1 (ref = No) | Yes | 2.05 | 1.15–3.65 | 0.01 | 0.01 | ||||
| Sex (ref = Female) | Male | 0.75 | 0.47–1.20 | 0.22 | 0.2 | ||||
© 2019 by the authors. Licensee MDPI, Basel, Switzerland. This article is an open access article distributed under the terms and conditions of the Creative Commons Attribution (CC BY) license (http://creativecommons.org/licenses/by/4.0/).
Share and Cite
Hu, F.; Zeng, W.; Liu, X. A Gene Signature of Survival Prediction for Kidney Renal Cell Carcinoma by Multi-Omic Data Analysis. Int. J. Mol. Sci. 2019, 20, 5720. https://doi.org/10.3390/ijms20225720
Hu F, Zeng W, Liu X. A Gene Signature of Survival Prediction for Kidney Renal Cell Carcinoma by Multi-Omic Data Analysis. International Journal of Molecular Sciences. 2019; 20(22):5720. https://doi.org/10.3390/ijms20225720
Chicago/Turabian StyleHu, Fuyan, Wenying Zeng, and Xiaoping Liu. 2019. "A Gene Signature of Survival Prediction for Kidney Renal Cell Carcinoma by Multi-Omic Data Analysis" International Journal of Molecular Sciences 20, no. 22: 5720. https://doi.org/10.3390/ijms20225720