Article

Knockdown of the TP53-Induced Glycolysis and Apoptosis Regulator (TIGAR) Sensitizes Glioma Cells to Hypoxia, Irradiation and Temozolomide

by
Gabriele D. Maurer
1,2,
Sonja Heller
1,2,
Christina Wanka
1,2,
Johannes Rieger
1,2,3 and
Joachim P. Steinbach
1,2,*
1
Dr. Senckenberg Institute of Neurooncology and University Cancer Center (UCT), University Hospital Frankfurt, Goethe University, 60590 Frankfurt am Main, Germany
2
German Cancer Research Center (DKFZ) Heidelberg, and German Cancer Consortium (DKTK), Partner Site Frankfurt/Mainz, 60590 Frankfurt am Main, Germany
3
Interdisciplinary Division of Neuro-Oncology, Hertie Institute for Clinical Brain Research, University Hospital Tuebingen, Eberhard Karls University, 72076 Tuebingen, Germany
*
Author to whom correspondence should be addressed.
Int. J. Mol. Sci. 2019, 20(5), 1061; https://doi.org/10.3390/ijms20051061
Submission received: 27 January 2019 / Revised: 20 February 2019 / Accepted: 25 February 2019 / Published: 1 March 2019
(This article belongs to the Special Issue Cancer Cell Metabolism—Pathways and Biology)

Abstract

:
The TP53-induced glycolysis and apoptosis regulator (TIGAR) has been shown to decrease glycolysis, to activate the pentose phosphate pathway, and to provide protection against oxidative damage. Hypoxic regions are considered characteristic of glioblastoma and linked with resistance to current treatment strategies. Here, we established that LNT-229 glioma cell lines stably expressed shRNA constructs targeting TIGAR, and exposed them to hypoxia, irradiation and temozolomide. The disruption of TIGAR enhanced levels of reactive oxygen species and cell death under hypoxic conditions, as well as the effectiveness of irradiation and temozolomide. In addition, TIGAR was upregulated by HIF-1α. As a component of a complex network, TIGAR contributes to the metabolic adjustments that arise from either spontaneous or therapy-induced changes in tumor microenvironment.

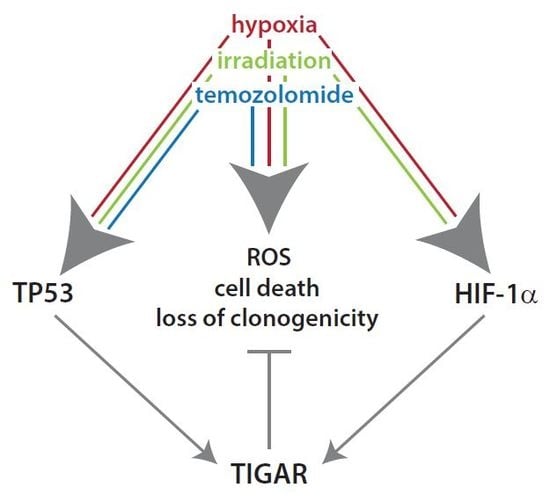
Graphical Abstract

1. Introduction

Glioblastoma is a highly aggressive and lethal primary brain tumor. The current standard therapy includes maximal safe surgical resection and radiotherapy, plus concomitant and adjuvant temozolomide, an oral alkylating agent. Despite these efforts, tumor recurrence commonly occurs within 12 months after primary treatment. Understanding the mechanisms underlying glioma behavior and resistance to therapy is essential for the development of new therapeutic strategies.
Integrated genomic analysis has allowed us to distinguish glioblastomas into the proneural, neural, classical, and mesenchymal subtypes [1]. Further analysis has revealed a discordance between genomic features and proteomic activation status, and led to the notion of a complex interplay between signaling and molecular alterations [2]. Especially the mesenchymal phenotype, representing approximately 20% of glioblastomas, has been associated with more aggressive disease as opposed to the proneural phenotype. The acquisition of mesenchymal attributes is thought to confer treatment resistance and invasiveness [3,4]. Mesenchymal glioblastoma cells often harbor mutations and/or deletions in the gene encoding neurofibromin 1 (NF1). The cell line LNT-229, used in the following experiments, has been reported not to express NF1 due to gene deletion [5].
The TP53-induced glycolysis and apoptosis regulator (TIGAR) exhibits phosphatase activity on, among others, fructose-2,6-bisphosphate, fructose-1,6-bisphosphate [6], and 2,3-bisphosphoglycerate [7]. It has been shown to decrease glycolysis and levels of reactive oxygen species (ROS) [8], contributing to the metabolic adjustments mediated by TP53. In tumors originating from different tissues, an overexpression of TIGAR has been described. In chronic lymphocytic leukemia [9], in cytogenetically normal acute myeloid leukemia [10], and in lung adenocarcinoma [11], high TIGAR expression and TIGAR protein, were associated with shorter survival.
In the glioma cell lines U87MG and T98G, an increase in TIGAR was observed following irradiation and suppression of irradiation-induced TIGAR by RNA interference reduced colony-forming capacities [12]. Cell density, as assessed by crystal violet staining applied over a period of five days, was reduced in cells treated with siRNA targeting TIGAR [12]. In the glioma cell lines A172 and T98G, radiosensitization induced by siRNA-mediated TIGAR gene silencing correlated with an inhibition of thioredoxin-1 (TRX1) nuclear translocation [13]. In an orthotopic mouse model using U87MG glioma cells, TIGAR knockdown prolonged the survival of tumor-bearing mice and enhanced the radiosensitivity of xenografts overexpressing thioredoxin reductase-1 (TRXR1) [14]. Furthermore, stable TIGAR knockdown slightly decelerated HepG2 xenograft growth and enhanced the inhibitory effect of epirubicin treatment on tumor size [15]. A549 non-small cell lung cancer cells were more sensitive to etoposide, 5-fluorouracil, and cis-dichlorodiamineplatinum when transfected with siRNA-targeting TIGAR [16].
Using glioma cell lines LNT-229 and T98G, we previously observed that the ectopic expression of TIGAR attenuated cell death induced by glucose and oxygen restriction, lowered ROS levels, and raised concentrations of reduced glutathione [17]. TIGAR might therefore facilitate resistance to radio- and chemotherapy, both of which induce the formation of ROS [18,19]. In order to assess the impact of TIGAR depletion on the efficacy of current therapeutic strategies, we generated LNT-229 cells that stably expressed shRNA against TIGAR and subjected them to irradiation and temozolomide.

2. Results

2.1. HIF-1α Upregulates TIGAR Expression in Both Normoxia and Hypoxia

Hypoxic regions are considered characteristic of glioblastoma, are linked to a stabilization of hypoxia-inducible factors (HIFs) and are probably related to resistance to current treatment strategies, i.e. radio- and chemotherapy [20,21]. The LNT-229 cells transiently transfected with a plasmid encoding HIF-1α, displayed higher TIGAR levels than the corresponding control cells (Figure 1A,C), whereas knockdown of HIF-1α was associated with lower expression of TIGAR (Figure 1B,D). The functionality of HIF-1α modulation was examined by a luciferase reporter assay (see the 3HRE-pTK-luc construct, Figure 1E,F). Hypoxia increased HIF-specific transcriptional activity, and TIGAR gene suppression attenuated this rise. In the tumor microenvironment, such a positive feedback loop might help to restrain ROS levels under hypoxic conditions.

2.2. TIGAR Knockdown Involves Higher ROS Levels in Hypoxia

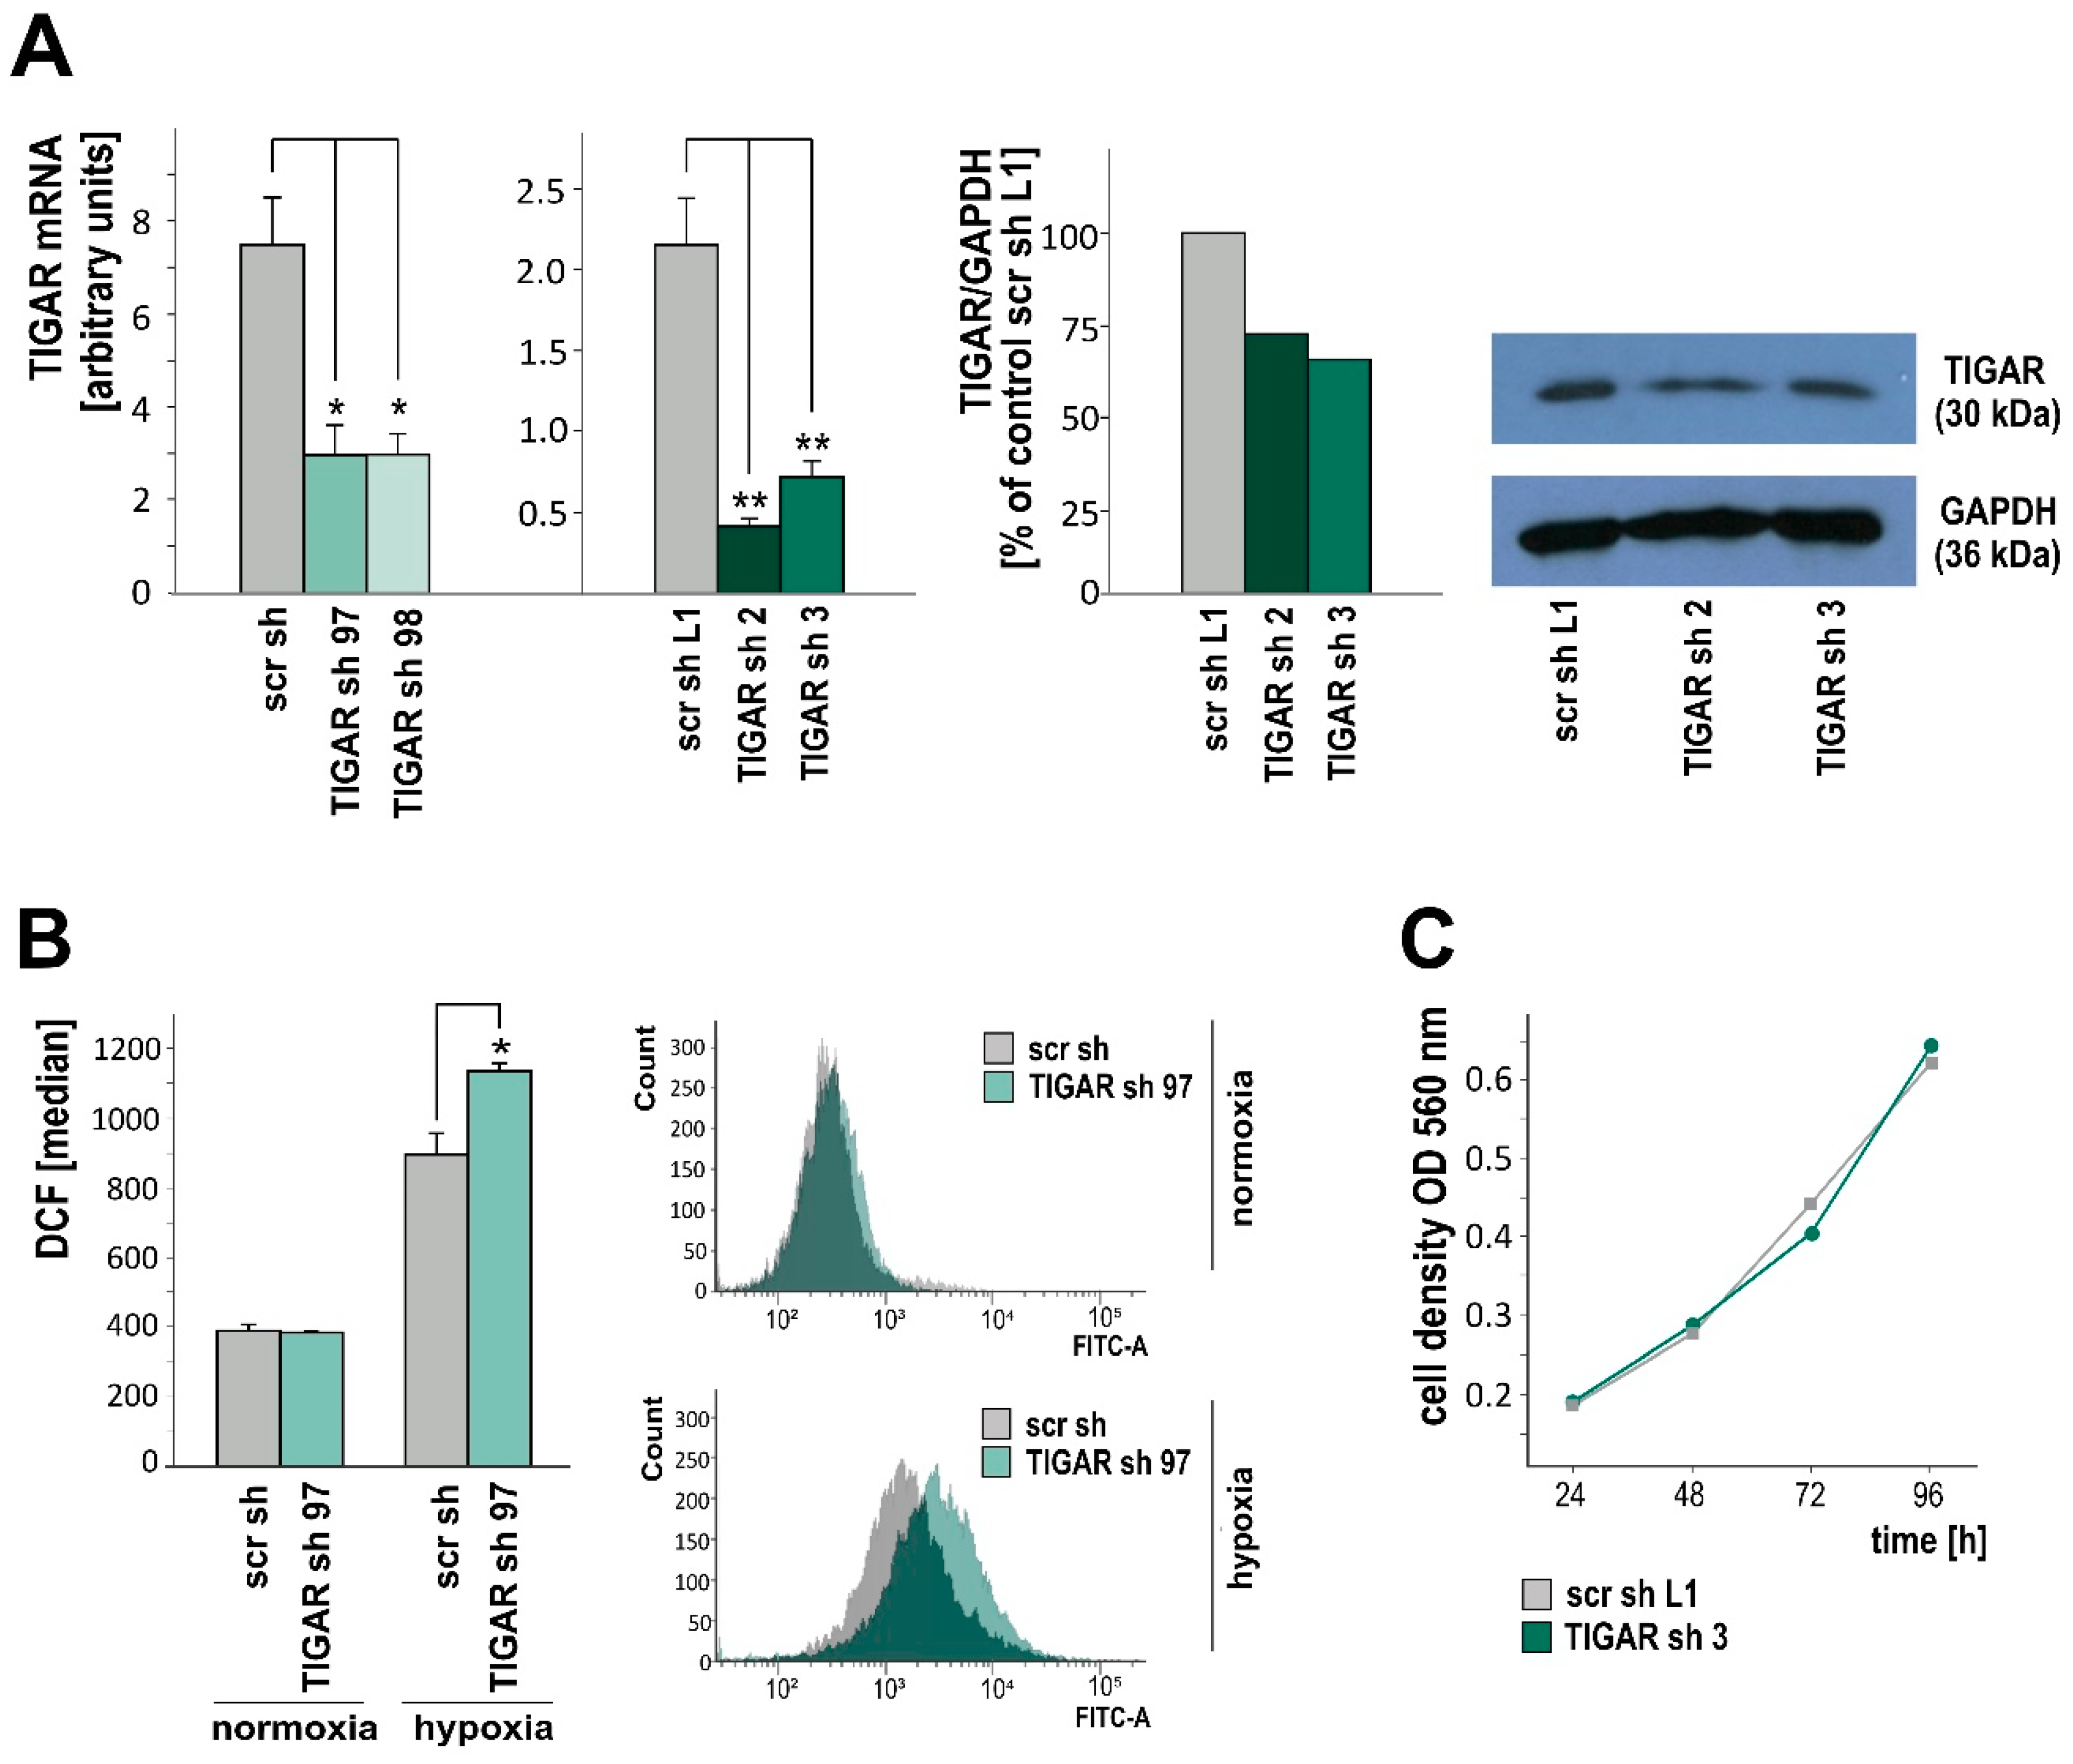
Following our experiments with overexpression and transient knockdown [17], we established LNT-229 glioma cells that stably expressed shRNA against TIGAR. Knockdown was verified by RT-qPCR and western blot analysis (Figure 2A). The ROS, which are byproducts of aerobic metabolism, regulate diverse signaling pathways and hereby enable cells to adapt to environmental changes in order to grow and to survive [22]. However, ROS may induce DNA damage causing genomic instability and, in higher amounts, initiate cell death [23]. Therefore, the reduction–oxidation (redox) function is an essential component of the cell’s homeostatic network. In line with previous reports [8,17], a lower expression of TIGAR was associated with higher ROS levels under hypoxic conditions. In normoxia, the depletion of TIGAR did not alter intracellular ROS concentrations, as assessed by the ROS-sensitive dye dichlorodihydrofluorescein diacetate (H2DCFDA), and flow cytometry (Figure 2B). Likewise, cell density was not affected by TIGAR knockdown (Figure 2C).

2.3. TIGAR Gene Silencing Enhances Cell Death Associated with Oxygen Restriction

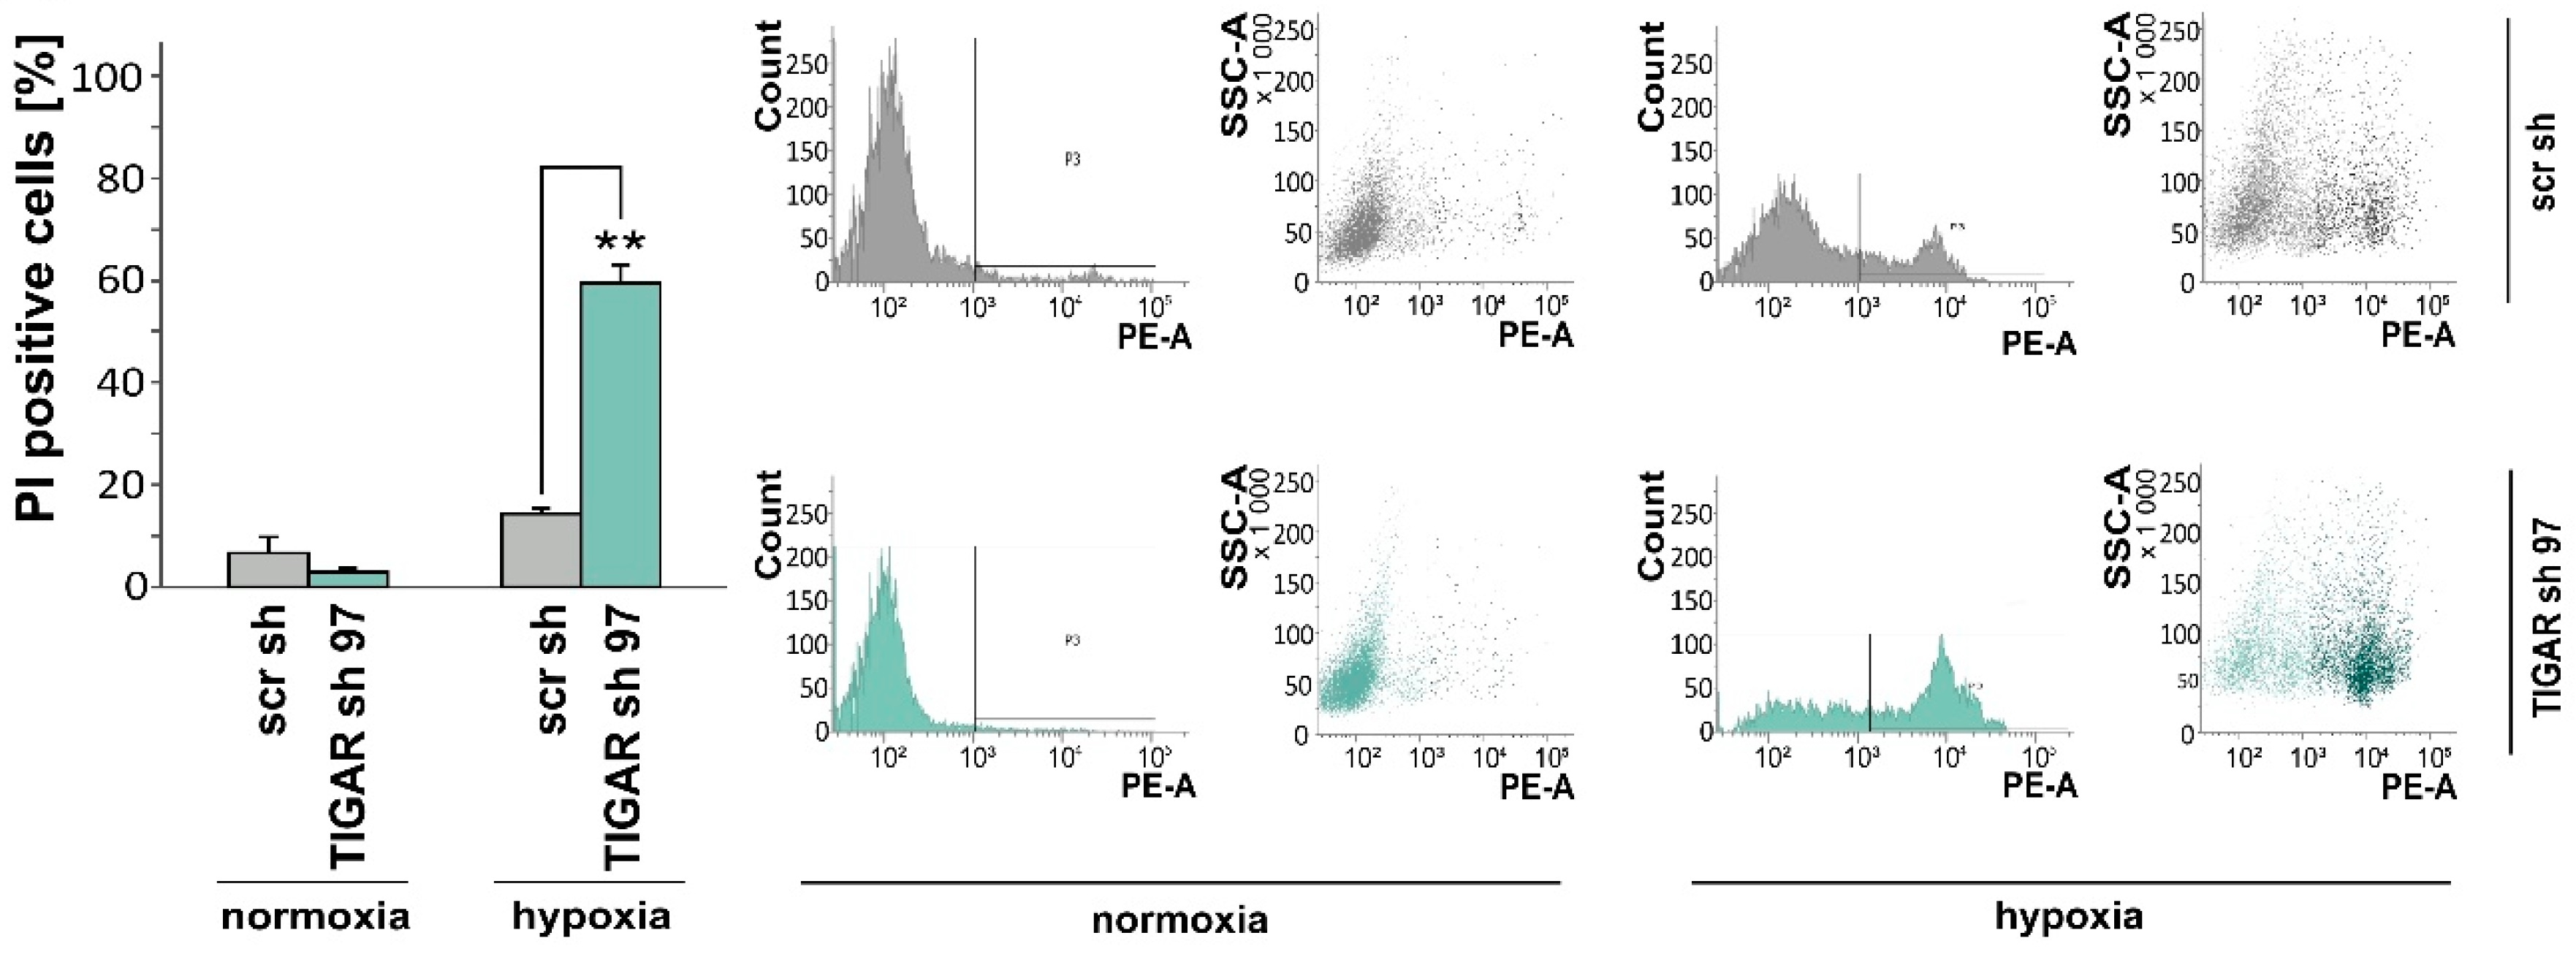
ROS are generated in several subcellular compartments and increase under hypoxia. The precise mechanism by which hypoxia enhances ROS remains to be elucidated, but presumably the mitochondria electron transport chain plays a key role [24,25]. The inhibition of intracellular ROS production and/or intensification of ROS clearance are considered necessary to promote cell survival during and after oxidative stress [26]. Rapidly expanding tumors, e.g., glioblastomas, are characterized by a fluctuating availability of oxygen and nutrients such as glucose, and malignant progression is supposed to arise from the adaptation to these conditions [27]. In order to mimic that situation, we subjected the cells to serum, glucose, and oxygen restriction. Using propidium iodide (PI) staining and flow cytometry, we observed that TIGAR knockdown promoted cell death under hypoxic conditions. In normoxia, fractions of PI-positive cells did not differ significantly between LNT-229-shTIGAR and control cells (Figure 3).

2.4. TIGAR Knockdown Increases Vulnerability to Ionizing Radiation

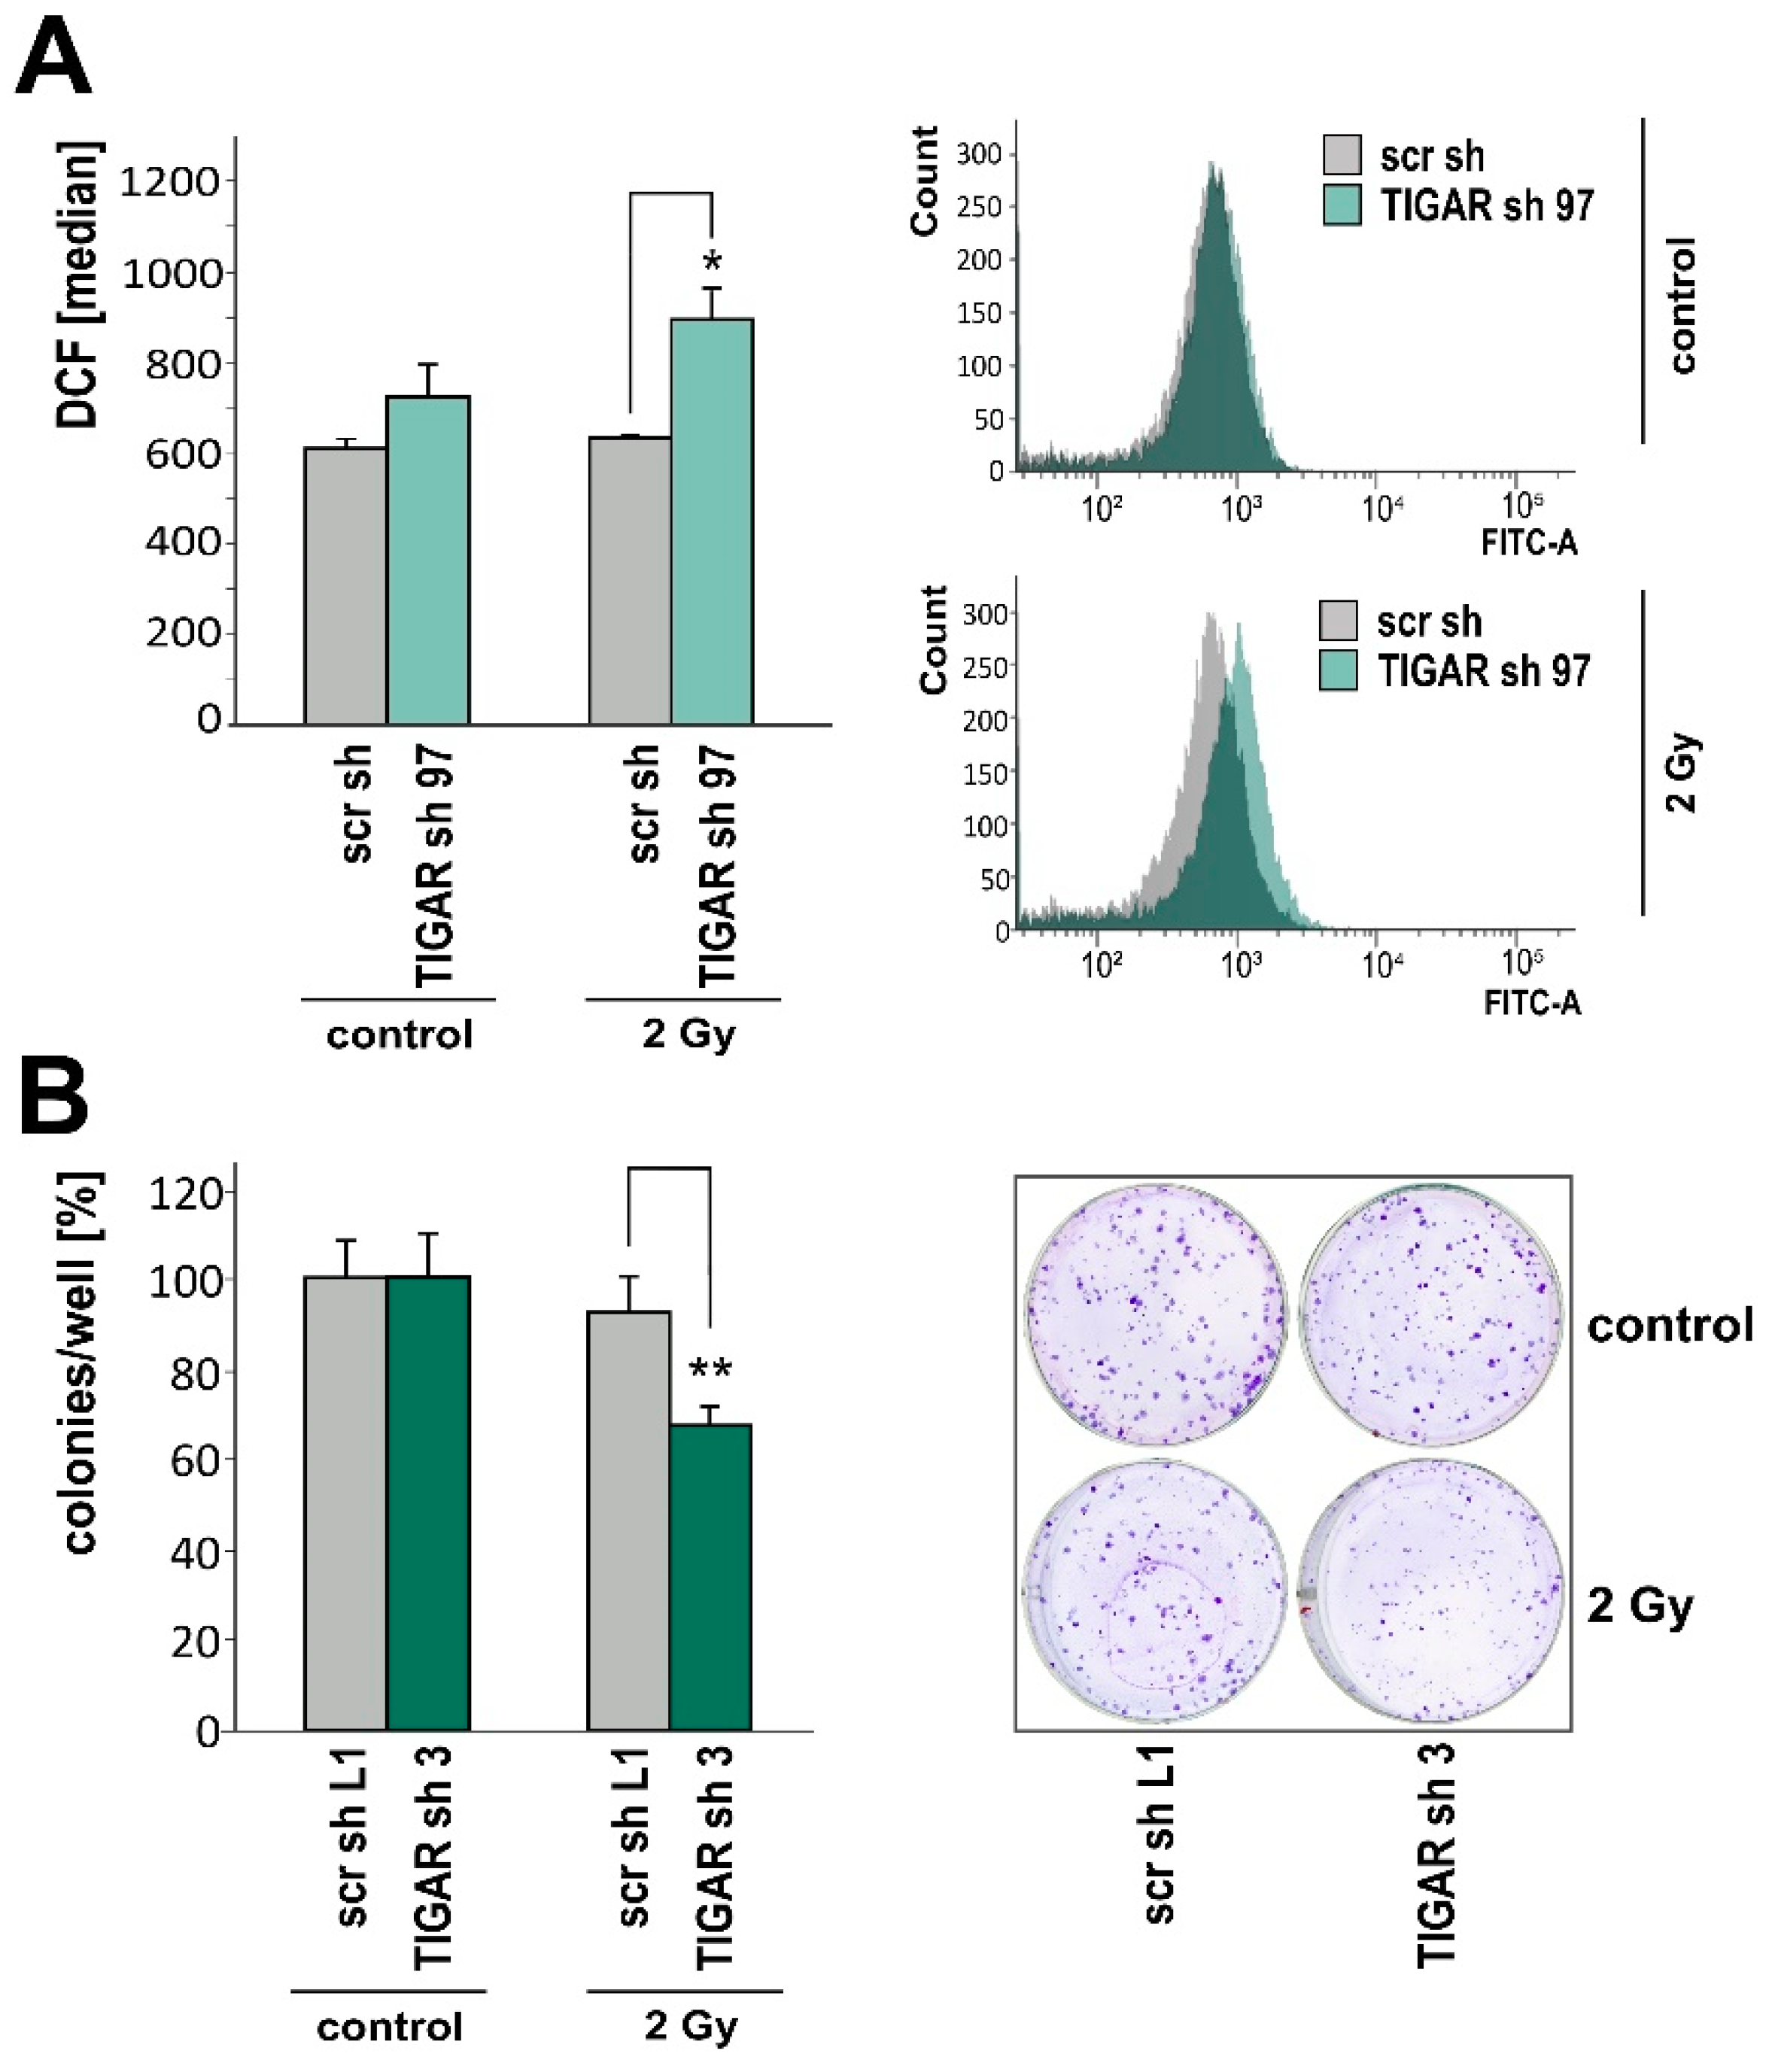
Ionizing radiation, which can be involved in both the induction and treatment of tumors, prompts the generation of ROS [28]. Due to an increased availability of free radical scavengers or metabolic quiescence, low ROS concentrations help to protect cell genomes from endogenous and exogenous oxidative stress-mediated damage [29]. Using H2DCFDA and flow cytometry, we observed an increase in ROS following TIGAR gene silencing and exposure to 2 Gy irradiation (Figure 4A). In addition, clonogenic survival subsequent to irradiation was reduced in LNT-229-shTIGAR cells when compared to control cells. Non-irradiated LNT-229-shTIGAR and control cells exhibited similar levels of clonogenic survival (Figure 4B).

2.5. TIGAR Depletion Boosts the Effects of Temozolomide on Cell Density and Clonogenicity

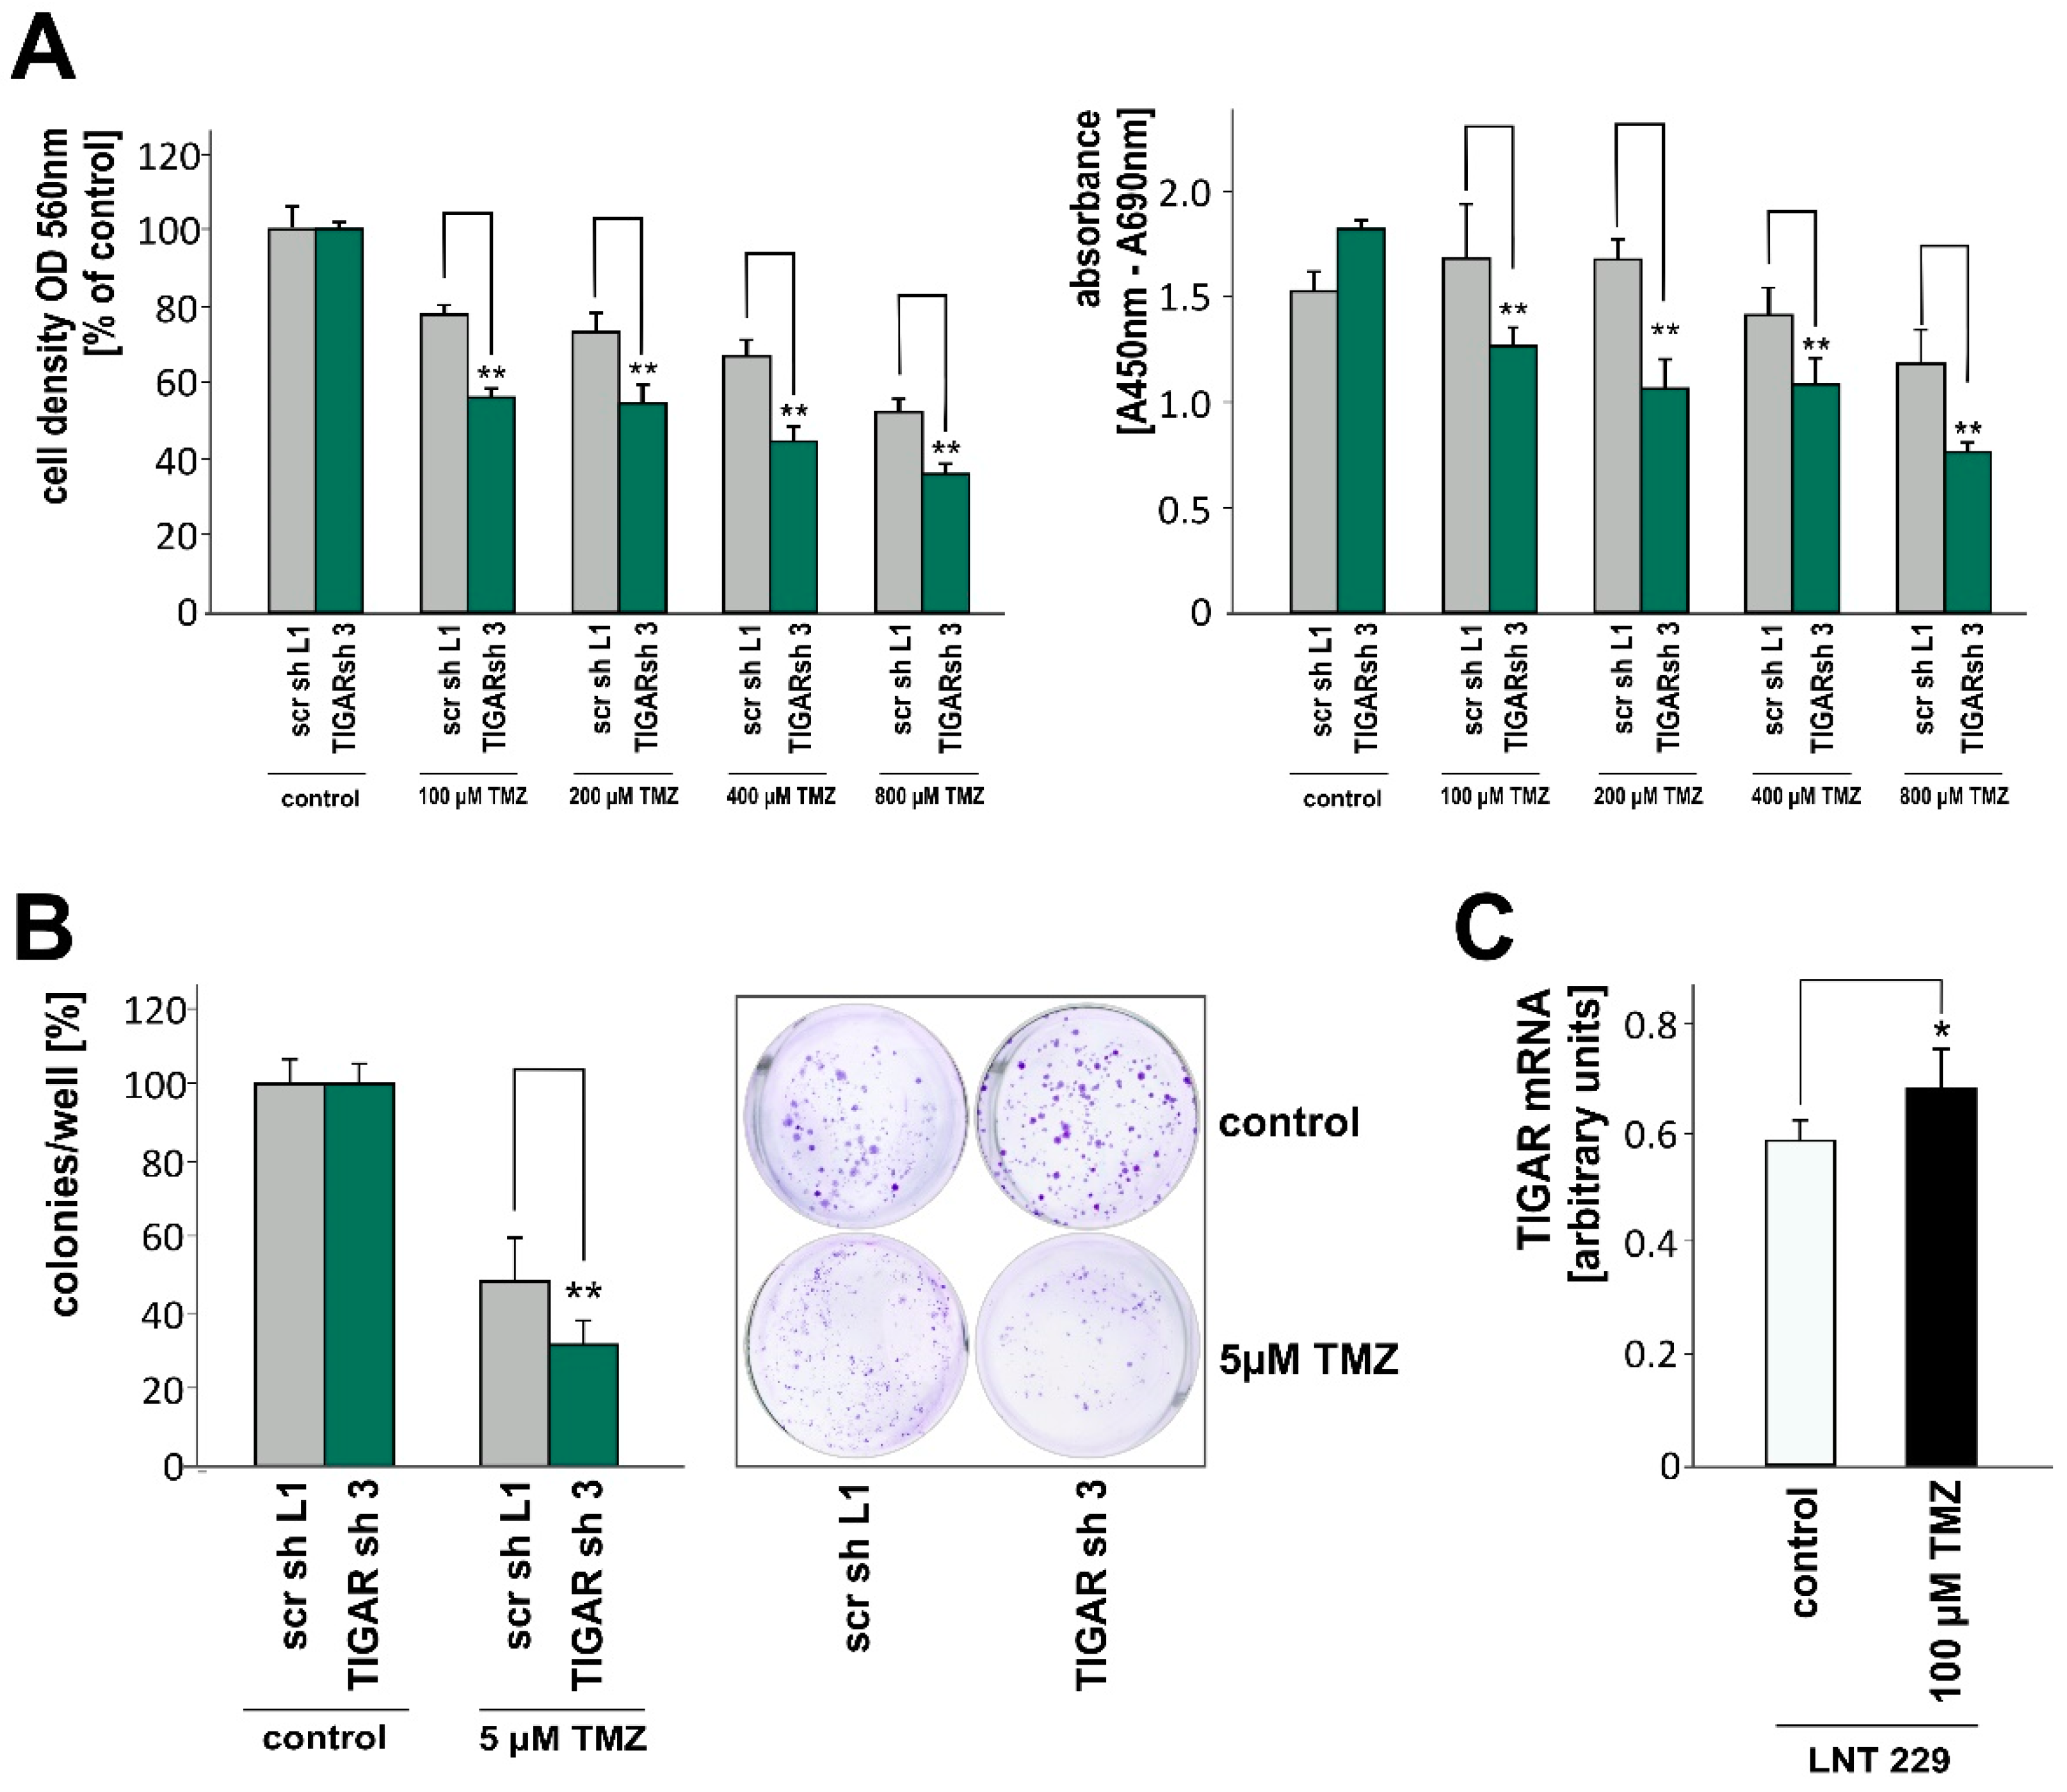
Since at least 2005, temozolomide has been an integral component of glioblastoma treatment [30], and the induction of apoptosis by temozolomide has been linked to a ROS burst [31,32]. LNT-229-shTIGAR cells, presumably exhibiting less ROS clearance, were found to be more sensitive to temozolomide exposure than control cells, as reflected by the lower cell density and by the lower BrdU incorporation (Figure 5A). As acute cell behavior and clonogenicity require distinct conditions [33], we also looked at colony formation and found that the reproductive ability of the cells was impaired by TIGAR knockdown, too (Figure 5B). Underlining the potential biological relevance of TIGAR, treatment with temozolomide increased TIGAR expression in parental LNT-229 cells (Figure 5C).

2.6. Attenuation of TIGAR is Accompanied by Metabolic Changes

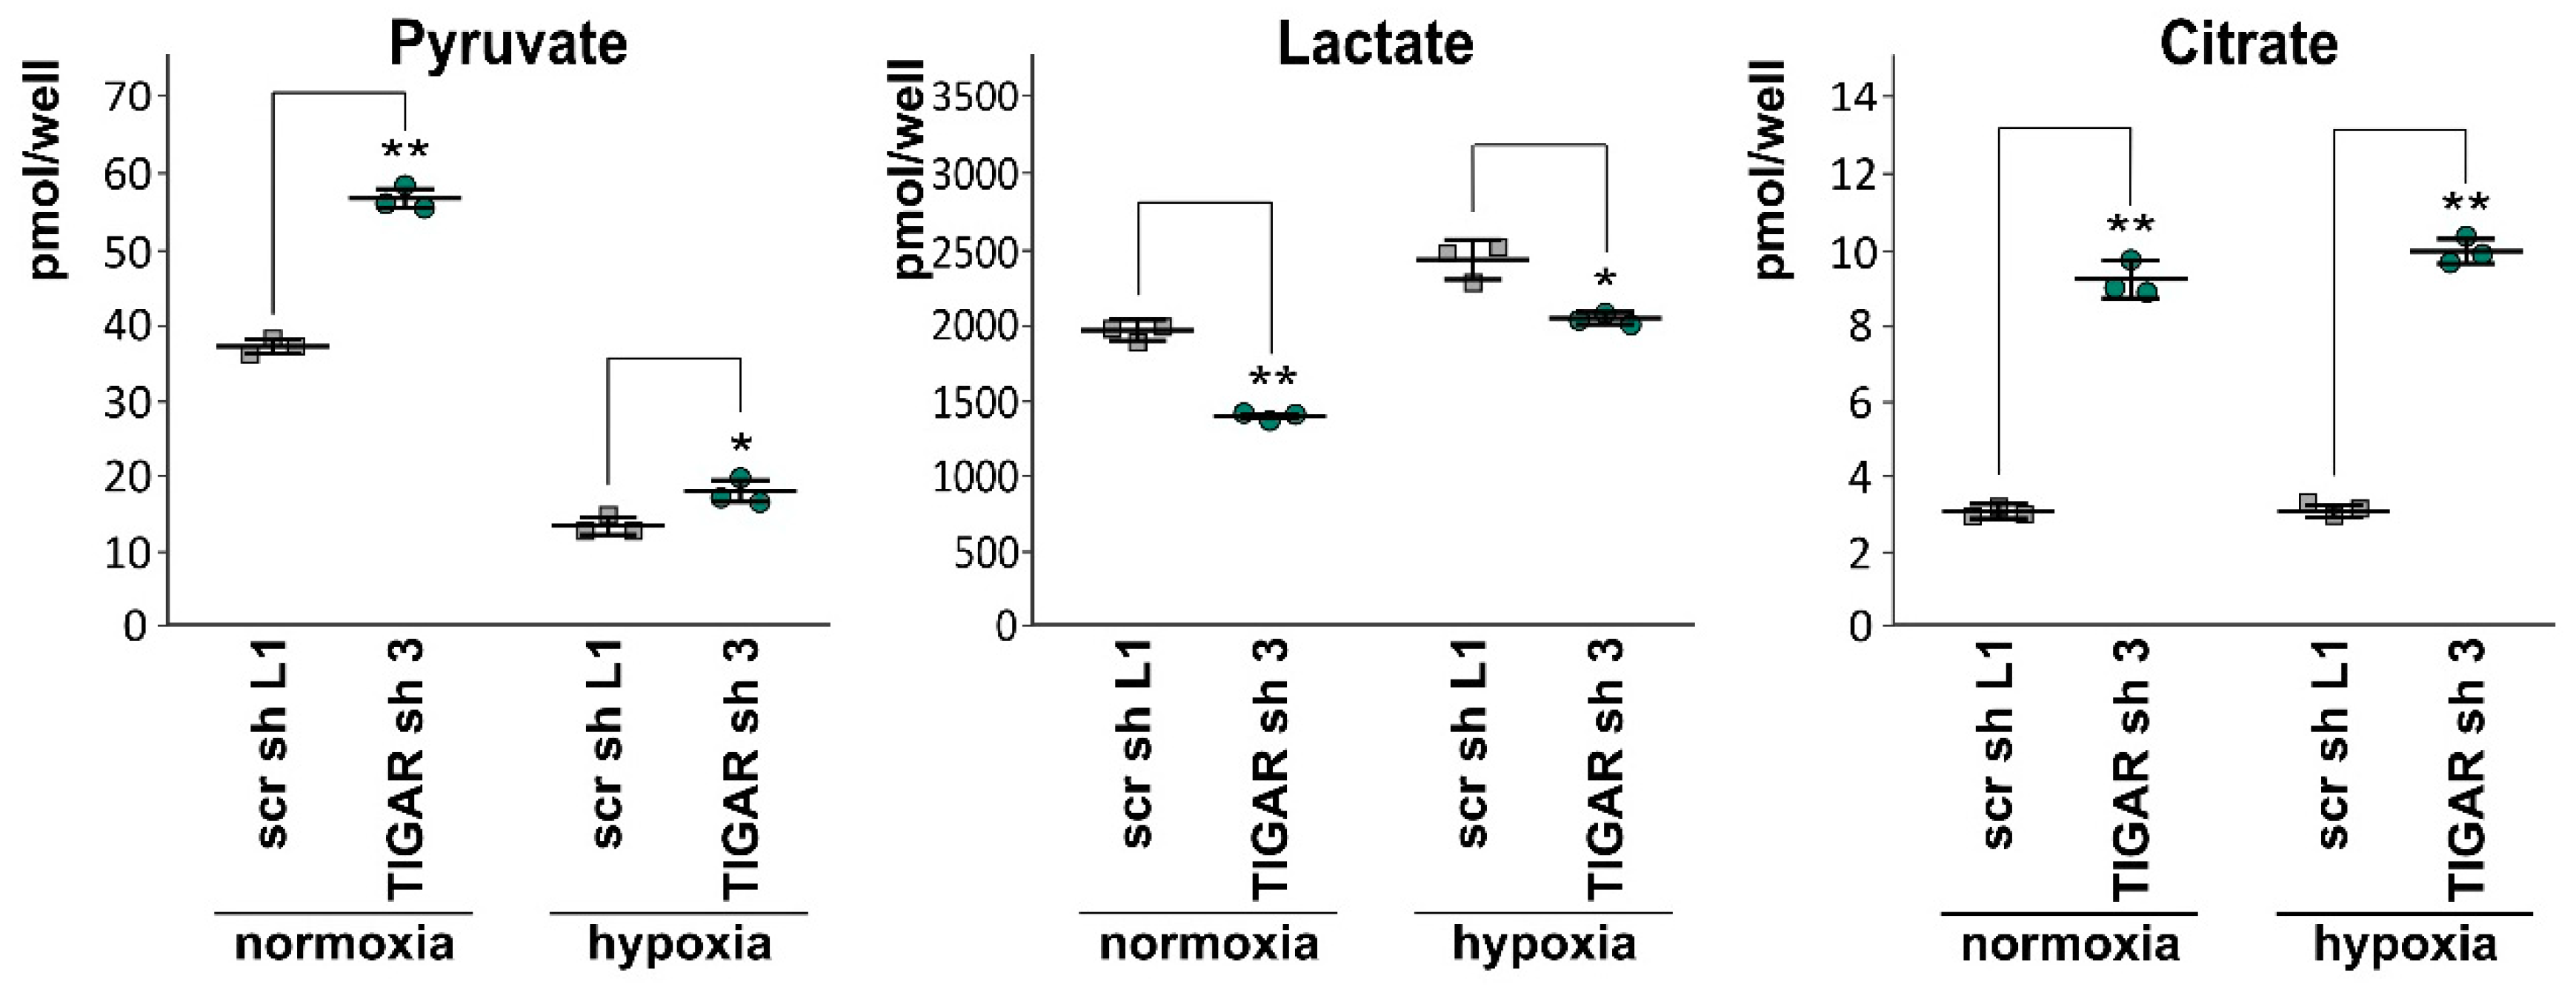
Under certain circumstances, TIGAR overexpression can promote cellular respiration [17,34]. Recently, when exploring the role of TIGAR in skeletal muscle, a decrease in mitochondrial number and oxidative phosphorylation was described in TIGAR knockout mice compared with wild-type mice [35]. However, extensive metabolic analysis was not the purpose of the present study. In order to gain an impression of the alterations induced by TIGAR knockdown, we determined the extracellular concentrations of pyruvate, lactate, and citrate. Both in normoxia and in hypoxia, the levels of pyruvate and citrate in supernatants were found to be higher than in those of the LNT-229 cells expressing scrambled shRNA. By contrast, extracellular lactate was reduced following TIGAR gene suppression (Figure 6).

3. Discussion

TIGAR has been described as directing flux through the oxidative pentose phosphate pathway and as supporting the cell’s antioxidant defense (for a comprehensive review, please refer to [36]). In mouse intestinal adenoma models, TIGAR not only promoted regeneration of healthy tissue, but also supported tumor development [37]. Further, in nasopharyngeal carcinoma [38] and non-small cell lung cancer [39], TIGAR has been linked with enhanced invasion and metastasis. The antiproliferative, antimigratory, and proapoptotic effects of dioscin on hepatocellular carcinoma have been related to an inhibition of TIGAR [40]. In any case, in a pancreatic ductal adenocarcinoma model, loss of TIGAR did not improve survival, and even amplified metastatic spread [41], and in colorectal cancer patients, a higher TIGAR plasma level was associated with lower risk of metastasis [42]. Using LNT-229 glioma cells, we demonstrated that stable TIGAR gene silencing (1) was associated with higher ROS levels under hypoxic conditions, (2) increased cell death in hypoxia, and (3) sensitized cells to radiation and temozolomide. Besides, we showed that TIGAR was positively regulated by HIF-1α.
In 2006, TIGAR was identified as a TP53 target gene [8]. However, in several tumor entities, high TIGAR expression has been observed independent of TP53 function [43]. Depending on the cell type and environmental conditions, HIF-1 may also induce TIGAR expression. The p300/CBP-associated factor (PCAF), a common transcriptional coactivator, presumably controls the differential recruitment of TP53 and HIF-1α to the promoters of TIGAR and other metabolic regulators [44]. Alleviating oxidative stress and glycolysis, TIGAR has distinct effects on the cell cycle, senescence, and survival, which are partially based on cell type, cellular metabolism, and the extent of injury. Hypoxia, irradiation, and temozolomide can upregulate TP53 [45,46,47]. Hypoxia and irradiation are known to stabilize HIF-1α [48,49,50]. TP53 and HIF-1α interact with each other both directly and indirectly [51]. Both TP53 and HIF-1α may ultimately upregulate TIGAR, which in turn contributes to restraining ROS levels.
The enhanced susceptibility of LNT-229-sh TIGAR cells to radiation and temozolomide is in line with earlier reports. Peña-Rico et al. described a radiosensitization of glioma cells upon TIGAR knockdown [12]. In tumor cell lines of non-glial origin, TIGAR suppression enhanced the effect of the antineoplastic agents epirubicin, 5-fluorouracil, cis-dichlorodiamineplatinum, and etoposide [15,16], and increased the DNA damage caused by CoCl2 or epirubicin [52]. These observations have been attributed to a reduced pentose phosphate pathway flux and, as a consequence, impaired DNA repair capacity. Additionally, high ROS levels promote DNA damage and genomic instability [53].
Despite applying four different shRNAs, we did not achieve a pronounced knockdown of TIGAR. Nevertheless, we obtained reproducible and consistent results. Moreover, as opposed to knockout models, the modulation of TIGAR we obtained was presumably more in the range of physiological changes, depending on, e.g., TP53. Overall, considering data from publicly available databases such as the Human Protein Atlas (www.proteinatlas.org) [54], and the R2 database (Genomics Analysis and Visualization Platform, http://r2.amc.nl), TIGAR does not seem to be a strong prognostic factor in glioma. The TIGAR-deficient mice developed quite normally, suggesting that compensatory mechanisms existed during development [37]. However, this does not exclude a relevant role of TIGAR in tumor biology, as transcription and translation are known to be differentially regulated depending on cell subpopulation and environmental conditions.
In the present study, we did not seek to identify the mediators of the effects observed upon TIGAR knockdown. Certainly, our results were based on a small modification of a complex network [55]. In accordance with previous reports [17], we found lower TKTL1 levels in LNT-229-shTIGAR cells than in control cells. However, this interference could not explain all the implications of TIGAR suppression outlined above. As a component of the acidic tumor environment, lactate can compromise immune surveillance, promote cell migration, and facilitate tumor progression [56,57]. Accordingly, TIGAR suppression, resulting in lower lactate levels, might contribute to a more oxidative and less aggressive phenotype. Both in normoxia and in hypoxia, extracellular citrate levels were elevated upon TIGAR knockdown. Citrate is synthesized as part of the tricarboxylic acid cycle and can be (1) further oxidized, (2) transported to the cytoplasm to serve as substrate for fatty acid and sterol synthesis or (3) released from astrocytes to the extracellular space [58]. Recently, a relevant impact of extracellular citrate on cancer cells has been demonstrated [59]. Exogenous pyruvate might help to maintain the proliferative capacities of hypoxic cells [60]. Reduced TIGAR expression could thus support tumor growth by raising levels of extracellular citrate and pyruvate. In addition, ROS in the tumor microenvironment not only affects tumor cells themselves, but also alters immune responses. Excessive ROS have been shown to compromise the activation, differentiation, and function of T cells, and to enhance T cell apoptosis [61]. Antagonizing TIGAR may also facilitate glioma progression by maintaining an immunosuppressive milieu. Hence, the mere inhibition of TIGAR function as part of a therapeutic strategy might have unexpected effects and cannot be considered advisable at present.

4. Materials and Methods

4.1. Reagents, Cell Lines and Culture Conditions

If not stated otherwise, reagents were purchased from Sigma-Aldrich (St. Louis, MO, USA) or Qiagen (Hilden, Germany). LNT-229 human malignant glioma cells, kindly provided by N. de Tribolet, LNT-229 cells stably expressing an shRNA targeting HIF-1α and its control (Sima), kindly provided by T. Acker [62], were cultured in Dulbecco’s modified Eagle’s Medium (4500 mg/L glucose), supplemented with 10% fetal calf serum (FCS; PAA, Pasching, Austria), 2 mM glutamine, 100 IU/mL penicillin, 100 μg/mL streptomycin and, if necessary (LNT-229-shHIF-1α and control cells), 10 µg/mL blasticidin at 37 °C and 5% CO2. In contrast to the LN-229 cells (ATCC CRL-2611), which display a TP53 mutation at codon 98 [63], LNT-229 cells harbor a polymorphism in codon 72 and have transcriptionally active, wild-type TP53 [64,65]. The absence of mycoplasma contamination was verified before beginning experiments and bimonthly thereafter (MycoAlertTM Mycoplasma Detection Kit, Lonza–Basel, Switzerland). For some experiments, glucose was added to the serum- and glucose-free medium to final concentrations of 2 or 5 mM. The shRNA sequences used were 5’-GCTGCTGGTATATTTCTGAAT-3’ TIGAR sh 97), 5’-GACAGCGGTATTCCAGGATTA-3’ (TIGAR sh 98) and scrambled control 5′-ACTACCGTTGTTATAGGT-3′ (scr sh), pGIPZ vectors encoded green fluorescent protein (GFP) and either scrambled shRNA (scr sh L1) or shRNA directed against TIGAR (TIGAR sh 2, 5’-AGGAAAAAATCACAGCTCT-3’, and TIGAR sh 3, 5’-TGGACAACCATATAGAATT-3’, Dharmacon, Lafayette, CO, USA). After transfection using Attractene (Qiagen), cells stably expressing shRNA constructs targeting TIGAR and scrambled control sequences, respectively, were selected by puromycin resistance (5 µg/mL). For transient overexpression of HIF-1α, pcDNA3 control (Invitrogen, Carlsbad, CA, USA) and pcDNA3-HIF-1α (Addgene, Cambridge, MA, USA) vectors were used. Hypoxia was achieved in Gas Pak pouches for anaerobic culture (Becton–Dickinson, Heidelberg, Germany). For irradiation experiments, cells, cultured in medium supplemented with 10% FCS and 25 mM glucose and highly proliferating, were exposed to single doses of 2 Gy photons using a linear accelerator (SL75/5, Elekta, Crawley, UK) with 6 MeV/100 cm focus-surface distance and a dose rate of 4 Gy/min. 0 Gy-controls were kept in parallel at ambient temperature in the accelerator control room.

4.2. SDS-PAGE and Immunoblotting

Cells were lysed in a buffer containing 50 mM Tris-HCl, 120 mM NaCl, 5 mM EDTA, 0.5% Nonidet P-40, 2 μg/mL aprotinin, 10 μg/mL leupeptin, 100 μg/mL phenylmethylsulfonyl fluoride, 50 mM NaF, 200 μM NaVO5, and phosphatase inhibitor cocktails I and II. Protein concentration was determined using a Bradford assay (Bio-Rad, Hercules, CA, USA). A total of 20 μg of total protein was separated under reducing conditions by sodium dodecyl sulfate polyacrylamide gel electrophoresis (SDS-PAGE) and electroblotted on nitrocellulose (Amersham, Braunschweig, Germany). Tris-buffered saline with 5% skim milk and 0.1% Tween-20 was used for blocking, primary antibodies (dilution 1:1000) applied were anti-TIGAR (polyclonal rabbit anti-human, ab37910, Abcam, Cambridge, UK) and anti-glyceraldehyde-3-phosphate dehydrogenase (GAPDH, monoclonal mouse, including but not limited to, anti-human, MAB374, Chemicon, Nuernberg, Germany). Immune complexes were detected by enhanced chemiluminescence (Pierce, Rockford, IL, USA). ImageJ was used for densitometric analysis according to http://rsb.info.nih.gov/ij/docs/menus/analyze.html#gels [66].

4.3. Real-Time Quantitative PCR (RT-qPCR)

TRIzol™ (Invitrogen, Carlsbad, CA, USA) and the RNeasy™ system (Qiagen) were used for the extraction of total RNA, 1.5 μg of RNA, and SuperScript VILO™ (Invitrogen) for cDNA synthesis. Real-time PCR was conducted in an iQ5 real-time PCR detection system (Bio-Rad, Munich, Germany) with ABsolute™ Blue qPCR SYBR-Green Fluorescein Mix (Thermo Fisher Scientific, Waltham, MA, USA). Gene expression data were normalized to the internal control succinate dehydrogenase complex, subunit A, flavoprotein variant (SDHA) using the ddCT method [67] and the iQ5 software (Bio-Rad). Primer sequences: HIF-1α forward 5’-GTCGGACAGCCTCACCAAACAGAGC-3’ and reverse 5’-GTTAACTTGATCCAAAGCTCTGAG-3’, SDHA forward 5′-TGGGAACAAGAGGGCATCTG-3′ and reverse 5′-CCACCACTGCATCAAATTCATG-3′, TIGAR forward 5′-CCTTACCAGCCACTCTGAGC-3′ and reverse 5′-CCATGTGCAATCCAGAGATG-3′.

4.4. ROS Analysis

In order to measure the ROS in living cells with intact membranes, we evaluated ROS levels at an earlier moment than cell death and provided slightly more glucose (5 mM). Cells were washed twice with phosphate buffered saline (PBS), incubated for 20 min at 37 °C with 10 µM dichlorodihydrofluorescein diacetate (H2DCFDA, Invitrogen), washed with PBS, and examined in a flow cytometer (BD Canto II, Heidelberg, Germany).

4.5. Growth and Viability Assays

Crystal violet was employed for the analysis of cell density. After the solubilization of the dye in 0.1 M sodium citrate, the absorbance was measured at 560 nm (Multiskan™ EX, Thermo Fisher Scientific, Langenselbold, Germany). For the quantification of cell death, adherent and non-adherent cells were collected, stained with 1 µg/mL propidium iodide (PI) and analyzed by flow cytometry. PI-positive cells were considered dead. Clonogenic survival was studied by seeding 500 cells in six-well plates, observing them for 7 days, staining them with crystal violet and counting colonies of more than 50 cells. Cell proliferation was quantified based on the incorporation of bromodeoxyuridine (BrdU Cell Proliferation ELISA, Roche Diagnostics). Assays evaluating acute growth inhibition or cell death required higher concentrations of temozolomide than those estimating colony formation, as previously described [68].

4.6. Luciferase Reporter Assay

Metafectene Pro (Biontex, Munich, Germany) was used to cotransfect LNT-229 cells with a 3HRE-pTK-luc [69] and, for the normalization of transfection efficiency, a pRL-CMV Renilla luciferase construct. The activity of Firefly and Renilla luciferase [70] was measured in an InfiniteR M200 PRO microplate reader (Tecan, Maennedorf, Switzerland).

4.7. Measurement of Extracellular Levels of Pyruvate, Lactate and Citrate

The cells were seeded in 6-well-plates, allowed to adhere overnight and cultured for 8 h in a serum-free medium containing 2 mM glucose. The diluted medium samples were then analyzed by gas chromatography coupled to mass spectrometry (GC-MS), as described previously [71].

4.8. Statistics

Experiments were repeated at least three times with similar results. Results were depicted as mean + standard deviation (SD), differences were considered significant if p < 0.05 using the two-tailed Student’s t-test.

Author Contributions

Conceptualization, G.M., J.R. and J.S.; Formal analysis, G.M. and S.H.; Investigation, S.H. and C.W.; Methodology, S.H.; Project administration, J.S.; Supervision, J.R. and J.S.; Validation, G.M.; Visualization, S.H.; Writing—original draft, G.M.; Writing—review and editing, J.S. All authors read and approved the final manuscript.

Funding

The Dr. Senckenberg Institute of Neurooncology is supported by the Dr. Senckenberg foundation (grant number 2014/SIN-02).

Acknowledgments

We sincerely thank U. Hofmann, Dr. Margarete Fischer-Bosch Institute of Clinical Pharmacology, Stuttgart, and Eberhard Karls University, Tuebingen, Germany, for the analysis of extracellular pyruvate, lactate and citrate.

Conflicts of Interest

The authors declare no conflict of interest.

References

  1. Verhaak, R.G.W.; Hoadley, K.A.; Purdom, E.; Wang, V.; Qi, Y.; Wilkerson, M.D.; Miller, C.R.; Ding, L.; Golub, T.; Mesirov, J.P.; et al. Integrated genomic analysis identifies clinically relevant subtypes of glioblastoma characterized by abnormalities in PDGFRA, IDH1, EGFR, and NF1. Cancer Cell 2010, 17, 98–110. [Google Scholar] [CrossRef] [PubMed]
  2. Brennan, C.W.; Verhaak, R.G.W.; McKenna, A.; Campos, B.; Noushmehr, H.; Salama, S.R.; Zheng, S.; Chakravarty, D.; Sanborn, J.Z.; Berman, S.H.; et al. The somatic genomic landscape of glioblastoma. Cell 2013, 155, 462–477. [Google Scholar] [CrossRef] [PubMed]
  3. Carro, M.S.; Lim, W.K.; Alvarez, M.J.; Bollo, R.J.; Zhao, X.; Snyder, E.Y.; Sulman, E.P.; Anne, S.L.; Doetsch, F.; Colman, H.; et al. The transcriptional network for mesenchymal transformation of brain tumours. Nature 2010, 463, 318–325. [Google Scholar] [CrossRef] [PubMed]
  4. Phillips, H.S.; Kharbanda, S.; Chen, R.; Forrest, W.F.; Soriano, R.H.; Wu, T.D.; Misra, A.; Nigro, J.M.; Colman, H.; Soroceanu, L.; et al. Molecular subclasses of high-grade glioma predict prognosis, delineate a pattern of disease progression, and resemble stages in neurogenesis. Cancer Cell 2006, 9, 157–173. [Google Scholar] [CrossRef] [PubMed] [Green Version]
  5. McGillicuddy, L.T.; Fromm, J.A.; Hollstein, P.E.; Kubek, S.; Beroukhim, R.; De Raedt, T.; Johnson, B.W.; Williams, S.M.G.; Nghiemphu, P.; Liau, L.M.; et al. Proteasomal and genetic inactivation of the NF1 tumor suppressor in gliomagenesis. Cancer Cell 2009, 16, 44–54. [Google Scholar] [CrossRef] [PubMed]
  6. Li, H.; Jogl, G. Structural and biochemical studies of TIGAR (TP53-induced glycolysis and apoptosis regulator). J. Biol. Chem. 2009, 284, 1748–1754. [Google Scholar] [CrossRef] [PubMed]
  7. Gerin, I.; Noël, G.; Bolsée, J.; Haumont, O.; Van Schaftingen, E.; Bommer, G.T. Identification of TP53-induced glycolysis and apoptosis regulator (TIGAR) as the phosphoglycolate-independent 2,3-bisphosphoglycerate phosphatase. Biochem. J. 2014, 458, 439–448. [Google Scholar] [CrossRef] [PubMed]
  8. Bensaad, K.; Tsuruta, A.; Selak, M.A.; Vidal, M.N.C.; Nakano, K.; Bartrons, R.; Gottlieb, E.; Vousden, K.H. TIGAR, a p53-inducible regulator of glycolysis and apoptosis. Cell 2006, 126, 107–120. [Google Scholar] [CrossRef] [PubMed]
  9. Hong, M.; Xia, Y.; Zhu, Y.; Zhao, H.-H.; Zhu, H.; Xie, Y.; Fan, L.; Wang, L.; Miao, K.-R.; Yu, H.; et al. TP53-induced glycolysis and apoptosis regulator protects from spontaneous apoptosis and predicts poor prognosis in chronic lymphocytic leukemia. Leuk. Res. 2016, 50, 72–77. [Google Scholar] [CrossRef] [PubMed]
  10. Qian, S.; Li, J.; Hong, M.; Zhu, Y.; Zhao, H.; Xie, Y.; Huang, J.; Lian, Y.; Li, Y.; Wang, S.; et al. TIGAR cooperated with glycolysis to inhibit the apoptosis of leukemia cells and associated with poor prognosis in patients with cytogenetically normal acute myeloid leukemia. J. Hematol. Oncol. 2016, 9, 128. [Google Scholar] [CrossRef] [PubMed] [Green Version]
  11. Liu, J.; Lu, F.; Gong, Y.; Zhao, C.; Pan, Q.; Ballantyne, S.; Zhao, X.; Tian, S.; Chen, H. High expression of synthesis of cytochrome c oxidase 2 and TP53-induced glycolysis and apoptosis regulator can predict poor prognosis in human lung adenocarcinoma. Hum. Pathol. 2018, 77, 54–62. [Google Scholar] [CrossRef] [PubMed]
  12. Peña-Rico, M.A.; Calvo-Vidal, M.N.; Villalonga-Planells, R.; Martínez-Soler, F.; Giménez-Bonafé, P.; Navarro-Sabaté, À.; Tortosa, A.; Bartrons, R.; Manzano, A. TP53 induced glycolysis and apoptosis regulator (TIGAR) knockdown results in radiosensitization of glioma cells. Radiother. Oncol. 2011, 101, 132–139. [Google Scholar] [CrossRef] [PubMed] [Green Version]
  13. Zhang, H.; Gu, C.; Yu, J.; Wang, Z.; Yuan, X.; Yang, L.; Wang, J.; Jia, Y.; Liu, J.; Liu, F. Radiosensitization of glioma cells by TP53-induced glycolysis and apoptosis regulator knockdown is dependent on thioredoxin-1 nuclear translocation. Free Radic. Biol. Med. 2014, 69, 239–248. [Google Scholar] [CrossRef] [PubMed]
  14. Zhang, Y.; Chen, F.; Tai, G.; Wang, J.; Shang, J.; Zhang, B.; Wang, P.; Huang, B.; Du, J.; Yu, J.; et al. TIGAR knockdown radiosensitizes TrxR1-overexpressing glioma in vitro and in vivo via inhibiting Trx1 nuclear transport. Sci. Rep. 2017, 7, 42928. [Google Scholar] [CrossRef] [PubMed] [Green Version]
  15. Xie, J.-M.; Li, B.; Yu, H.-P.; Gao, Q.-G.; Li, W.; Wu, H.-R.; Qin, Z.-H. TIGAR has a dual role in cancer cell survival through regulating apoptosis and autophagy. Cancer Res. 2014, 74, 5127–5138. [Google Scholar] [CrossRef] [PubMed]
  16. Zhang, T.; Yu, X.; Miao, P.; Zhao, X.; Huang, G.; Liu, J. Inhibition of TIGAR expression can increase the sensitivity to chemotherapy in A549 non-small cell lung cancer cells. Tumor 2014, 34, 303–309. [Google Scholar]
  17. Wanka, C.; Steinbach, J.P.; Rieger, J. Tp53-induced glycolysis and apoptosis regulator (TIGAR) protects glioma cells from starvation-induced cell death by up-regulating respiration and improving cellular redox homeostasis. J. Biol. Chem. 2012, 287, 33436–33446. [Google Scholar] [CrossRef] [PubMed]
  18. Oliva, C.R.; Moellering, D.R.; Gillespie, G.Y.; Griguer, C.E. Acquisition of chemoresistance in gliomas is associated with increased mitochondrial coupling and decreased ROS production. PLoS ONE 2011, 6, e24665. [Google Scholar] [CrossRef] [PubMed]
  19. Barker, H.E.; Paget, J.T.E.; Khan, A.A.; Harrington, K.J. The tumour microenvironment after radiotherapy: Mechanisms of resistance and recurrence. Nat. Rev. Cancer 2015, 15, 409–425. [Google Scholar] [CrossRef] [PubMed]
  20. Colwell, N.; Larion, M.; Giles, A.J.; Seldomridge, A.N.; Sizdahkhani, S.; Gilbert, M.R.; Park, D.M. Hypoxia in the glioblastoma microenvironment: Shaping the phenotype of cancer stem-like cells. Neuro-Oncology 2017, 19, 887–896. [Google Scholar] [CrossRef] [PubMed]
  21. McKeown, S.R. Defining normoxia, physoxia and hypoxia in tumours-implications for treatment response. Br. J. Radiol. 2014, 87, 20130676. [Google Scholar] [CrossRef] [PubMed]
  22. Schieber, M.; Chandel, N.S. ROS Function in Redox Signaling and Oxidative Stress. Curr. Biol. 2014, 24, R453–R462. [Google Scholar] [CrossRef] [PubMed] [Green Version]
  23. Moloney, J.N.; Cotter, T.G. ROS signalling in the biology of cancer. Semin. Cell Dev. Biol. 2018, 80, 50–64. [Google Scholar] [CrossRef] [PubMed]
  24. Tafani, M.; Sansone, L.; Limana, F.; Arcangeli, T.; De Santis, E.; Polese, M.; Fini, M.; Russo, M.A. The Interplay of Reactive Oxygen Species, Hypoxia, Inflammation, and Sirtuins in Cancer Initiation and Progression. Oxid. Med. Cell. Longev. 2016, 2016, 1–18. [Google Scholar] [CrossRef] [PubMed]
  25. Chandel, N.S.; Maltepe, E.; Goldwasser, E.; Mathieu, C.E.; Simon, M.C.; Schumacker, P.T. Mitochondrial reactive oxygen species trigger hypoxia-induced transcription. Proc. Natl. Acad. Sci. USA 1998, 95, 11715–11720. [Google Scholar] [CrossRef] [PubMed] [Green Version]
  26. Humpton, T.J.; Vousden, K.H. Regulation of Cellular Metabolism and Hypoxia by p53. Cold Spring Harb. Perspect. Med. 2016, 6, a026146. [Google Scholar] [CrossRef] [PubMed]
  27. Province, P.; Griguer, C.E.; Han, X.; Louis, N.; Fathallah, H. Hypoxia, Angiogenesis and Mechanisms for Invasion of Malignant Gliomas. In Evolution of the Molecular Biology of Brain Tumors and the Therapeutic Implications; Lichtor, T., Ed.; InTech: London, UK, 2013; ISBN 978-953-51-0989-1. [Google Scholar] [Green Version]
  28. Dayal, R.; Singh, A.; Pandey, A.; Mishra, K.P. Reactive oxygen species as mediator of tumor radiosensitivity. J. Cancer Res. Ther. 2014, 10, 811–818. [Google Scholar] [PubMed]
  29. Diehn, M.; Cho, R.W.; Lobo, N.A.; Kalisky, T.; Dorie, M.J.; Kulp, A.N.; Qian, D.; Lam, J.S.; Ailles, L.E.; Wong, M.; et al. Association of reactive oxygen species levels and radioresistance in cancer stem cells. Nature 2009, 458, 780–783. [Google Scholar] [CrossRef] [PubMed] [Green Version]
  30. Stupp, R.; Mason, W.P.; van den Bent, M.J.; Weller, M.; Fisher, B.; Taphoorn, M.J.B.; Belanger, K.; Brandes, A.A.; Marosi, C.; Bogdahn, U.; et al. Radiotherapy plus concomitant and adjuvant temozolomide for glioblastoma. N. Engl. J. Med. 2005, 352, 987–996. [Google Scholar] [CrossRef] [PubMed]
  31. Lin, C.-J.; Lee, C.-C.; Shih, Y.-L.; Lin, T.-Y.; Wang, S.-H.; Lin, Y.-F.; Shih, C.-M. Resveratrol enhances the therapeutic effect of temozolomide against malignant glioma in vitro and in vivo by inhibiting autophagy. Free Radic. Biol. Med. 2012, 52, 377–391. [Google Scholar] [CrossRef] [PubMed]
  32. Yin, H.; Zhou, Y.; Wen, C.; Zhou, C.; Zhang, W.; Hu, X.; Wang, L.; You, C.; Shao, J. Curcumin sensitizes glioblastoma to temozolomide by simultaneously generating ROS and disrupting AKT/mTOR signaling. Oncol. Rep. 2014, 32, 1610–1616. [Google Scholar] [CrossRef] [PubMed]
  33. Josephy, P.D.; Mannervik, B. Molecular Toxicology, 2nd ed.; Oxford University Press: Oxford, UK; New York, NY, USA, 2006; ISBN 978-0-19-517620-9. [Google Scholar]
  34. Ko, Y.-H.; Domingo-Vidal, M.; Roche, M.; Lin, Z.; Whitaker-Menezes, D.; Seifert, E.; Capparelli, C.; Tuluc, M.; Birbe, R.C.; Tassone, P.; et al. TP53-inducible Glycolysis and Apoptosis Regulator (TIGAR) Metabolically Reprograms Carcinoma and Stromal Cells in Breast Cancer. J. Biol. Chem. 2016, 291, 26291–26303. [Google Scholar] [CrossRef] [PubMed]
  35. Geng, J.; Wei, M.; Yuan, X.; Liu, Z.; Wang, X.; Zhang, D.; Luo, L.; Wu, J.; Guo, W.; Qin, Z.-H. TIGAR regulates mitochondrial functions through SIRT1-PGC1α pathway and translocation of TIGAR into mitochondria in skeletal muscle. FASEB J. 2019. [Google Scholar] [CrossRef] [PubMed]
  36. Bartrons, R.; Simon-Molas, H.; Rodríguez-García, A.; Castaño, E.; Navarro-Sabaté, À.; Manzano, A.; Martinez-Outschoorn, U.E. Fructose 2,6-Bisphosphate in Cancer Cell Metabolism. Front. Oncol. 2018, 8, 331. [Google Scholar] [CrossRef] [PubMed]
  37. Cheung, E.C.; Athineos, D.; Lee, P.; Ridgway, R.A.; Lambie, W.; Nixon, C.; Strathdee, D.; Blyth, K.; Sansom, O.J.; Vousden, K.H. TIGAR is required for efficient intestinal regeneration and tumorigenesis. Dev. Cell 2013, 25, 463–477. [Google Scholar] [CrossRef] [PubMed]
  38. Wong, E.Y.L.; Wong, S.-C.C.; Chan, C.M.L.; Lam, E.K.Y.; Ho, L.Y.; Lau, C.P.Y.; Au, T.C.C.; Chan, A.K.C.; Tsang, C.M.; Tsao, S.W.; et al. TP53-induced glycolysis and apoptosis regulator promotes proliferation and invasiveness of nasopharyngeal carcinoma cells. Oncol. Lett. 2015, 9, 569–574. [Google Scholar] [CrossRef] [PubMed]
  39. Shen, M.; Zhao, X.; Zhao, L.; Shi, L.; An, S.; Huang, G.; Liu, J. Met is involved in TIGAR-regulated metastasis of non-small-cell lung cancer. Mol. Cancer 2018, 17, 88. [Google Scholar] [CrossRef] [PubMed]
  40. Mao, Z.; Han, X.; Chen, D.; Xu, Y.; Xu, L.; Yin, L.; Sun, H.; Qi, Y.; Fang, L.; Liu, K.; et al. Potent effects of dioscin against hepatocellular carcinoma through regulating TIGAR-mediated apoptosis, autophagy and DNA damage. Br. J. Pharmacol. 2019. [Google Scholar] [CrossRef] [PubMed]
  41. Vousden, K.H. p53 pathways and cancer cell metabolism 2018. Presented at the Frankfurt Cancer Conference, Frankfurt, Germany, 26 September 2018. [Google Scholar]
  42. Lin, L.; Mi, Y.; Li, X.; Peng, C.; Shangguan, Z.; Li, Z.; Liu, S. Higher plasma concentration of TP53-induced glycolysis and apoptosis regulator is associated with a lower risk of colorectal cancer metastasis. Cancer Manag. Res. 2019, 11, 263–272. [Google Scholar] [CrossRef] [PubMed]
  43. Geng, J.; Yuan, X.; Wei, M.; Wu, J.; Qin, Z.-H. The diverse role of TIGAR in cellular homeostasis and cancer. Free Radic. Res. 2018, 52, 1240–1249. [Google Scholar] [CrossRef] [PubMed]
  44. Rajendran, R.; Garva, R.; Ashour, H.; Leung, T.; Stratford, I.; Krstic-Demonacos, M.; Demonacos, C. Acetylation mediated by the p300/CBP-associated factor determines cellular energy metabolic pathways in cancer. Int. J. Oncol. 2013, 42, 1961–1972. [Google Scholar] [CrossRef] [PubMed] [Green Version]
  45. Wang, H.-H.; Chang, T.-Y.; Lin, W.-C.; Wei, K.-C.; Shin, J.-W. GADD45A plays a protective role against temozolomide treatment in glioblastoma cells. Sci. Rep. 2017, 7, 8814. [Google Scholar] [CrossRef] [PubMed] [Green Version]
  46. Hammond, E.M.; Giaccia, A.J. The role of p53 in hypoxia-induced apoptosis. Biochem. Biophys. Res. Commun. 2005, 331, 718–725. [Google Scholar] [CrossRef] [PubMed]
  47. Fei, P.; El-Deiry, W.S. P53 and radiation responses. Oncogene 2003, 22, 5774–5783. [Google Scholar] [CrossRef] [PubMed] [Green Version]
  48. Semenza, G.L. Hydroxylation of HIF-1: Oxygen sensing at the molecular level. Physiology 2004, 19, 176–182. [Google Scholar] [CrossRef] [PubMed]
  49. Kim, Y.-H.; Yoo, K.-C.; Cui, Y.-H.; Uddin, N.; Lim, E.-J.; Kim, M.-J.; Nam, S.-Y.; Kim, I.-G.; Suh, Y.; Lee, S.-J. Radiation promotes malignant progression of glioma cells through HIF-1alpha stabilization. Cancer Lett. 2014, 354, 132–141. [Google Scholar] [CrossRef] [PubMed]
  50. Moeller, B.J.; Cao, Y.; Li, C.Y.; Dewhirst, M.W. Radiation activates HIF-1 to regulate vascular radiosensitivity in tumors: Role of reoxygenation, free radicals, and stress granules. Cancer Cell 2004, 5, 429–441. [Google Scholar] [CrossRef]
  51. Sermeus, A.; Michiels, C. Reciprocal influence of the p53 and the hypoxic pathways. Cell Death Dis. 2011, 2, e164. [Google Scholar] [CrossRef] [PubMed]
  52. Yu, H.-P.; Xie, J.-M.; Li, B.; Sun, Y.-H.; Gao, Q.-G.; Ding, Z.-H.; Wu, H.-R.; Qin, Z.-H. TIGAR regulates DNA damage and repair through pentosephosphate pathway and Cdk5-ATM pathway. Sci. Rep. 2015, 5, 9853. [Google Scholar] [CrossRef] [PubMed] [Green Version]
  53. Turgeon, M.-O.; Perry, N.J.S.; Poulogiannis, G. DNA Damage, Repair, and Cancer Metabolism. Front. Oncol. 2018, 8, 15. [Google Scholar] [CrossRef] [PubMed]
  54. Uhlen, M.; Zhang, C.; Lee, S.; Sjöstedt, E.; Fagerberg, L.; Bidkhori, G.; Benfeitas, R.; Arif, M.; Liu, Z.; Edfors, F.; et al. A pathology atlas of the human cancer transcriptome. Science 2017, 357, eaan2507. [Google Scholar] [CrossRef] [PubMed]
  55. Kastenhuber, E.R.; Lowe, S.W. Putting p53 in Context. Cell 2017, 170, 1062–1078. [Google Scholar] [CrossRef] [PubMed]
  56. Agnihotri, S.; Zadeh, G. Metabolic reprogramming in glioblastoma: The influence of cancer metabolism on epigenetics and unanswered questions. Neuro-Oncology 2016, 18, 160–172. [Google Scholar] [CrossRef] [PubMed]
  57. Corbet, C.; Feron, O. Tumour acidosis: From the passenger to the driver’s seat. Nat. Rev. Cancer 2017, 17, 577–593. [Google Scholar] [CrossRef] [PubMed]
  58. Westergaard, N.; Waagepetersen, H.S.; Belhage, B.; Schousboe, A. Citrate, a Ubiquitous Key Metabolite with Regulatory Function in the CNS. Neurochem. Res. 2017, 42, 1583–1588. [Google Scholar] [CrossRef] [PubMed]
  59. Mycielska, M.E.; Dettmer, K.; Rümmele, P.; Schmidt, K.; Prehn, C.; Milenkovic, V.M.; Jagla, W.; Madej, G.M.; Lantow, M.; Schladt, M.; et al. Extracellular Citrate Affects Critical Elements of Cancer Cell Metabolism and Supports Cancer Development In Vivo. Cancer Res. 2018, 78, 2513–2523. [Google Scholar] [CrossRef] [PubMed]
  60. Yin, C.; He, D.; Chen, S.; Tan, X.; Sang, N. Exogenous pyruvate facilitates cancer cell adaptation to hypoxia by serving as an oxygen surrogate. Oncotarget 2016, 7, 47494–47510. [Google Scholar] [CrossRef] [PubMed]
  61. Chen, X.; Song, M.; Zhang, B.; Zhang, Y. Reactive Oxygen Species Regulate T Cell Immune Response in the Tumor Microenvironment. Oxid. Med. Cell. Longev. 2016, 2016, 1580967. [Google Scholar] [CrossRef] [PubMed]
  62. Henze, A.-T.; Riedel, J.; Diem, T.; Wenner, J.; Flamme, I.; Pouyseggur, J.; Plate, K.H.; Acker, T. Prolyl hydroxylases 2 and 3 act in gliomas as protective negative feedback regulators of hypoxia-inducible factors. Cancer Res. 2010, 70, 357–366. [Google Scholar] [CrossRef] [PubMed]
  63. Ishii, N.; Maier, D.; Merlo, A.; Tada, M.; Sawamura, Y.; Diserens, A.C.; Van Meir, E.G. Frequent co-alterations of TP53, p16/CDKN2A, p14ARF, PTEN tumor suppressor genes in human glioma cell lines. Brain Pathol. 1999, 9, 469–479. [Google Scholar] [CrossRef] [PubMed]
  64. Wischhusen, J.; Naumann, U.; Ohgaki, H.; Rastinejad, F.; Weller, M. CP-31398, a novel p53-stabilizing agent, induces p53-dependent and p53-independent glioma cell death. Oncogene 2003, 22, 8233–8245. [Google Scholar] [CrossRef] [PubMed] [Green Version]
  65. Weinmann, L.; Wischhusen, J.; Demma, M.J.; Naumann, U.; Roth, P.; Dasmahapatra, B.; Weller, M. A novel p53 rescue compound induces p53-dependent growth arrest and sensitises glioma cells to Apo2L/TRAIL-induced apoptosis. Cell Death Differ. 2008, 15, 718–729. [Google Scholar] [CrossRef] [PubMed] [Green Version]
  66. Schneider, C.A.; Rasband, W.S.; Eliceiri, K.W. NIH Image to ImageJ: 25 years of image analysis. Nat. Methods 2012, 9, 671–675. [Google Scholar] [CrossRef] [PubMed] [Green Version]
  67. Livak, K.J.; Schmittgen, T.D. Analysis of relative gene expression data using real-time quantitative PCR and the 2(-Delta Delta C(T)) Method. Methods 2001, 25, 402–408. [Google Scholar] [CrossRef] [PubMed]
  68. Hermisson, M.; Klumpp, A.; Wick, W.; Wischhusen, J.; Nagel, G.; Roos, W.; Kaina, B.; Weller, M. O6-methylguanine DNA methyltransferase and p53 status predict temozolomide sensitivity in human malignant glioma cells. J. Neurochem. 2006, 96, 766–776. [Google Scholar] [CrossRef] [PubMed] [Green Version]
  69. Berra, E.; Benizri, E.; Ginouvès, A.; Volmat, V.; Roux, D.; Pouysségur, J. HIF prolyl-hydroxylase 2 is the key oxygen sensor setting low steady-state levels of HIF-1alpha in normoxia. EMBO J. 2003, 22, 4082–4090. [Google Scholar] [CrossRef] [PubMed]
  70. Dyer, B.W.; Ferrer, F.A.; Klinedinst, D.K.; Rodriguez, R. A noncommercial dual luciferase enzyme assay system for reporter gene analysis. Anal. Biochem. 2000, 282, 158–161. [Google Scholar] [CrossRef] [PubMed]
  71. Hofmann, U.; Maier, K.; Niebel, A.; Vacun, G.; Reuss, M.; Mauch, K. Identification of metabolic fluxes in hepatic cells from transient 13C-labeling experiments: Part I. Experimental observations. Biotechnol. Bioeng. 2008, 100, 344–354. [Google Scholar] [CrossRef] [PubMed]
Figure 1. LNT-229 cells were transiently transfected with pcDNA3-HIF-1α or pcDNA3 control and subjected to normoxia (A) and hypoxia (C) 24 h later. Another 24 h later, HIF-1α and the TP53-induced glycolysis and apoptosis regulator (TIGAR) expression was analyzed by RT-qPCR (mean + SD, * p < 0.05, ** p < 0.01). LNT-229 cells that stably expressed shRNA targeting HIF-1α or its Drosophila homolog Sima (control), were grown in normoxia (B) and hypoxia (D) and 24 h later checked for HIF-1α and TIGAR mRNA content (mean + SD, * p < 0.05) (E, F). To verify the successful modulation of HIF-1α, HIF-specific transcriptional activity was examined by luciferase reporter assay (mean + SD, ** p < 0.01).
Ijms 20 01061 g001
Figure 2. (A) shRNA-mediated TIGAR attenuation was verified by RT-qPCR (left, mean + SD, * p < 0.05, ** p < 0.01) and western blot analysis (center, densitometric analysis, right, film). (B) LNT-229 cells stably expressing a scrambled shRNA sequence (scr sh) or shRNA targeting TIGAR (TIGAR sh 97) were cultured in serum-free medium supplemented with 5 mM glucose under normoxic or hypoxic conditions for 24 h. Intracellular ROS were determined using H2DCFDA and flow cytometry (median fluorescence intensity, mean + SD, * p < 0.05). (C) LNT-229-shTIGAR (TIGAR sh 3) and control (scr L1) cells were grown in normoxia. After 24 h, 48 h, 72 h and 96 h, crystal violet staining was performed to evaluate cell density.
Ijms 20 01061 g002
Figure 3. LNT-229-shTIGAR (TIGAR sh 97) and control (scr sh) cells were cultured in serum-free medium supplemented with 2 mM glucose for 36 h. Thereafter, cell death was assessed by propidium iodide staining and flow cytometry (mean percentage of PI-positive cells + SD, ** p < 0.01).
Ijms 20 01061 g003
Figure 4. (A) LNT-229-shTIGAR (TIGAR sh 97) and control (scr sh) cells were cultured in medium supplemented with 10% FCS and 25 mM glucose for 24 h and then irradiated with a photon dose of 2 Gy. After 6 h, ROS levels were determined (median fluorescence intensity, mean + SD, * p < 0.05). (B) LNT-229-shTIGAR (TIGAR sh 3) and control (scr sh L1) cells were seeded at low density (500 cells per six-well), 24 h later irradiated, and then monitored for clonogenic survival (left, mean number of the colonies, displayed as percentages of the controls, + SD, ** p < 0.01) (right, representative photo of the colonies stained with crystal violet in six-wells).
Ijms 20 01061 g004
Figure 5. (A) LNT-229-shTIGAR (TIGAR sh 3) and control (scr sh L1) cells were exposed to temozolomide (TMZ) in serum-free medium. After 24 h, adherent cells were stained with crystal violet (left, mean absorbance, displayed as percentages of controls, + SD, ** p < 0.01). In parallel, BrdU incorporation was determined (right, mean + SD, ** p < 0.01). (B) Cells were treated with temozolomide, and assessed for clonogenic survival (mean number of colonies, displayed as percentages of controls, + SD, ** p < 0.01). (C) Following treatment with temozolomide, TIGAR expression was analyzed in LNT-229 cells (mean + SD, * p < 0.05).
Ijms 20 01061 g005
Figure 6. LNT-229-shTIGAR (TIGAR sh 3) and control (scr sh L1) cells were cultured in serum-free medium supplemented with 2 mM glucose for 8 h. Subsequently, the contents of pyruvate, lactate, and citrate in the supernatants were measured (mean + SD, * p < 0.05, ** p < 0.01).
Ijms 20 01061 g006