Adhesive Properties of the Hyaluronan Pericellular Coat in Hyaluronan Synthases Overexpressing Mesenchymal Stem Cells

 , and
, and
Abstract
:1. Introduction
2. Results
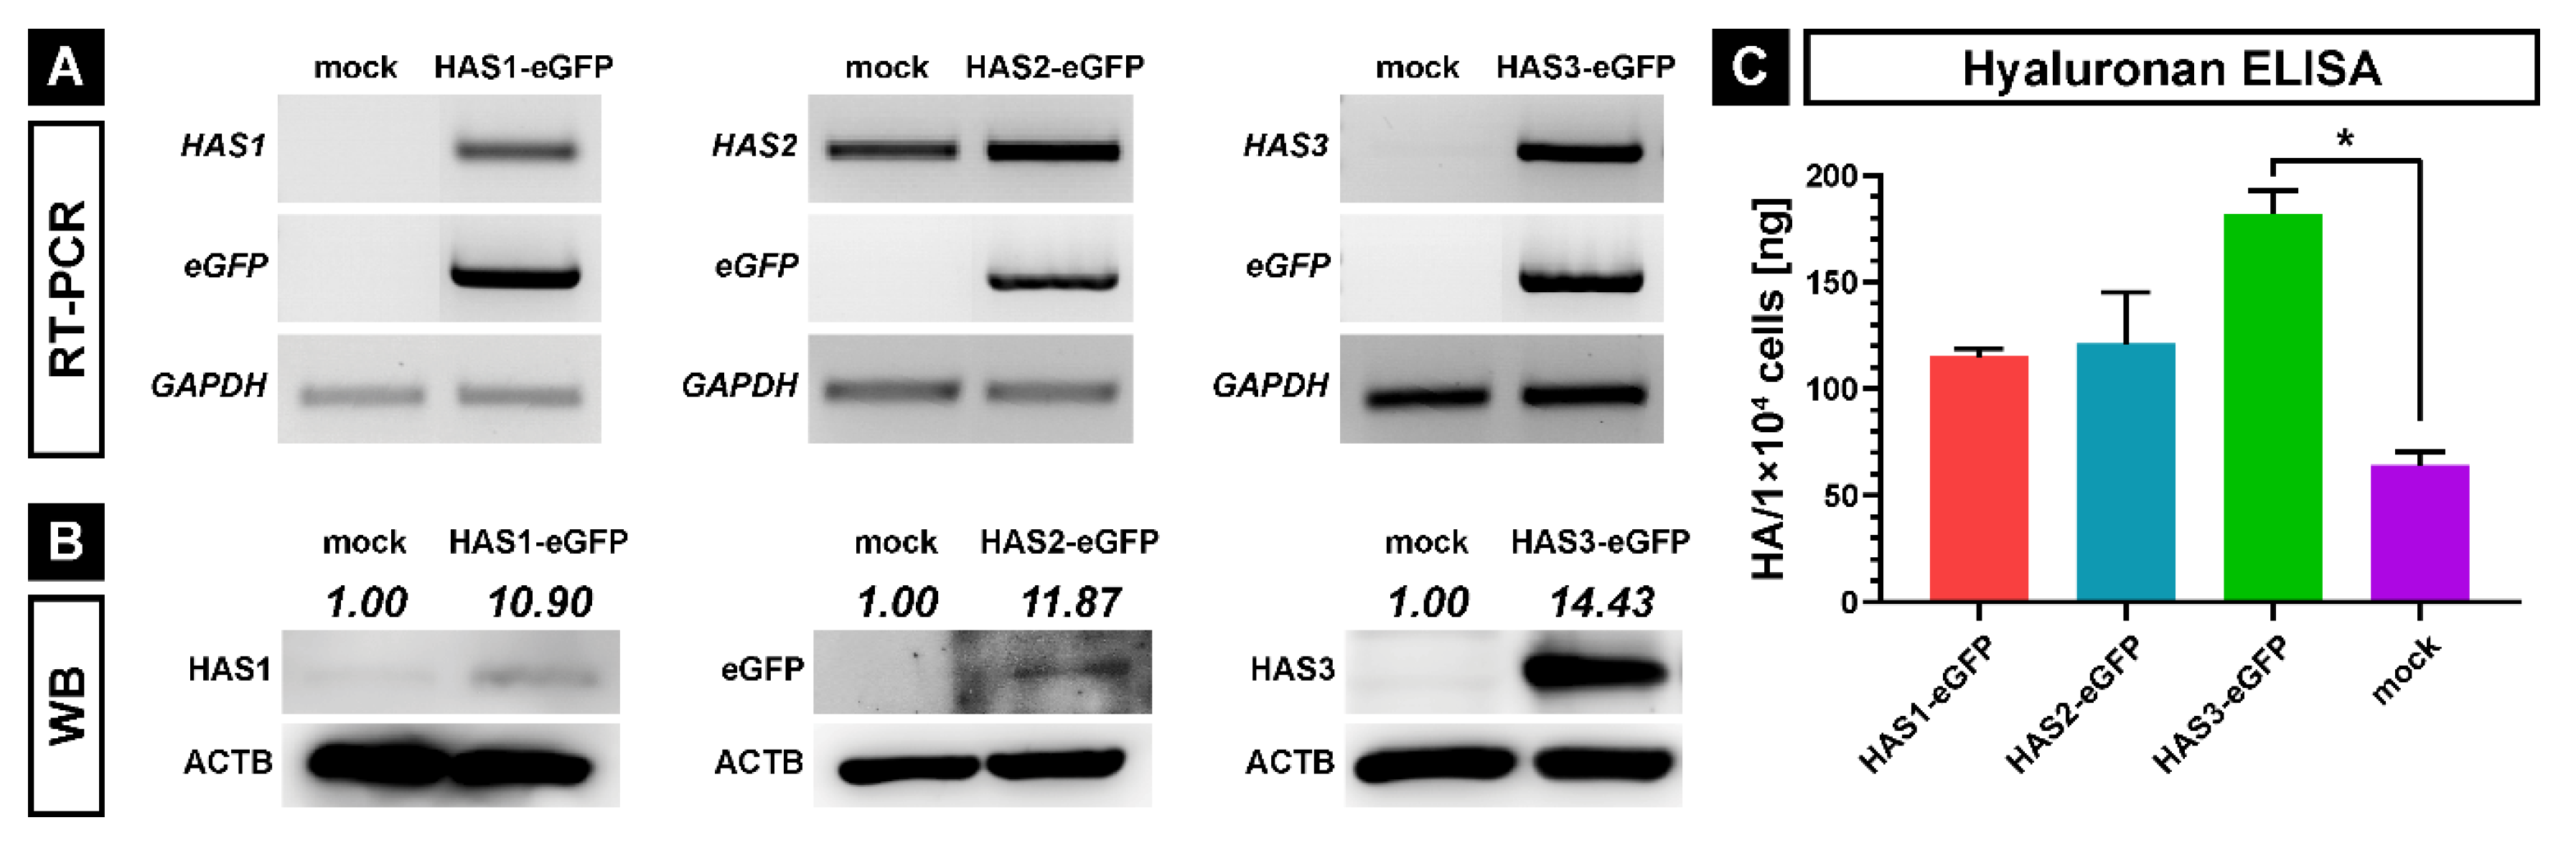
2.1. Generation of HAS-eGFP Overexpressing hMSCs
2.2. The Pericellular Coat on HAS-eGFP Overexpressing hMSCs
2.3. The Adhesion Properties of HAS-eGFP Overexpressing hMSCs to Tissue Culture Polystyrene Surface
2.4. Focal Adhesion Formation in HAS-eGFP Overexpressing hMSCs during Attachment and Spreading
2.5. Single Cell Force Spectroscopy of HAS-eGFP Overexpressing hMSCs
3. Discussion
4. Materials and Methods
4.1. Cloning of HAS-eGFP and Transduction of hMSCs
4.2. Cell Culture Conditions
4.3. Reverse Transcriptase-Polymerase Chain Reaction (RT-PCR)
4.4. Western Blot
4.5. HA-ELISA
4.6. HA Coat Immunostaining
4.7. Time-Lapse Adhesion Assay
4.8. Spreading Assay
4.9. Quantification of Focal Adhesions
4.10. AFM-Adhesion Assay
4.11. Statistical Analysis
Author Contributions
Funding
Acknowledgments
Conflicts of Interest
Abbreviations
| ACTB | actin-beta |
| AFM | atomic force microscopy |
| aJ | attojoule |
| BSA | bovine serum albumin |
| Col-I | type I collagen |
| DAPI | 4,6-diamidino-2-phenylindole |
| DPBS | Dulbecco’s phosphate-buffered saline |
| ECM | extracellular matrix |
| FGF-2 | fibroblast growth factor 2 |
| GAPDH | glyceraldehyde 3-phosphate dehydrogenase |
| GlcNAc | N-acetyl-D-glucosamine |
| HA | hyaluronan |
| HABP | hyaluronic acid binding protein |
| HAse | hyaluronidase |
| HAS | hyaluronan synthase |
| HASes | hyaluronan synthases |
| hMSCs | human mesenchymal stem cells |
| kDa | kilodalton |
| min | minutes |
| pN | piconewton |
| RT-PCR | reverse transcriptase-polymerase chain reaction |
| SCFS | single cell force spectroscopy |
| Sec | seconds |
| TCPS | tissue culture polystyrene |
References
- Laurent, T.C. Biochemistry of hyaluronan. Acta Otolaryngol. Suppl. 1987, 442, 7–24. [Google Scholar] [CrossRef]
- Toole, B.P. Hyaluronan: From extracellular glue to pericellular cue. Nat. Rev. Cancer 2004, 4, 528–539. [Google Scholar] [CrossRef]
- Lee, G.M.; Johnstone, B.; Jacobson, K.; Caterson, B. The dynamic structure of the pericellular matrix on living cells. J. Cell Biol. 1993, 123 Pt 2, 1899–1907. [Google Scholar] [CrossRef]
- Qu, C.; Rilla, K.; Tammi, R.; Tammi, M.; Kroger, H.; Lammi, M.J. Extensive CD44-dependent hyaluronan coats on human bone marrow-derived mesenchymal stem cells produced by hyaluronan synthases HAS1, HAS2 and HAS3. Int. J. Biochem. Cell Biol. 2014, 48, 45–54. [Google Scholar] [CrossRef]
- Cohen, M.; Kam, Z.; Addadi, L.; Geiger, B. Dynamic study of the transition from hyaluronan- to integrin-mediated adhesion in chondrocytes. EMBO J. 2006, 25, 302–311. [Google Scholar] [CrossRef]
- Itano, N.; Sawai, T.; Yoshida, M.; Lenas, P.; Yamada, Y.; Imagawa, M.; Shinomura, T.; Hamaguchi, M.; Yoshida, Y.; Ohnuki, Y.; et al. Three isoforms of mammalian hyaluronan synthases have distinct enzymatic properties. J. Biol. Chem. 1999, 274, 25085–25092. [Google Scholar] [CrossRef] [Green Version]
- Itano, N.; Kimata, K. Mammalian hyaluronan synthases. IUBMB Life 2002, 54, 195–199. [Google Scholar] [CrossRef]
- Weigel, P.H.; DeAngelis, P.L. Hyaluronan synthases: A decade-plus of novel glycosyltransferases. J. Biol. Chem. 2007, 282, 36777–36781. [Google Scholar] [CrossRef] [Green Version]
- Knudson, C.B.; Knudson, W. Hyaluronan-binding proteins in development, tissue homeostasis, and disease. FASEB J. 1993, 7, 1233–1241. [Google Scholar] [CrossRef]
- Itano, N. Simple primary structure, complex turnover regulation and multiple roles of hyaluronan. J. Biochem. 2008, 144, 131–137. [Google Scholar] [CrossRef]
- Geiger, B.; Bershadsky, A.; Pankov, R.; Yamada, K.M. Transmembrane crosstalk between the extracellular matrix--cytoskeleton crosstalk. Nat. Rev. Mol. Cell Biol. 2001, 2, 793–805. [Google Scholar] [CrossRef]
- Cohen, M.; Joester, D.; Geiger, B.; Addadi, L. Spatial and temporal sequence of events in cell adhesion: From molecular recognition to focal adhesion assembly. Chembiochem 2004, 5, 1393–1399. [Google Scholar] [CrossRef]
- Zaidel-Bar, R.; Cohen, M.; Addadi, L.; Geiger, B. Hierarchical assembly of cell-matrix adhesion complexes. Biochem. Soc. Trans. 2004, 32 Pt 3, 416–420. [Google Scholar] [CrossRef]
- Zimmerman, E.; Geiger, B.; Addadi, L. Initial stages of cell-matrix adhesion can be mediated and modulated by cell-surface hyaluronan. Biophys. J. 2002, 82, 1848–1857. [Google Scholar] [CrossRef] [Green Version]
- Petit, V.; Thiery, J.P. Focal adhesions: Structure and dynamics. Biol. Cell 2000, 92, 477–494. [Google Scholar] [CrossRef]
- Zamir, E.; Geiger, B. Molecular complexity and dynamics of cell-matrix adhesions. J. Cell Sci. 2001, 114 Pt 20, 3583–3590. [Google Scholar]
- Hynes, R.O. Integrins: Bidirectional, allosteric signaling machines. Cell 2002, 110, 673–687. [Google Scholar] [CrossRef] [Green Version]
- Cohen, M.; Klein, E.; Geiger, B.; Addadi, L. Organization and adhesive properties of the hyaluronan pericellular coat of chondrocytes and epithelial cells. Biophys. J. 2003, 85, 1996–2005. [Google Scholar] [CrossRef] [Green Version]
- Hanein, D.; Sabanay, H.; Addadi, L.; Geiger, B. Selective interactions of cells with crystal surfaces. Implications for the mechanism of cell adhesion. J. Cell Sci. 1993, 104 Pt 2, 275–288. [Google Scholar]
- Hanein, D.; Geiger, B.; Addadi, L. Differential adhesion of cells to enantiomorphous crystal surfaces. Science 1994, 263, 1413–1416. [Google Scholar] [CrossRef] [Green Version]
- Friedenstein, A.J.; Chailakhjan, R.K.; Lalykina, K.S. The development of fibroblast colonies in monolayer cultures of guinea-pig bone marrow and spleen cells. Cell Tissue Kinet. 1970, 3, 393–403. [Google Scholar] [CrossRef]
- Caplan, A.I. Mesenchymal stem cells. J. Orthop. Res. 1991, 9, 641–650. [Google Scholar] [CrossRef]
- Prockop, D.J. Marrow stromal cells as stem cells for nonhematopoietic tissues. Science 1997, 276, 71–74. [Google Scholar] [CrossRef] [Green Version]
- Pittenger, M.F.; Discher, D.E.; Peault, B.M.; Phinney, D.G.; Hare, J.M.; Caplan, A.I. Mesenchymal stem cell perspective: Cell biology to clinical progress. NPJ Regen. Med. 2019, 4, 22. [Google Scholar] [CrossRef] [Green Version]
- Solis, M.A.; Chen, Y.H.; Wong, T.Y.; Bittencourt, V.Z.; Lin, Y.C.; Huang, L.L. Hyaluronan regulates cell behavior: A potential niche matrix for stem cells. Biochem. Res. Int. 2012, 2012, 346972. [Google Scholar] [CrossRef] [Green Version]
- Kota, D.J.; Prabhakara, K.S.; Cox, C.S.; Olson, S.D. MSCs and hyaluronan: Sticking together for new therapeutic potential? Int. J. Biochem. Cell Biol. 2014, 55, 1–10. [Google Scholar] [CrossRef]
- Bocker, W.; Yin, Z.; Drosse, I.; Haasters, F.; Rossmann, O.; Wierer, M.; Popov, C.; Locher, M.; Mutschler, W.; Docheva, D.; et al. Introducing a single-cell-derived human mesenchymal stem cell line expressing hTERT after lentiviral gene transfer. J. Cell Mol. Med. 2008, 12, 1347–1359. [Google Scholar] [CrossRef] [Green Version]
- Rilla, K.; Siiskonen, H.; Spicer, A.P.; Hyttinen, J.M.; Tammi, M.I.; Tammi, R.H. Plasma membrane residence of hyaluronan synthase is coupled to its enzymatic activity. J. Biol. Chem. 2005, 280, 31890–31897. [Google Scholar] [CrossRef] [Green Version]
- Sariisik, E.; Docheva, D.; Padula, D.; Popov, C.; Opfer, J.; Schieker, M.; Clausen-Schaumann, H.; Benoit, M. Probing the interaction forces of prostate cancer cells with collagen I and bone marrow derived stem cells on the single cell level. PLoS ONE 2013, 8, e57706. [Google Scholar] [CrossRef]
- Sariisik, E.; Popov, C.; Muller, J.P.; Docheva, D.; Clausen-Schaumann, H.; Benoit, M. Decoding Cytoskeleton-Anchored and Non-Anchored Receptors from Single-Cell Adhesion Force Data. Biophys. J. 2015, 109, 1330–1333. [Google Scholar] [CrossRef] [Green Version]
- Benoit, M.; Gabriel, D.; Gerisch, G.; Gaub, H.E. Discrete interactions in cell adhesion measured by single-molecule force spectroscopy. Nat. Cell Biol. 2000, 2, 313–317. [Google Scholar] [CrossRef]
- Polzer, H.; Volkmer, E.; Saller, M.M.; Prall, W.C.; Haasters, F.; Drosse, I.; Wilhelmi, A.; Mutschler, W.; Schieker, M. Comparison of different strategies for in vivo seeding of prevascularized scaffolds. Tissue Eng. Part C Methods 2014, 20, 11–18. [Google Scholar] [CrossRef]
- Kavanagh, D.P.; Robinson, J.; Kalia, N. Mesenchymal stem cell priming: Fine-tuning adhesion and function. Stem. Cell Rev. Rep. 2014, 10, 587–599. [Google Scholar] [CrossRef]
- Jung, E.M.; Kwon, O.; Kwon, K.S.; Cho, Y.S.; Rhee, S.K.; Min, J.K.; Oh, D.B. Evidences for correlation between the reduced VCAM-1 expression and hyaluronan synthesis during cellular senescence of human mesenchymal stem cells. Biochem. Biophys. Res. Commun. 2011, 404, 463–469. [Google Scholar] [CrossRef]
- Shimabukuro, Y.; Ueda, M.; Ichikawa, T.; Terashi, Y.; Yamada, S.; Kusumoto, Y.; Takedachi, M.; Terakura, M.; Kohya, A.; Hashikawa, T.; et al. Fibroblast growth factor-2 stimulates hyaluronan production by human dental pulp cells. J. Endod. 2005, 31, 805–808. [Google Scholar] [CrossRef]
- Calabro, A.; Oken, M.M.; Hascall, V.C.; Masellis, A.M. Characterization of hyaluronan synthase expression and hyaluronan synthesis in bone marrow mesenchymal progenitor cells: Predominant expression of HAS1 mRNA and up-regulated hyaluronan synthesis in bone marrow cells derived from multiple myeloma patients. Blood 2002, 100, 2578–2585. [Google Scholar] [CrossRef]
- Brinck, J.; Heldin, P. Expression of recombinant hyaluronan synthase (HAS) isoforms in CHO cells reduces cell migration and cell surface CD44. Exp. Cell Res. 1999, 252, 342–351. [Google Scholar] [CrossRef]
- Kultti, A.; Rilla, K.; Tiihonen, R.; Spicer, A.P.; Tammi, R.H.; Tammi, M.I. Hyaluronan synthesis induces microvillus-like cell surface protrusions. J. Biol. Chem. 2006, 281, 15821–15828. [Google Scholar] [CrossRef] [Green Version]
- Ponta, H.; Sherman, L.; Herrlich, P.A. CD44: From adhesion molecules to signalling regulators. Nat. Rev. Mol. Cell Biol. 2003, 4, 33–45. [Google Scholar] [CrossRef]
- Nilsson, S.K.; Haylock, D.N.; Johnston, H.M.; Occhiodoro, T.; Brown, T.J.; Simmons, P.J. Hyaluronan is synthesized by primitive hemopoietic cells, participates in their lodgment at the endosteum following transplantation, and is involved in the regulation of their proliferation and differentiation in vitro. Blood 2003, 101, 856–862. [Google Scholar] [CrossRef] [Green Version]
- Ellis, S.L.; Grassinger, J.; Jones, A.; Borg, J.; Camenisch, T.; Haylock, D.; Bertoncello, I.; Nilsson, S.K. The relationship between bone, hemopoietic stem cells, and vasculature. Blood 2011, 118, 1516–1524. [Google Scholar] [CrossRef]
- Schindelin, J.; Arganda-Carreras, I.; Frise, E.; Kaynig, V.; Longair, M.; Pietzsch, T.; Preibisch, S.; Rueden, C.; Saalfeld, S.; Schmid, B.; et al. Fiji: An open-source platform for biological-image analysis. Nat. Methods 2012, 9, 676–682. [Google Scholar] [CrossRef] [Green Version]
- Butt, H.-J.; Jaschke, M. Calculation of thermal noise in atomic force microscopy. Nanotechnology 1995, 6, 1–7. [Google Scholar] [CrossRef]
- Opfer, J.; Gottschalk, K.E. Identifying discrete states of a biological system using a novel step detection algorithm. PLoS ONE 2012, 7, e45896. [Google Scholar] [CrossRef] [Green Version]


| Primer | Sequence | Annealing Temperature |
|---|---|---|
| HAS1_for | 5′-GACTCCTGGGTCAGCTTCCTAAG-3′ | 55 °C |
| HAS1_rev | 5′-AAACTGCTGCAAGAGGTTATTCCT-3′ | 55 °C |
| HAS2_for | 5′-CATAAAGAAAGCTCGCAACACG-3′ | 55 °C |
| HAS2_rev | 5′-ACTGCTGAGGAATGAGATCCAG-3′ | 55 °C |
| HAS3_for | 5′-GACGACAGCCCTGCGTGT-3′ | 58 °C |
| HAS3_rev | 5′-TTGAGGTCAGGGAAGGAGAT-3′ | 58 °C |
| GFP_for | 5′-CAAGCTGACCCTGAAGTTCATCTGC-3′ | 50 °C |
| GFP_rev | 5′-CACGCTGCCGTCCTCGATGTTGTGG-3′ | 50 °C |
| GAPDH_for | 5′-CAACTACATGGTTTACATGTTC-3′ | 50 °C |
| GAPDH_rev | 5′-GCCAGTGGACTCCACGAC-3′ | 50 °C |
© 2020 by the authors. Licensee MDPI, Basel, Switzerland. This article is an open access article distributed under the terms and conditions of the Creative Commons Attribution (CC BY) license (http://creativecommons.org/licenses/by/4.0/).
Share and Cite
Reiprich, S.; Hofbauer, E.; Kiderlen, S.; Clausen-Schaumann, H.; Böcker, W.; Aszódi, A.; Schönitzer, V. Adhesive Properties of the Hyaluronan Pericellular Coat in Hyaluronan Synthases Overexpressing Mesenchymal Stem Cells. Int. J. Mol. Sci. 2020, 21, 3827. https://doi.org/10.3390/ijms21113827
Reiprich S, Hofbauer E, Kiderlen S, Clausen-Schaumann H, Böcker W, Aszódi A, Schönitzer V. Adhesive Properties of the Hyaluronan Pericellular Coat in Hyaluronan Synthases Overexpressing Mesenchymal Stem Cells. International Journal of Molecular Sciences. 2020; 21(11):3827. https://doi.org/10.3390/ijms21113827
Chicago/Turabian StyleReiprich, Sebastian, Eva Hofbauer, Stefanie Kiderlen, Hauke Clausen-Schaumann, Wolfgang Böcker, Attila Aszódi, and Veronika Schönitzer. 2020. "Adhesive Properties of the Hyaluronan Pericellular Coat in Hyaluronan Synthases Overexpressing Mesenchymal Stem Cells" International Journal of Molecular Sciences 21, no. 11: 3827. https://doi.org/10.3390/ijms21113827
APA StyleReiprich, S., Hofbauer, E., Kiderlen, S., Clausen-Schaumann, H., Böcker, W., Aszódi, A., & Schönitzer, V. (2020). Adhesive Properties of the Hyaluronan Pericellular Coat in Hyaluronan Synthases Overexpressing Mesenchymal Stem Cells. International Journal of Molecular Sciences, 21(11), 3827. https://doi.org/10.3390/ijms21113827