Simultaneous FTIR and Raman Spectroscopy in Endometrial Atypical Hyperplasia and Cancer

 ,
,
Abstract
:1. Introduction
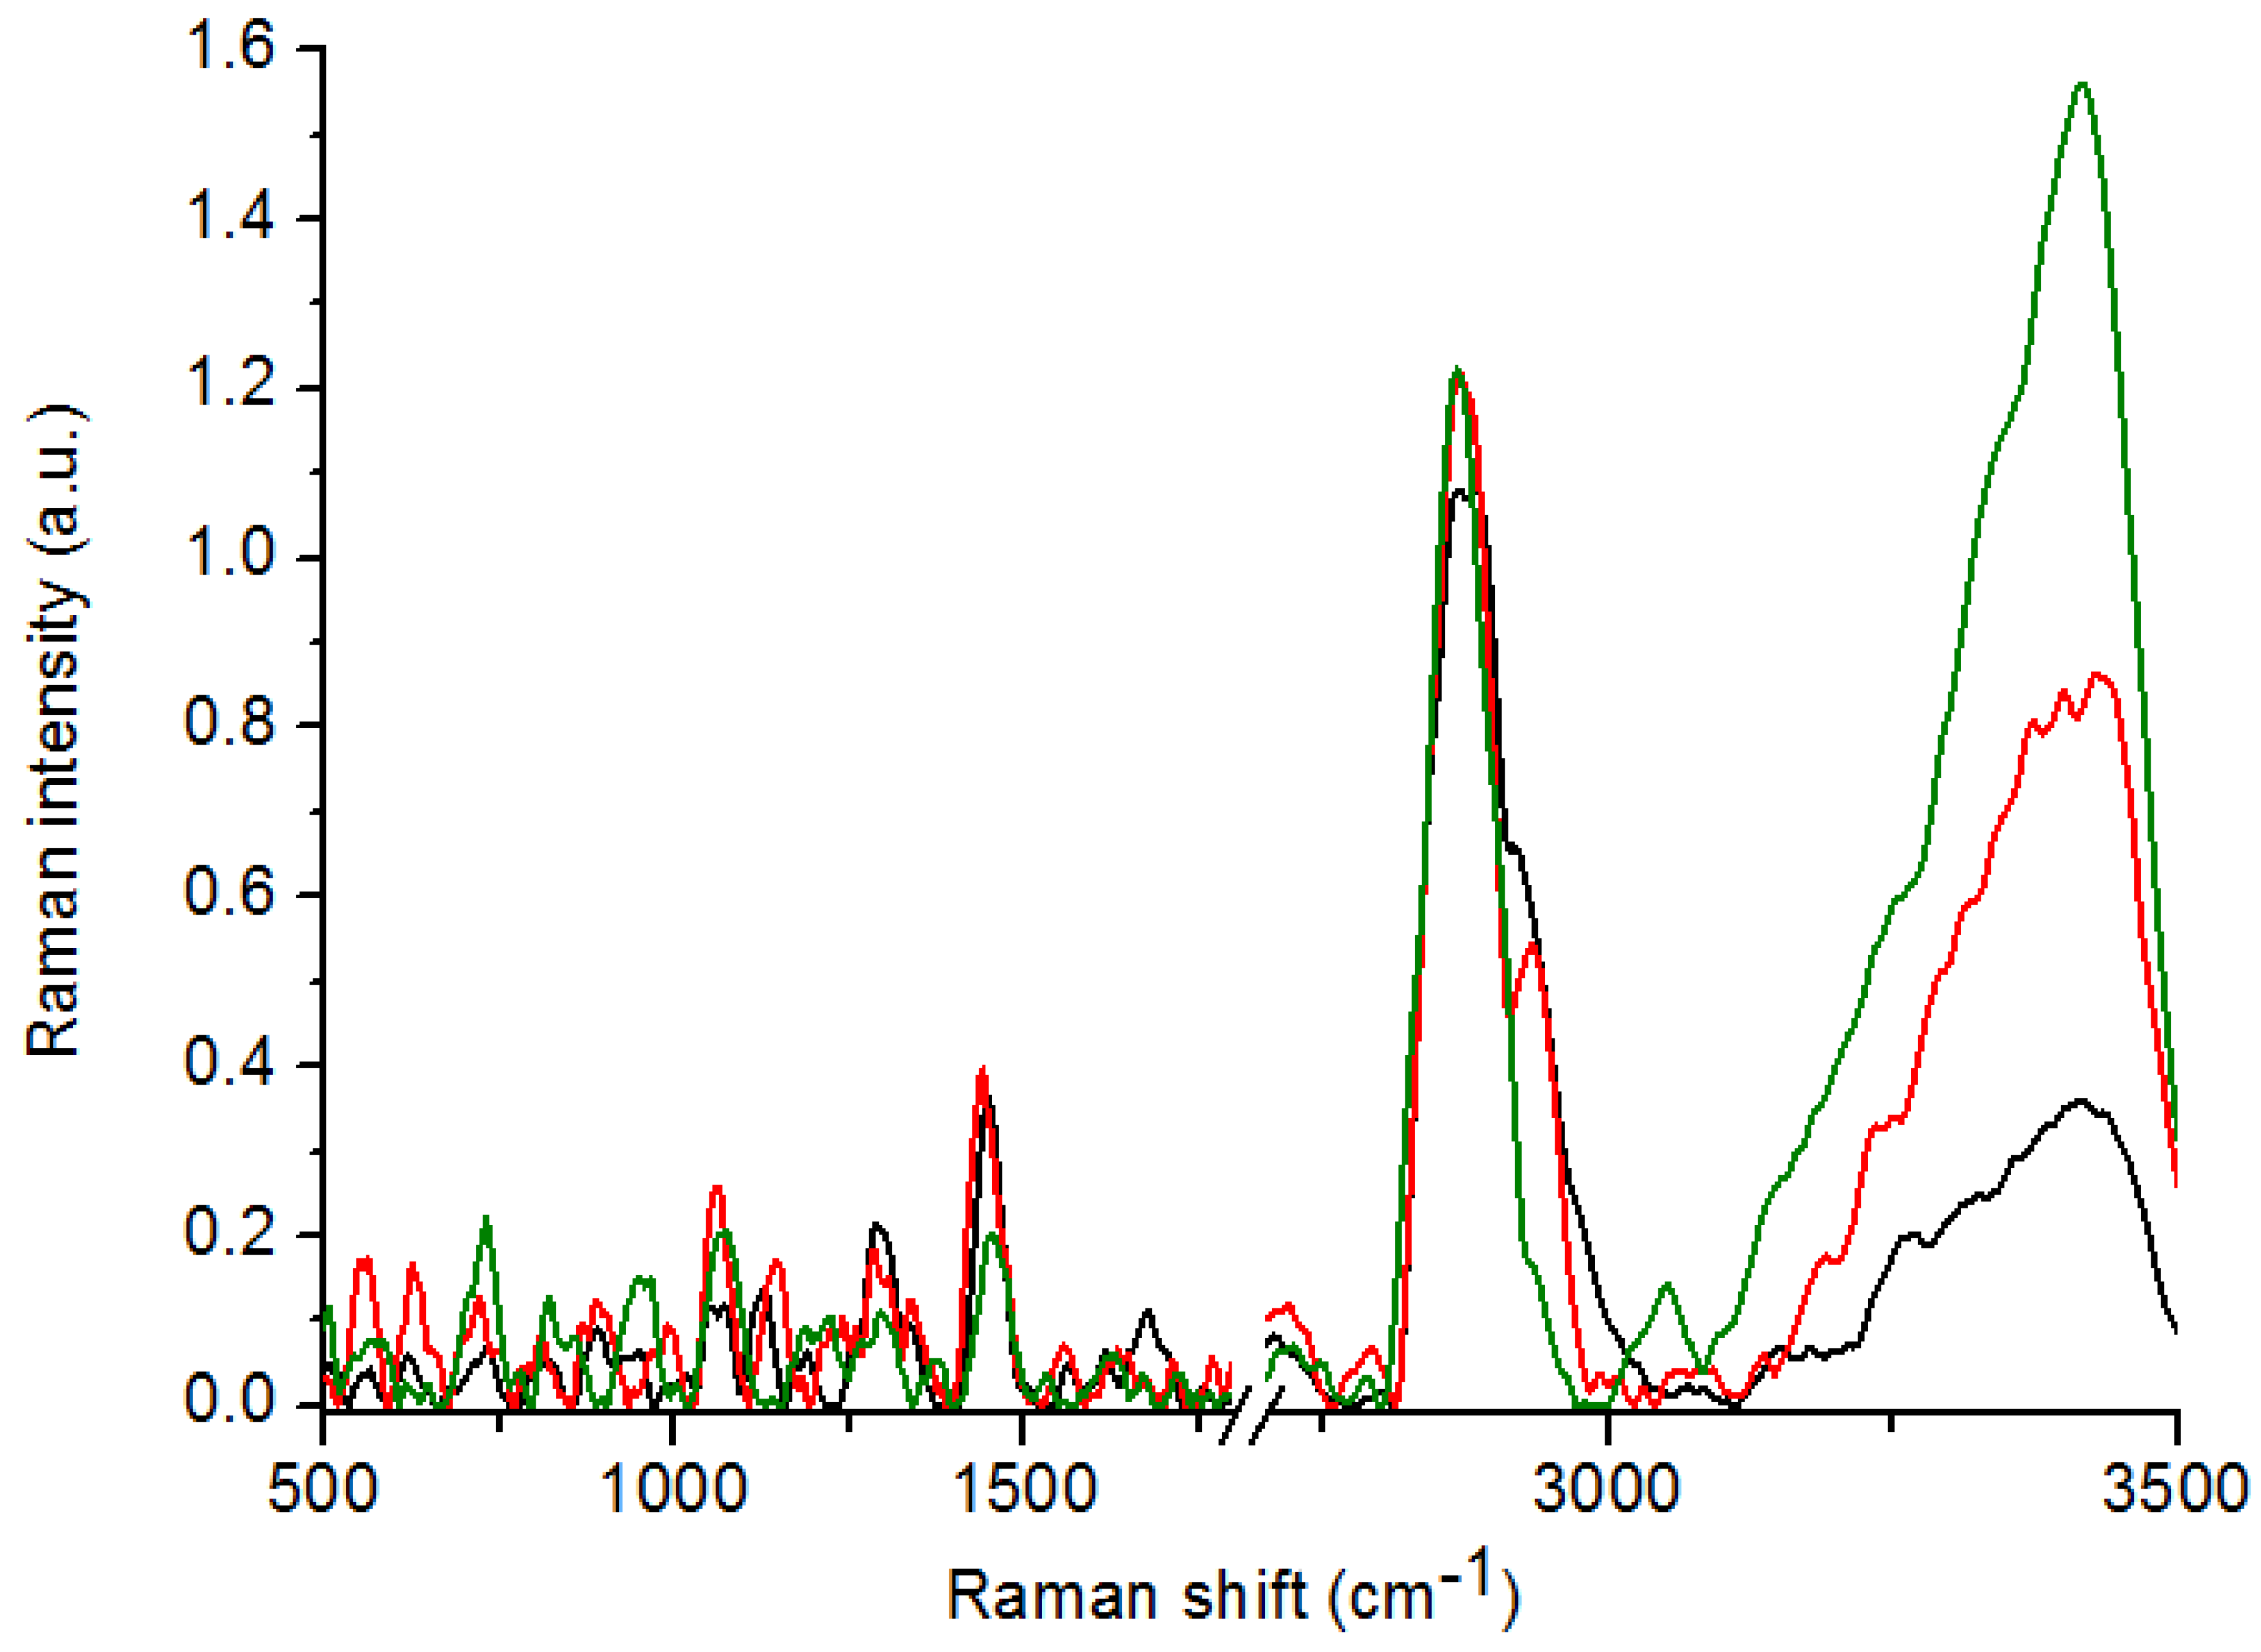
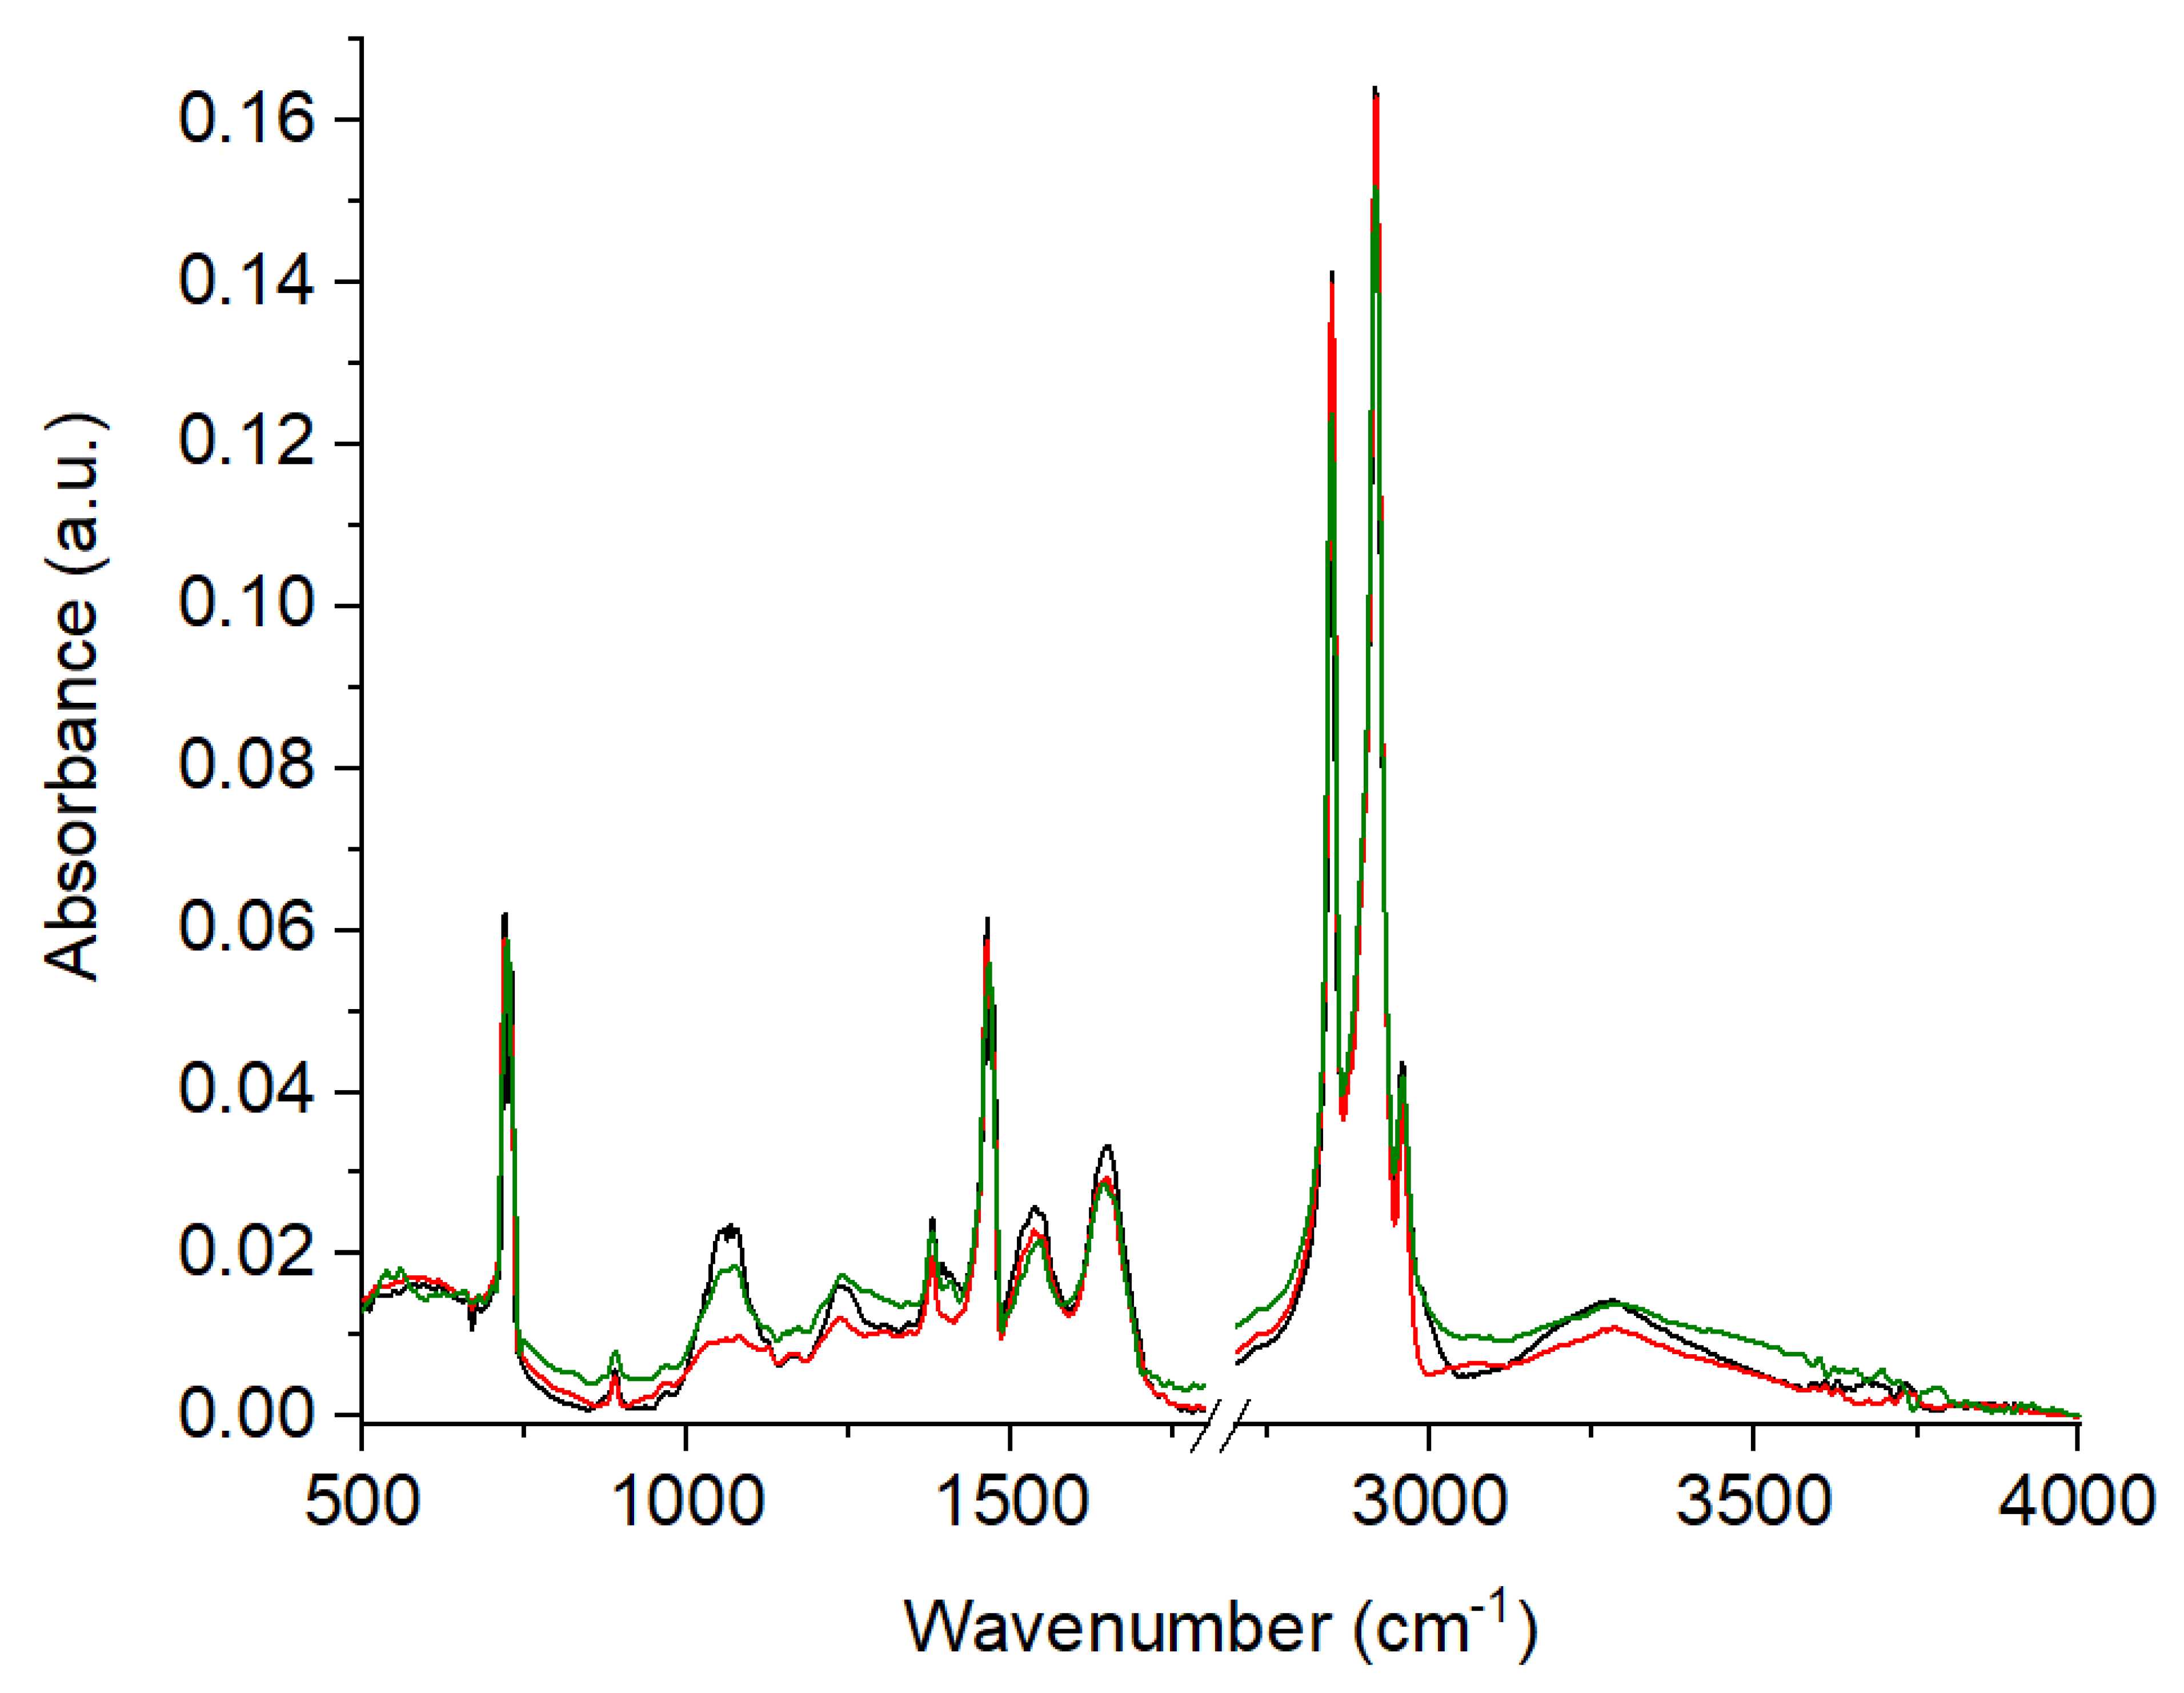
2. Results
3. Discussion
4. Materials and Methods
4.1. Materials Preparation
4.2. FT-Raman Measurement
4.3. FTIR Measurements
4.4. Multivariate Analysis and Pearson Correlation Coefficient
5. Conclusions
Author Contributions
Funding
Conflicts of Interest
References
- Ferlay, J.; Soerjomataram, I.; Dikshit, R.; Eser, S.; Mathers, C.; Rebelo, M.; Parkin, N.M.; Forman, D.; Bray, F. Cancer incidence and mortality worldwide: Sources, methods and major patterns in GLOBOCAN 2012. Int. J. Cancer 2015, 136, E359–E386. [Google Scholar] [CrossRef] [PubMed]
- Ozdegirmenci, O.; Kayıkçıoğlu, F.; Bozkurt, U.; Akgul, M.A.; Haberal, A. Comparison of the Efficacy of Three Progestins in the Treatment of Simple Endometrial Hyperplasia without Atypia. Gynecol. Obstet. Investig. 2011, 72, 10–14. [Google Scholar] [CrossRef] [PubMed]
- Collins, F.; MacPherson, S.; Brown, P.; Bombail, V.; Williams, A.R.W.; Anderson, R.A.; Jabbours, H.N.; Saunders, P.T.K. Expression of oestrogen receptors, ERalpha, ERbeta, and ERbeta variants, in endometrial cancers and evidence that prostaglandin F may play a role in regulating expression of ERalpha. BMC Cancer 2019, 9, 330. [Google Scholar]
- Matias-Guiu, X.; Prat, J. Molecular pathology of endometrial carcinoma. Histopathology 2013, 62, 111–123. [Google Scholar] [CrossRef] [PubMed]
- Ellenson, L.H.; Ronnett, B.M.; Kurman, R.J. Precursor Lesions of Endometrial Carcinoma. In Blaustein’s Pathology of the Female Genital Tract; Springer: Boston, MA, USA, 2011; pp. 359–391. [Google Scholar]
- Kurman, R.J.; Kaminski, P.F.; Norris, H.J. The behavior of endometrial hyperplasia. A long-term study of “untreated” hyperplasia in 170 patients. Cancer 1985, 56, 403–412. [Google Scholar] [CrossRef]
- Lacey, J.V., Jr.; Ioffe, O.B.; Ronnett, B.M.; Rush, B.B.; Richesson, D.A.; Chatterjee, N.; Langholz, B.; Glass, A.G.; Sherman, M.E. Endometrial carcinoma risk among women diagnosed with endometrial hyperplasia: The 34-year experience in a large health plan. Br. J. Cancer 2008, 98, 45–53. [Google Scholar] [CrossRef]
- Skov, B.G.; Broholm, H.; Engel, U.; Franzmann, M.-B.; Nielsen, A.L.; Lauritzen, A.F.; Skov, T. Comparison of the Reproducibility of the WHO Classifications of 1975 and 1994 of Endometrial Hyperplasia. Int. J. Gynecol. Pathol. 1997, 16, 33–37. [Google Scholar] [CrossRef]
- Kendall, B.S.; Ronnett, B.M.; Isacson, C.; Cho, K.R.; Hedrick, L.; Diener-West, M.; Kurman, R.J. Reproducibility of the Diagnosis of Endometrial Hyperplasia, Atypical Hyperplasia, and Well-Differentiated Carcinoma. Am. J. Surg. Pathol. 1998, 22, 1012–1019. [Google Scholar] [CrossRef]
- Trimble, C.L.; Kauderer, J.; Zaino, R.; Silverberg, S.; Lim, P.C.; Burke, J.J.; Alberts, D.; Curtin, J. Concurrent endometrial carcinoma in women with a biopsy diagnosis of atypical endometrial hyperplasia. Cancer 2006, 106, 812–819. [Google Scholar] [CrossRef]
- Chan, J.W.; Taylor, D.S.; Zwerdling, T.; Lane, S.M.; Ihara, K.; Huser, T. Micro-Raman Spectroscopy Detects Individual Neoplastic and Normal Hematopoietic Cells. Biophys. J. 2006, 90, 648–656. [Google Scholar] [CrossRef] [Green Version]
- Depciuch, J.; Parlinska-Wojtan, M. Qualitative and quantitative changes in phospholipids and proteins investigated by spectroscopic techniques in olfactory bulbectomy animal depression model. J. Pharm. Biomed. Anal. 2018, 148, 24–31. [Google Scholar] [CrossRef] [PubMed]
- Depciuch, J.; Kaznowska, E.; Zawlik, I.; Wojnarowska-Nowak, R.; Cholewa, M.; Heraud, P.; Cebulski, J. Application of Raman Spectroscopy and Infrared Spectroscopy in the Identification of Breast Cancer. Appl. Spectrosc. 2016, 70, 251–263. [Google Scholar] [CrossRef]
- Kaznowska, E.; Łach, K.; Depciuch, J.; Chaber, R.; Koziorowska, A.; Slobodian, S.; Kiper, K.; Chlebus, A.; Cebulski, J. Application of infrared spectroscopy for the identification of squamous cell carcinoma (lung cancer). Preliminary study. Infrared Phys. Technol. 2018, 89, 282–290. [Google Scholar] [CrossRef]
- Chaber, R.; Arthur, C.; Depciuch, J.; Łach, K.; Raciborska, A.; Michalak, E.; Cebulski, J. Distinguishing Ewing sarcoma and osteomyelitis using FTIR spectroscopy. Sci. Rep. 2018, 8, 15081. [Google Scholar] [CrossRef]
- Depciuch, J.; Stanek-Widera, A.; Skrzypiec, D.; Lange, D.; Biskup-Frużyńska, M.; Kiper, K.; Stanek-Tarkowska, J.; Kula, M.; Cebulski, J. Spectroscopic identification of benign (follicular adenoma) and cancerous lesions (follicular thyroid carcinoma) in thyroid tissues. J. Pharm. Biomed. Anal. 2019, 170, 321–326. [Google Scholar] [CrossRef]
- Depciuch, J.; Tołpa, B.; Witek, P.; Szmuc, K.; Kaznowska, E.; Osuchowski, M.; Król, P.; Cebulski, J. Raman and FTIR spectroscopy in determining the chemical changes in healthy brain tissues and glioblastoma tumor tissues. Spectrochim. Acta Part A Mol. Biomol. Spectrosc. 2020, 225, 117526. [Google Scholar] [CrossRef]
- Auner, G.W.; Koya, S.K.; Huang, C.; Broadbent, B.; Trexler, M.; Auner, Z.; Elias, A.; Mehne, K.C.; Brusatori, M.A. Applications of Raman spectroscopy in cancer diagnosis. Cancer Metastasis Rev. 2018, 37, 691–717. [Google Scholar] [CrossRef] [Green Version]
- Theophilou, G.; Morais, C.; Halliwell, D.E.; Lima, K.M.G.; Drury, J.; Martin-Hirsch, P.L.; Stringfellow, H.F.; Hapangama, D.K.; Martin, F.L. Synchrotron- and focal plane array-based Fourier-transform infrared spectroscopy differentiates the basalis and functionalis epithelial endometrial regions and identifies putative stem cell regions of human endometrial glands. Anal. Bioanal. Chem. 2018, 410, 4541–4554. [Google Scholar] [CrossRef] [Green Version]
- Sznurkowski, J.J. Endometriosis and the neoplastic process. Curr. Gynecol. Oncol. 2012, 10, 61–70. [Google Scholar]
- Parlatan, U.; Inanc, M.T.; Ozgor, B.Y.; Oral, E.; Bastu, E.; Unlu, M.B.; Basar, G. Raman spectroscopy as a non-invasive diagnostic technique for endometriosis. Sci. Rep. 2019, 9, 19795. [Google Scholar] [CrossRef] [PubMed] [Green Version]
- Fung, M.F.K.; Senterman, M.K.; Mikhael, N.Z.; Lacelle, S.; Wong, P.T.T. Pressure-tuning fourier transform infrared spectroscopic study of carcinogenesis in human endometrium. Biospectroscopy 1996, 2, 155–165. [Google Scholar] [CrossRef]
- Kelly, J.G.; Singh, M.N.; Stringfellow, H.F.; Walsh, M.J.; Nicholson, J.M.; Bahrami, F.; Ashton, K.M.; Pitt, M.A.; Martin-Hirsch, P.L.; Martin, F.L. Derivation of a subtype-specific biochemical signature of endometrial carcinoma using synchrotron-based Fourier-transform infrared microspectroscopy. Cancer Lett. 2009, 274, 208–217. [Google Scholar] [CrossRef] [PubMed]
- Taylor, S.E.; Cheung, K.T.; Patel, I.I.; Trevisan, J.; Stringfellow, H.F.; Ashton, K.M.; Wood, N.J.; Keating, P.J.; Martin-Hirsch, P.L.; Martin, F.L. Infrared spectroscopy with multivariate analysis to interrogate endometrial tissue: A novel and objective diagnostic approach. Br. J. Cancer 2011, 104, 790–797. [Google Scholar] [CrossRef] [PubMed] [Green Version]
- Laska, J.; Widlarz, J. Spectroscopic and structural characterization of low molecular weight fractions of polyaniline. Polymer 2005, 46, 1485–1495. [Google Scholar] [CrossRef]
- Seballos, L.; Zhang, J.Z.; Sutphen, R. Surface-enhanced Raman scattering detection of lysophosphatidic acid. Anal. Bioanal. Chem. 2005, 383, 763–767. [Google Scholar] [CrossRef] [PubMed] [Green Version]
- Shetty, G.; Kendall, C.; Shepherd, N.; Stone, N.; Barr, H. Raman spectroscopy: Elucidation of biochemical changes in carcinogenesis of oesophagus. Br. J. Cancer 2006, 94, 1460–1464. [Google Scholar] [CrossRef] [PubMed] [Green Version]
- Movasaghi, Z.; Rehman, S.; Rehman, I.U. Raman Spectroscopy of Biological Tissues. Appl. Spectrosc. Rev. 2007, 42, 493–541. [Google Scholar] [CrossRef]
- Shaikh, R.; Prabitha, V.G.; Dora, T.K.; Chopra, S.; Maheshwari, A.; Deodhar, K.; Rekhi, B.; Sukumar, N.; Krishna, C.M.; Subhash, N. A comparative evaluation of diffuse reflectance and Raman spectroscopy in the detection of cervical cancer. J. Biophotonics 2016, 10, 242–252. [Google Scholar] [CrossRef]
- Paluszkiewicz, C.; Kwiatek, W.M. Analysis of human cancer prostate tissues using FTIR microscopy and SXIXE techniques. J. Mol. Struct. 2001, 565–566, 329–334. [Google Scholar] [CrossRef]
- Argov, S.; Sahu, R.K.; Bernshtain, E.; Salman, A.; Shohat, G.; Zelig, U.; Mordechai, S. Inflammatory bowel diseases as an intermediate stage between normal and cancer: A FTIR-microspectroscopy approach. Biopolymers 2004, 75, 384–392. [Google Scholar] [CrossRef]
- Richter, T.; Steiner, G.; Abu-Id, M.H.; Salzer, R.; Bergmann, R.; Rodig, H.; Johannsen, B. Identification of tumor tissue by FTIR spectroscopy in combination with positron emission tomography. Vib. Spectrosc. 2002, 28, 103–110. [Google Scholar] [CrossRef]
- Naumann, D. FT-infrared and FT-Raman spectroscopy in biomedical research. In Infrared and Raman Spectroscopy of Biological Materials; Gremlich, H.U., Yan, B., Eds.; Marcel Dekker: New York, NY, USA, 2001; pp. 323–377. [Google Scholar]
- Wong, P.T.; Wong, R.K.; Caputo, T.A.; Godwin, T.A.; Rigas, B. Infrared spectroscopy of exfoliated human cervical cells: Evidence of extensive structural changes during carcinogenesis. Proc. Natl. Acad. Sci. USA 1991, 88, 10988–10992. [Google Scholar] [CrossRef] [Green Version]
- Fujioka, N.; Morimoto, Y.; Arai, T.; Kikuchi, M. Discrimination between normal and malignant human gastric tissues by Fourier transform infrared spectroscopy. Cancer Detect. Prev. 2004, 28, 32–36. [Google Scholar] [CrossRef]
- Conti, C.; Ferraris, P.; Giorgini, E.; Rubini, C.; Sabbatini, S.; Tosi, G.; Anastassopoulou, J.; Arapantoni, P.; Boukaki, E.; Konstadoudakis, S.; et al. FT-IR microimaging spectroscopy: A comparison between healthy and neoplastic human colon tissues. J. Mol. Struct. 2008, 881, 46–51. [Google Scholar] [CrossRef]
- Barth, A. Infrared spectroscopy of proteins. Biochim. Biophys. Acta Bioenerg. 2007, 1767, 1073–1101. [Google Scholar] [CrossRef] [Green Version]
- Sanderson, P.A.; Critchley, H.O.; Williams, A.R.; Arends, M.J.; Saunders, P.T. New concepts for an old problem: The diagnosis of endometrial hyperplasia. Hum. Reprod. Updat. 2017, 23, 232–254. [Google Scholar] [CrossRef]
- Herzbeg, G. Infrared and Raman Spectra; Van Nostrand: New York, NY, USA, 1945; pp. 239–249. [Google Scholar]
- Woodward, L.A. Introduction to the Theory of Molecular Vibrations and Vibrational Spectroscopy; Clarendon Press: Oxford, UK, 1972; pp. 253–272. [Google Scholar]
- Gonthier, C.; Piel, B.; Touboul, C.; Walker, F.; Cortez, A.; Luton, D.; Daraï, E.; Koskas, M. Cancer Incidence in Patients with Atypical Endometrial Hyperplasia Managed by Primary Hysterectomy or Fertility-sparing Treatment. Anticancer Res. 2015, 35, 6799–6804. [Google Scholar]
- Oda, K.; Koga, K.; Hirata, T.; Maruyama, M.; Ikemura, M.; Matsumoto, Y.; Nagasaka, K.; Adachi, K.; Mori-Uchino, M.; Sone, K.; et al. Risk of endometrial cancer in patients with a preoperative diagnosis of atypical endometrial hyperplasia treated with total laparoscopic hysterectomy. Gynecol. Minim. Invasive Ther. 2016, 5, 69–73. [Google Scholar] [CrossRef] [Green Version]
- Bednarek, M.; Constantinou, M.; Kępczyński, Ł.; Kassassir, A.; Sobczuk, A.; Wieszczycka, M.; Suzin, J.; Kałużewski, B. Evaluation of genomic imbalance in endometrial hyperplasia and carcinoma. Ginekol. Polska 2014, 85, 828–832. [Google Scholar] [CrossRef]
- Njoku, K.; Chiasserini, D.; Whetton, A.D.; Crosbie, E.J. Proteomic Biomarkers for the Detection of Endometrial Cancer. Cancers 2019, 11, 1572. [Google Scholar] [CrossRef] [PubMed] [Green Version]


| No. | Control (I) | Athypical Hyperplasia (II) | Carcinoma (III) | ΔI-II [cm−1] | ΔI-III [cm−1] | ΔII-III [cm−1] | Vibrations |
|---|---|---|---|---|---|---|---|
| 1 | 812 | * | 818 | max | −6 | max | Proline, hydroxyproline, tyrosine, PO2− stretching from nucleic acids |
| 2 | 890 | 884 | 880 | 6 | 10 | 4 | C-C stretching from proline and hydroxyproline |
| 3 | 1011 | * | * | max | max | 0 | Stretching vibrations of CO, CC, OCH from ring of polysaccharides and pectin |
| 4 | 1065 | 1064 | 1066 | 1 | −1 | −2 | PO2− stretching from nucleic acids |
| 5 | 1293 | 1296 | 1299 | −3 | −6 | −3 | Phosphodiester groups in nucleic acids |
| 6 | 1359 | * | 1374 | max | −15 | max | Tryptophan |
| 7 | 1447 | 1447 | 1447 | 0 | 0 | 0 | CH2 bending from lipids and proteins |
| 8 | 1553 | 1550 | 1558 | 3 | −5 | -8 | C=C, tryptophan (protein assignment) |
| 9 | 1695 | 1675 | 1668 | 20 | 27 | 7 | Amide I |
| 10 | 1776 | * | 1723 | max | 53 | max | C=O stretching from lipids |
| 11 | 2798 | 2720 | 2758 | 78 | 40 | −38 | CH3 stretching from lipids |
| 12 | * | 2869 | 2871 | max | max | −2 | CH2 stretching from lipids |
| No. | Control (I) | Athypical Hyperplasia (II) | Carcinoma (III) | ΔI-II [cm−1] | ΔI-III [cm−1] | ΔII-III [cm−1] | Vibrations |
|---|---|---|---|---|---|---|---|
| 1 | 889 | 889 | 889 | 0 | 0 | 0 | C-C, C-O deoxyribose, fatty acid, saccharide |
| 2 | 1073 | 1066 | 1080 | 7 | −7 | −14 | C-O stretching mode of C-OH groups of serine, threonine, and tyrosine of protein |
| 3 | * | * | 1124 | max | max | max | νC-O Carbohydrates |
| 4 | 1171 | 1169 | 1167 | 2 | 4 | 2 | ν(C-O), ν(C-C), def. C-O-H (proteins, glycogen, carbohydrates) |
| 5 | 1240 | 1241 | 1237 | −1 | 3 | 4 | Amide III (N-H bending, C-N stretch, C-C stretch) (proteins, DNA, phospholipids) |
| 6 | * | * | 1304 | max | max | max | Deformation N-H cytosine |
| 7 | 1341 | 1340 | * | 1 | max | max | CH2 wagging for proline (amino acids and collagen) |
| 8 | 1377 | 1378 | 1378 | −1 | −1 | 0 | CH3, CH2 wagging (lipids/proteins) |
| 9 | 1407 | 1394 | * | 13 | max | max | carbonate band ʋ(CO32−) |
| 10 | 1466 | 1462 | 1462 | 4 | 4 | 0 | CH2 group scissoring modes |
| 11 | 1544 | 1535 | 1535 | 9 | 9 | 0 | Amide II due to N-H bending and C-N stretching of proteins |
| 12 | 1642 | 1649 | 1646 | −7 | −4 | 3 | Amide I (ν(C=O), ν(CN), γ(CCN), δ(NH)) (proteins) |
| 13 | 2847 | 2848 | 2847 | −1 | 0 | 1 | Symmetric stretching of the CH2 group due to mainly lipids, with little contribution from proteins, carbohydrates and nucleic acids |
| 14 | 2915 | 2915 | 2915 | 0 | 0 | 0 | CH2 asymmetric stretch: mainly lipids, with little contribution from proteins, carbohydrates, nucleic acids |
| 15 | 2957 | 2956 | 2956 | 1 | 1 | 0 | CH3 asymmetric stretch: mainly lipids |
| 16 | 3284 | 3280 | 3283 | 4 | 1 | −3 | ʋ̵NH stretching of the peptide bond (–NHCO) of proteins and ʋ̵OH groups of water |
| Raman Spectroscopy | FTIR Spectroscopy | ||||||
|---|---|---|---|---|---|---|---|
| Control n = 17 | Atypical Hyperplasia n = 12 | Cancer n = 16 | Control n = 17 | Atypical Hyperplasia n = 12 | Cancer n = 16 | ||
| Control n = 17 | 1.000 | 0.507 * | 0.424 | Control n = 17 | 1.000 | 0.966 * | 0.966 * |
| Atypical Hyperplasia n = 12 | 0.507 * | 1.000 | 0.747 * | Atypical Hyperplasia n = 12 | 0.966 * | 1.000 | 0.950 * |
| Cancern = 16 | 0.424 | 0.747 * | 1.000 | Cancern = 16 | 0.966 * | 0.950 * | 1.000 |
© 2020 by the authors. Licensee MDPI, Basel, Switzerland. This article is an open access article distributed under the terms and conditions of the Creative Commons Attribution (CC BY) license (http://creativecommons.org/licenses/by/4.0/).
Share and Cite
Barnas, E.; Skret-Magierlo, J.; Skret, A.; Kaznowska, E.; Depciuch, J.; Szmuc, K.; Łach, K.; Krawczyk-Marć, I.; Cebulski, J. Simultaneous FTIR and Raman Spectroscopy in Endometrial Atypical Hyperplasia and Cancer. Int. J. Mol. Sci. 2020, 21, 4828. https://doi.org/10.3390/ijms21144828
Barnas E, Skret-Magierlo J, Skret A, Kaznowska E, Depciuch J, Szmuc K, Łach K, Krawczyk-Marć I, Cebulski J. Simultaneous FTIR and Raman Spectroscopy in Endometrial Atypical Hyperplasia and Cancer. International Journal of Molecular Sciences. 2020; 21(14):4828. https://doi.org/10.3390/ijms21144828
Chicago/Turabian StyleBarnas, Edyta, Joanna Skret-Magierlo, Andrzej Skret, Ewa Kaznowska, Joanna Depciuch, Kamil Szmuc, Kornelia Łach, Izabela Krawczyk-Marć, and Jozef Cebulski. 2020. "Simultaneous FTIR and Raman Spectroscopy in Endometrial Atypical Hyperplasia and Cancer" International Journal of Molecular Sciences 21, no. 14: 4828. https://doi.org/10.3390/ijms21144828