Different Mechanisms Underlie the Metabolic Response of GBM Stem-Like Cells to Ionizing Radiation: Biological and MRS Studies on Effects of Photons and Carbon Ions

 , , ,
, , ,
Abstract
:1. Introduction
2. Results
3. Discussion
4. Materials and Methods
4.1. Patients and Tumor Characterization
4.2. Glioblastoma Stem-Like Cell Cultures
4.3. Irradiation Conditions
4.4. 1H MRS Cell Sample Preparation
4.5. 1H MRS Measurements
4.6. Statistical Analysis
Supplementary Materials
Author Contributions
Funding
Acknowledgments
Conflicts of Interest
Abbreviations
| COSY | COrrelation SpectroscopY |
| CSC | Cancer Stem Cells |
| DSB | Double-Strand Breaks |
| FA | Fatty Acid |
| GABA | Gamma-Aminobutyric Acid |
| GBM | Glioblastoma multiforme |
| glc | glucose |
| gln | glutamine |
| glu | glutamic acid |
| GSC | Glioblastoma Stem-like Cells |
| GSf-like | Glioblastoma full stem-like phenotype, |
| GSH | Glutathione |
| GSr-like | Glioblastoma restricted stem-like phenotype |
| IDHs | Isocitrate DeHydrogenases |
| Lac | Lactate |
| LET | Linear Energy Transfer |
| ML | Mobile Lipids |
| MRS | Magnetic Resonance Spectroscopy |
| mTOR | Mammalian Target Of Rapamycin |
| PBS | Phosphate-buffered saline |
| PCA | Principal Component Analysis |
| pCr | Phosphocreatine |
| RBE | Relative Biological Effectiveness |
| RT | Radiotherapy |
| tCr | total Creatine |
References
- Bryukhovetskiy, I.; Ponomarenko, A.; Lyakhova, I.; Zaitsev, S.; Zayats, Y.; Korneyko, M.; Eliseikina, M.; Mischenko, P.; Shevchenko, V.; Shanker Sharma, H.; et al. Personalized regulation of glioblastoma cancer stem cells based on biomedical technologies: From theory to experiment (Review). Int. J. Mol. Med. 2018, 42, 691–702. [Google Scholar] [CrossRef] [PubMed]
- Han, X.; Xue, X.; Zhou, H.; Zhang, G. A molecular view of the radioresistance of gliomas. Oncotarget 2017, 8, 100931–100941. [Google Scholar] [CrossRef] [PubMed] [Green Version]
- Shen, H.; Hau, E.; Joshi, S.; Dilda, P.J.; McDonald, K.L. Sensitization of glioblastoma cells to irradiation by modulating the glucose metabolism. Mol. Cancer Ther. 2015, 14, 1794–1804. [Google Scholar] [CrossRef] [PubMed] [Green Version]
- Singh, S.K.; Hawkins, C.; Clark, I.D.; Squire, J.A.; Bayani, J.; Hide, T.; Henkelman, R.M.; Cusimano, M.D.; Dirks, P.B. Identification of human brain tumour initiating cells. Nature 2004, 432, 396–401. [Google Scholar] [CrossRef] [PubMed]
- Krause, M.; Dubrivska, A.; Linge, A.; Baumann, M. Cancer stem cells: Radioresistance, prediction of radiotherapy outcome and specific targets for combined treatments. Adv. Drug Deliv. Rev. 2017, 109, 63–73. [Google Scholar] [CrossRef] [PubMed] [Green Version]
- D’Alessandris, Q.G.; Biffoni, M.; Martini, M.; Runci, D.; Buccarelli, M.; Cenci, T.; Signore, M.; Stancato, L.; Olivi, A.; De Maria, R.; et al. The clinical value of patient-derived glioblastoma tumorspheres in predicting treatment response. Neuro Oncol. 2017, 19, 1097–1108. [Google Scholar] [CrossRef] [Green Version]
- Cui, X.; Oonishi, K.; Tsujii, H.; Yasuda, T.; Matsumoto, Y.; Furusawa, Y.; Akashi, M.; Kamada, T.; Okayasu, R. Effects of carbon ion beam on putative colon cancer stem cells and its comparison with X-rays. Cancer Res. 2011, 71, 3676–3687. [Google Scholar] [CrossRef] [Green Version]
- Cammarata, F.; Torrisi, F.; Forte, G.; Minafra, L.; Bravatà, V.; Pisciotta, P.; Savoca, G.; Calvaruso, M.; Petringa, G.; Cirrone, G.; et al. Proton Therapy and Src family kinase inhibitor combined treatments on u87 human glioblastoma multiforme cell line. Int. J. Mol. Sci. 2019, 20, 4745. [Google Scholar] [CrossRef] [Green Version]
- Combs, S.E.; Burkholder, I.; Edler, L. Randomised phase I/II study to evaluate carbon ion radiotherapy versus fractionated stereotactic radiotherapy in patients with recurrent or progressive gliomas: The Cinderella trial. BMC Cancer 2010, 10, 53. [Google Scholar] [CrossRef] [Green Version]
- Combs, S.E.; Kieser, M.; Rieken, S. Randomized phase II study evaluating a carbon ion boost applied after combined radiochemotherapy with temozolomide versus a proton boost after radiochemotherapy with temozolomide in patients with primary glioblastoma: The Cleopatra trial. BMC Cancer 2010, 10, 478. [Google Scholar] [CrossRef] [Green Version]
- Malouff, T.D.; Peterson, J.L.; Mahajan, A.; Trifiletti, D.M. Carbon ion radiotherapy in the treatment of gliomas: A review. J. Neuro Oncol. 2019, 145, 191–199. [Google Scholar] [CrossRef] [PubMed]
- Kong, L.; Gao, J.; Hu, J.; Lu, R.; Yang, J.; Qiu, X.; Hu, W.; Lu, J.J. Carbon ion radiotherapy boost in the treatment of glioblastoma: A randomized phase I/III clinical trial. Cancer Commun. 2019, 39, 5. [Google Scholar] [CrossRef] [PubMed] [Green Version]
- Chiblak, S.; Tang, Z.; Campos, B.; Gal, Z.; Unterberg, A.; Debus, J.; Herold-Mende, C.; Abdollahi, A. Radiosensitivity of patient-derived glioma stem cell 3-dimensional cultures to photon, proton, and carbon irradiation. Int. J. Radiat. Oncol. Biol. Phys. 2016, 95, 112–119. [Google Scholar] [CrossRef] [PubMed]
- Chiblak, S.; Tang, Z.; Lemke, D.; Knoll, M.; Dokic, I.; Warta, R.; Moustafa, M.; Mier, W.; Brons, S.; Carmen Rapp, C.; et al. Carbon irradiation overcomes glioma radioresistance by eradicating stem cells and forming an antiangiogenic and immunopermissive niche. JCI Insight 2019, 4, e123837. [Google Scholar] [CrossRef]
- Aboud, O.A.; Weiss, R.H. New opportunities from the cancer metabolome. Clin. Chem. 2013, 59, 138–146. [Google Scholar] [CrossRef] [Green Version]
- Boesch, M.; Sopper, S.; Zeimet, A.G.; Reimer, D.; Gastl, G.; Ludewig, B.; Wolf, D. Heterogeneity of cancer stem cells: Rationale for targeting the stem cell niche. Biochim. Biophys. Acta 2016, 1866, 276–289. [Google Scholar] [CrossRef] [Green Version]
- Phillips, H.S.; Kharbanda, S.; Chen, R.; Forrest, W.F.; Soriano, R.H.; Wu, T.D.; Misra, A.; Nigro, J.M.; Colman, H.; Soroceanu, L.; et al. Molecular subclasses of high-grade glioma predict prognosis, delineate a pattern of disease progression, and resemble stages in neurogenesis. Cancer Cell 2006, 9, 157–173. [Google Scholar] [CrossRef] [Green Version]
- Marziali, G.; Signore, M.; Buccarelli, M.; Grande, S.; Palma, A.; Biffoni, M.; Rosi, A.; D’Alessandris, Q.G.; Martini, M.; Larocca, L.M.; et al. Metabolic/proteomic signature defines two glioblastoma subtypes with different clinical outcome. Sci. Rep. 2016, 6, 21557. [Google Scholar] [CrossRef]
- Marziali, G.; Buccarelli, M.; Giuliani, A.; Ilari, R.; Grande, S.; Palma, A.; D’Alessandris, Q.G.; Martini, M.; Biffoni, M.; Pallini, R.; et al. A three-microRNA signature identifies two subtypes of glioblastoma patients with different clinical outcomes. Mol. Oncol. 2017, 11, 1115–1129. [Google Scholar] [CrossRef] [Green Version]
- Grande, S.; Palma, A.; Ricci-Vitiani, L.; Luciani, A.M.; Buccarelli, M.; Biffoni, M.; Molinari, A.; Calcabrini, A.; D’Amore, E.; Guidoni, L.; et al. Metabolic heterogeneity evidenced by mrs among patient-derived glioblastoma multiforme stem-like cells accounts for cell clustering and different responses to drugs. Stem Cells Int. 2018, 3292704, 1–16. [Google Scholar] [CrossRef] [Green Version]
- Guidoni, L.; Ricci-Vitiani, L.; Rosi, A.; Palma, A.; Grande, S.; Luciani, A.M.; Pelacchi, F.; di Martino, S.; Colosimo, C.; Biffoni, M.; et al. 1H NMR detects different metabolic profiles in glioblastoma stem-like cells. NMR Biomed. 2014, 27, 129–145. [Google Scholar] [CrossRef] [PubMed]
- Ryall, J.G.; Cliff, T.; Dalton, S.; Sartorelli, V. Metabolic reprogramming of stem cell epigenetics. Cell Stem Cell 2015, 17, 651–662. [Google Scholar] [CrossRef] [PubMed] [Green Version]
- Hao, W.; Chang, C.P.B.; Tsao, C.C.; Xu, J. Oligomycin-induced bioenergetic adaptation in cancer cells with heterogeneous bioenergetic organization. J. Biol. Chem. 2010, 285, 12647–12654. [Google Scholar] [CrossRef] [PubMed] [Green Version]
- Krause, M.; Yaromina, A.; Eicheler, W.; Koch, U.; Baumann, M. Cancer stem cells: Targets and potential biomarkers for radiotherapy. Clin. Cancer Res. 2011, 17, 7224–7229. [Google Scholar] [CrossRef] [PubMed] [Green Version]
- Wang, J.; Wakeman, T.P.; Lathia, J.D.; Hjelmeland, A.B.; Wang, X.F.; White, R.R.; Rich, J.N.; Sullenger, B.A. Notch promotes radioresistance of glioma stem cells. Stem Cells 2010, 28, 17–28. [Google Scholar] [CrossRef] [Green Version]
- Bao, S.; Wu, Q.; McLendon, R.E.; Hao, Y.; Shi, Q.; Hjelmeland, A.B.; Dewhirst, M.W.; Bigner, D.D.; Rich, J.N. Glioma stem cells promote radioresistance by preferential activation of the DNA damage response. Nature 2006, 444, 756–760. [Google Scholar] [CrossRef] [PubMed]
- Baralis, E.; Bertotti, A.; Baumann, M.; Krause, M.; Hill, R. Exploring the role of cancer stem cells in radioresistance. Nat. Rev. Cancer 2008, 8, 545–554. [Google Scholar]
- Diehn, M.; Cho, R.W.; Lobo, N.A.; Kalisky, T.; Dorie, M.J.; Kulp, A.N.; Qian, D.; Lam, J.S.; Ailles, L.E.; Wong, M.; et al. Association of reactive oxygen species levels and radioresistance in cancer stem cells. Nature 2009, 458, 780–783. [Google Scholar] [CrossRef]
- Pajonk, F.; Vlashi, E.; McBride, W.H. Radiation resistance of cancer stem cells: The 4 R’s of radiobiology revisited. Stem Cells 2010, 28, 639–648. [Google Scholar] [CrossRef] [Green Version]
- Cheng, L.; Wu, Q.; Huang, Z.; Guryanova, O.A.; Huang, Q.; Shou, W.; Rich, J.N.; Bao, S. L1CAM regulates DNA damage checkpoint response of glioblastoma stem cells through NBS1. EMBO J. 2011, 30, 800–813. [Google Scholar] [CrossRef]
- Vlashi, E.; Pajonk, F. Cancer stem cells, cancer cell plasticity and radiation therapy. Semin. Cancer Biol. 2014, 31, 28–35. [Google Scholar] [CrossRef] [PubMed] [Green Version]
- Ahmed, S.U.; Carruthers, R.; Gilmour, L.; Yildirim, S.; Watts, C.; Chalmers, A.J. Selective inhibition of parallel DNA damage response pathways optimizes radiosensitization of glioblastoma stem-like cells. Cancer Res. 2015, 75, 4416–4428. [Google Scholar] [CrossRef] [Green Version]
- De Bacco, F.; D’Ambrosio, A.; Casanova, E.; Orzan, F.; Neggia, R.; Albano, R.; Verginelli, F.; Cominelli, M.; Poliani, P.L.; Luraghi, P.; et al. MET inhibition overcomes radiation resistance of glioblastoma stem-like cells. EMBO Mol. Med. 2016, 8, 550–556. [Google Scholar] [CrossRef] [PubMed] [Green Version]
- Chew, M.T.; Nisbet, A.; Suzuki, M.; Matsufuji, N.; Murakami, T.; Jones, B.; Bradley, D.A. Potential lethal damage repair in glioblastoma cells irradiated with ion beams of various types and levels of linear energy transfer. J. Radiat. Res. 2018, 60, 59–68. [Google Scholar] [CrossRef] [PubMed]
- Oike, T.; Sato, H.; Noda, S.; Nakano, T. Translational research to improve the efficacy of carbon ion radiotherapy: Experience of gunma university. Front. Oncol. 2016, 6, 139. [Google Scholar] [CrossRef] [PubMed] [Green Version]
- Zhou, W.; Wahl, D.R. Metabolic abnormalities in glioblastoma and metabolic strategies to overcome treatment resistance. Cancers 2019, 11, 1231. [Google Scholar] [CrossRef] [Green Version]
- Sanzey, M.; Aminah, S.; Rahim, A.; Oudin, A.; Dirkse, A.; Kaoma, T.; Vallar, L.; Herold-Mende, C.; Bjerkvig, R.; Golebiewska, A.; et al. Comprehensive analysis of glycolytic enzymes as therapeutic targets in the treatment of glioblastoma. PLoS ONE 2015, 10, e0123544. [Google Scholar] [CrossRef]
- Tanaka, K.; Sasayama, T.; Irino, Y.; Takata, K.; Nagashima, H.; Satoh, N.; Kyotani, K.; Mizowaki, T.; Imahori, T.; Ejima, Y.; et al. Compensatory glutamine metabolism promotes glioblastoma resistance to mTOR inhibitor treatment. J. Clin. Investig. 2015, 125, 1591–1602. [Google Scholar] [CrossRef]
- Patel, A.P.; Tirosh, I.; Trombetta, J.J.; Shalek, A.K.; Gillespie, S.M.; Wakimoto, H.; Cahill, D.P.; Nahed, B.V.; Curry, W.T.; Martuza, R.L.; et al. Single-cell RNA-seq highlights intratumoral heterogeneity in primary glioblastoma. Science 2014, 344, 1396–1401. [Google Scholar] [CrossRef] [Green Version]
- Yoshida, G.J. Metabolic reprogramming: The emerging concept and associated therapeutic strategies. J. Exp. Clin. Cancer Res. 2015, 34, 111. [Google Scholar] [CrossRef] [Green Version]
- Li, C.; Wang, J. Quantifying cell fate decisions for differentiation and reprogramming of a human stem cell network: Landscape and biological paths. PLoS Comput. Biol. 2013, 9, e1003165. [Google Scholar] [CrossRef] [PubMed] [Green Version]
- Agnihotri, S.; Zadeh, G. Metabolic reprogramming in glioblastoma: The influence of cancer metabolism on epigenetics and unanswered questions. Neuro Oncol. 2016, 18, 160–172. [Google Scholar] [CrossRef] [Green Version]
- Rosi, A.; Ricci-Vitiani, L.; Biffoni, M.; Grande, S.; Luciani, A.M.; Palma, A.; Runci, D.; Cappellari, M.; De Maria, R.; Guidoni, L.; et al. 1H NMR spectroscopy of glioblastoma stem-like cells identifies alpha-aminoadipate as a marker of tumor aggressiveness. NMR Biomed. 2015, 28, 317–326. [Google Scholar] [CrossRef] [PubMed]
- Pecchia, I.; Dini, V.; Ricci-Vitiani, L.; Biffoni, M.; Balduzzi, M.; Fratini, E.; Belli, M.; Campa, A.; Esposito, G.; Cirrone, G.; et al. Gliobastoma Stem cells: Radiobiological response to ionising radiation of different qualities. Radiat. Prot. Dosim. 2015, 166, 374–378. [Google Scholar] [CrossRef] [PubMed]
- Tachon, G.; Cortes, U.; Guichet, P.O.; Rivet, P.; Balbous, A.; Masliantsev, K.; Karayan-Tapon, L.; Berger, A.; Boissonnade, O.; Wager, M. Cell cycle changes after glioblastoma stem cell irradiation: The major role of RAD51. Int. J. Mol. Sci. 2018, 19, 3018. [Google Scholar] [CrossRef] [Green Version]
- Karanam, K.; Kafri, R.; Loewer, A.; Lahav, G. Quantitative live cell imaging reveals a gradual shift between DNA repair mechanisms and a maximal use of HR in mid S phase. Mol. Cell 2012, 47, 320–329. [Google Scholar] [CrossRef] [Green Version]
- Schulz, A.; Meyer, F.; Dubrovska, A.; Borgmann, K. Cancer stem cells and radioresistance: DNA repair and beyond. Cancers 2019, 11, 862. [Google Scholar] [CrossRef] [Green Version]
- Lopez Perez, R.; Nicolay, N.H.; Wolf, J.C.; Frister, M.; Schmezer, P.; Weber, K.J.; Huber, P.E. DNA damage response of clinical carbon ion versus photon radiation in human glioblastoma cells. Radiother. Oncol. 2019, 133, 77–86. [Google Scholar] [CrossRef]
- Magee, J.A.; Piskounova, E.; Morrison, S.J. Cancer stem cells: Impact, heterogeneity, and uncertainty. Cancer Cell 2012, 21, 283–296. [Google Scholar] [CrossRef] [Green Version]
- Wang, Q.E. DNA damage responses in cancer stem cells: Implications for cancer therapeutic strategies. World J. Biol. Chem. 2015, 6, 57. [Google Scholar] [CrossRef]
- Griffin, J.L.; Lehtimäki, K.K.; Valonen, P.; Gröhn, O.; Kettunen, M.I.; Ylä-Herttuala, S.; Pitkänen, A.; Nicholson, J.K.; Kauppinen, R.A. Assignment of 1H nuclear magnetic resonance visible polyunsaturated fatty acids in BT4C gliomas undergoing ganciclovir-thymidine kinase gene therapy-induced programmed cell death. Cancer Res. 2003, 63, 3195–3201. [Google Scholar] [PubMed]
- Langelier, B.; Linard, A.; Bordat, C.; Lavialle, M.; Heberden, C. Long chain-polyunsaturated fatty acids modulate membrane phospholipid composition and protein localization in lipid rafts of neural stem cell cultures. J. Cell Biochem. 2010, 110, 1356–1364. [Google Scholar] [CrossRef] [PubMed]
- Antal, O.; Hackler, L.J.; Shen, J.; Mán, I.; Hideghéty, K.; Kitajka, K.; Puskás, L.G. Combination of unsaturated fatty acids and ionizing radiation on human glioma cells: Cellular, biochemical and gene expression analysis. Lipids Health Dis. 2014, 13, 142. [Google Scholar] [CrossRef] [PubMed] [Green Version]
- Wang, Y.; Hou, Y.; Zhang, W.; Alvarez, A.A.; Bai, Y.; Hu, B.; Cheng, S.Y.; Yang, K.; Li, Y.; Feng, H. Lipolytic inhibitor G0S2 modulates glioma stem-like cell radiation response. J. Exp. Clin. Cancer Res. 2019, 38, 1–13. [Google Scholar] [CrossRef]
- Chen, Y.; Huang, W.; Zheng, M.; Xue, Y.; Yang, J.; Liu, W.; Han, S. The mTOR inhibitor rapamycin synergizes with a fatty acid synthase inhibitor to induce cytotoxicity in ER/HER2-positive breast cancer cells. PLoS ONE 2014, 9, e97697. [Google Scholar] [CrossRef] [Green Version]
- Kumar, G.K. Hypoxia. 3. Hypoxia and neurotransmitter synthesis. Am. J. Physiol. Cell Physiol. 2011, 300, C743–C751. [Google Scholar] [CrossRef] [Green Version]
- Konings, K.; Vandevoorde, C.; Baselet, B.; Baatout, S.; Moreels, M. Combination therapy with charged particles and molecular targeting: A promising avenue to overcome radioresistance. Front. Oncol. 2020, 10, 128. [Google Scholar] [CrossRef]
- Yang, W.; Liu, Y.; Gao, R.; Yu, H.; Sun, T. HDAC6 inhibition induces glioma stem cells differentiation and enhances cellular radiation sensitivity through the SHH/Gli1 signaling pathway. Cancer Lett. 2018, 415, 164–176. [Google Scholar] [CrossRef]
- May, J.L.; Kouri, F.M.; Hurley, L.A.; Liu, J.; Tommasini-Ghelfi, S.; Ji, Y.; Gao, P.; Calvert, A.R.; Lee, A.; Chandel, N.S.; et al. IDH3α regulates one-Carbon metabolism in glioblastoma. Sci. Adv. 2019, 5, eaat0456. [Google Scholar] [CrossRef] [Green Version]
- Icard, P.; Shulman, S.; Farhat, D.; Steyaert, J.M.; Alifano, M.; Lincet, H. How the Warburg effect supports aggressiveness and drug resistance of cancer cells? Drug Resist. Updates 2018, 38, 1–113. [Google Scholar] [CrossRef]
- Gerlach, G.; Hofer, H.W. Interaction of immobilized phosphofructokinase with soluble muscle proteins. Biochim. Biophys. Acta (BBA) Gen. Subj. 1986, 881, 398–404. [Google Scholar] [CrossRef]
- Kraft, T.; Hornemann, T.; Stolz, M.; Nier, V.; Wallimann, T. Coupling of creatine kinase to glycolytic enzymes at the sarcomeric I-band of skeletal muscle: A biochemical study in situ. J. Muscle Res. Cell Motil. 2000, 21, 691–703. [Google Scholar] [CrossRef] [PubMed]
- Storey, K.B.; Hochachka, P.W. Enzymes of energy metabolism from a vertebrate facultative anaerobe, Pseudemys scripta. Turtle heart Phosphofructokinase. J. Biol. Chem. 1974, 249, 1423–1427. [Google Scholar] [PubMed]
- Schlattner, U.; Tokarska-Schlattner, M.; Wallimann, T. Mitochondrial creatine kinase in human health and disease. Biochim. Biophys. Acta 2006, 1762, 164–180. [Google Scholar] [CrossRef]
- Kleihues, P.; Cavenee, W. (Eds.) Pathology and genetics of tumours of the nervous system. In World Health Organization Classification of Tumours, 2nd ed.; France IARC Press: Lyon, France, 2000. [Google Scholar]
- Pallini, R.; Ricci-Vitiani, L.; Banna, G.L.; Signore, M.; Lombardi, D.; Todaro, M.; Stassi, G.; Martini, M.; Maira, G.; Larocca, L.M.; et al. Cancer stem cell analysis and clinical outcome in patients with glioblastoma multiforme. Clin. Cancer Res. 2008, 14, 8205–8212. [Google Scholar] [CrossRef] [PubMed] [Green Version]
- Esteller, M.; Hamilton, S.R.; Burger, P.C.; Baylin, S.B.; Herman, J.G. Inactivation of the DNA repair gene O6-methylguanine-DNA methyltransferase by promoterhypermethylation is a common event in primary hu-man neoplasia. Cancer Res. 1999, 59, 793–797. [Google Scholar] [PubMed]
- Martini, M.; Cenci, T.; D’Alessandris, G.Q.; Cesarini, V.; Cocomazzi, A.; Ricci-Vitiani, L.; De Maria, R.; Pallini, R.; Larocca, L.M. Epigenetic silencing of Id4 identifies a glioblastoma subgroup with a better prognosis as a consequence of an inhibition of angiogenesis. Cancer 2013, 119, 1004–1012. [Google Scholar] [CrossRef]
- Lulli, V.; Buccarelli, M.; Martini, M.; Signore, M.; Biffoni, M.; Giannetti, S.; Morgante, L.; Marziali, G.; Ilari, R.; Pagliuca, A.; et al. miR-135b suppresses tumorigenesis in glioblastoma stem-like cells impairing proliferation, migration and self-renewal. Oncotarget 2015, 6, 37241–37256. [Google Scholar] [CrossRef]
- IAEA TRS-398 Absorbed Dose Determination in External Beam Radiotherapy: An International Code of Practice for Dosimetry Based on Standards of Absorbed Dose to Water. Available online: http://www-naweb.iaea.org/nahu/DMRP/documents/CoP_V12_2006-06-05.pdf (accessed on 22 May 2020).


| GSC#1 | GSC#83 | |||
|---|---|---|---|---|
| Genetic Profile [18] | GSf-Like | GSr-Like | ||
| Metabolic Cluster [21] | Proneural Like | Glioma Like | ||
| Photon | Carbon ions | Photon | Carbon ions | |
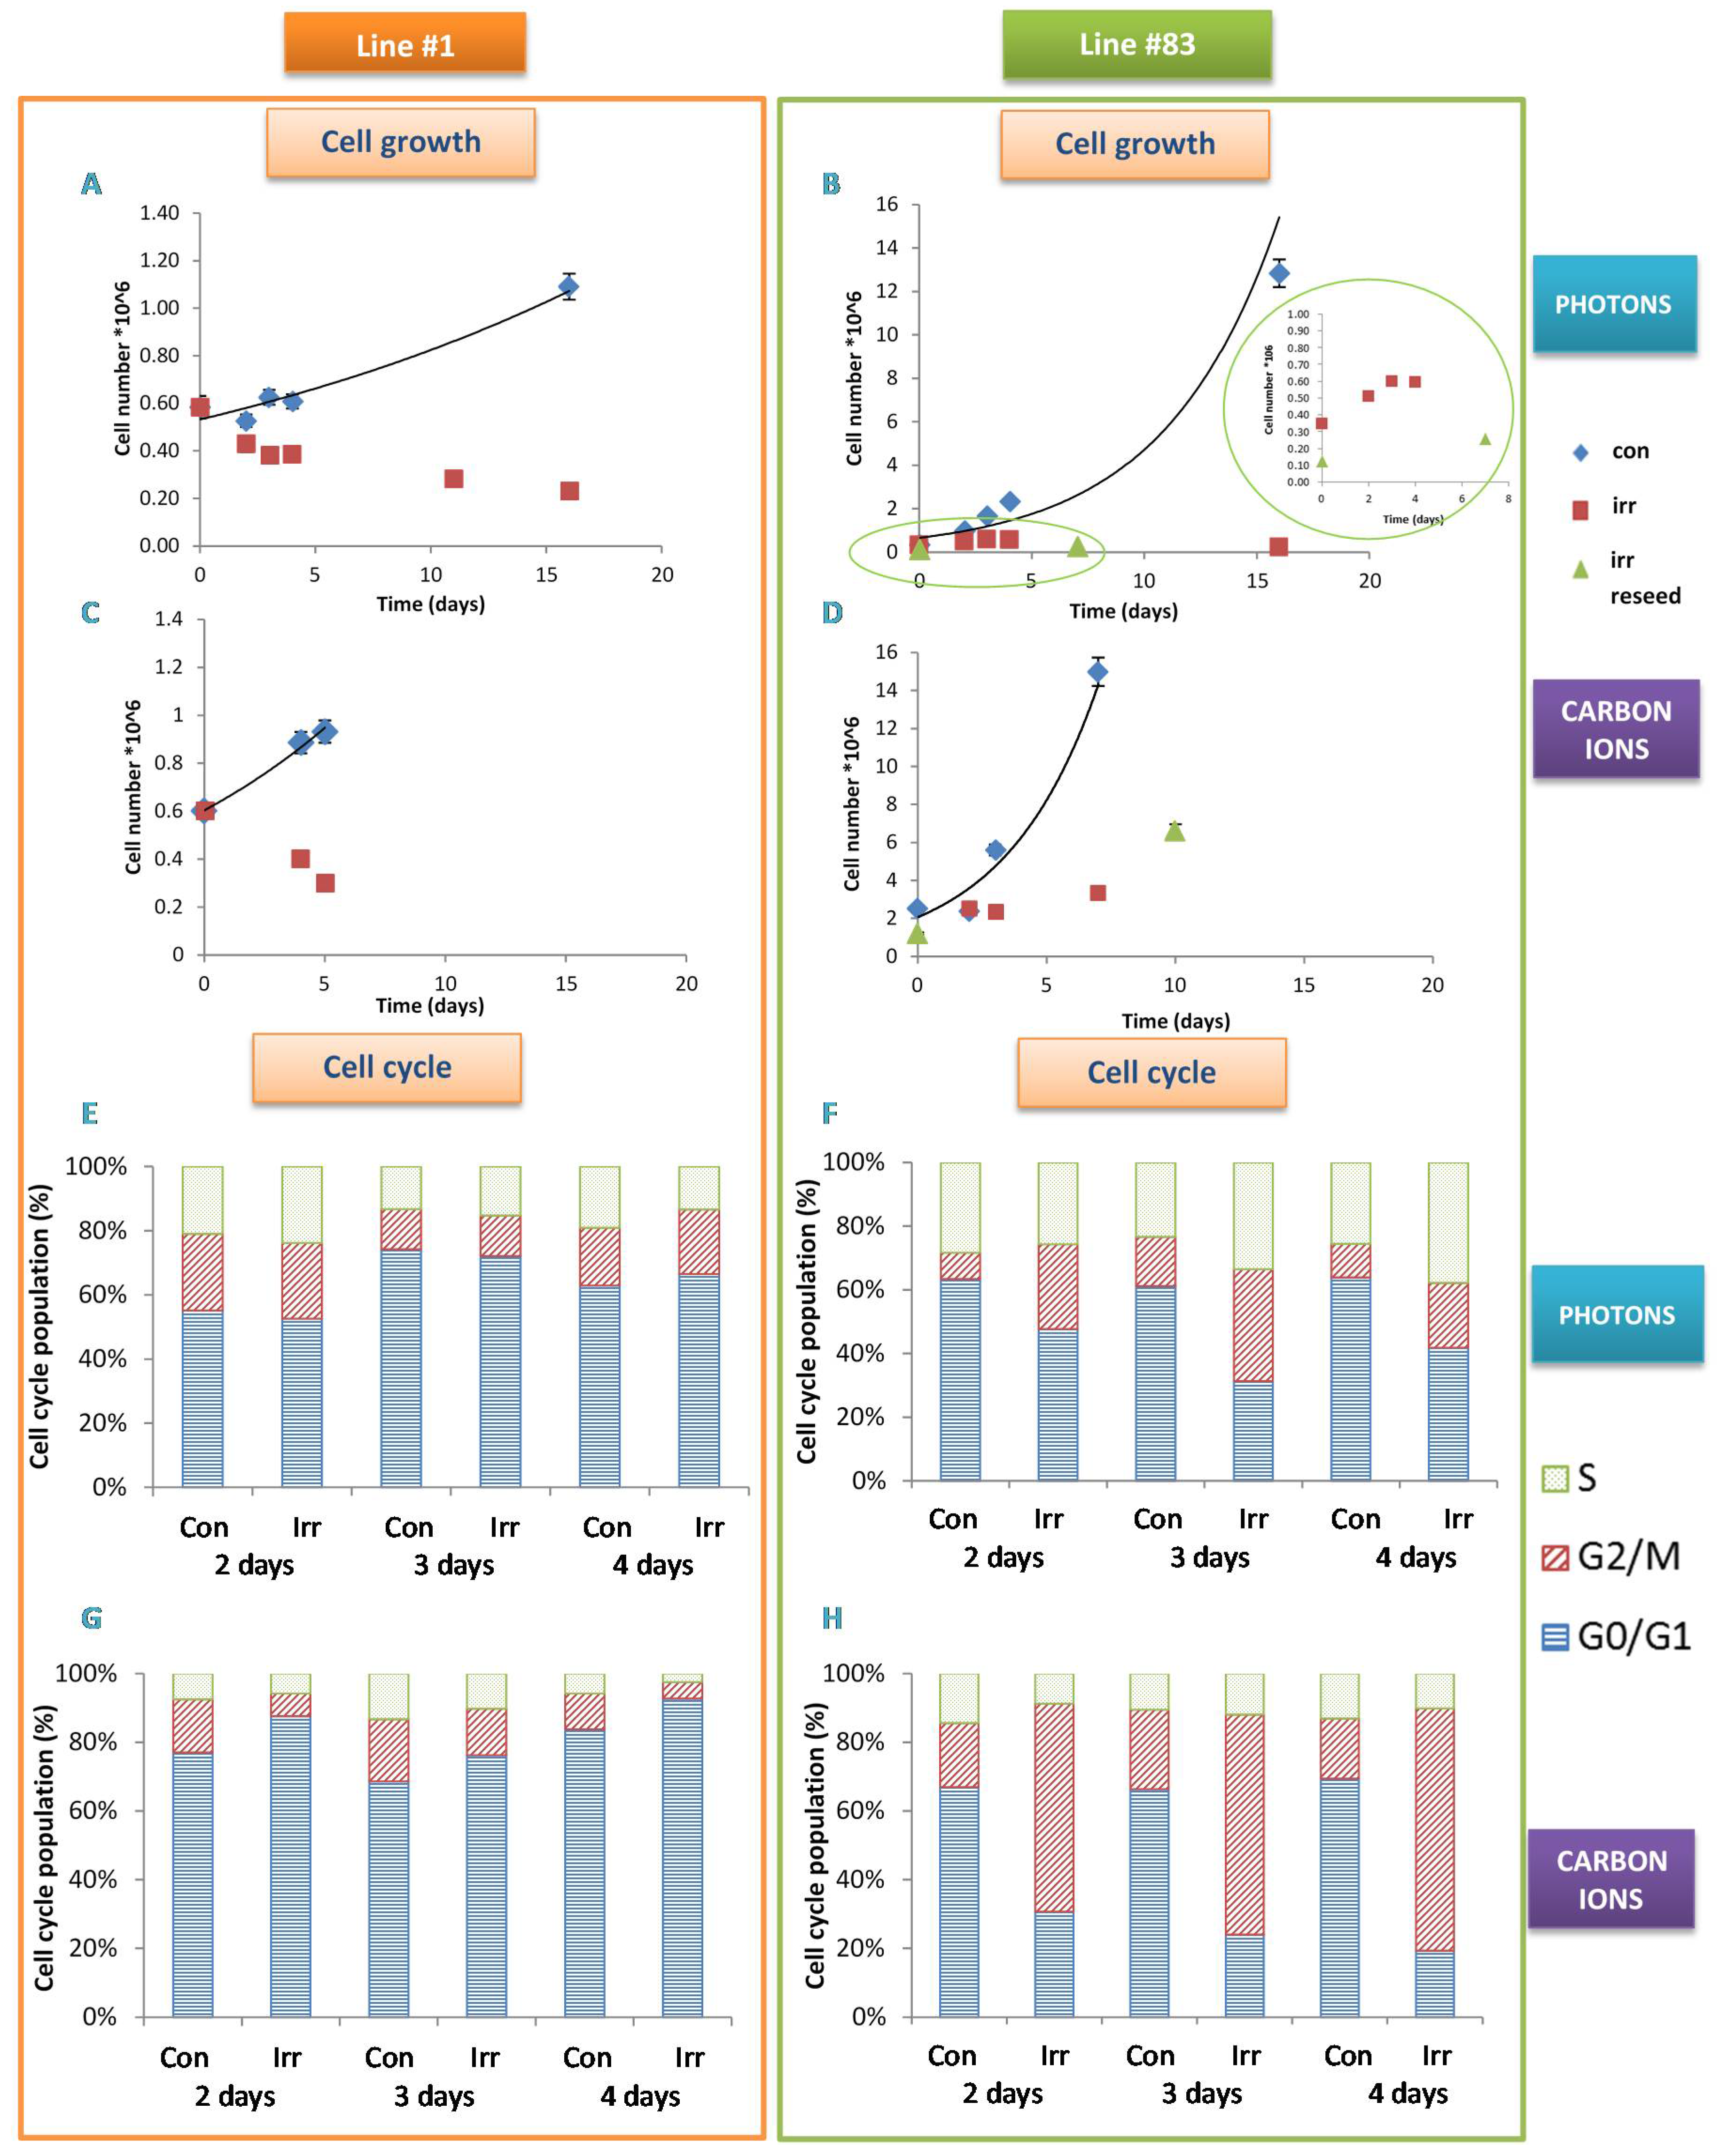
| Cell growth | early cytotoxic effect | early cytotoxic effect | cytostatic effect | cytostatic effect |
| Cell cycle | No effect | G0/G1 accumulation | G2/M block | G2/M block |
| Cell metabolite signals | ||||
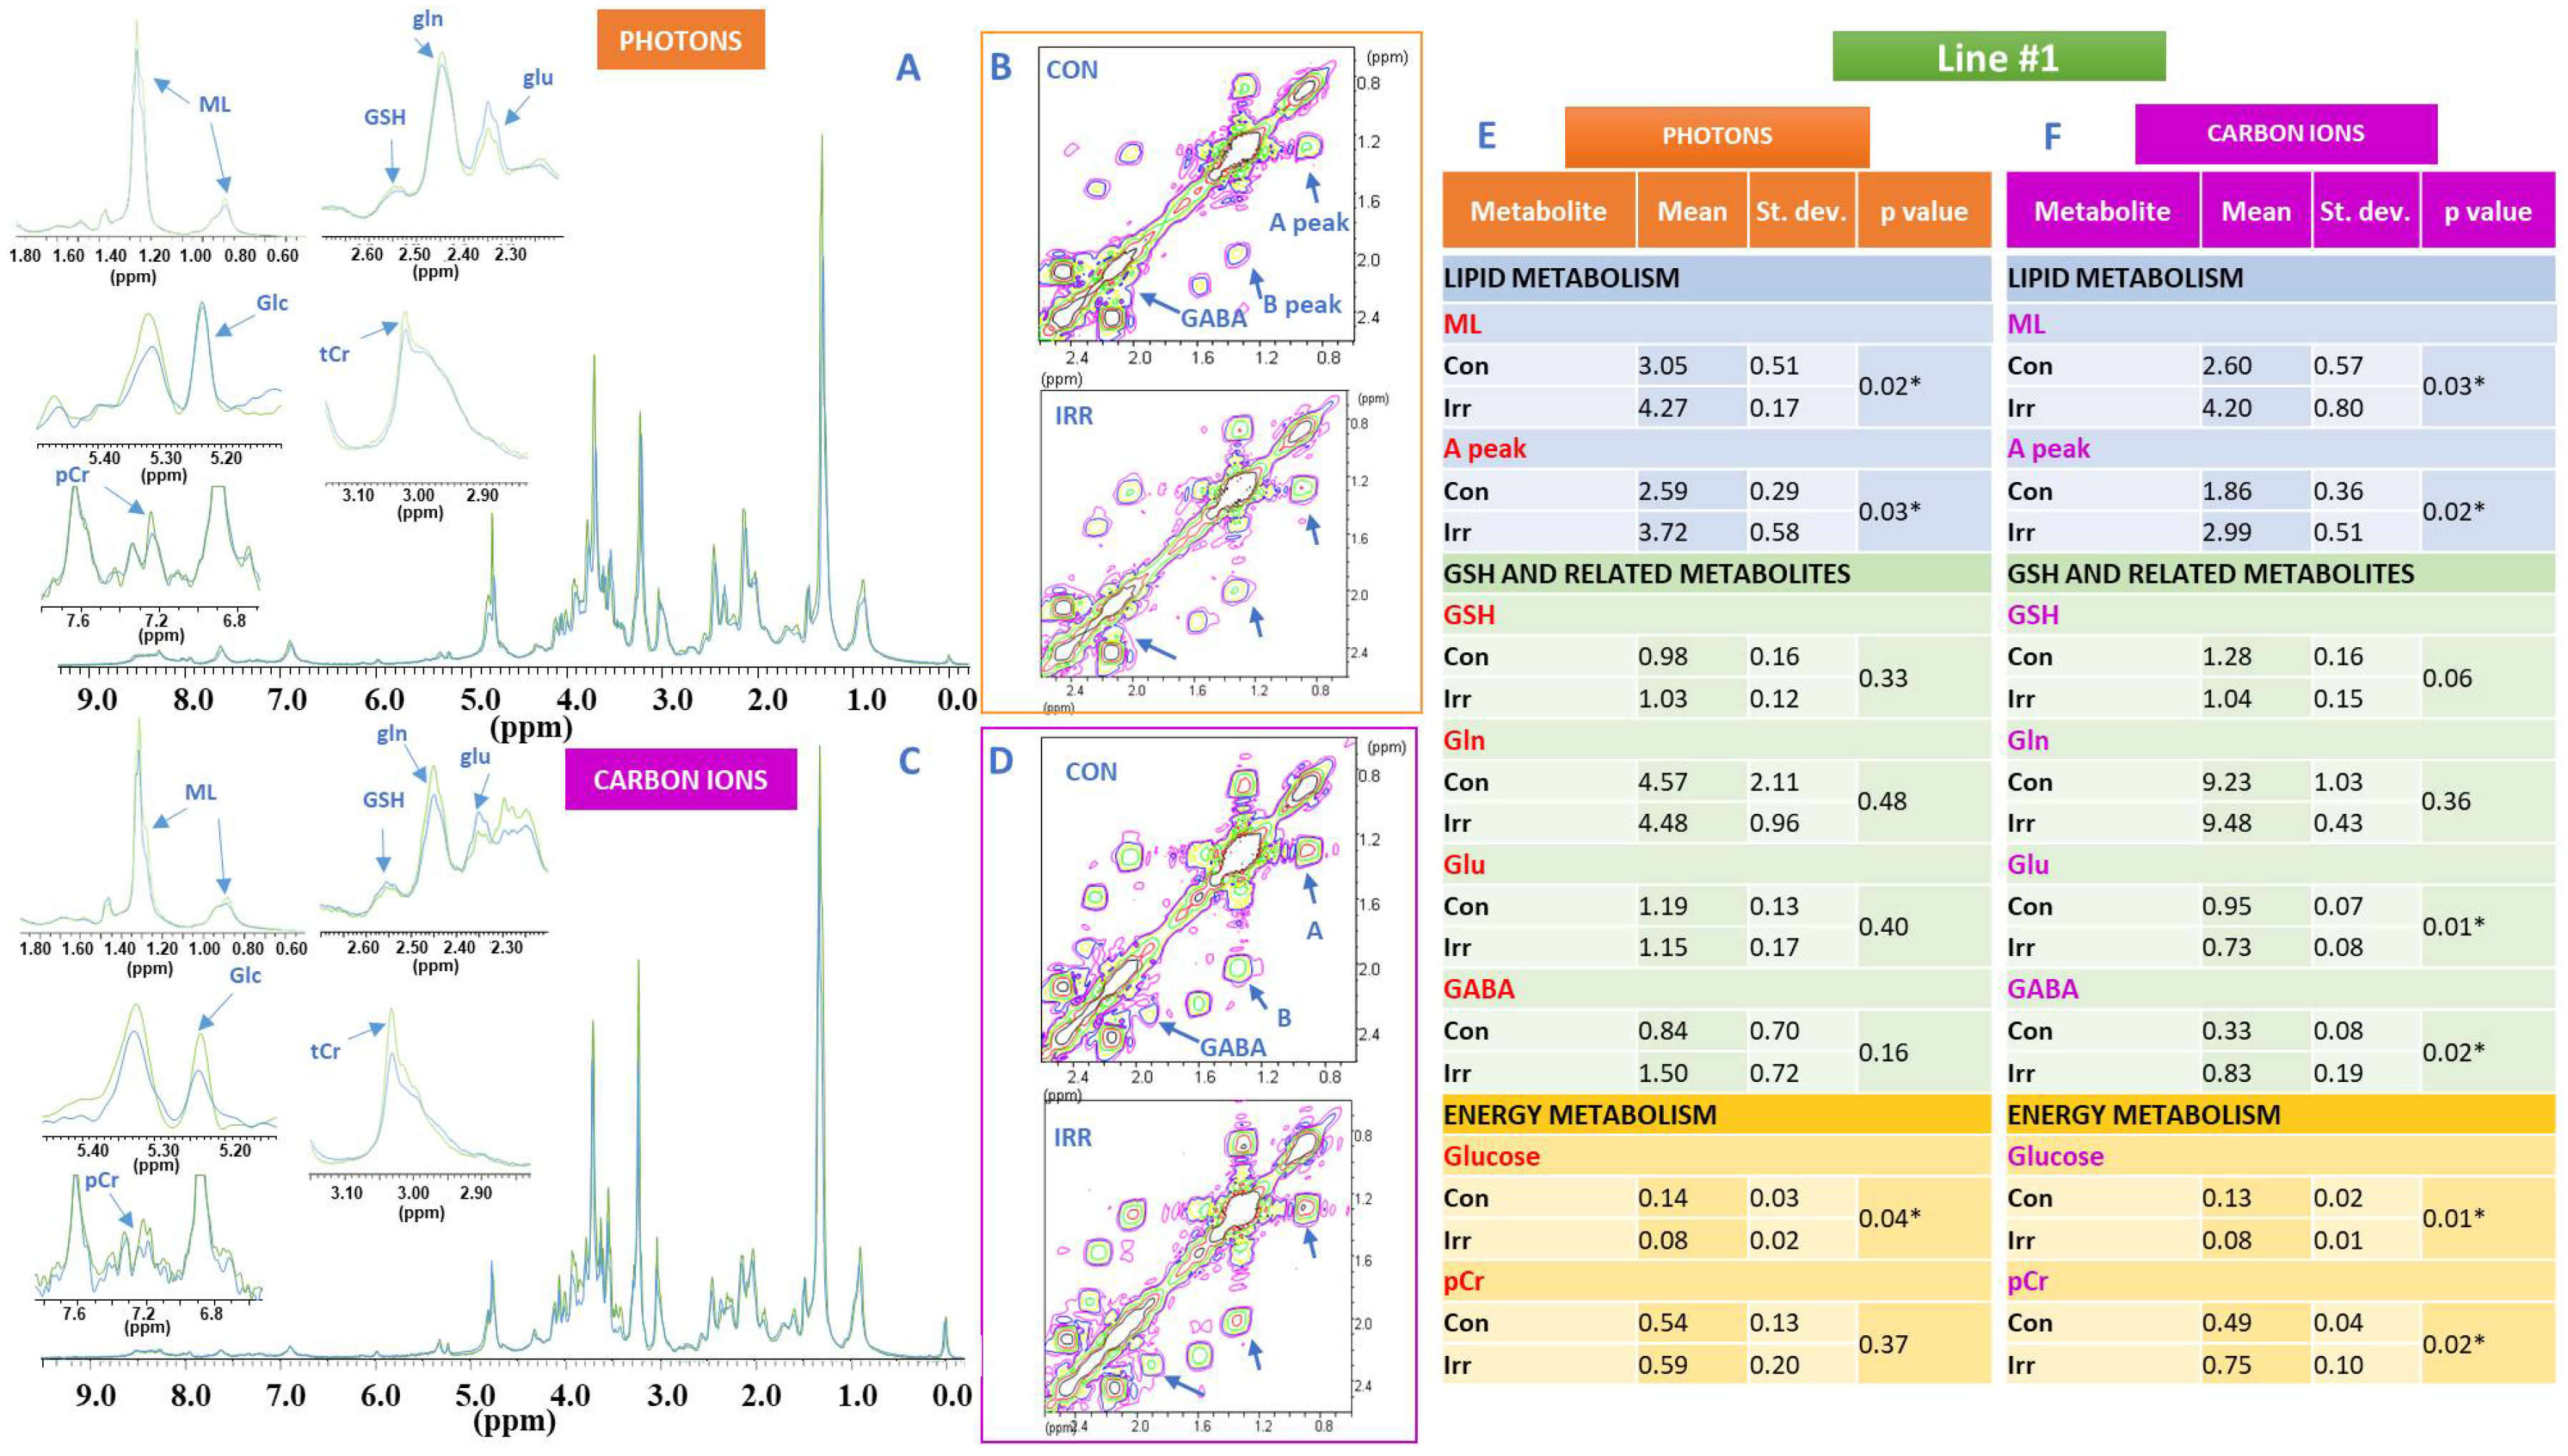
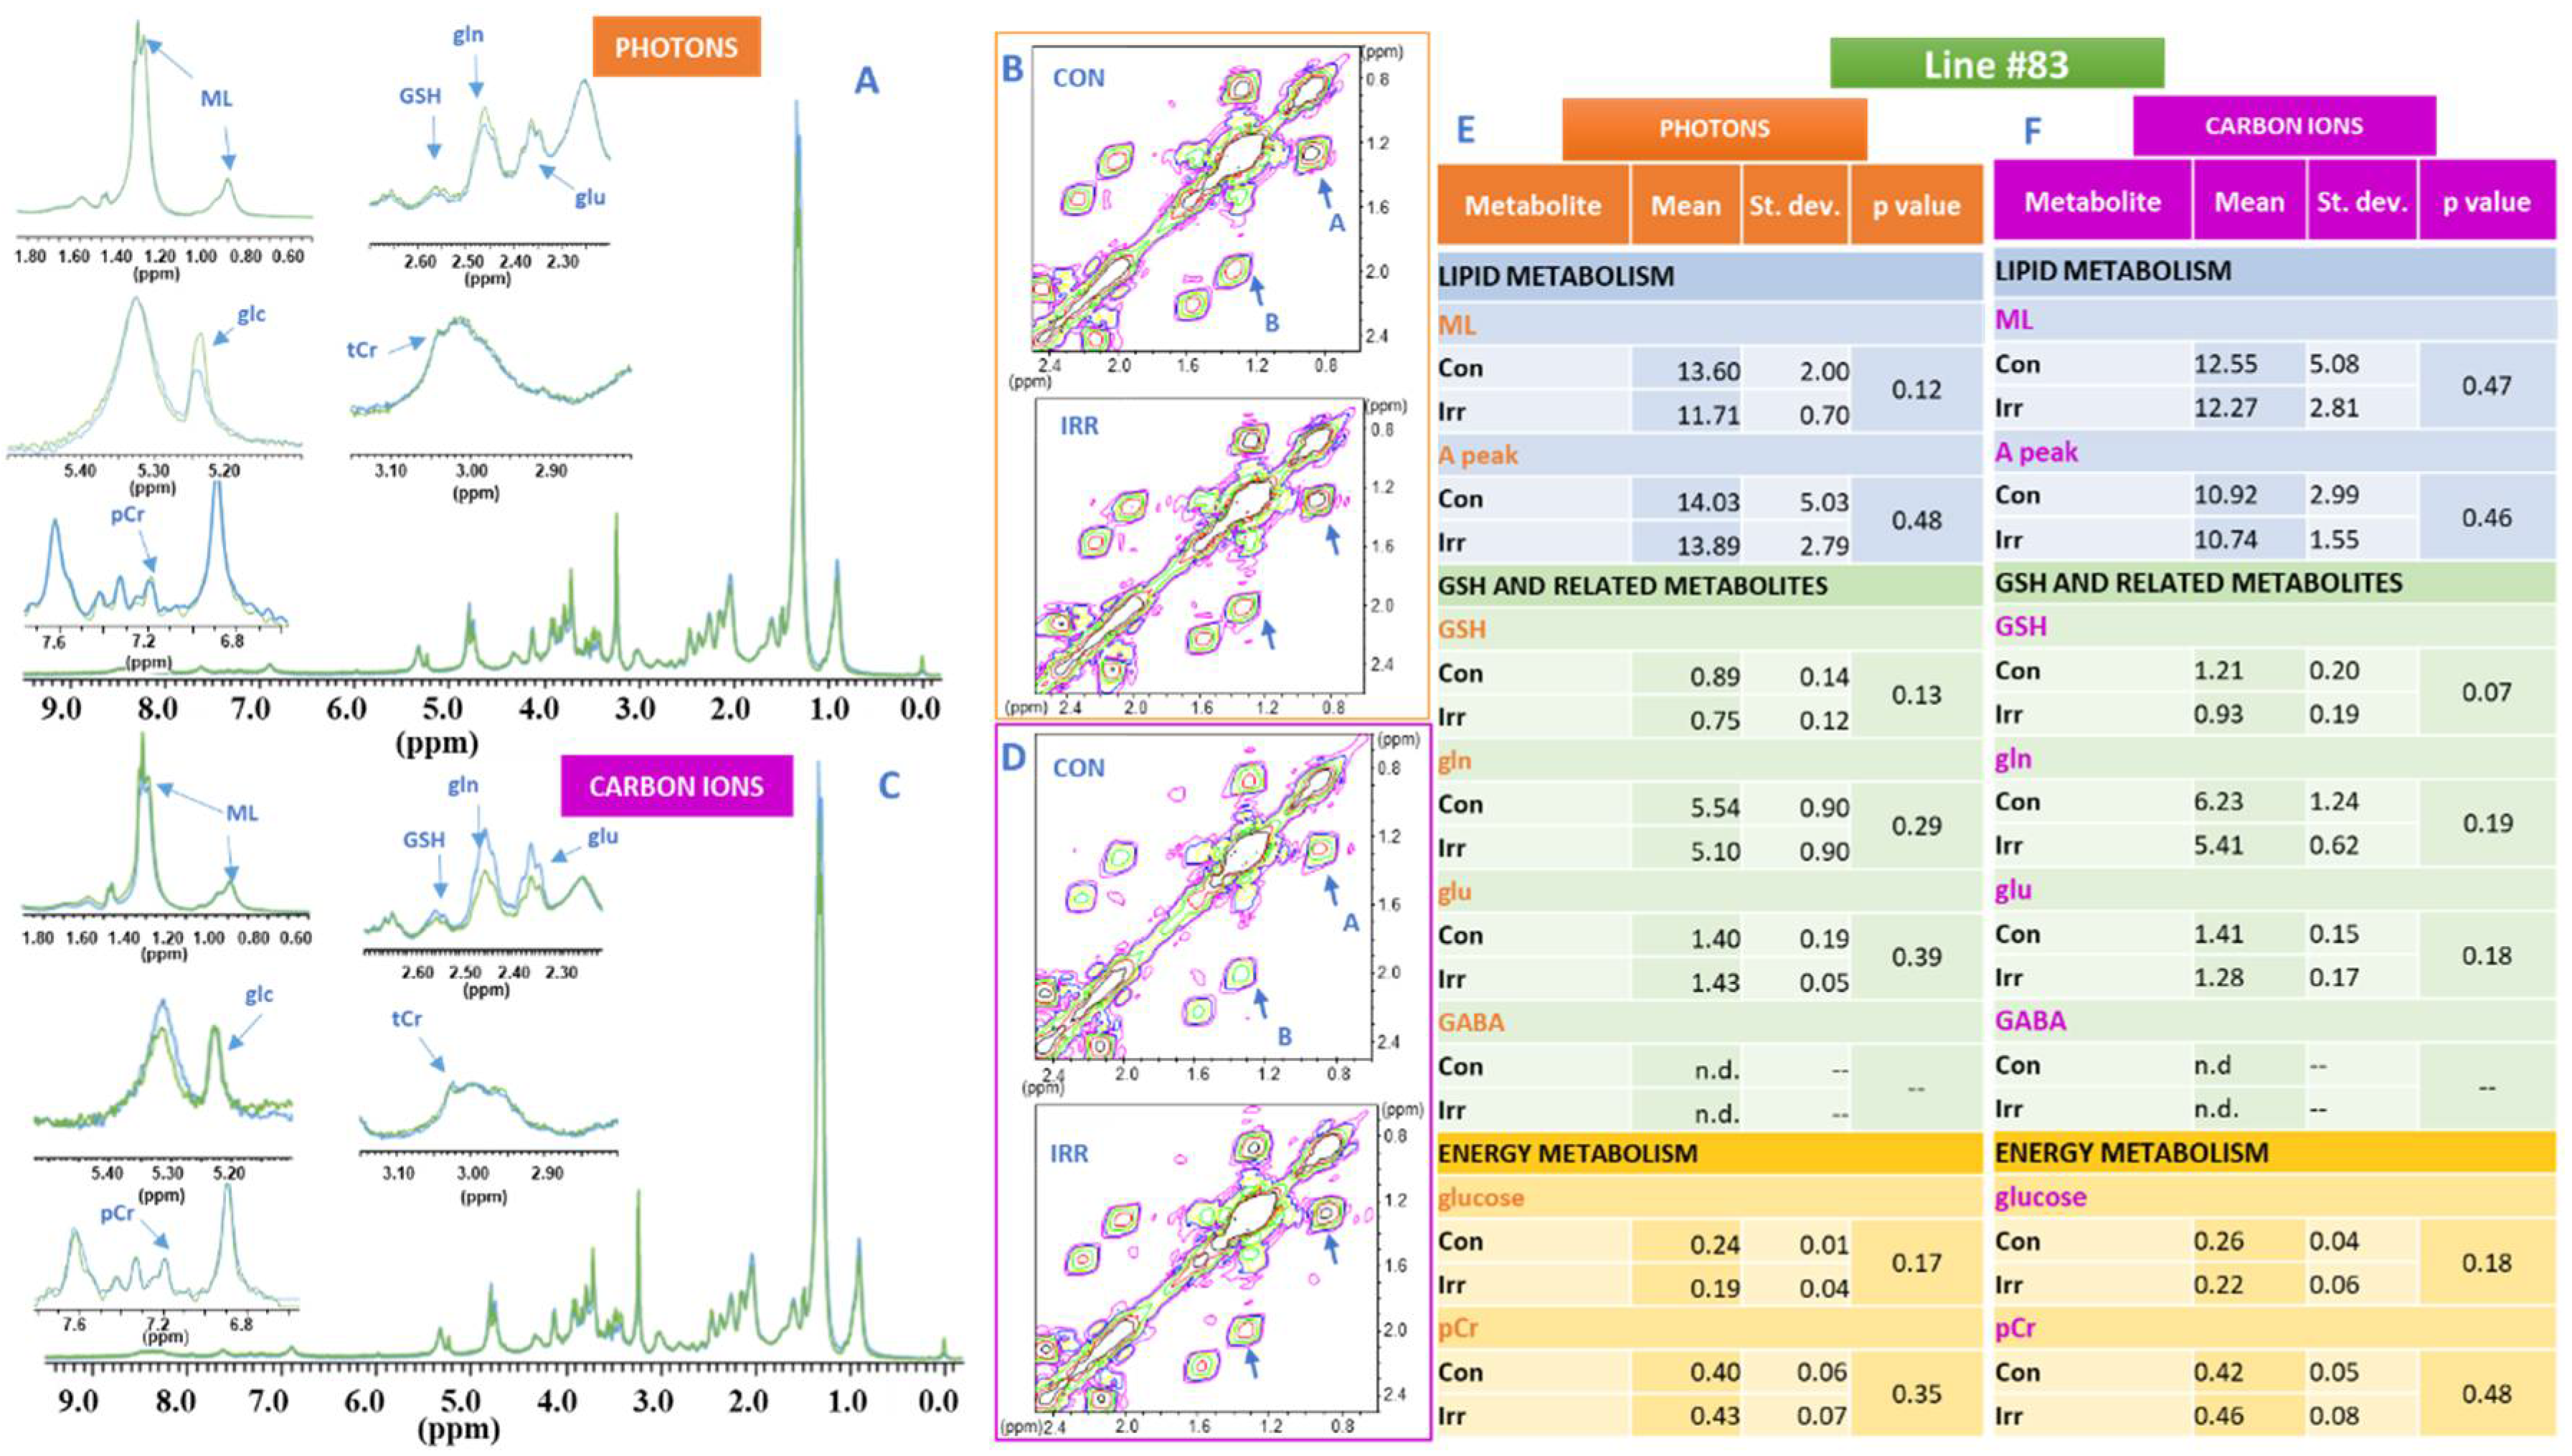
| Lipid | Increase | Increase | No effect | No effect |
| Glutamic acid | No effect | Decrease | No effect | No effect |
| GABA | No effect | Increase | N.D. | N.D. |
| Glucose | Decrease | Decrease | No effect | No effect |
| Phosphocreatine | No effect | Increase | No effect | No effect |
© 2020 by the authors. Licensee MDPI, Basel, Switzerland. This article is an open access article distributed under the terms and conditions of the Creative Commons Attribution (CC BY) license (http://creativecommons.org/licenses/by/4.0/).
Share and Cite
Palma, A.; Grande, S.; Ricci-Vitiani, L.; Luciani, A.M.; Buccarelli, M.; Biffoni, M.; Dini, V.; Cirrone, G.A.P.; Ciocca, M.; Guidoni, L.; et al. Different Mechanisms Underlie the Metabolic Response of GBM Stem-Like Cells to Ionizing Radiation: Biological and MRS Studies on Effects of Photons and Carbon Ions. Int. J. Mol. Sci. 2020, 21, 5167. https://doi.org/10.3390/ijms21145167
Palma A, Grande S, Ricci-Vitiani L, Luciani AM, Buccarelli M, Biffoni M, Dini V, Cirrone GAP, Ciocca M, Guidoni L, et al. Different Mechanisms Underlie the Metabolic Response of GBM Stem-Like Cells to Ionizing Radiation: Biological and MRS Studies on Effects of Photons and Carbon Ions. International Journal of Molecular Sciences. 2020; 21(14):5167. https://doi.org/10.3390/ijms21145167
Chicago/Turabian StylePalma, Alessandra, Sveva Grande, Lucia Ricci-Vitiani, Anna Maria Luciani, Mariachiara Buccarelli, Mauro Biffoni, Valentina Dini, Giuseppe A. P. Cirrone, Mario Ciocca, Laura Guidoni, and et al. 2020. "Different Mechanisms Underlie the Metabolic Response of GBM Stem-Like Cells to Ionizing Radiation: Biological and MRS Studies on Effects of Photons and Carbon Ions" International Journal of Molecular Sciences 21, no. 14: 5167. https://doi.org/10.3390/ijms21145167