Freezing Tolerance of Lolium multiflorum/Festuca arundinacea Introgression Forms is Associated with the High Activity of Antioxidant System and Adjustment of Photosynthetic Activity under Cold Acclimation

 , , , , and
Abstract
:1. Introduction
2. Results
2.1. TEL50 and Lipid Peroxidation
2.2. Chlorophyll Fluorescence
2.3. Gas Exchange
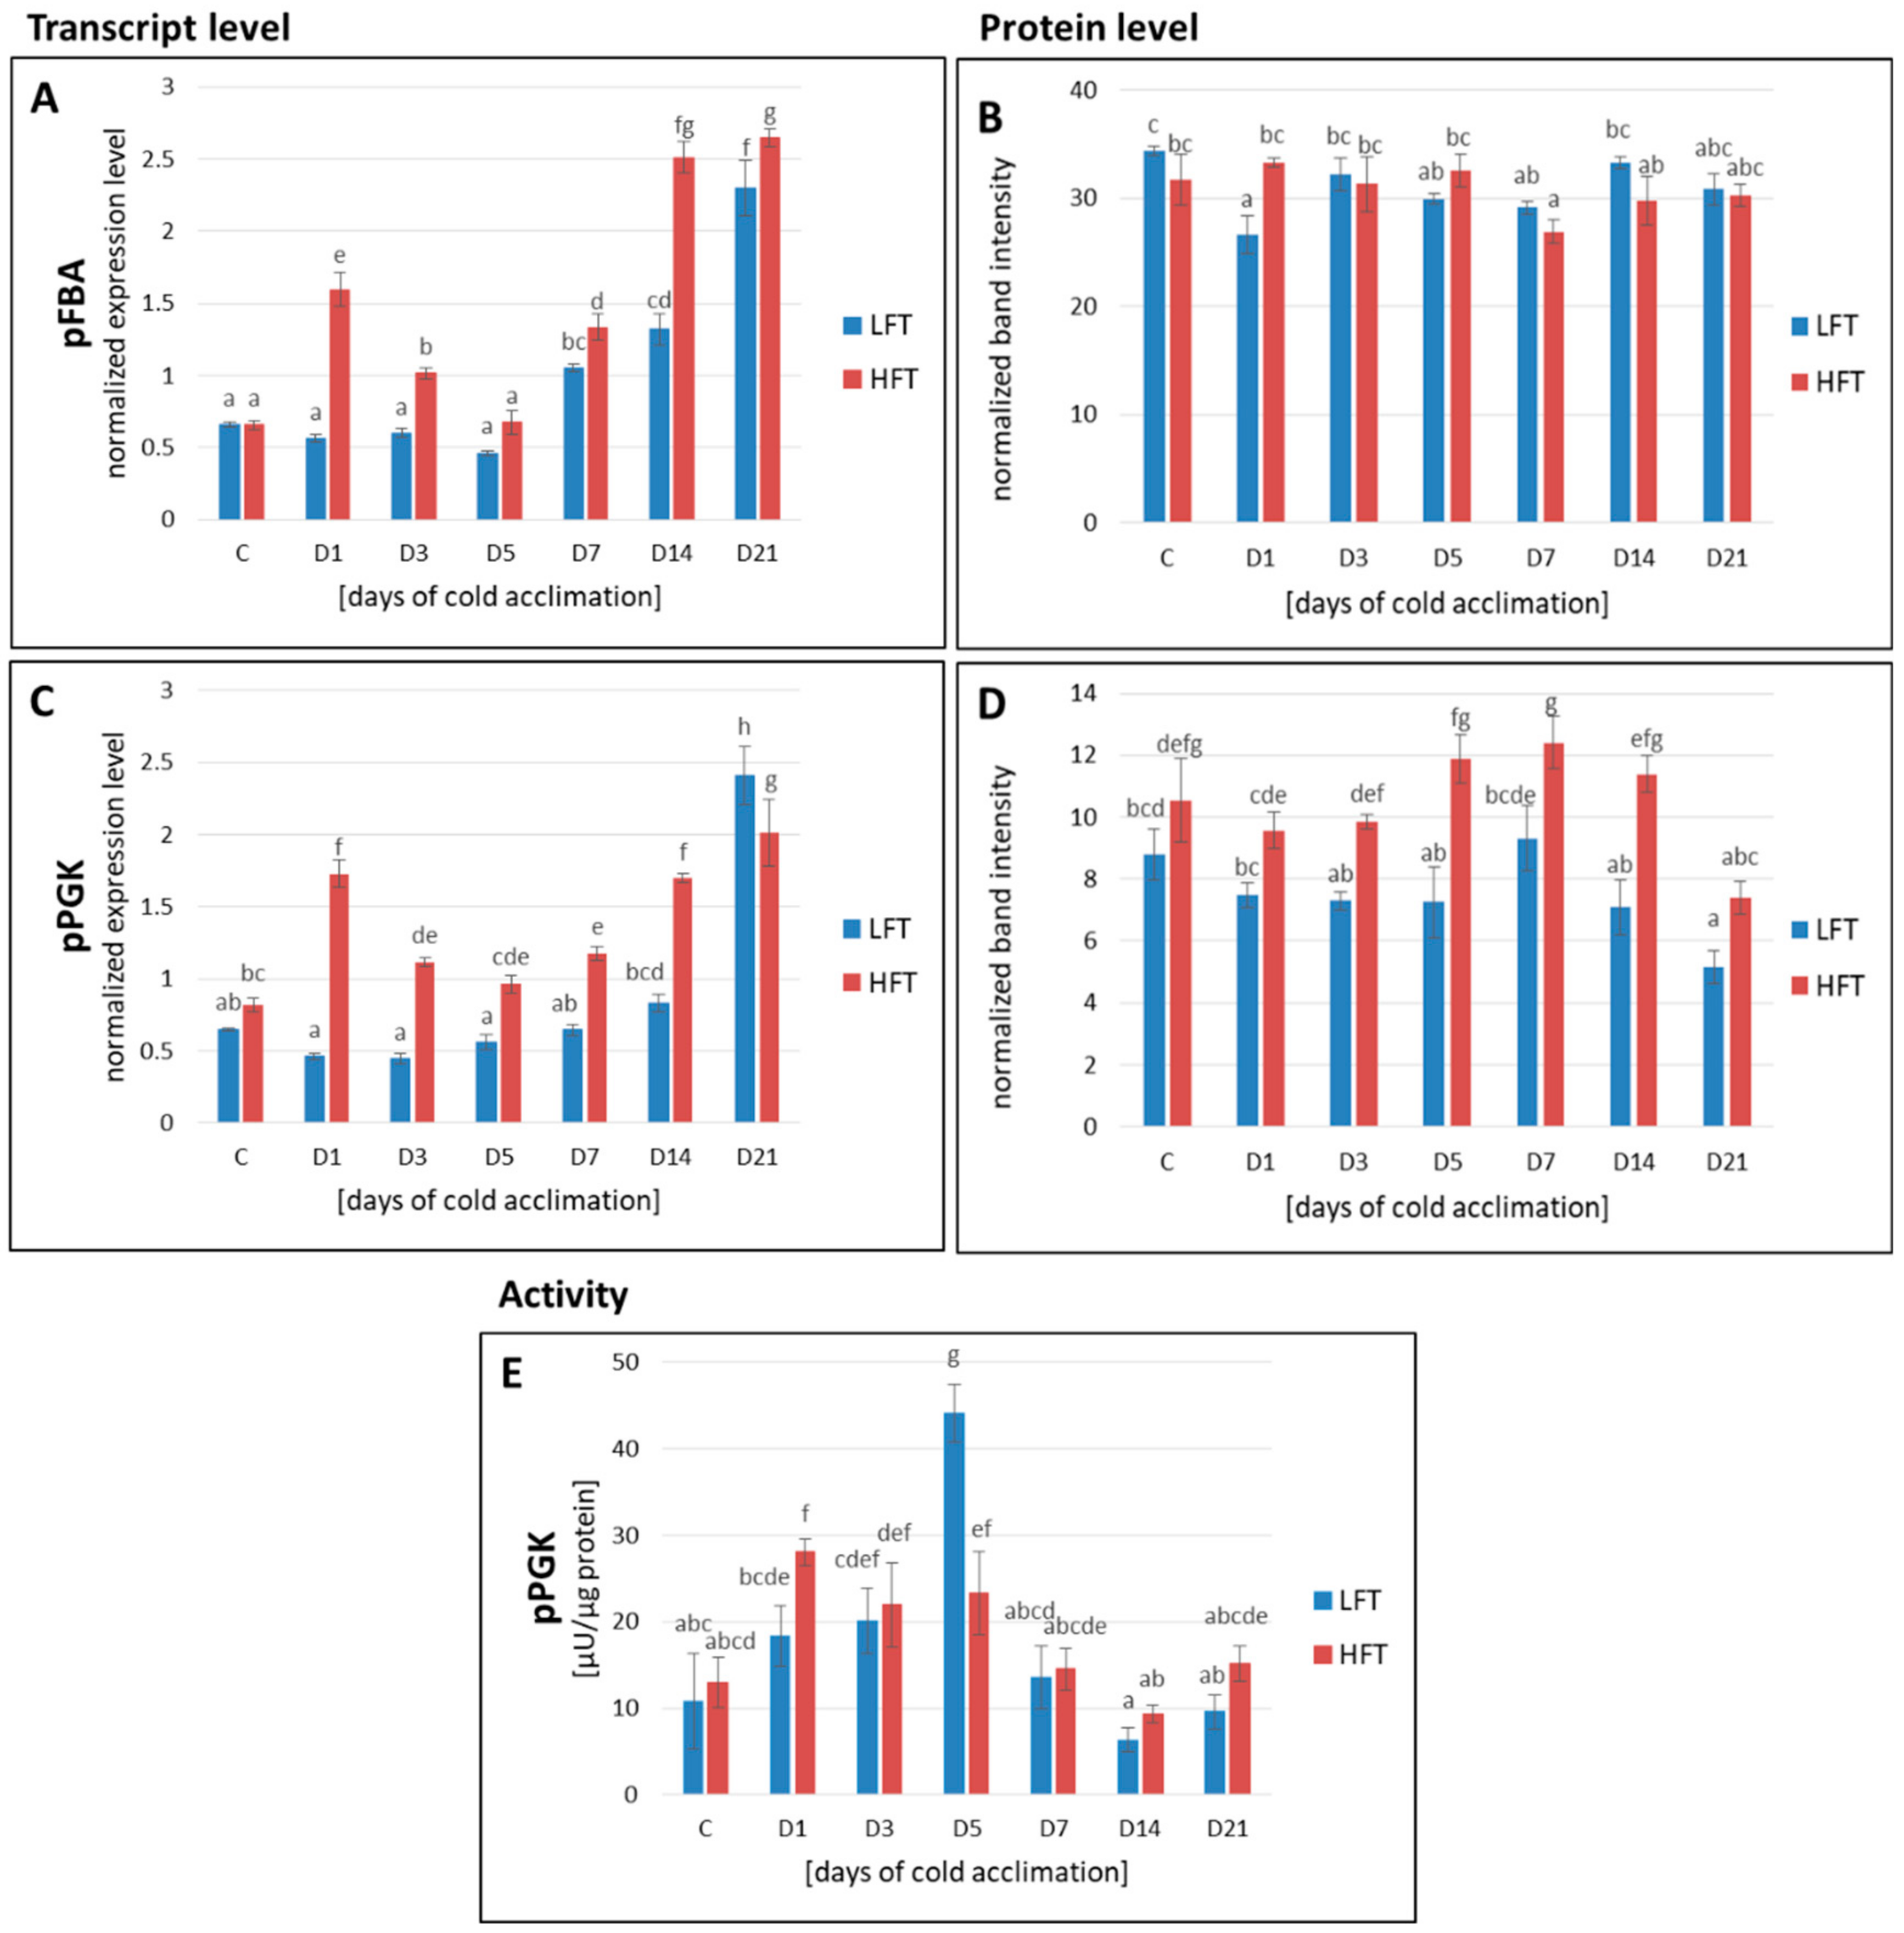
2.4. Transcript and Protein Accumulation of pFBA and pPGK
2.5. pPGK Activity
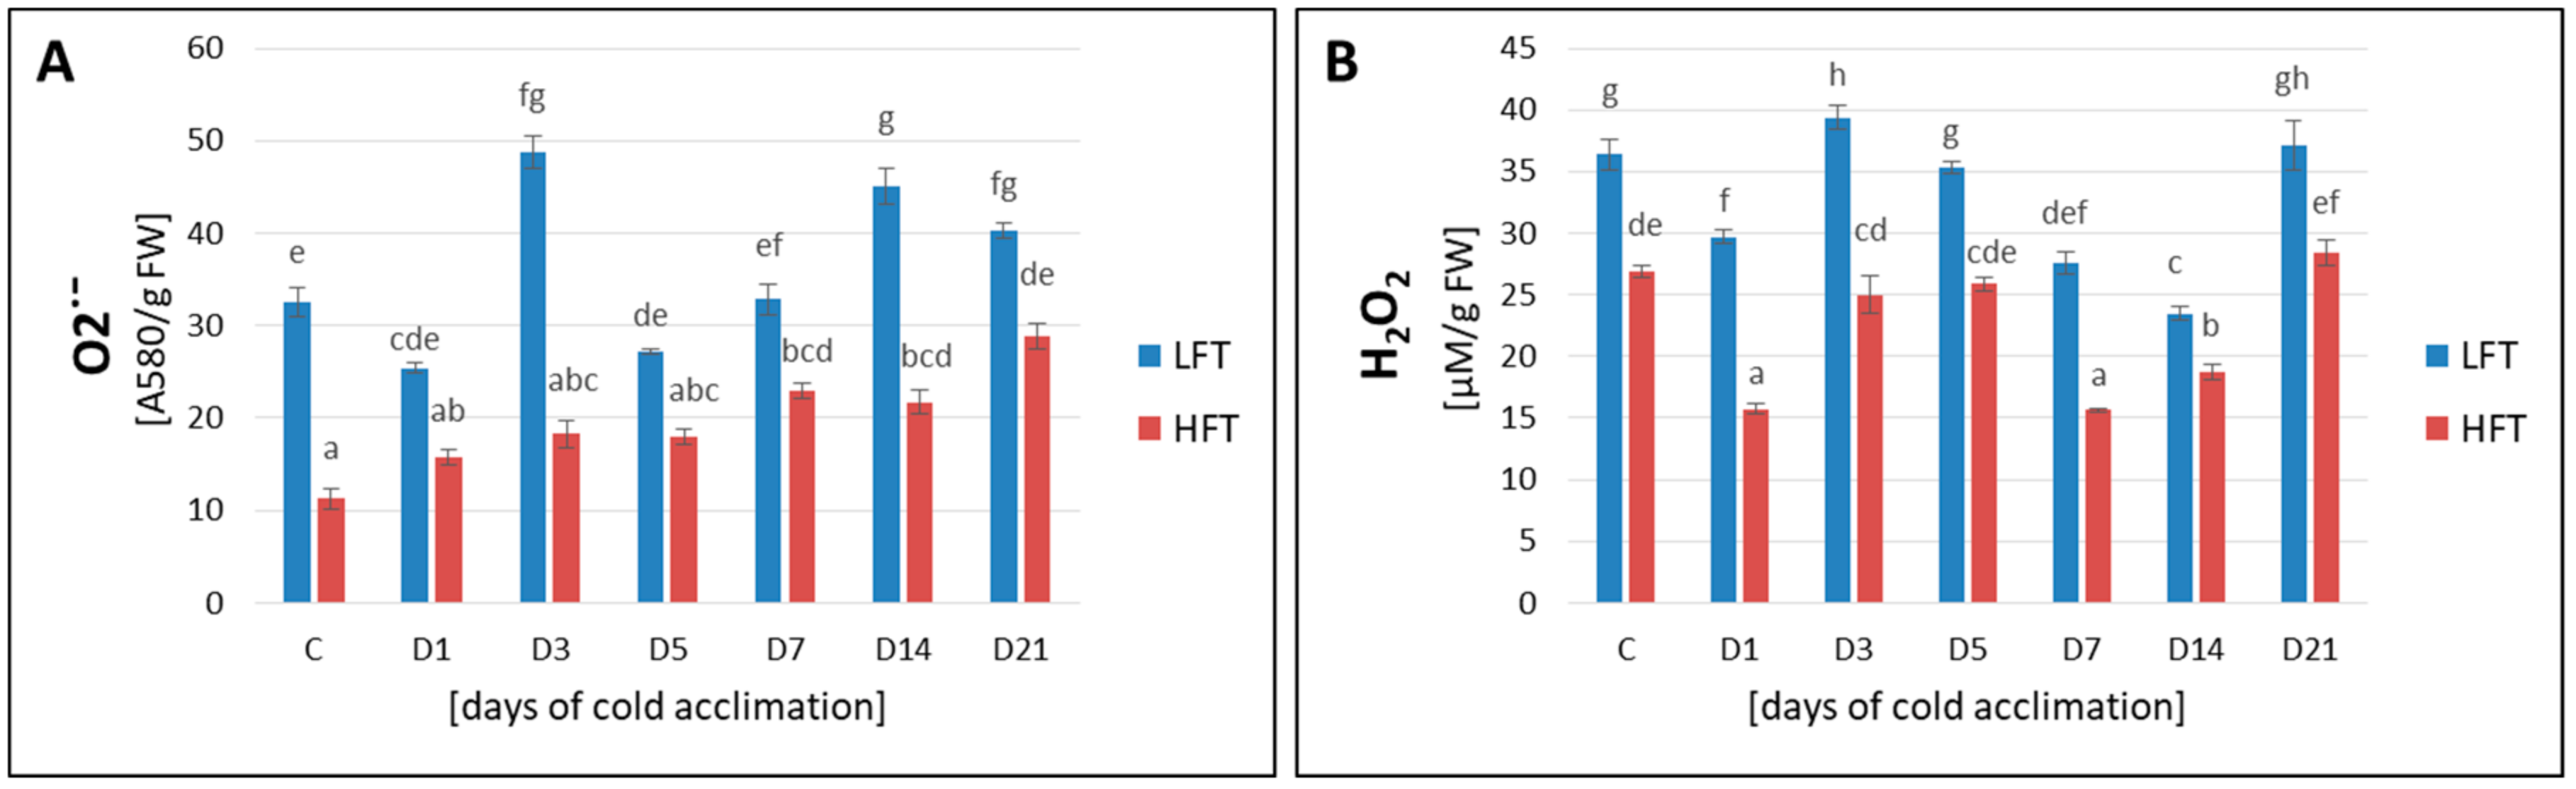
2.6. ROS Content
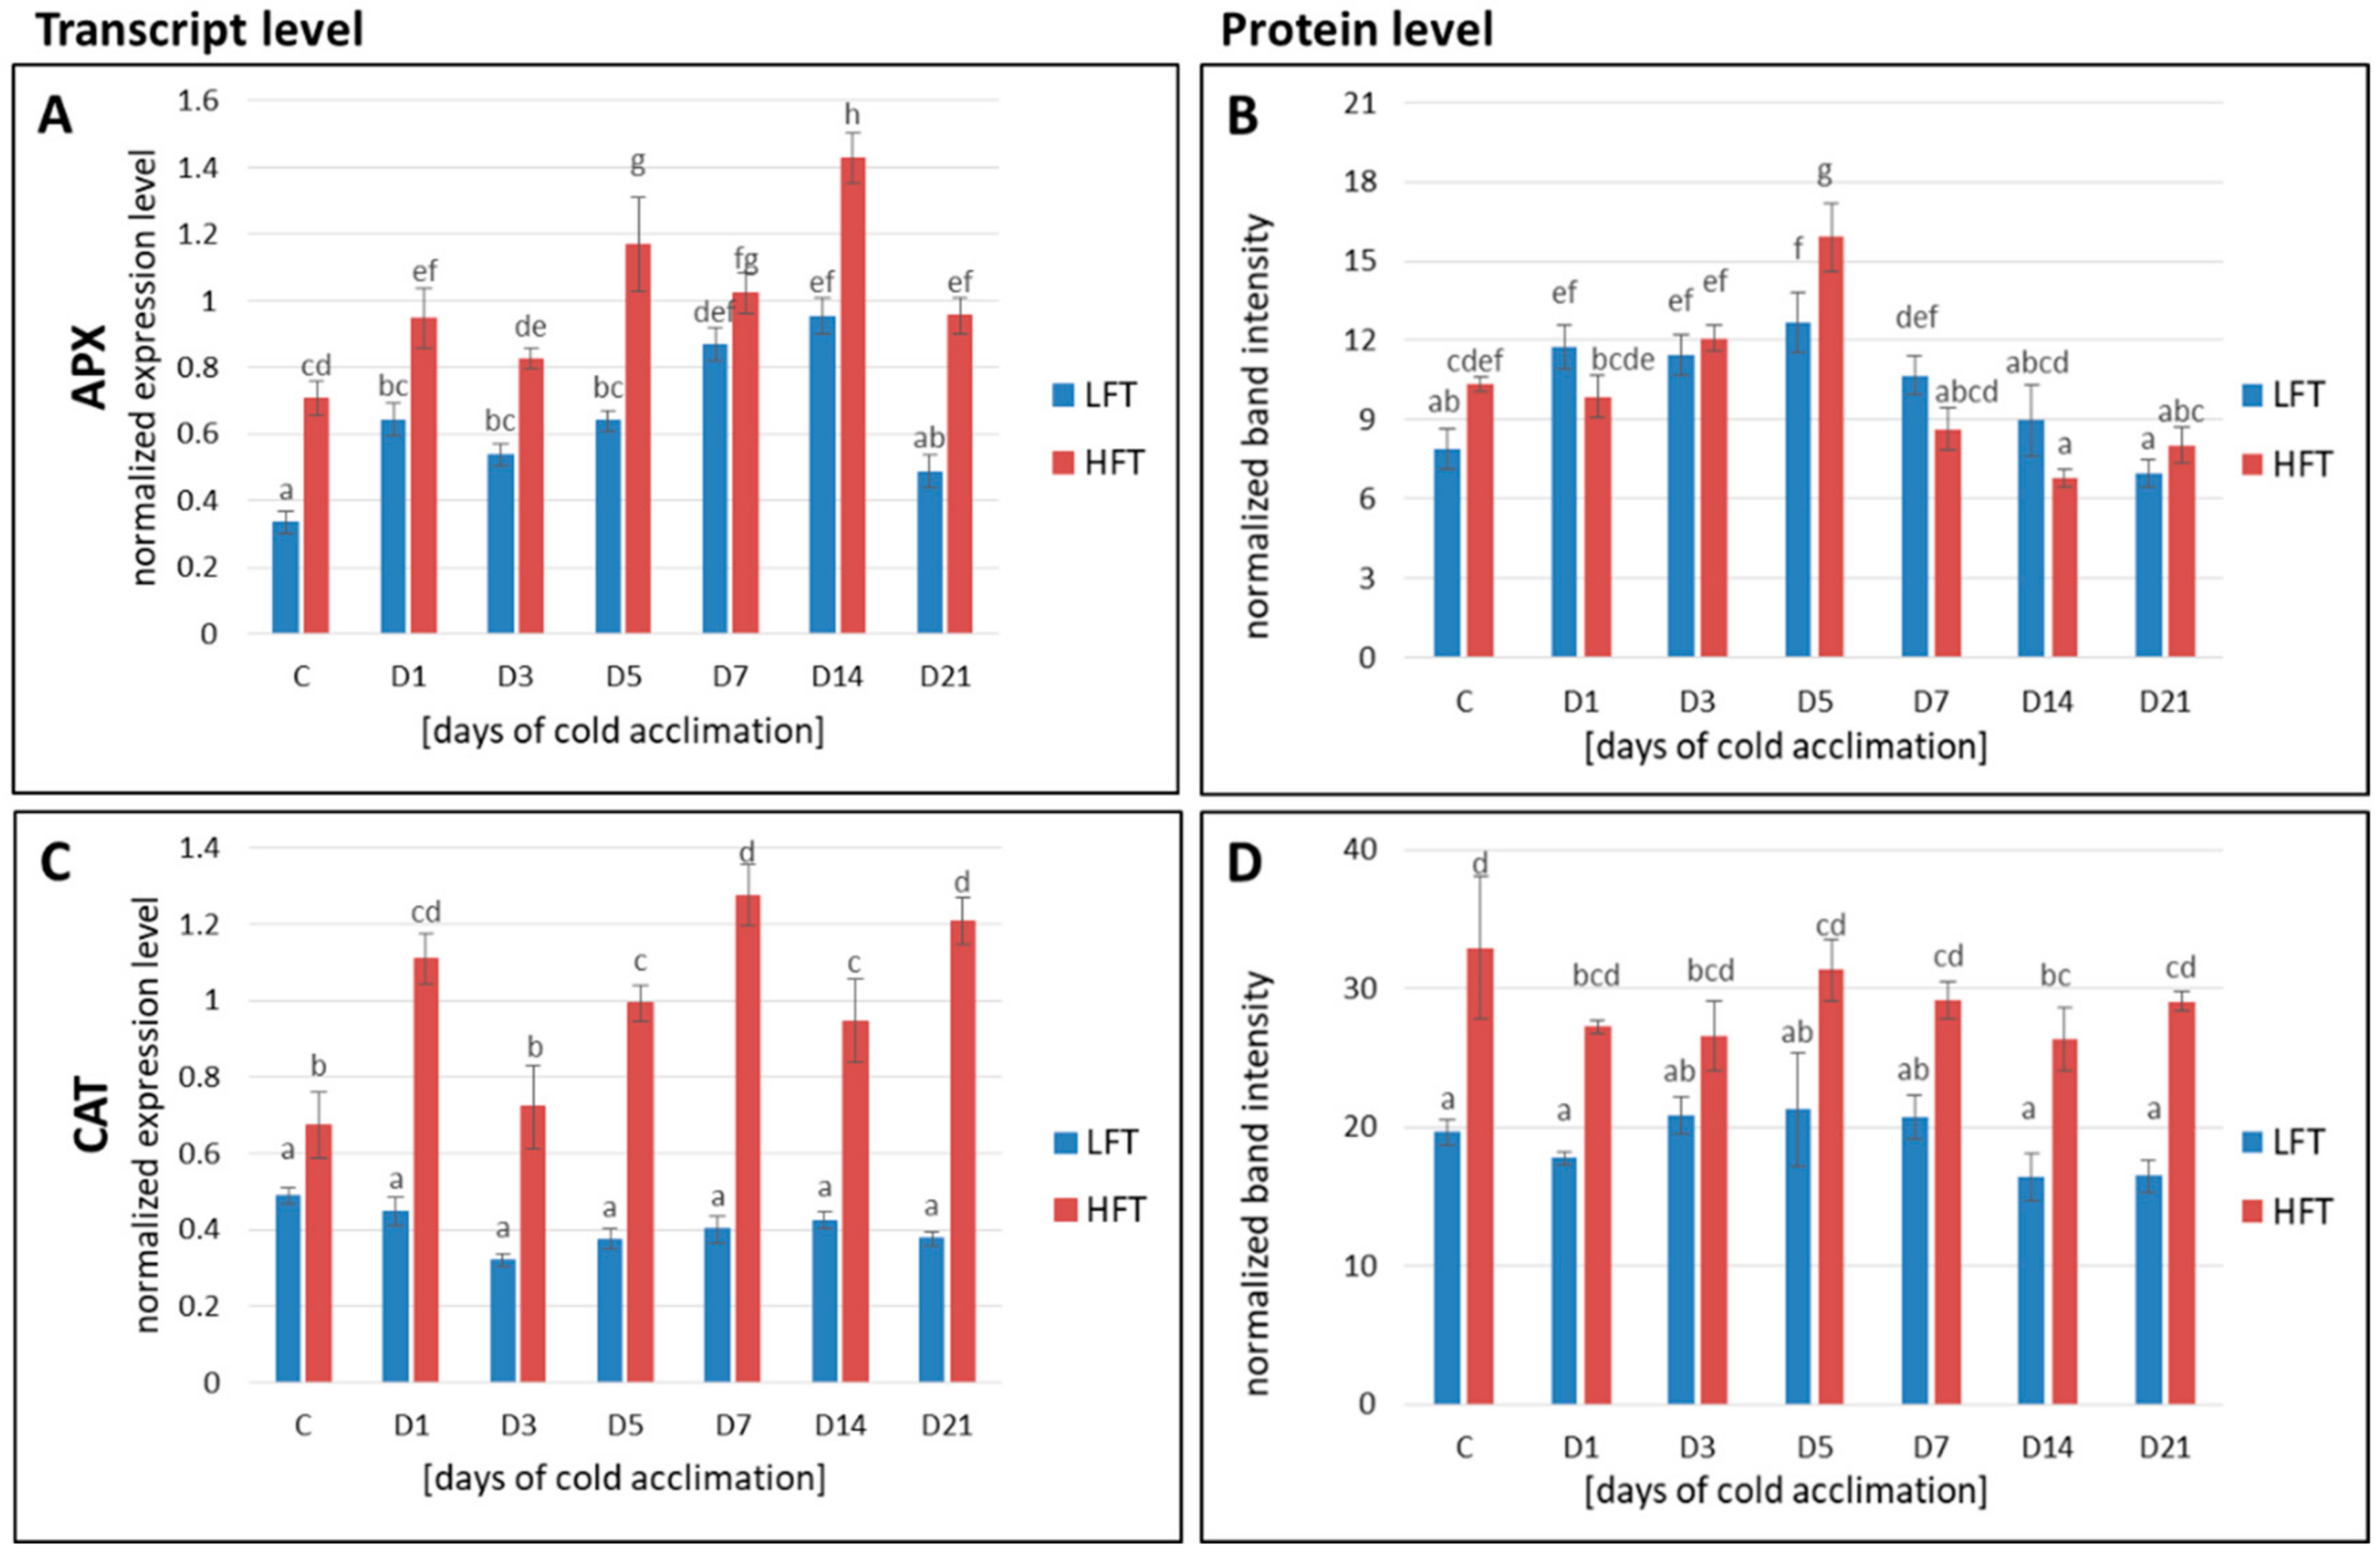
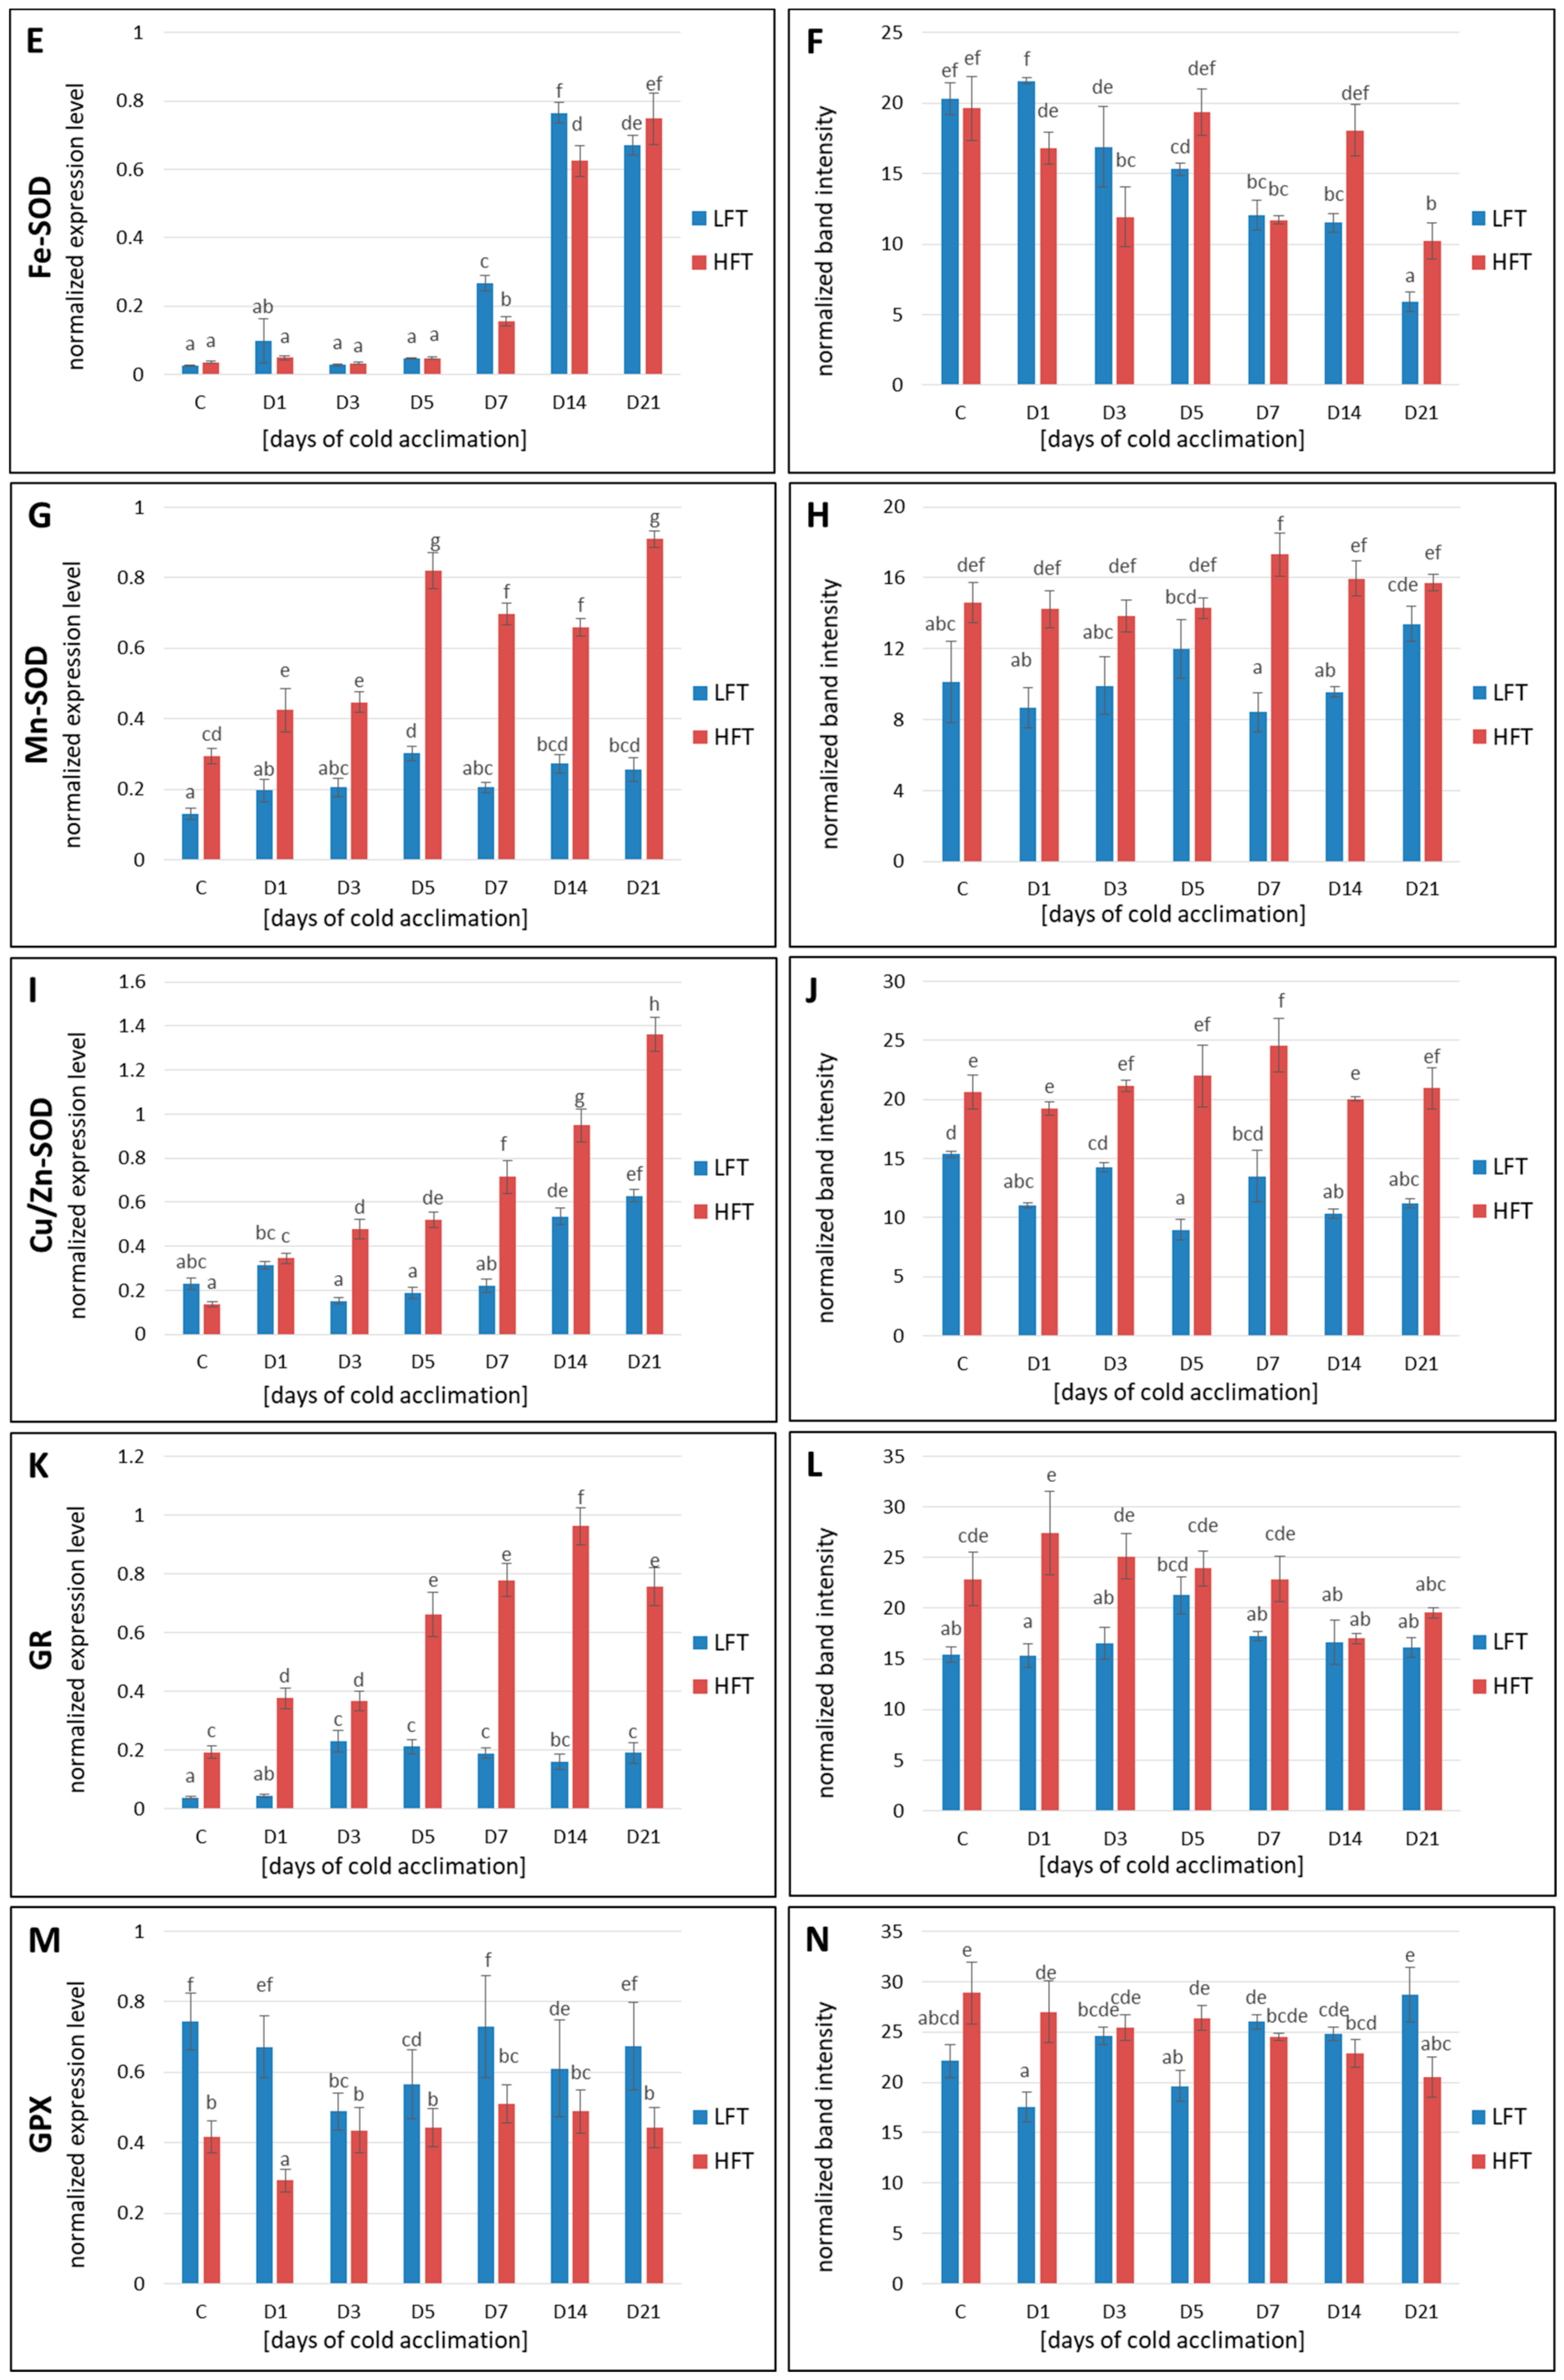
2.7. Transcript and Protein Accumulation of APX, CAT, Fe-SOD, Mn-SOD, Cu/Zn-SOD, GR, and GPX
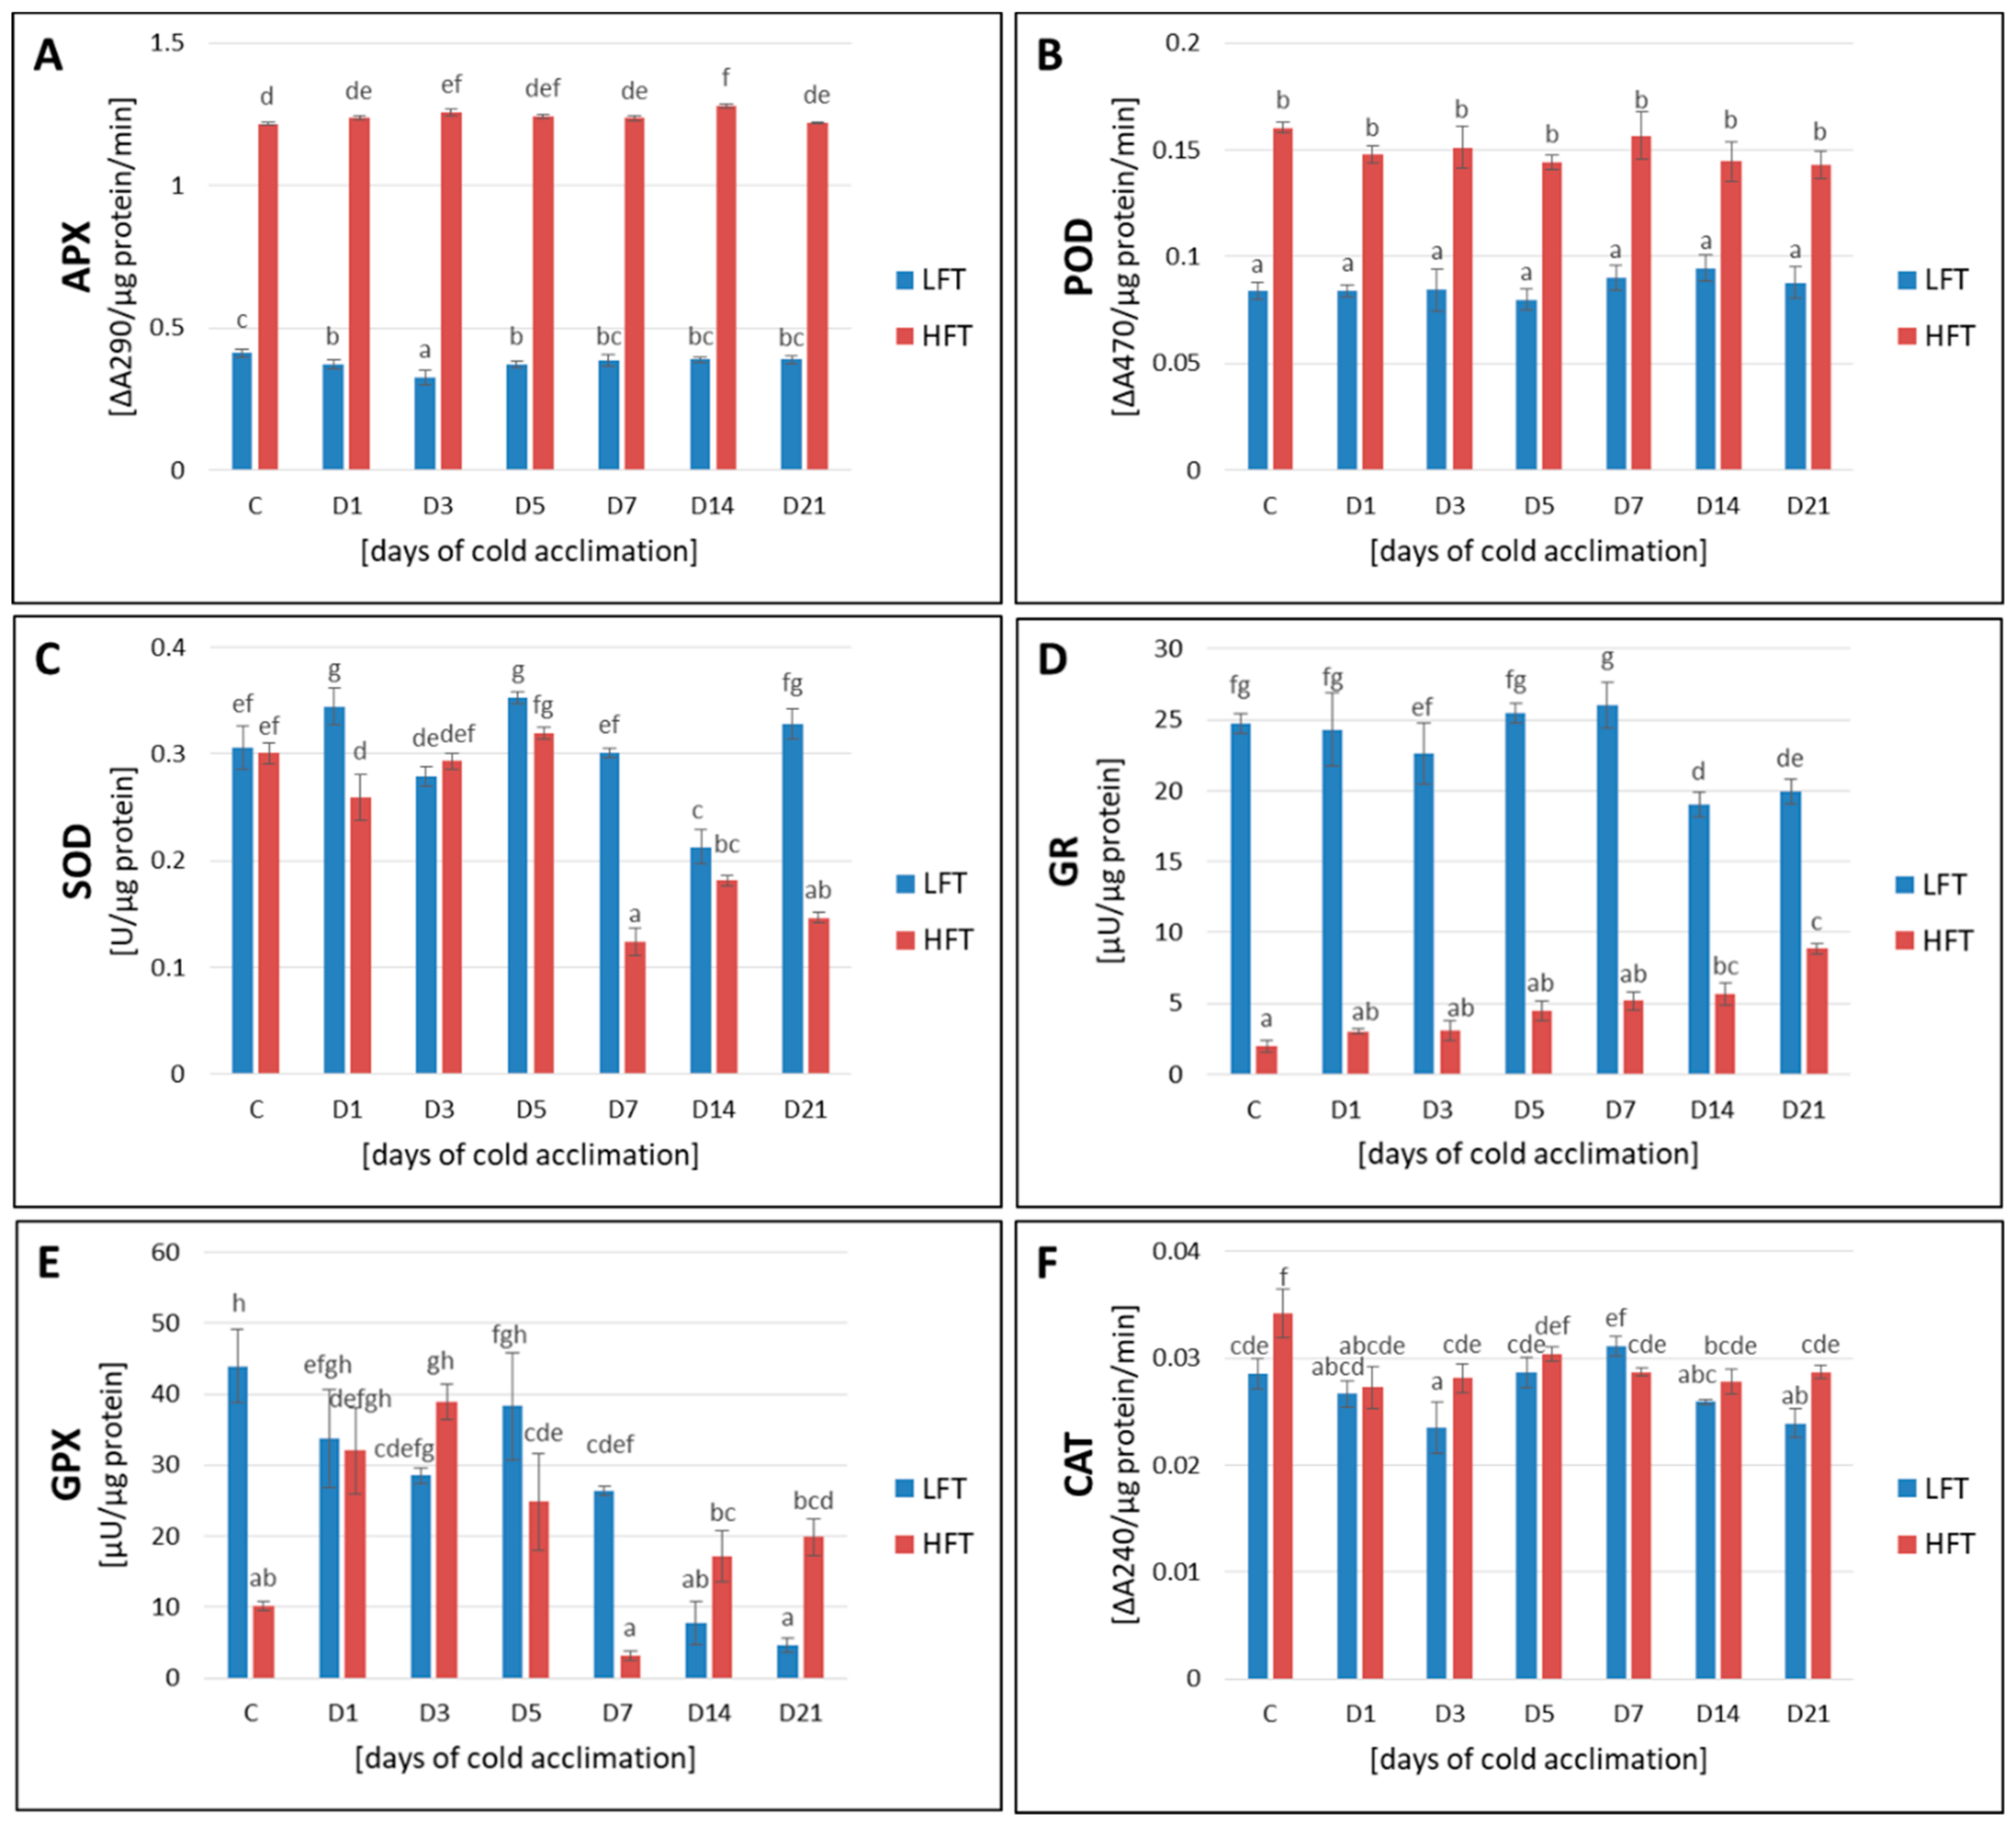
2.8. Activity of APX, POD, CAT, SOD, GR, and GPX
2.9. Accumulation of Cor14b
3. Discussion
3.1. Integrity of Cellular Membranes
3.2. Photosynthetic Capacity
3.2.1. Photoactivity
3.2.2. Gas Exchange
3.2.3. The Calvin Cycle Efficiency
3.3. ROS Content and Antioxidant Capacity
3.4. Cor14b Accumulation and Cellular Protection against Photoinhibition
4. Materials and Methods
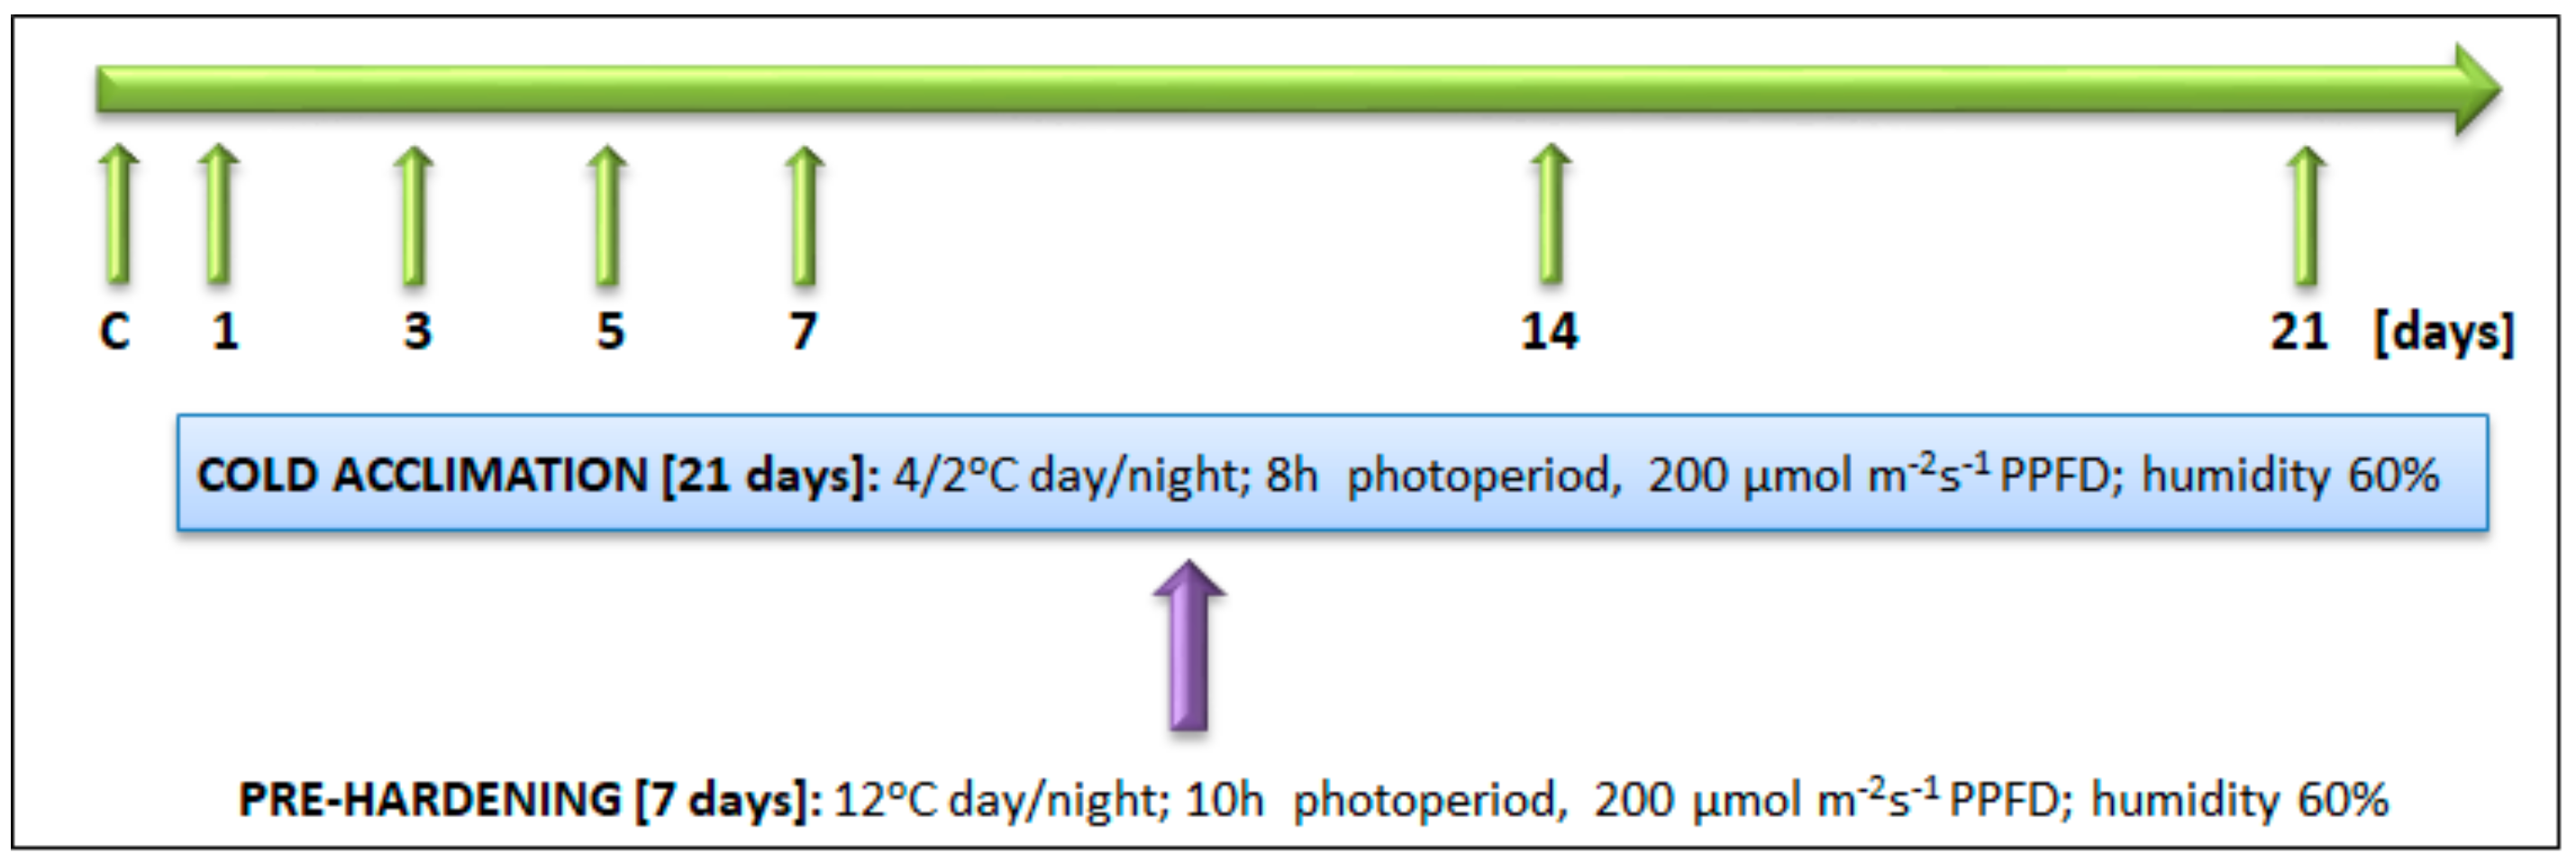
4.1. Plant Materials and Experimental Set Up
4.2. Membrane Integrity
4.2.1. Temperature Causing a 50% Electrolyte Leakage (TEL50)
4.2.2. Lipid Peroxidation
4.3. Capacity of Photosynthetic Apparatus
4.3.1. Chlorophyll Fluorescence
4.3.2. Gas Exchange
4.3.3. Transcript Accumulation-RT-qPCR (pFBA, EC 4.1.2.13 and pPGK, EC 2.7.2.3)
4.3.4. Protein Accumulation-Western Blot (pFBA and pPGK)
4.3.5. pPGK Activity
4.4. ROS Content and Capacity of Antioxidant System
4.4.1. ROS Content
4.4.2. Transcript Accumulation
4.4.3. Protein Accumulation-Western blot (Chloroplastic/Thylakoid APX, CAT, Chloroplastic Fe-SOD, Mitochondrial Mn-SOD, Chloroplastic Cu/Zn-SOD, Chloroplastic and Cytoplasmic GR, and Chloroplastic GPX)
4.4.4. Antioxidant Enzymes Activity
Ascorbate Peroxidase
Catalase
Superoxide Dismutase
Glutathione Peroxidase
Glutathione Reductase
Guaiacol Peroxidase (EC 1.11.1.7)
4.5. Cor14b
4.5.1. Cloning of Cor14b cDNA
4.5.2. Protein Accumulation-Western Blot (Cor14b)
4.6. Statistical Analysis
5. Conclusions
Author Contributions
Funding
Conflicts of Interest
Abbreviations
| A | Net photosynthesis (assimilation of CO2) |
| APX | L-ascorbate peroxidase |
| CA | Cold acclimation |
| CAT | Catalase |
| CBF | C-repeat binding factor |
| Cor | Cold-regulated |
| Cu/Zn-SOD | Copper/zinc superoxide dismutase |
| E | Transpiration |
| EL | Electrolyte leakage |
| EDTA | Ethylenediaminetetraacetic acid |
| Fe-SOD | Iron superoxide dismutase |
| Fv/Fm | Maximum quantum yield of primary PSII photochemistry |
| FW | Fresh weight |
| GPX | Glutathione peroxidase |
| GR | Glutathione reductase |
| gs | Stomatal conductance |
| GSH | Reduced glutathione |
| HFT | High freezing tolerant |
| LFT | Low freezing tolerant |
| Mn-SOD | Manganese superoxide dismutase |
| NBT | Nitrobluetetrazolium |
| pFBA | Plastid fructose-1,6-bisphosphate aldolase |
| POD | Guaiacol peroxidase |
| PPFD | Photosynthetic photon flux density |
| pPGK | Plastid phosphoglycerate kinase |
| PS | Photosystem |
| ROS | Reactive oxygen species |
| RT-qPCR | Reverse transcription quantitative polymerase chain reaction |
| SDS | Sodium dodecyl sulfate |
| SOD | Superoxide dismutase |
| TBA | Thiobarbituric acid |
| TBARS | Thiobarbituric acid reactive substances |
| TCA | Trichloroacetic acid |
| TEL50 | Temperature causing a 50% electrolyte leakage |
| WUE | Water use efficiency |
References
- Bray, E.A.; Bailey-Serres, J.; Weretilnyk, E. Responses to abiotic stress. In Biochemistry & Molecular Biology of Plants; Gruissem, W., Buchannan, B., Jones, R., Eds.; American Society of Plant Physiologists: Rockville, MD, USA, 2000; pp. 1158–1249. [Google Scholar]
- Levitt, J. Responses of Plant to Environmental Stresses. Chilling, Freezing and High Temperature Stresses, 2nd ed.; Academic Press: New York, NY, USA, 1980; Volume 1, p. 497. [Google Scholar]
- Thomashow, M.F. Plant cold acclimation: Freezing Tolerance Genes and Regulatory Mechanisms. Annu. Rev. Plant Physiol. Plant Mol. Biol. 1999, 50, 571–599. [Google Scholar] [CrossRef] [PubMed] [Green Version]
- Rihan, H.Z.; Al-Issawi, M.; Fuller, M.P. Advances in physiological and molecular aspects of plant cold tolerance. J. Plant Interact. 2017, 12, 143–157. [Google Scholar] [CrossRef]
- Stockinger, E.J.; Gilmour, S.J.; Thomashow, M.F. Arabidopsis thaliana CBF1 encodes an AP2 domain-containing transcriptional activator that binds to the C-repeat/DRE, a cis-acting DNA regulatory element that stimulates transcription in response to low temperature and water deficit. Proc. Natl. Acad. Sci. USA 1997, 94, 1035–1040. [Google Scholar] [CrossRef] [PubMed] [Green Version]
- Gilmour, S.J.; Fowler, S.G.; Thomashow, M.F. Arabidopsis Transcriptional Activators BCF1, CBF2, and CBF3 have Matching Functional Activities. Plant Mol. Biol. 2004, 54, 767–781. [Google Scholar] [CrossRef]
- Thomashow, M.F. Arabidopsis thaliana as a Model for Studying Mechanisms of Plant Cold Tolerance. Cold Spring Harbor Monogr. Archiev. 1994, 27, 807–834. [Google Scholar] [CrossRef]
- Crosatti, C.; Marè, C.; Mazzucotelli, E.; Belloni, S.; Barilli, S.; Bassi, R.; Dubcovskyi, J.; Galiba, G.; Stanca, A.M.; Cattivelli, L. Genetic analysis of the expression of the cold- regulated gene cor14b: A way toward the identification of components of the cold response signal transduction in Triticeae. Can. J. Bot. 2003, 81, 1162–1167. [Google Scholar] [CrossRef]
- Rapacz, M.; Wolanin, B.; Hura, K.; Tyrka, M. The effects of cold acclimation on photosynthetic apparatus and the expression of COR14b in four genotypes of barley (Hordeum vulgare) contrasting in their tolerance to freezing and high-light treatment in cold conditions. Ann. Bot. 2008, 101, 689–699. [Google Scholar] [CrossRef] [Green Version]
- Ahres, M.; Gierczik, K.; Boldizsár, Á.; Vítámvás, P.; Galiba, G. Temperature and light-quality-dependent regulation of freezing tolerance in barley. Plants 2020, 9, 83. [Google Scholar] [CrossRef] [Green Version]
- Gill, S.S.; Tuteja, N. Reactive oxygen species and antioxidant machinery in abiotic stress tolerance in crop plants. Plant Physiol. Biochem. 2010, 48, 909–930. [Google Scholar] [CrossRef]
- Choudhury, F.K.; Rivero, R.M.; Blumwald, E.; Mittler, R. Reactive oxygen species, abiotic stress and stress combination. Plant J. 2017, 90, 856–867. [Google Scholar] [CrossRef]
- McAinsh, M.R.; Clayton, H.; Mansfield, T.A.; Hetherington, A.M. Changes in stomatal behavior and guard cell cytosolic free calcium in response to oxidative stress. Plant Physiol. 1996, 111, 1031–1042. [Google Scholar] [CrossRef] [PubMed] [Green Version]
- Allan, A.C.; Fluhr, R. Two distinct sources of elicited reactive oxygen species in tobacco epidermal cells. Plant Cell 1997, 9, 1559–1572. [Google Scholar] [CrossRef] [PubMed]
- Lee, S.; Choi, H.; Suh, S.; Doo, I.S.; Oh, K.Y.; Choi, E.J.; Schroeder Taylor, A.T.; Low, P.S.; Lee, Y. Oligogalacturonic acid and chitosan reduce stomatal aperture by inducing the evolution of reactive oxygen species from guard cells of tomato and Commelina communis. Plant Physiol. 1999, 121, 147–152. [Google Scholar] [CrossRef] [PubMed] [Green Version]
- Pei, Z.M.; Murata, Y.; Benning, G.; Thomine, S.; Klüsener, B.; Allen, G.J.; Grill, E.; Schroeder, J.I. Calcium channels activated by hydrogen peroxide mediate abscisic acid signalling in guard cells. Nature 2000, 406, 731–734. [Google Scholar] [CrossRef]
- Mittler, R.; Vanderauwera, S.; Gollery, M.; Van Breusegem, F. Reactive oxygen gene network of plants. Trends Plant Sci. 2004, 9, 490–498. [Google Scholar] [CrossRef]
- Smirnoff, N.; Arnaud, D. Hydrogen peroxide metabolism and functions in plants. New Phytol. 2019, 221, 1197–1214. [Google Scholar] [CrossRef]
- Mittler, R. ROS Are Good. Trends Plant Sci. 2017, 22, 11–19. [Google Scholar] [CrossRef] [Green Version]
- Mhamdi, A.; Queval, G.; Chaouch, S.; Vanderauwera, S.; Van Breusegem, F.; Noctor, G. Catalase function in plants: A focus on Arabidopsis mutants as stress-mimic models. J. Exp. Bot. 2010, 61, 4197–4220. [Google Scholar] [CrossRef] [Green Version]
- Noctor, G.; Foyer, C.H. Ascorbate and glutathione: Keeping Active Oxygen Under Control. Annu. Rev. Plant Physiol. Plant Mol. Biol. 1998, 49, 249–279. [Google Scholar] [CrossRef]
- Foyer, C.H.; Noctor, G. Ascorbate and glutathione: The heart of the redox hub. Plant Physiol. 2011, 155, 2–18. [Google Scholar] [CrossRef] [Green Version]
- Uarrota, V.G.; Moresco, R.; Schmidt, E.C.; Bouzon, Z.L.; Da Costa Nunes, E.; De Oliveira Neubert, E.; Peruch, L.A.M.; Rocha, M.; Maraschin, M. The role of ascorbate peroxidase, guaiacol peroxidase, and polysaccharides in cassava (Manihot esculenta Crantz) roots under postharvest physiological deterioration. Food Chem. 2016, 197, 737–746. [Google Scholar] [CrossRef] [PubMed] [Green Version]
- Das, K.; Roychoudhury, A. Reactive oxygen species (ROS) and response of antioxidants as ROS-scavengers during environmental stress in plants. Front. Environ. Sci. 2014, 2, 53. [Google Scholar] [CrossRef] [Green Version]
- Mittler, R. Oxidative stress, antioxidants and stress tolerance. Trends Plant Sci. 2002, 7, 405–410. [Google Scholar] [CrossRef] [PubMed]
- Gill, S.S.; Anjum, N.A.; Gill, R.; Yadav, S.; Hasanuzzaman, M.; Fujita, M.; Mishra, P.; Sabat, S.C.; Tuteja, N. Superoxide dismutase—Mentor of abiotic stress tolerance in crop plants. Environ. Sci. Pollut. Res. 2015, 22, 10375–10394. [Google Scholar] [CrossRef]
- Sofo, A.; Scopa, A.; Nuzzaci, M.; Vitti, A. Ascorbate peroxidase and catalase activities and their genetic regulation in plants subjected to drought and salinity stresses. Int. J. Mol. Sci. 2015, 16, 13561–13578. [Google Scholar] [CrossRef] [Green Version]
- Caverzan, A.; Casassola, A.; Brammer, S.P. Antioxidant responses of wheat plants under stress. Genet. Mol. Biol. 2016, 39, 1. [Google Scholar] [CrossRef] [Green Version]
- Lu, F.; Liang, X.; Lu, H.; Li, Q.; Chen, Q.; Zhang, P.; Li, K.; Liu, G.; Yan, W.; Song, J.; et al. Overproduction of superoxide dismutase and catalase confers cassava resistance to Tetranychus cinnabarinus. Sci. Rep. 2017, 7, 40179. [Google Scholar] [CrossRef]
- Lechowicz, K.; Pawłowicz, I.; Perlikowski, D.; Arasimowicz-Jelonek, M.; Majka, J.; Augustyniak, A.; Rapacz, M.; Kosmala, A. Two Festuca Species-F. arundinacea and F. glaucescens-Differ in the Molecular Response to Drought, While Their Physiological Response Is Similar. Int. J. Mol. Sci. 2020, 21, 3174. [Google Scholar] [CrossRef]
- Kosmala, A.; Zwierzykowski, Z.; Ga̧sior, D.; Rapacz, M.; Zwierzykowska, E.; Humphreys, M.W. GISH/FISH mapping of genes for freezing tolerance transferred from Festuca pratensis to Lolium multiflorum. Heredity (Edinb) 2006, 96, 243–251. [Google Scholar] [CrossRef] [Green Version]
- Kosmala, A.; Zwierzykowski, Z.; Zwierzykowska, E.; Łuczak, M.; Rapacz, M.; Ga̧sior, D.; Humphreys, M.W. Introgression mapping of genes for winter hardiness and frost tolerance transferred from Festuca arundinacea into Lolium multiflorum. J. Hered. 2007, 98, 311–316. [Google Scholar] [CrossRef]
- Kosmala, A.; Bocian, A.; Rapacz, M.; Jurczyk, B.; Zwierzykowski, Z. Identification of leaf proteins differentially accumulated during cold acclimation between Festuca pratensis plants with distinct levels of frost tolerance. J. Exp. Bot. 2009, 60, 3595–3609. [Google Scholar] [CrossRef] [PubMed] [Green Version]
- Perlikowski, D.; Kosmala, A.; Rapacz, M.; Kościelniak, J.; Pawlowicz, I.; Zwierzykowski, Z. Influence of short-term drought conditions and subsequent re-watering on the physiology and proteome of Lolium multiflorum/Festuca arundinacea introgression forms, with contrasting levels of tolerance to long-term drought. Plant Biol. 2014, 16, 385–394. [Google Scholar] [CrossRef] [PubMed]
- Perlikowski, D.; Czyżniejewski, M.; Marczak, Ł.; Augustyniak, A.; Kosmala, A. Water deficit affects primary metabolism differently in two Lolium multiflorum/Festuca arundinacea introgression forms with a distinct capacity for photosynthesis and membrane regeneration. Front. Plant Sci. 2016, 7, 1063. [Google Scholar] [CrossRef] [PubMed] [Green Version]
- Perlikowski, D.; Kierszniowska, S.; Sawikowska, A.; Krajewski, P.; Rapacz, M.; Eckhardt, Ä.; Kosmala, A. Remodeling of leaf cellular glycerolipid composition under drought and re-hydration conditions in grasses from the Lolium-Festuca complex. Front. Plant Sci. 2016, 7, 1027. [Google Scholar] [CrossRef] [Green Version]
- Perlikowski, D.; Augustyniak, A.; Masajada, K.; Skirycz, A.; Soja, A.M.; Michaelis, Ä.; Wolter, G.; Kosmala, A. Structural and metabolic alterations in root systems under limited water conditions in forage grasses of Lolium-Festuca complex. Plant Sci. 2019, 283, 211–223. [Google Scholar] [CrossRef]
- Augustyniak, A.; Perlikowski, D.; Rapacz, M.; Kościelniak, J.; Kosmala, A. Insight into cellular proteome of Lolium multiflorum/Festuca arundinacea introgression forms to decipher crucial mechanisms of cold acclimation in forage grasses. Plant Sci. 2018, 272, 22–31. [Google Scholar] [CrossRef]
- Płażek, A.; Pociecha, E.; Augustyniak, A.; Masajada, K.; Dziurka, M.; Majka, J.; Perlikowski, D.; Pawłowicz, I.; Kosmala, A. Dissection of resistance to Microdochium nivale in Lolium multiflorum/Festuca arundinacea introgression forms. Plant Physiol. Biochem. 2018, 123, 43–53. [Google Scholar] [CrossRef]
- Artus, N.N.; Uemura, M.; Steponkus, P.L.; Gilmour, S.J.; Lin, C.; Thomashow, M.F. Constitutive expression of the cold-regulated Arabidopsis thaliana COR15a gene affects both chloroplast and protoplast freezing tolerance. Proc. Natl. Acad. Sci. USA 1996, 93, 13404–13409. [Google Scholar] [CrossRef] [Green Version]
- Steponkus, P.L.; Uemura, M.; Joseph, R.A.; Gilmour, S.J.; Thomashow, M.F. Mode of action of the COR15a gene on the freezing tolerance of Arabidopsis thaliana. Proc. Natl. Acad. Sci. USA 1998, 95, 14570–14575. [Google Scholar] [CrossRef] [Green Version]
- Steponkus, P.L. Role of the Plasma Membrane in Freezing Injury and Cold Acclimation. Ann. Rev. Plant Physiol. 1984, 35, 543–584. [Google Scholar] [CrossRef]
- Bocian, A.; Kosmala, A.; Rapacz, M.; Jurczyk, B.; Marczak, Ł.; Zwierzykowski, Z. Differences in leaf proteome response to cold acclimation between Lolium perenne plants with distinct levels of frost tolerance. J. Plant Physiol. 2011, 168, 1271–1279. [Google Scholar] [CrossRef] [PubMed]
- Barclay, K.D.; McKersie, B.D. Peroxidation reactions in plant membranes: Effects of free fatty acids. Lipids 1994, 29, 877–882. [Google Scholar] [CrossRef] [PubMed]
- Sharma, P.; Jha, A.B.; Dubey, R.S.; Pessarakli, M. Reactive Oxygen Species, Oxidative Damage, and Antioxidative Defense Mechanism in Plants under Stressful Conditions. J. Bot. 2012, 2012, 217037. [Google Scholar] [CrossRef] [Green Version]
- Hossain, M.A.; Bhattacharjee, S.; Armin, S.M.; Qian, P.; Xin, W.; Li, H.Y.; Burritt, D.J.; Fujita, M.; Tran, L.S.P. Hydrogen peroxide priming modulates abiotic oxidative stress tolerance: Insights from ROS detoxification and scavenging. Front. Plant Sci. 2015, 6, 420. [Google Scholar] [CrossRef] [PubMed] [Green Version]
- McKersie, B.D.; Bowley, S.R. Active Oxygen and Freezing Tolerance in Transgenic Plants. In Plant Cold Hardiness; Li, P.H., Chen, T.H.H., Eds.; Springer: Boston, MA, USA, 1997. [Google Scholar]
- Uemura, M.; Steponkus, P.L. Effect of cold acclimation on the lipid composition of the inner and outer membrane of the chloroplast envelope isolated from rye leaves. Plant Physiol. 1997, 114, 1493–1500. [Google Scholar] [CrossRef] [Green Version]
- Strauss, G.; Hauser, H. Stabilization of lipid bilayer vesicles by sucrose during freezing. Proc. Natl. Acad. Sci. USA 1986, 83, 2422–2426. [Google Scholar] [CrossRef] [Green Version]
- Hüner, N.P.A.; Öquist, G.; Sarhan, F. Energy balance and acclimation to light and cold. Trends Plant Sci. 1998, 3, 224–230. [Google Scholar] [CrossRef]
- Paul, M.J.; Foyer, C.H. Sink regulation of photosynthesis. J. Exp. Bot. 2001, 52, 1383–1400. [Google Scholar] [CrossRef]
- Falkowski, P.G.; Chen, Y. Photoacclimation of Light Harvesting Systems in Eukaryotic Algae. In Light-harvesting Antennas in Photosynthesis; Green, B.R., Parson, W.W., Eds.; Kluwer Academic Publishers: Dordrecht, The Netherlands, 2003; pp. 423–447. [Google Scholar] [CrossRef]
- Hüner, N.P.A.; Oquist, G.; Melis, A. Photostasis in plants, green algae and cyanobacteria: The role of light harvesting antenna complexes. In Advances in Photosynthesis and Respiration Light Harvesting Antennas in Photosynthesis; Green, B.R., Parson, W.W., Eds.; Kluwer Academic Publishers: Dordrecht, The Netherlands, 2003; pp. 401–421. [Google Scholar]
- Nägele, T.; Kandel, B.A.; Frana, S.; Meißner, M.; Heyer, A.G. A systems biology approach for the analysis of carbohydrate dynamics during acclimation to low temperature in Arabidopsis thaliana. FEBS J. 2011, 278, 506–518. [Google Scholar] [CrossRef]
- Krause, G.H.; Weis, E. Chlorophyll Fluorescence and Photosynthesis: The Basics. Annu. Rev. Plant Physiol. Plant Mol. Biol. 1991, 42, 313–349. [Google Scholar] [CrossRef]
- Van Buer, J.; Cvetkovic, J.; Baier, M. Cold regulation of plastid ascorbate peroxidases serves as a priming hub controlling ROS signaling in Arabidopsis thaliana. BMC Plant Biol. 2016, 16, 163. [Google Scholar] [CrossRef] [PubMed] [Green Version]
- Krause, G.H. Photoinhibition of photosynthesis. An evaluation of damaging and protective mechanisms. Physiol. Plant 1988, 74, 566–574. [Google Scholar] [CrossRef]
- Rapacz, M.; Gasior, D.; Zwierzykowski, Z.; Lesniewska-Bocianowska, A.; Humphreys, M.W.; Gay, A.P. Changes in cold tolerance and the mechanisms of acclimation of photosystem II to cold hardening generated by anther culture of Festuca pratensis x Lolium multiflorum cultivars. New Phytol. 2004, 162, 105–114. [Google Scholar] [CrossRef]
- Krieger-Liszkay, A.; Fufezan, C.; Trebst, A. Singlet oxygen production in photosystem II and related protection mechanism. Photosynth. Res. 2008, 98, 551–564. [Google Scholar] [CrossRef]
- Jurczyk, B.; Grzesiak, M.; Pociecha, E.; Wlazło, M.; Rapacz, M. Diverse stomatal behaviors mediating photosynthetic acclimation to low temperatures in Hordeum vulgare. Front. Plant Sci. 2019, 9, 1963. [Google Scholar] [CrossRef]
- Hüner, N.P.A.; Öquist, G.; Hurry, V.M.; Krol, M.; Falk, S.; Griffith, M. Photosynthesis, photoinhibition and low temperature acclimation in cold tolerant plants. Photosynth. Res. 1993, 37, 19–39. [Google Scholar] [CrossRef]
- Agurla, S.; Gahir, S.; Munemasa, S.; Murata, Y.; Raghavendra, A.S. Mechanism of Stomatal Closure in Plants Exposed to Drought and Cold Stress. In Survival Strategies in Extreme Cold and Desiccation: Adaptation Mechanisms and Their Applications; Iwaya-Inoue, M., Sakurai, M., Uemura, M., Eds.; Springer: Singapore, 2018. [Google Scholar] [CrossRef]
- Davies, W.J.; Rodriguez, J.L.; Fiscus, E.L. Stomatal behavior and water-movement through roots of wheat plants treated with abscisic acid. Plant Cell Environ. 1982, 5, 485–493. [Google Scholar] [CrossRef]
- Wilkinson, S.; Clephan, A.L.; Davies, W.J. Rapid low temperature-induced stomatal closure occurs in cold-tolerant Commelina communis leaves but not in cold-sensitive tobacco leaves, via a mechanism that involves apoplastic calcium but not abscisic acid. Plant Physiol. 2001, 126, 1566–1578. [Google Scholar] [CrossRef] [Green Version]
- Hurry, V.M.; Keerberg, O.; Pärnik, T.; Gardeström, P.; Öquist, G. Cold-hardening results in increased activity of enzymes involved in carbon metabolism in leaves of winter rye (Secale cereale L.). Planta 1995, 195, 554–562. [Google Scholar] [CrossRef]
- Foyer, C.H.; Noctor, G. Redox signaling in plants. Antioxid. Redox Signal. 2013, 18, 2087–2090. [Google Scholar] [CrossRef]
- Schieber, M.; Chandel, N.S. ROS function in redox signaling and oxidative stress. Curr. Biol. 2014, 24, R453–R462. [Google Scholar] [CrossRef] [PubMed] [Green Version]
- Dreyer, A.; Dietz, K.J. Reactive oxygen species and the redox-regulatory network in cold stress acclimation. Antioxidants 2018, 7, 169. [Google Scholar] [CrossRef] [Green Version]
- Anbar, A.D.; Duan, Y.; Lyons, T.W.; Arnold, G.L.; Kendall, B.; Creaser, R.A.; Kaufman, A.J.; Gordon, G.W.; Scott, C.; Garvin, J.; et al. A whiff of oxygen before the great oxidation event? Science 2007, 317, 1903–1906. [Google Scholar] [CrossRef] [PubMed] [Green Version]
- Chaouch, S.; Queval, G.; Vanderauwera, S.; Mhamdi, A.; Vandorpe, M.; Langlois-Meurinne, M.; van Breusegem, F.; Saindrenan, P.; Noctor, G. Peroxisomal hydrogen peroxide is coupled to biotic defense responses by isochorismate synthase 1 in a daylength-related manner. Plant Physiol. 2010, 153, 1692–1705. [Google Scholar] [CrossRef] [PubMed] [Green Version]
- Kangasjärvi, S.; Neukermans, J.; Li, S.; Aro, E.M.; Noctor, G. Photosynthesis, photorespiration, and light signalling in defence responses. J. Exp. Bot. 2012, 63, 1619–1636. [Google Scholar] [CrossRef] [Green Version]
- Juszczak, I.; Cvetkovic, J.; Zuther, E.; Hincha, D.K.; Baier, M. Natural variation of cold deacclimation correlates with variation of cold-acclimation of the plastid antioxidant system in Arabidopsis thaliana accessions. Front. Plant Sci. 2016, 7, 305. [Google Scholar] [CrossRef] [Green Version]
- Kolupaev, Y.E.; Ryabchun, N.I.; Vayner, A.A.; Yastreb, T.O.; Oboznyi, A.I. Antioxidant enzyme activity and osmolyte content in winter cereal seedlings under hardening and cryostress. Russ. J. Plant Physiol. 2015, 62, 499–506. [Google Scholar] [CrossRef]
- Turk, H.; Erdal, S.; Genisel, M.; Atici, O.; Demir, Y.; Yanmis, D. The regulatory effect of melatonin on physiological, biochemical and molecular parameters in cold-stressed wheat seedlings. Plant Growth Regul. 2014, 74, 139–152. [Google Scholar] [CrossRef]
- Lee, S.H.; Ahsan, N.; Lee, K.W.; Kim, D.H.; Lee, D.G.; Kwak, S.S.; Kwon, S.Y.; Kim, T.H.; Lee, B.H. Simultaneous overexpression of both CuZn superoxide dismutase and ascorbate peroxidase in transgenic tall fescue plants confers increased tolerance to a wide range of abiotic stresses. J. Plant Physiol. 2007, 164, 1626–1638. [Google Scholar] [CrossRef]
- Duan, M.; Feng, H.L.; Wang, L.Y.; Li, D.; Meng, Q.W. Overexpression of thylakoidal ascorbate peroxidase shows enhanced resistance to chilling stress in tomato. J. Plant Physiol. 2012, 169, 867–877. [Google Scholar] [CrossRef]
- Halliwell, B.; Gutteridge, J.M.C. Free Radicals in Biology and Medicine; Oxford University Press: New York, NY, USA, 2015. [Google Scholar]
- Chávez, M.D.; Lakshmanan, N.; Kavdia, M. Impact of Superoxide Dismutase on Nitric Oxide and Peroxynitrite Levels in the Microcirculation a Computational Model. In Proceedings of the IEEE Engineering in Medicine and Biology Society, Lyon, France, 22–26 August 2007; pp. 1022–1026. [Google Scholar]
- Selles, B.; Hugo, M.; Trujillo, M.; Srivastava, V.; Wingsle, G.; Jacquot, J.P.; Radi, R.; Rouhier, N. Hydroperoxide and peroxynitrite reductase activity of poplar thioredoxin-dependent glutathione peroxidase 5: Kinetics, catalytic mechanism and oxidative inactivation. Biochem. J. 2012, 442, 369–380. [Google Scholar] [CrossRef] [PubMed] [Green Version]
- Guy, C.L.; Niemi, K.J.; Brambl, R. Altered gene expression during cold acclimation of spinach. Proc. Natl. Acad. Sci. USA 1985, 82, 3673–3677. [Google Scholar] [CrossRef] [PubMed] [Green Version]
- Thomashow, M.F.; Gilmour, S.J.; Stockinger, E.J.; Jaglo-Ottosen, K.R.; Zarka, D.G. Role of the Arabidopsis CBF transcriptional activators in cold acclimation. Physiol. Plant. 2001, 112, 171–175. [Google Scholar] [CrossRef]
- Hughes, M.A.; Dunn, M.A. The molecular biology of plant acclimation to low temperature. J. Exp. Bot. 1996, 47, 291–305. [Google Scholar] [CrossRef]
- Stanca, A.M.; Crosatti, C.; Grossi, M.; Lacerenza, N.G.; Rizza, F.; Cattivelli, L. Molecular adaptation of barley to cold and drought conditions. Euphytica 1996, 92, 215–219. [Google Scholar] [CrossRef]
- Dal Bosco, C.; Busconi, M.; Govoni, C.; Baldi, P.; Michele Stanca, A.; Crosatti, C.; Bassi, R.; Cattivelli, L. Cor Gene Expression in Barley Mutants Affected in Chloroplast Development and Photosynthetic Electron Transport. Plant Physiol. 2003, 131, 793–802. [Google Scholar] [CrossRef] [Green Version]
- Rapacz, M.; Gąsior, D.; Kościelniak, J.; Kosmala, A.; Zwierzykowski, Z.; Humphreys, M.W. The role of the photosynthetic apparatus in cold acclimation of Lolium multiflorum. Characteristics of novel genotypes low-sensitive to PSII over-reduction. Acta Physiol. Plant 2007, 29, 309–316. [Google Scholar] [CrossRef]
- Ensminger, I.; Busch, F.; Hüner, N.P.A. Photostasis and cold acclimation: Sensing low temperature through photosynthesis. Physiol. Plant 2006, 126, 28–44. [Google Scholar] [CrossRef]
- Foyer, C.H.; Noctor, G. Redox Regulation in Photosynthetic Organisms: Signaling, Acclimation, and Practical Implications. Antioxid. Redox Signal. 2009, 11, 861–905. [Google Scholar] [CrossRef]
- Crosatti, C.; De Laureto, P.P.; Bassi, R.; Cattivelli, L. The interaction between cold and light controls the expression of the cold-regulated barley gene cor14b and the accumulation of the corresponding protein. Plant Physiol. 1999, 119, 671–680. [Google Scholar] [CrossRef] [Green Version]
- Larsen, A. Freezing Tolerance in Grasses. Methods for Testing in Controlled Environments; Department of Farm Crops Report No. 195 Scientific Reports; Agricultural University of Norway: Ås Municipality, Norway, 1978. [Google Scholar]
- Rapacz, M. Frost resistance and cold acclimation abilities of spring-type oilseed rape. Plant Sci. 1999, 147, 55–64. [Google Scholar] [CrossRef]
- Heath, R.L.; Packer, L. Photoperoxidation in isolated chloroplasts: I. Kinetics and Stoichiometry of Fatty Acid Peroxidation. Arch. Biochem. Biophys. 1968, 125, 189–198. [Google Scholar] [CrossRef]
- Srivastava, A.; Greppin, H.; Strasser, R.J. The steady state chlorophyll a fluorescence exhibits in vivo an optimum as a function of light intensity which reflects the physiological state of the plant. Plant Cell Physiol. 1995, 36, 839–848. [Google Scholar] [CrossRef] [Green Version]
- Strasser, R.J.; Srivastava, A.; Tsimilli-Michael, M. The fluorescence transiet as a tool to characterize and screen fotosynthetic samples. In Probing Photosynthesis: Mechanism, Regulation and Adaptation; Yunus, M., Pathre, U., Mohanty, P., Eds.; Taylor and Francis: London, UK, 2000; pp. 443–480. [Google Scholar]
- Pawłowicz, I.; Kosmala, A.; Rapacz, M. Expression pattern of the psbO gene and its involvement in acclimation of the photosynthetic apparatus during abiotic stresses in Festuca arundinacea and F. pratensis. Acta Physiol. Plant 2012, 34, 1915–1924. [Google Scholar] [CrossRef] [Green Version]
- Kosmala, A.; Perlikowski, D.; Pawłowicz, I.; Rapacz, M. Changes in the chloroplast proteome following water deficit and subsequent watering in a high-and a low-drought-tolerant genotype of Festuca arundinacea. J. Exp. Bot. 2012, 63, 6161–6172. [Google Scholar] [CrossRef] [Green Version]
- Bradford, M.M. A rapid and sensitive method for the quantitation of microgram quantities of protein utilizing the principle of protein-dye binding. Anal. Biochem. 1976, 72, 248–254. [Google Scholar] [CrossRef]
- Becana, M.; Aparicio-Tejo, P.; Irigoyen, J.J.; Sanchez-Diaz, M. Some Enzymes of Hydrogen Peroxide Metabolism in Leaves and Root Nodules of Medicago sativa. Plant Physiol. 1986, 82, 1169–1171. [Google Scholar] [CrossRef] [Green Version]
- Doke, N. Involvement of superoxide anion generation in the hypersensitive response of potato tuber tissues to infection with an incompatible race of Phytophthora infestans and to the hyphal wall components. Physiol. Plant Pathol. 1983, 23, 345–357. [Google Scholar] [CrossRef]
- Nakano, Y.; Asada, K. Hydrogen Peroxide is Scavenged by Ascorbate-specific Peroxidase in Spinach Chloroplasts. Plant Cell Physiol. 1981, 22, 867–880. [Google Scholar] [CrossRef]
- Arasimowicz-Jelonek, M.; Floryszak-Wieczorek, J.; Kosmala, A. Are nitric oxide donors a valuable tool to study the functional role of nitric oxide in plant metabolism? Plant Biol. 2011, 13, 747–756. [Google Scholar] [CrossRef]
- Dhindsa, R.S.; Plumb-dhindsa, P.; Thorpe, T.A. Leaf senescence: Correlated with increased levels of membrane permeability and lipid peroxidation, and decreased levels of superoxide dismutase and catalase. J. Exp. Bot. 1981, 32, 93–101. [Google Scholar] [CrossRef]
- Beauchamp, C.; Fridovich, I. Superoxide dismutase: Improved assays and an assay applicable to acrylamide gels. Anal. Biochem. 1971, 44, 276–287. [Google Scholar] [CrossRef]
- Czaban, A.; Sharma, S.; Byrne, S.L.; Spannagl, M.; Mayer, K.F.X.; Asp, T. Comparative transcriptome analysis within the Lolium/Festuca species complex reveals high sequence conservation. BMC Genom. 2015, 16, 249. [Google Scholar] [CrossRef] [PubMed] [Green Version]


| Gene | Primer Forward/Reverse | TaqMan Probe |
|---|---|---|
| Actin | GTCGAGGGCAACATATGCAA CCAGTGCTGAGCGGGAAT | TTCTCCTTGATGTCACGGAC |
| pFBA | GAGACGTTCTACTACATG GAGGAGCTTGAGAGTGTA | TGTTCCTGTCCTTGCACTCGG |
| pPGK | CCTTGGTTGAGGAAGATAA CAGCAATGACAACATCAG | CTGGCAACAACTCTCCTGGC |
| Gene | Primer Forward/Reverse | TaqMan Probe |
|---|---|---|
| Actin | GTCGAGGGCAACATATGCAA CCAGTGCTGAGCGGGAAT | TTCTCCTTGATGTCACGGAC |
| GR | GGGGAGTACGACTACGACCT TCGTAAGTCCACCCAAAGCC | GGCGGCGTCAGGGCCTCGCGCTT |
| GPX | TCACTCGGCGGCCTGGAGAA TTCACAGTGCGGGCTTACGA | CTACGCCACCGCCGCCACGGAGAA |
| APX | CTCGTATCGCAGGAGCTCG TTGGGCCACTCGCTAATGTT | CGGCTGCGGCTGGAGATGCGACGGC |
| Fe-SOD | TCTATCTCGGCGGTTCTCCA CCGTTGTTGTAGGCCTCCTT | GCTCGACACCAGCCCCTTCTACGGCCA |
| Cu/Zn-SOD | CCAGAGCATCCTCTTCGCC ATTGATGGAGGTGGAAGCCG | TCGCTCCGCCTCGTCTCCGCCCCC |
| Mn-SOD | TTGACGCCGCTGTCTCTAAGG TTTATCCAACGCCAGCCACA | GCTTCCGCCGTCGTCCAACTCCAGGGC |
| CAT | GTTCACCTTCCTCTTCGACG AAGTCGAACCTGTCCTCGTG | ACTACCGCCACATGGATGGCTCCG |
© 2020 by the authors. Licensee MDPI, Basel, Switzerland. This article is an open access article distributed under the terms and conditions of the Creative Commons Attribution (CC BY) license (http://creativecommons.org/licenses/by/4.0/).
Share and Cite
Augustyniak, A.; Pawłowicz, I.; Lechowicz, K.; Izbiańska-Jankowska, K.; Arasimowicz-Jelonek, M.; Rapacz, M.; Perlikowski, D.; Kosmala, A. Freezing Tolerance of Lolium multiflorum/Festuca arundinacea Introgression Forms is Associated with the High Activity of Antioxidant System and Adjustment of Photosynthetic Activity under Cold Acclimation. Int. J. Mol. Sci. 2020, 21, 5899. https://doi.org/10.3390/ijms21165899
Augustyniak A, Pawłowicz I, Lechowicz K, Izbiańska-Jankowska K, Arasimowicz-Jelonek M, Rapacz M, Perlikowski D, Kosmala A. Freezing Tolerance of Lolium multiflorum/Festuca arundinacea Introgression Forms is Associated with the High Activity of Antioxidant System and Adjustment of Photosynthetic Activity under Cold Acclimation. International Journal of Molecular Sciences. 2020; 21(16):5899. https://doi.org/10.3390/ijms21165899
Chicago/Turabian StyleAugustyniak, Adam, Izabela Pawłowicz, Katarzyna Lechowicz, Karolina Izbiańska-Jankowska, Magdalena Arasimowicz-Jelonek, Marcin Rapacz, Dawid Perlikowski, and Arkadiusz Kosmala. 2020. "Freezing Tolerance of Lolium multiflorum/Festuca arundinacea Introgression Forms is Associated with the High Activity of Antioxidant System and Adjustment of Photosynthetic Activity under Cold Acclimation" International Journal of Molecular Sciences 21, no. 16: 5899. https://doi.org/10.3390/ijms21165899