Article

Absorption and Emission Spectroscopic Investigation of the Thermal Dynamics of the Archaerhodopsin 3 Based Fluorescent Voltage Sensor Archon2

1
Fakultät für Physik, Universität Regensburg, Universitätsstraße 31, D-93053 Regensburg, Germany
2
Experimentelle Biophysik, Institut für Biologie, Humboldt Universität zu Berlin, Invalidenstraße 42, D-10115 Berlin, Germany
*
Author to whom correspondence should be addressed.
Int. J. Mol. Sci. 2020, 21(18), 6576; https://doi.org/10.3390/ijms21186576
Submission received: 6 August 2020 / Revised: 28 August 2020 / Accepted: 1 September 2020 / Published: 8 September 2020
(This article belongs to the Section Molecular Biophysics)

Abstract

:
Archon2 is a fluorescent voltage sensor derived from Archaerhodopsin 3 (Arch) of Halorubrum sodomense using robotic multidimensional directed evolution approach. Here we report absorption and emission spectroscopic studies of Archon2 in Tris buffer at pH 8. Absorption cross-section spectra, fluorescence quantum distributions, fluorescence quantum yields, and fluorescence excitation spectra were determined. The thermal stability of Archon2 was studied by long-time attenuation coefficient measurements at room temperature (21 ± 1 °C) and at refrigerator temperature (3 ± 1 °C). The apparent melting temperature was determined by stepwise sample heating up and cooling down (obtained apparent melting temperature: 63 ± 3 °C). In the protein melting process protonated retinal Schiff base (PRSB) with absorption maximum at 586 nm converted to de-protonated retinal Schiff base (RSB) with absorption maximum at 380 nm. Storage of Archon2 at room temperature and refrigerator temperature caused absorption coefficient decrease because of partial protein clustering to aggregates at condensation nuclei and sedimentation. At room temperature an onset of light scattering was observed after two days because of the beginning of protein unfolding. During the period of observation (18 days at 21 °C, 22 days at 3 °C) no change of retinal isomer composition was observed indicating a high potential energy barrier of S0 ground-state isomerization.

1. Introduction

Changes in the electrical potential across the plasma membrane of neurons are important for intercellular and intracellular signal transmission [1]. Recordings of membrane potentials from cells, in particular neurons, have been developed with various optical spectroscopic methods. For this purpose it is common to use either fluorescent voltage sensitive dyes [2,3], genetically encoded calcium indicators (GECIs) [4,5], or genetically encoded voltage indicators (GEVIs) [6,7]. GEVIs can be comprised of (i) voltage sensitive domains (VSD) consisting of four trans-membrane helices fused to fluorescent proteins [8,9,10,11,12,13], (ii) microbial rhodopsins consisting of 7 trans-membrane α-helices with covalently bound retinal isomers [6,7,10,11,12,14,15,16] used as stand-alone units [14,17], or fused to fluorescent proteins [18,19,20], and (iii) chemogenetic sensors [21,22,23,24,25,26,27].
In rhodopsin-based GEVIs a change in membrane voltage causes a change in fluorescence intensity which is directly used as the voltage indicator [17,28,29,30,31,32]. In the case of combined rhodopsin–fluorescent protein units (named electrochromic FRET GEVIs) the change of the rhodopsin absorption spectrum changes the efficiency of the Förster-type resonant energy transfer (FRET [33,34]) and thereby the efficiency of the fluorescent protein emission [18,19,32,35,36,37] (fluorescent protein acts as energy transfer donor and the rhodopsin acts as energy transfer acceptor [34], fluorescence of fluorescent protein is quenched by coulombic energy transfer to the rhodopsin retinal).
Generally, natural microbial rhodopsins exhibit low fluorescence quantum yield [38,39,40,41,42]. Archaerhodopsin 3 (Arch) from Halorubrum sodomense exhibits measurable voltage dependence of fluorescence efficiency and was studied as voltage indicator [17,28,29]. For improvement of fluorescence efficiency and voltage sensitivity, variants of Arch have been synthesized by gene technical methods [28,29,30,31,32,35,37,43,44,45,46]. Arch and Arch D95N were used for optical recording of action potentials in cultured rat hippocampal neurons [28] and in HEK-293 cells [29]. Arch D95N-D106E and Arch D95Q-D106E were used in rat hippocampal cells [35]. Archer1 (=Arch D95E-T99C) and Archer2 (=Arch D95E-T99C-A225M) were used in vivo as voltage sensors of Caenorhabditis elegans neurons [30]. QuasAr1 (=Arch P60S-T80S-D95H-D106H-F161V) and QuasAr2 (=QuasAr1 H95Q) were expressed in cultured rat neurons for all-optical electrophysiology studies [17]. The absorption and emission spectroscopic behavior and thermal stability of QuasAr1 was investigated in [44]. Its photocycle dynamics was studied in [45]. QuasAr3 (=QuasAr2 K171R) and paQuasAr3 (=QuasAr3 V59A) were applied to in vivo recording of supra- and subthreshold voltage dynamics from multiple neurons in mouse hippocampus [31]. QuasAr2 was fused to the fluorescent protein mOrange2 for improved recording of neuronal action potentials in cultured rat hippocampal neurons [18]. Archon1 (=Arch T20S-G41A-V44E-P60S-T80P-D86N-D95Q-D106H-A136T-F161V-T183I-L197I-G241Q) and Archon2 (=Arch T56P-P60S-T80P-D95H-T99S-T116I-F161V-T183I-L197I-A225C) were specially engineered toward optimal fluorescent voltage reporters in a robotic multidimensional-directed evolution approach [32]. They were applied to image spiking and millivolt-scale subthreshold and synaptic activity in acute mouse brain slices and in larval zebrafish in vivo [32]. Codon-optimized Archon1 (wArchon1) fused to the fluorescent protein EGFP in AVA interneurons were used to measure postsynaptic responses downstream of optogenetically controlled neurons in Caenorhabditis elegans [32]. The molecule Archon1-KGC-EGFP-KV2.1-motif-ER2, called SomArchon [37], enabled the routine population analysis of around 13 neurons at once in multiple brain regions (cortex, hippocampus, and striatum) of head-fixed, awake behaving mice [37].
Here a detailed study is presented of the absorption and emission spectroscopic properties and the thermal dynamics of Archon2 in pH 8 Tris buffer. Archon2 was selected because it exhibited the highest fluorescence signal in cultured neurons compared to other rhodopsin-based GEVIs [32]. The absorption coefficient spectrum, absorption cross-section spectrum, excitation wavelength-dependent fluorescence emission quantum distributions and quantum yields, and emission wavelength-dependent fluorescence excitation spectra of fresh prepared Archon2 at room temperature were determined. The thermal stability of Archon2 was studied by long-time spectroscopic studies at room temperature (21 ± 1 °C) and refrigerator temperature of 3 ± 1 °C. The apparent melting temperature of Archon2 was determined by stepwise sample heating up and subsequent cooling down. The thereby occurring deprotonation of protonated retinal Schiff base (PRSB) and protein denaturing are discussed. The presented results deliver basic information necessary for quantitative analysis of photo-excitation and photo-cycle studies of Archon2.
The amino acid sequence of Archon2 is shown in Figure S1 of the Supplementary Materials (Section S1). Some structural formulae of retinal cofactors of rhodopsins are taken from [42] and shown in Figure S2 of the Supplementary Materials (Section S2).

2. Results

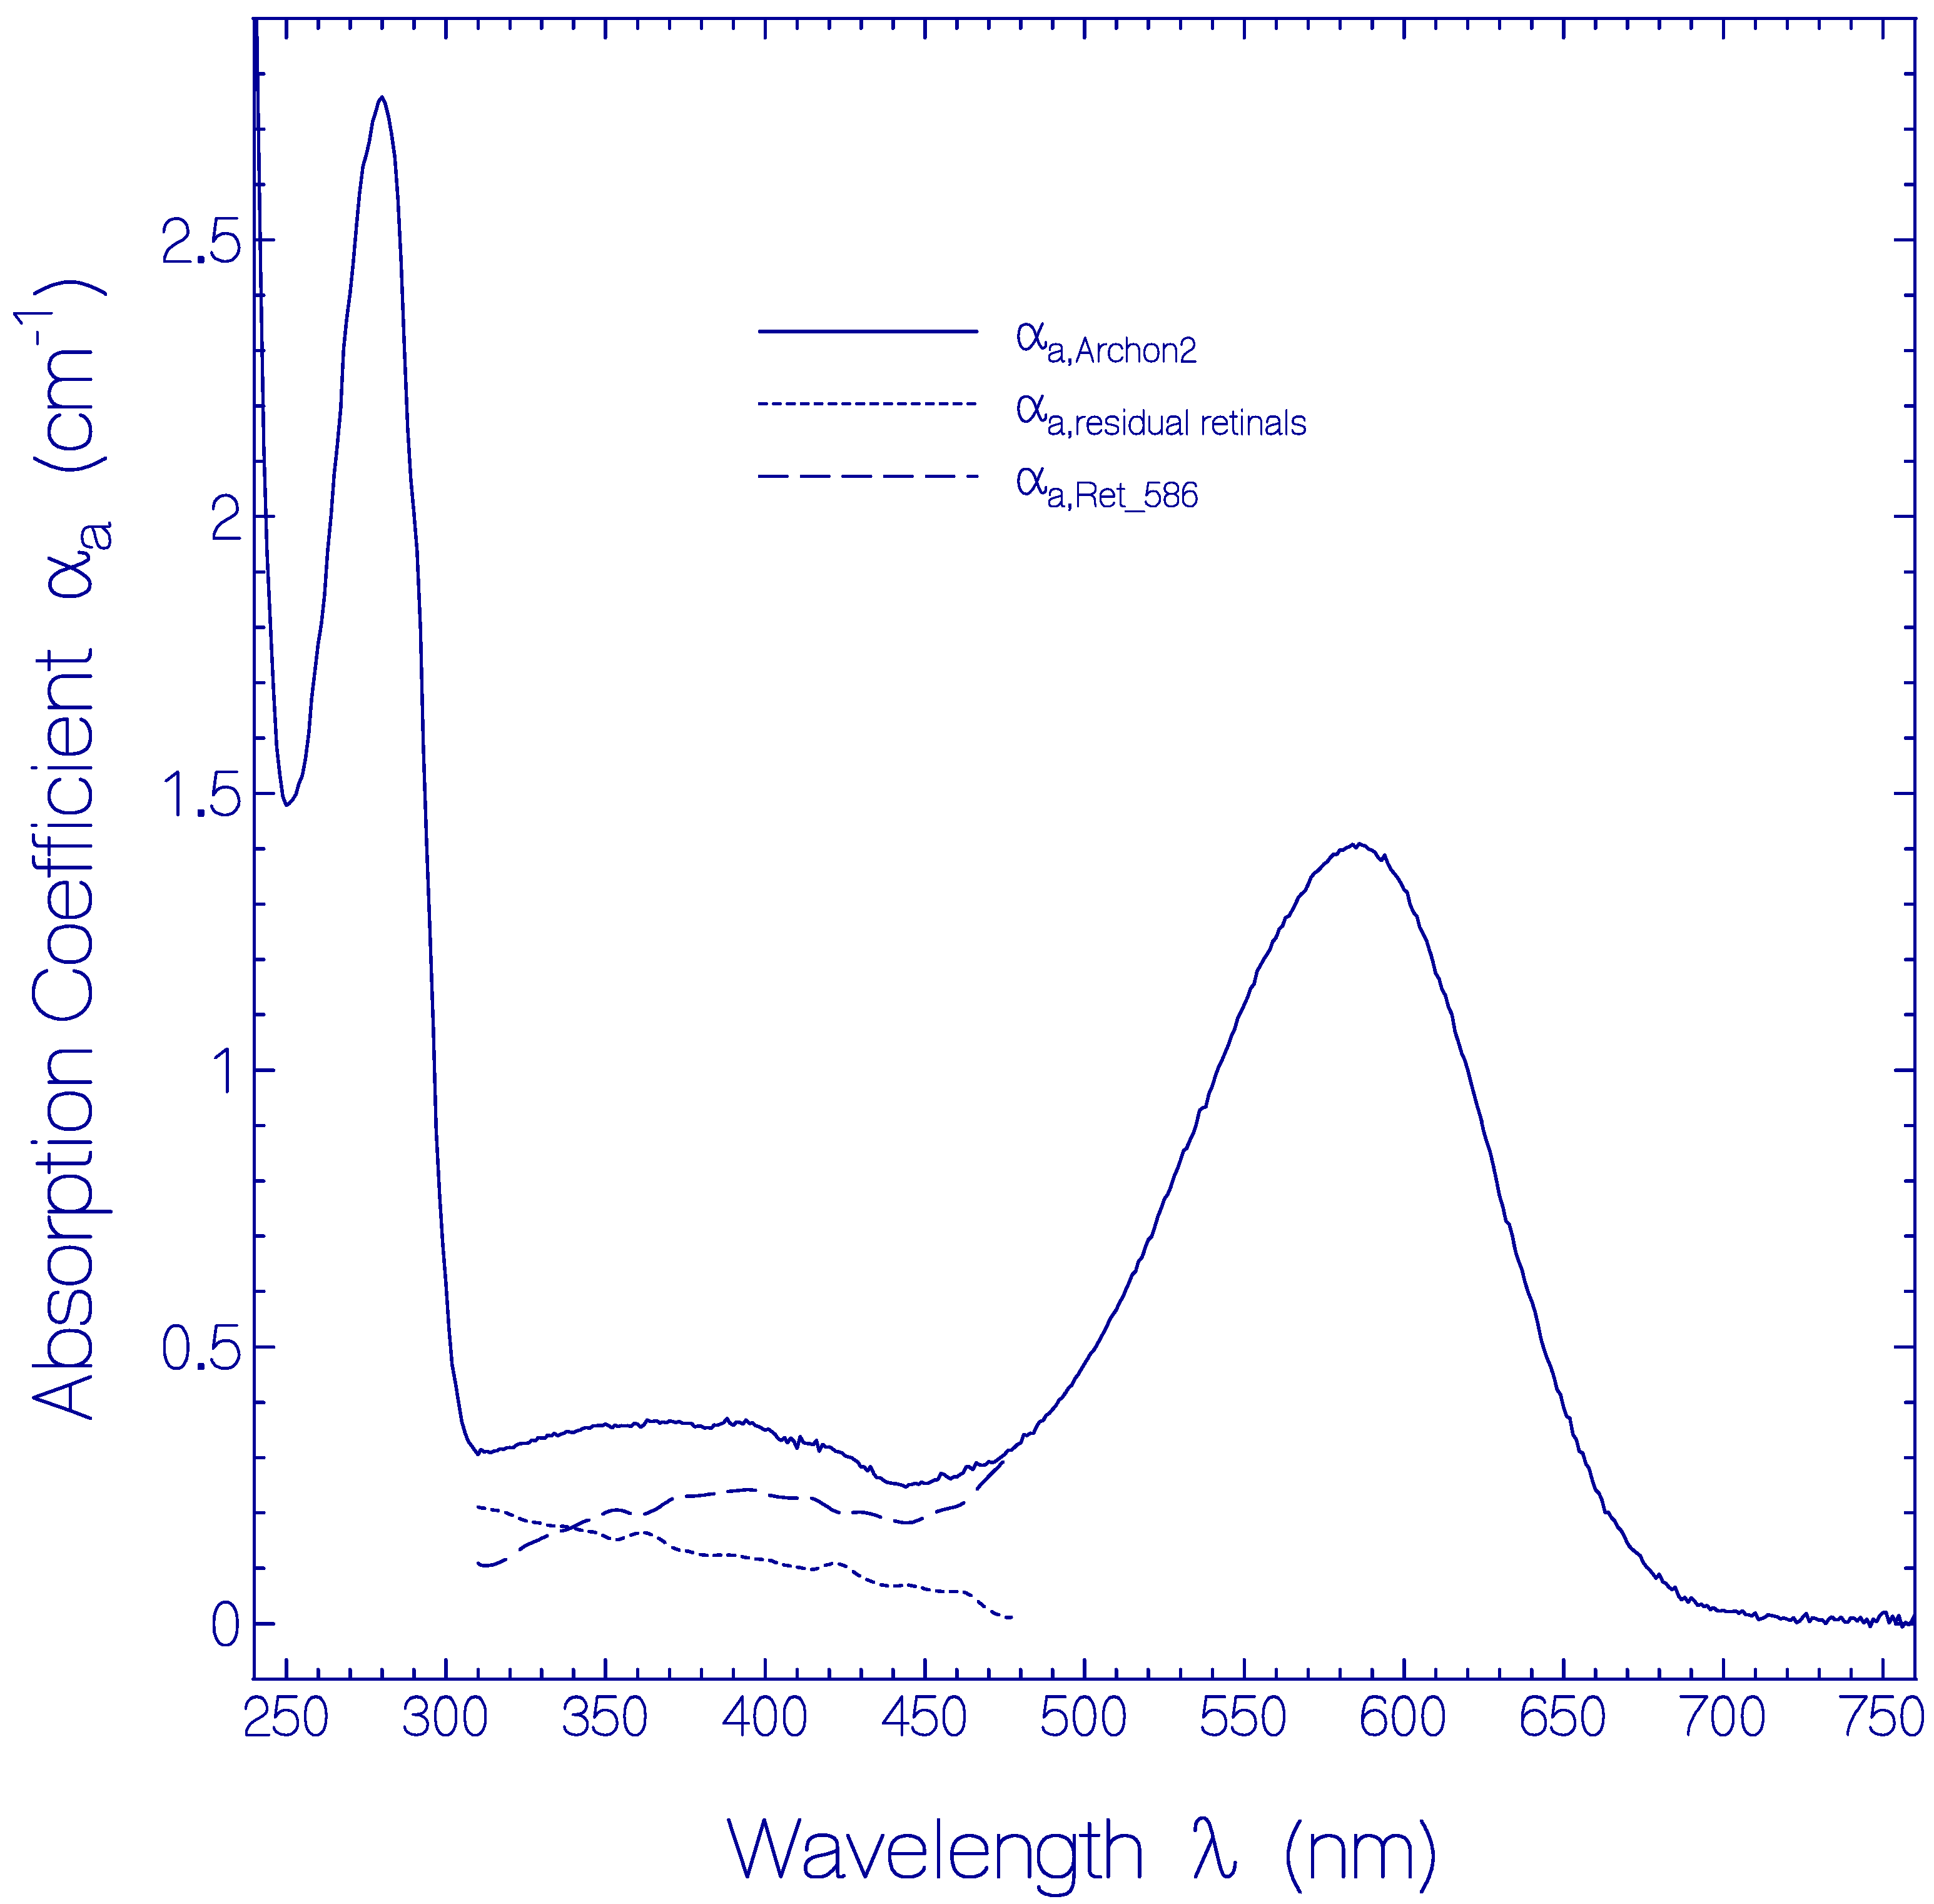
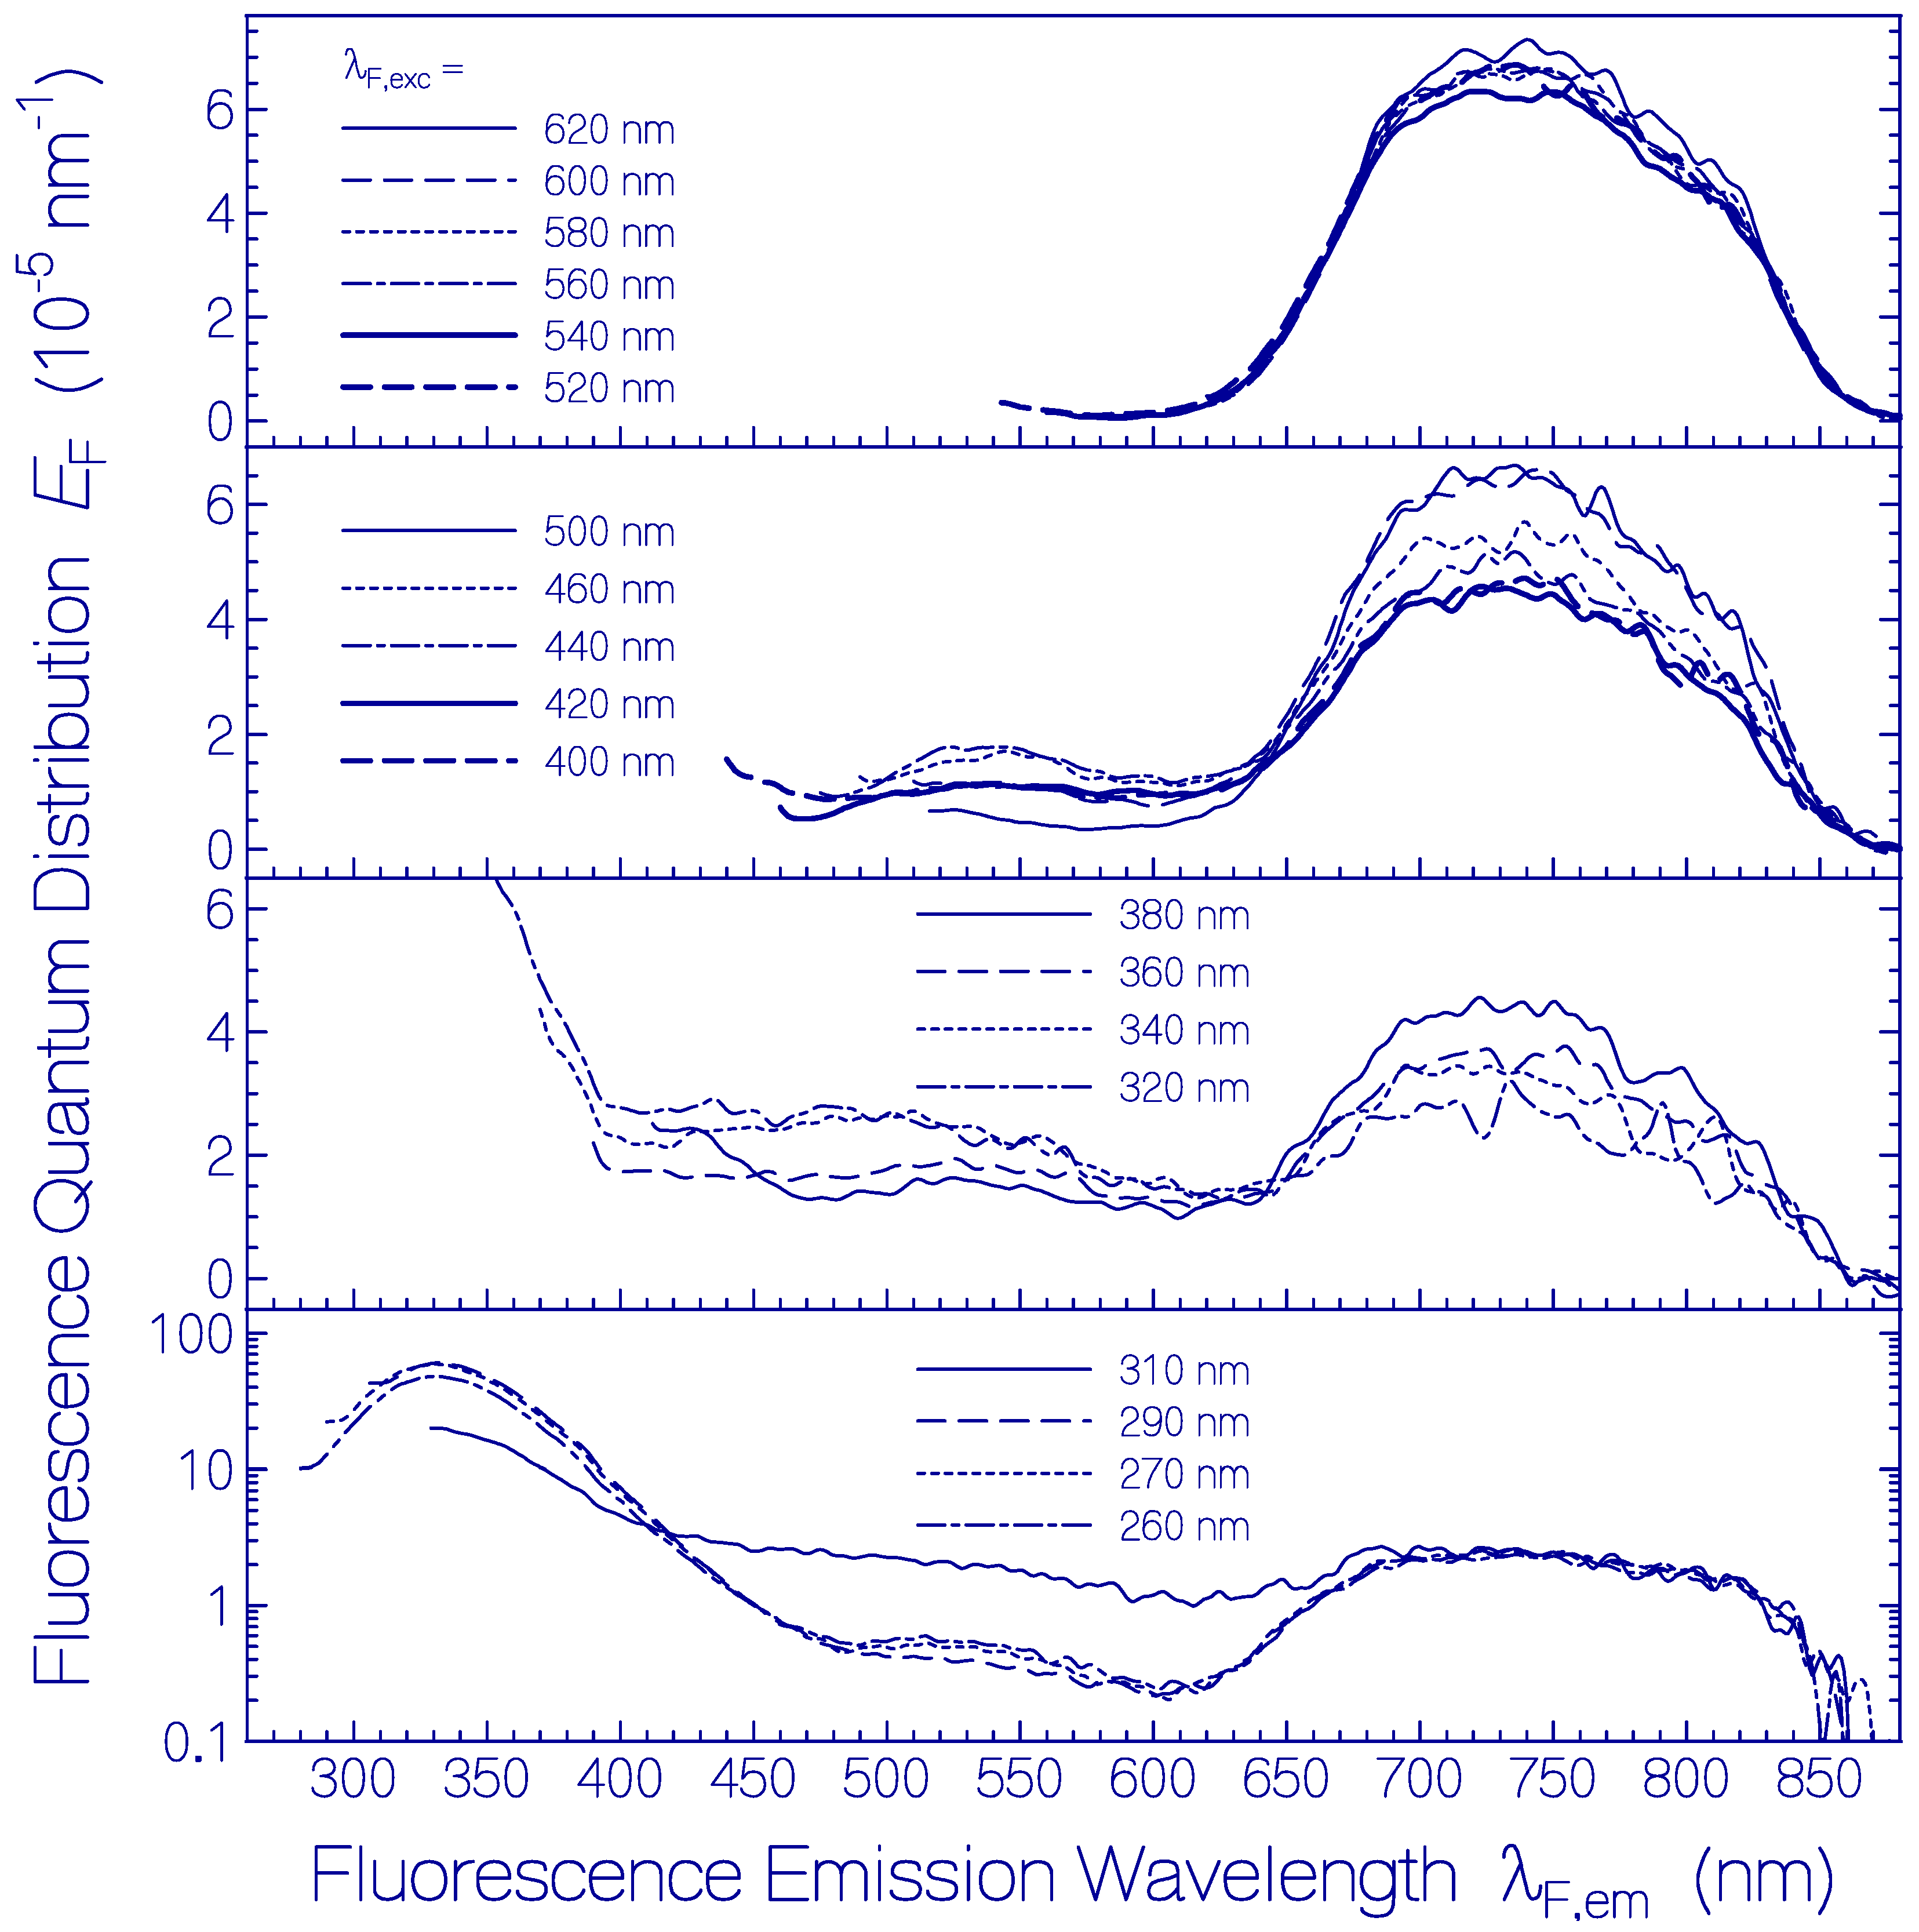
2.1. Absorption and Emission Behavior of Fresh Thawed Archon2 Samples

The absorption coefficient spectrum αa(λ) of a fresh thawed and centrifuged Archon2 sample is shown by the solid curve in Figure 1. The main absorption band with maximum at wavelength λ = 586 nm is attributed to the S0–S1 transition of a protonated retinal Schiff base (PRSB) isomer named Ret_586. The absorption in the range from 310 nm to 480 nm is thought to be comprised of singlet S0–Sn (n ≥ 2) transitions of Ret_586 (dashed curve αa,Ret_586(λ)) and singlet ground-state–excited-state transitions of residual retinal components (dotted curve αa,residual retinals(λ) = αa,Archon2(λ) − αa,Ret_586(λ)). The short-wavelength absorption band peaking at λ = 280 nm is determined by apoprotein absorption (Trp, Tyr, Phe) and some retinal contribution. The αa,Ret_586(λ)) absorption curve in the wavelength region from 310 nm to 480 nm was determined from fluorescence excitation quantum distribution measurements presented in Figure S4 of the Supplementary Materials (Section S5).
The absorption cross-section spectrum of Ret_586, σa,Ret_586(λ) = αa,Ret_586(λ)/NRet_586 where NRet_586 is the number density of Ret_586 chromophores in Archon2, is determined in Section S3 of the Supplementary Materials (Figure S3).
Fluorescence emission quantum distributions EF(λ) of a fresh thawed Archon2 sample in pH 8 Tris buffer are shown in Figure 2 (the same sample was used as in Figure 1). Curves are displayed for various fluorescence excitation wavelengths λF,exc in the range from 260 nm to 620 nm. For λF,exc > 520 nm only S1–S0 emission from Ret_586 is observed. The wavelength position of peak fluorescence emission is at λF,max ≈ 735 nm. The spectral half-width of this emission is δ ν ˜ F , Ret _ 586 ≈ 2830 cm−1. The Stokes shift is δ ν ˜ S t o k e s = λ a , max 1 λ F , max 1 ≈ 3460 cm−1. The strong Stokes shift and broad spectral width of Ret_586 indicate fluorescence emission along the S1 excited state photo-isomerization path.
Fluorescence emission in the wavelength range from λF,em = 400 nm to 600 nm is attributed to S1–S0 emission from the residual retinal isomers present in Archon2 (see dotted curve in Figure 1). The fluorescence emission band around λF,max ≈ 540 nm may be mainly due to a protonated retinal Schiff base isomer with S0–S1 absorption maximum around 470 nm. The broad fluorescence emission band in the wavelength range from λF,em ≈ 400 nm to 500 nm is attributed to deprotonated retinal Schiff base isomers in Archon2. The fluorescence emission in the range from 300 nm to 400 nm with maximum strength at λF,em ≈ 330 nm is due to apoprotein emission dominated by S1–S0 transition of Trp with absorption maximum at λ ≈ 280 nm. For all excitation wavelengths, the Ret_586 fluorescence emission band around λF,max ≈ 735 nm is present because the Ret_586 absorption extends over the whole applied fluorescence excitation wavelength region due to S0–Sn transitions (n ≥ 1) with fast Sn–S1 nonradiative relaxation for n ≥ 2 and S1–S0 radiative emission. In the wavelength region of apoprotein absorption additionally Förster-type energy transfer [33,34] from Tyr and Trp to the retinal isomers contributes to the fluorescence emissions.
The total fluorescence quantum yield ϕF is obtained by integration of the fluorescence quantum distribution EF(λ) over the whole fluorescence emission wavelength region (em), i.e.,
ϕ F = e m E F ( λ ) d λ
The dependence of ϕF of the fresh thawed Archon2 sample of Figure 1 and Figure 2 on the fluorescence excitation wavelength λF,exc is shown in Figure 3. In the fluorescence excitation wavelength region from λF,exc = 320 nm to 670 nm the total fluorescence quantum yield is rather constant with a value of ϕF = 0.0105 ± 0.0015. This finding indicates that the fluorescence quantum yield of Ret_586 and of the additionally present retinal isomers in Archon2 have approximately the same fluorescence quantum yield. In the range from λF,exc = 260 nm to 310 nm the total fluorescence quantum yield is dominated by the apoprotein Trp emission. At λF,exc = 280 nm a fluorescence quantum yield of ϕF = 0.043 ± 0.003 was determined. The fluorescence emission of photo-excited Tyr is quenched by Förster-type energy transfer [33,34] to Trp (this is shown in the supplementary material of [47]). The Trp fluorescence emission is reduced by Förster-type energy transfer from Trp to the retinal isomers in Archon2. The fluorescence quantum yield of Tyr in neutral water at 20 °C is ϕF = 0.14 [48] and that of Trp in neutral water at 20 °C is ϕF = 0.15 [49,50].
The molar fluorescence brightness [51] characterizes the combined absorption and emission strength of a fluorophore. It is defined by
B ( λ ) = ε a ( λ ) ϕ F
where εa(λ) is the molar decadic extinction coefficient at wavelength λ and ϕF is the fluorescence quantum yield. The molar decadic extinction coefficient εa is related to the molecule absorption cross-section σa by the relation
ε a ( λ ) = σ a ( λ ) N A ln ( 10 ) × 1000
where NA = 6.0221367 × 10²³ mol−1 is the Avogadro constant. The maximum molar fluorescence brightness of Ret_586 is calculated to be Ba,max = 586 nm) = 408 M−1cm−1 using σa(586 nm) = 1.485 × 10⁻¹⁶ cm2 (see Figure S3) which gives εa(586 nm) = 3.884 × 10⁴ M−1cm−1 (see Equation (3)), and ϕF = 0.0105.
In Section S4 of the Supplementary Materials the radiative lifetime τrad and the Strickler-Berg-based fluorescence lifetime τF,SB of Ret_586 are extracted from the S0–S1 absorption cross-section spectrum (Figure S3) and the fluorescence quantum yield (ϕFF,exc = 580 nm) of Figure 3). The obtained results are τrad(S1–S0, Ret_586) ≈ 10.1 ns and τF,SB(S1–S0, Ret_586) ≈ 106 ps.
Normalized fluorescence excitation quantum distributions E e x , λ F , det ( λ ) of the fresh thawed Archon2 sample of Figure 1 and Figure 2 for fluorescence detection wavelengths λF,det in the range from 720 nm to 300 nm are shown in Figure S4 of the Supplementary Materials (Section S5). They agree with the excitation wavelength-dependent fluorescence emission quantum distributions of the dominant retinal component Ret_586 and of the other present residual retinal isomers.

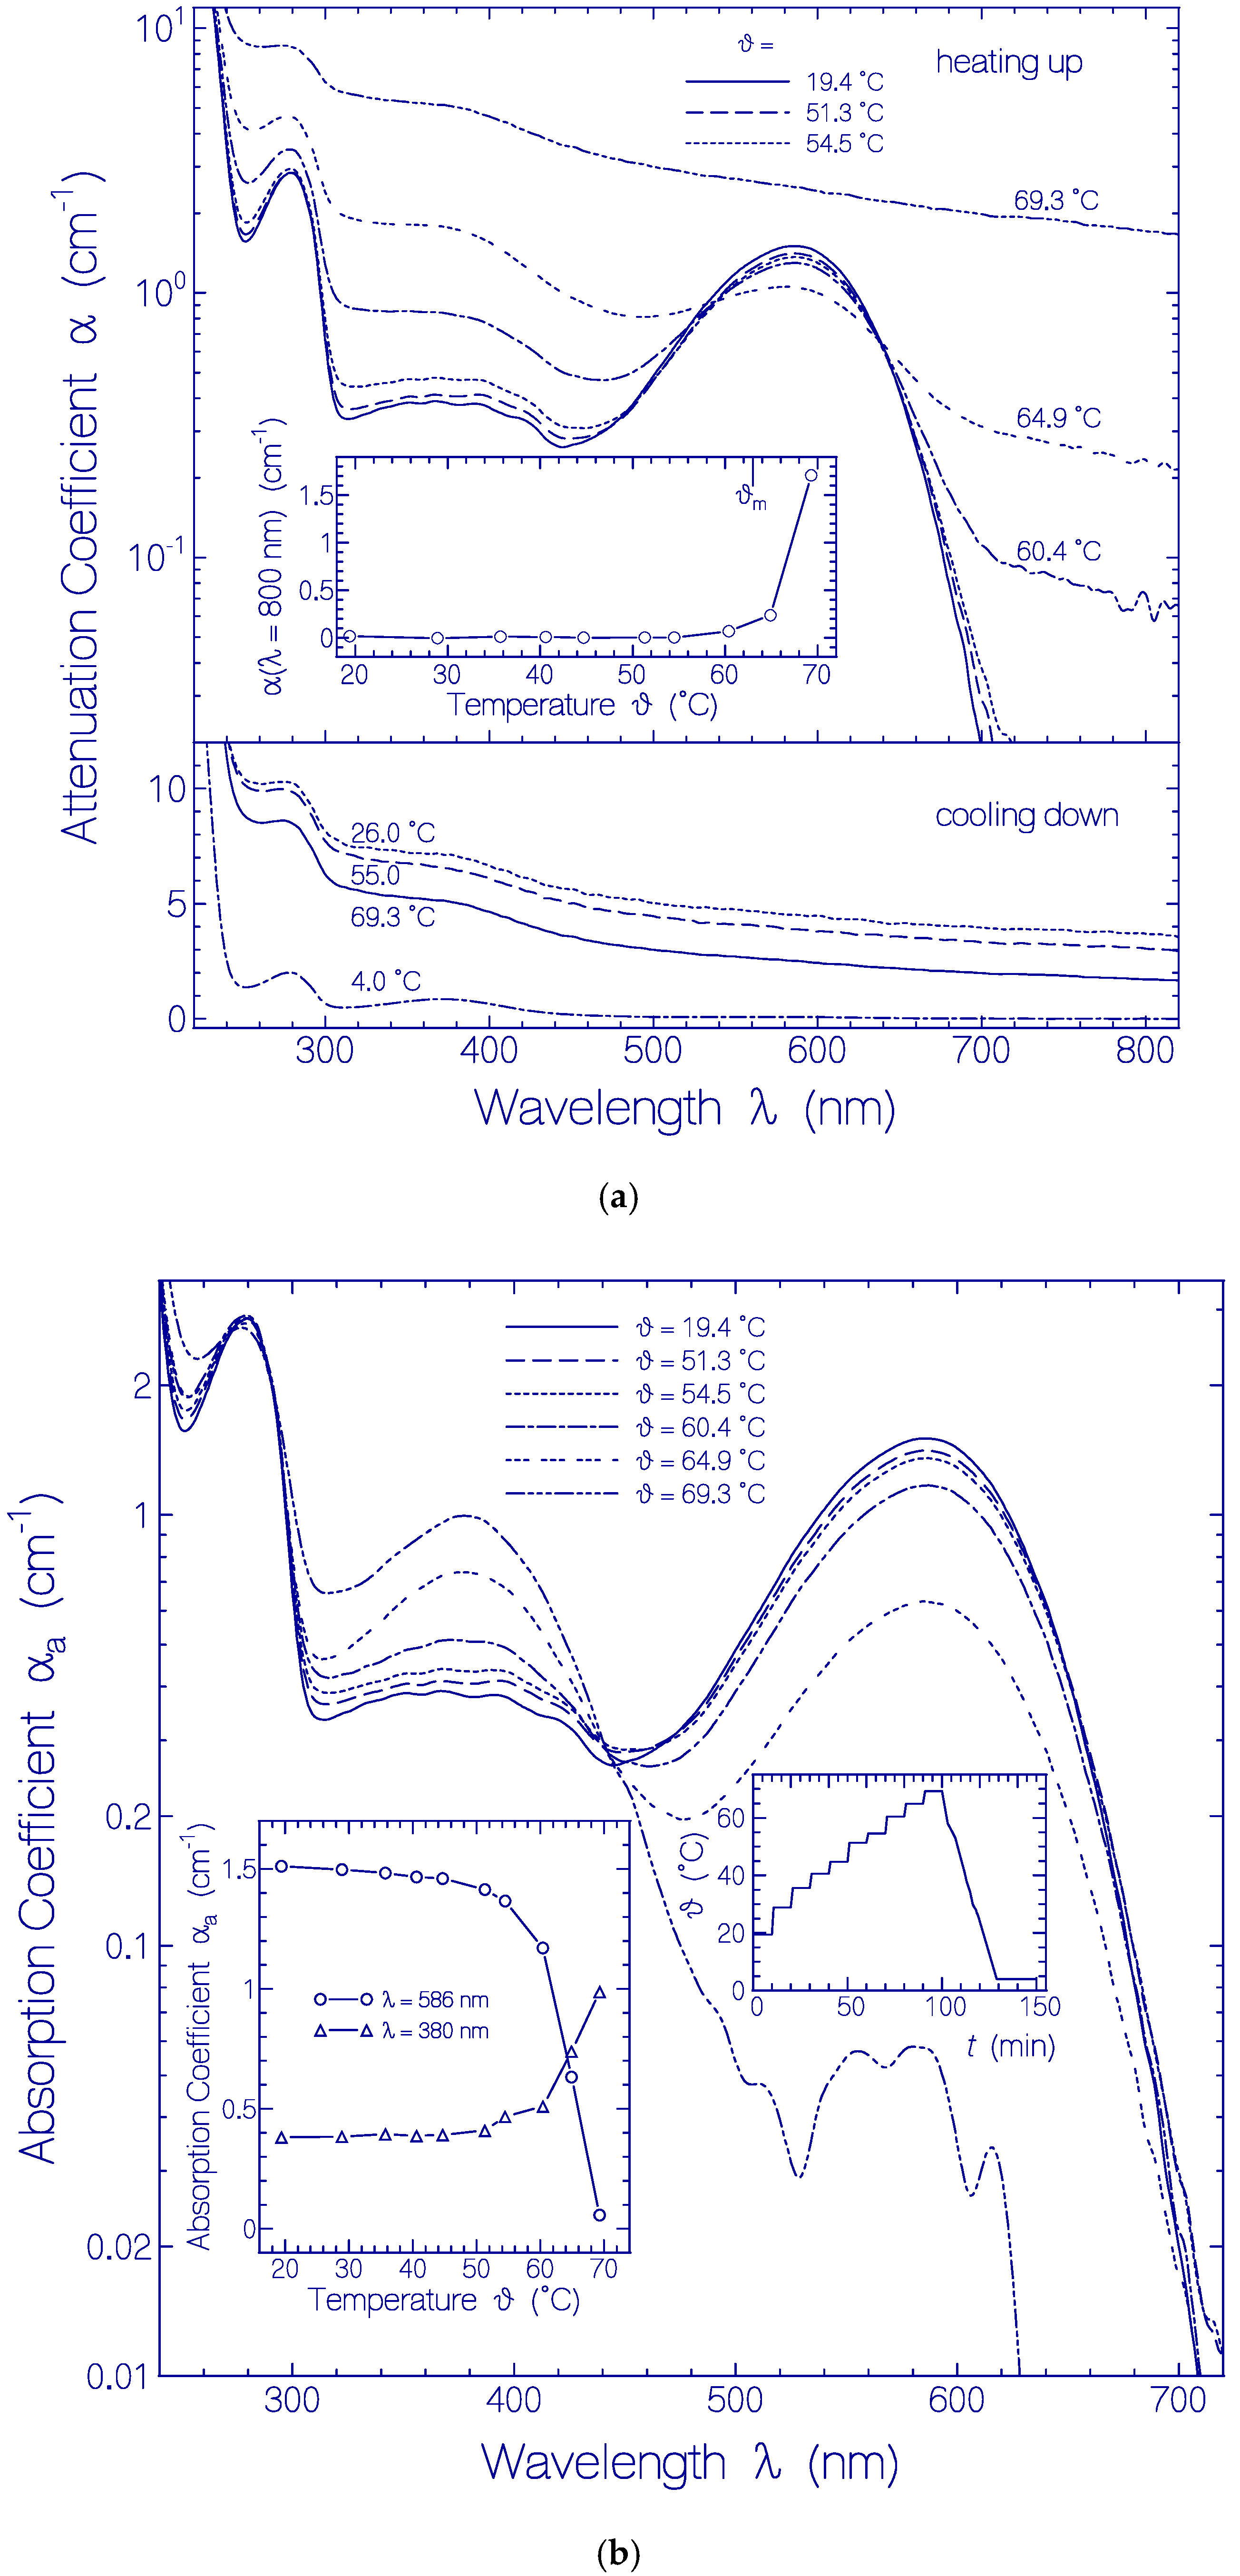
2.2. Heating-Cooling Cycle of a Fresh Thawed Archon2 Sample

A fresh thawed sample of Archon2 in pH 8 Tris buffer was stepwise heated and then cooled. Thereby attenuation coefficient spectra α(λ) were measured. The apparent Archon2 protein melting temperature ϑm was determined by the onset of a steep attenuation rise in the transparency region of Archon2 [52] due to coalescing of denatured unfolded proteins [53]. The apparent protein melting temperature is an indicator of the protein thermal stability (the higher ϑm the more thermally stable is the protein).
The temperature-dependent development of the attenuation coefficient spectra α(λ) of Archon2 is shown in Figure 4a. Up to 54.5 °C the attenuation spectra were nearly unchanged (see top part in Figure 4a). At 60.4 °C and 64.9 °C the attenuation spectrum around 586 nm (Ret_586 absorption) decreased and the attenuation spectrum around 380 nm (Ret_380) increased. In the Archon2 transparency region (λ > 700 nm) the light attenuation grew up because of increasing light scattering. At 69.3 °C the attenuation spectrum was strongly increased over the whole depicted wavelength region because of severe light scattering caused by Archon2 protein unfolding and clustering [53]. The temperature dependence of the light attenuation at 800 nm during the sample heating up is shown in the inset of the top part of Figure 4a. The apparent Archon2 protein melting temperature is defined by the onset of steeply rising light attenuation (light scattering). The determined value is ϑm = 63 ± 3 °C. The light scattering increased during heating up to 69.3 °C, and continued to increase during cooling down to 26 °C (see bottom part of Figure 4a). The final dash-dotted attenuation curve in the bottom part of Figure 4a was obtained after centrifugation of the sample for 30 min with 4400 rpm at 4 °C.
The temperature-dependent development of the absorption spectra αa(λ) of Archon2 is shown in Figure 4b. The curves were obtained from the attenuation curves shown in Figure 4a by subtracting their scattering contribution (see procedure described in Section 4.2). The PRSB Ret_586 band peaking at 586 nm decreased with rising temperature by deprotonation to RSB Ret_380 forming a rising absorption band around 380 nm. For ϑ = 69.3 °C Ret_586 is nearly fully converted to Ret_380 (absorption reduction at 586 nm by a factor of 30). Therefore the curve αa(λ, ϑ = 69.3 °C) in the wavelength range from 310 nm to 500 nm roughly represents the absorption coefficient spectrum of Ret_380. The absorption cross-section spectrum of Ret_380 is determined in Section S3 of the Supplementary Materials from an analysis of αa(λ, ϑ = 64.9 °C) (dashed curve in Figure S3).
The left inset in Figure 4b displays the temperature-dependent development of the absorption coefficients αa(ϑ) at λ = 586 nm (line-connected circles) and λ = 380 nm (line-connected triangles). The curves show an increasing conversion of Ret_586 to Ret_380 above ϑ = 50 °C. Below 50 °C the absorption at 380 nm is determined by the S0–Sn absorption of Ret_586 and the absorption of the present residual retinal isomers of the fresh thawed unheated Archon2 sample. The conversion of Ret_580 to Ret_380 starts already at about ϑ = 50 °C well below the apparent protein melting temperature of ϑm ≈ 63 °C.

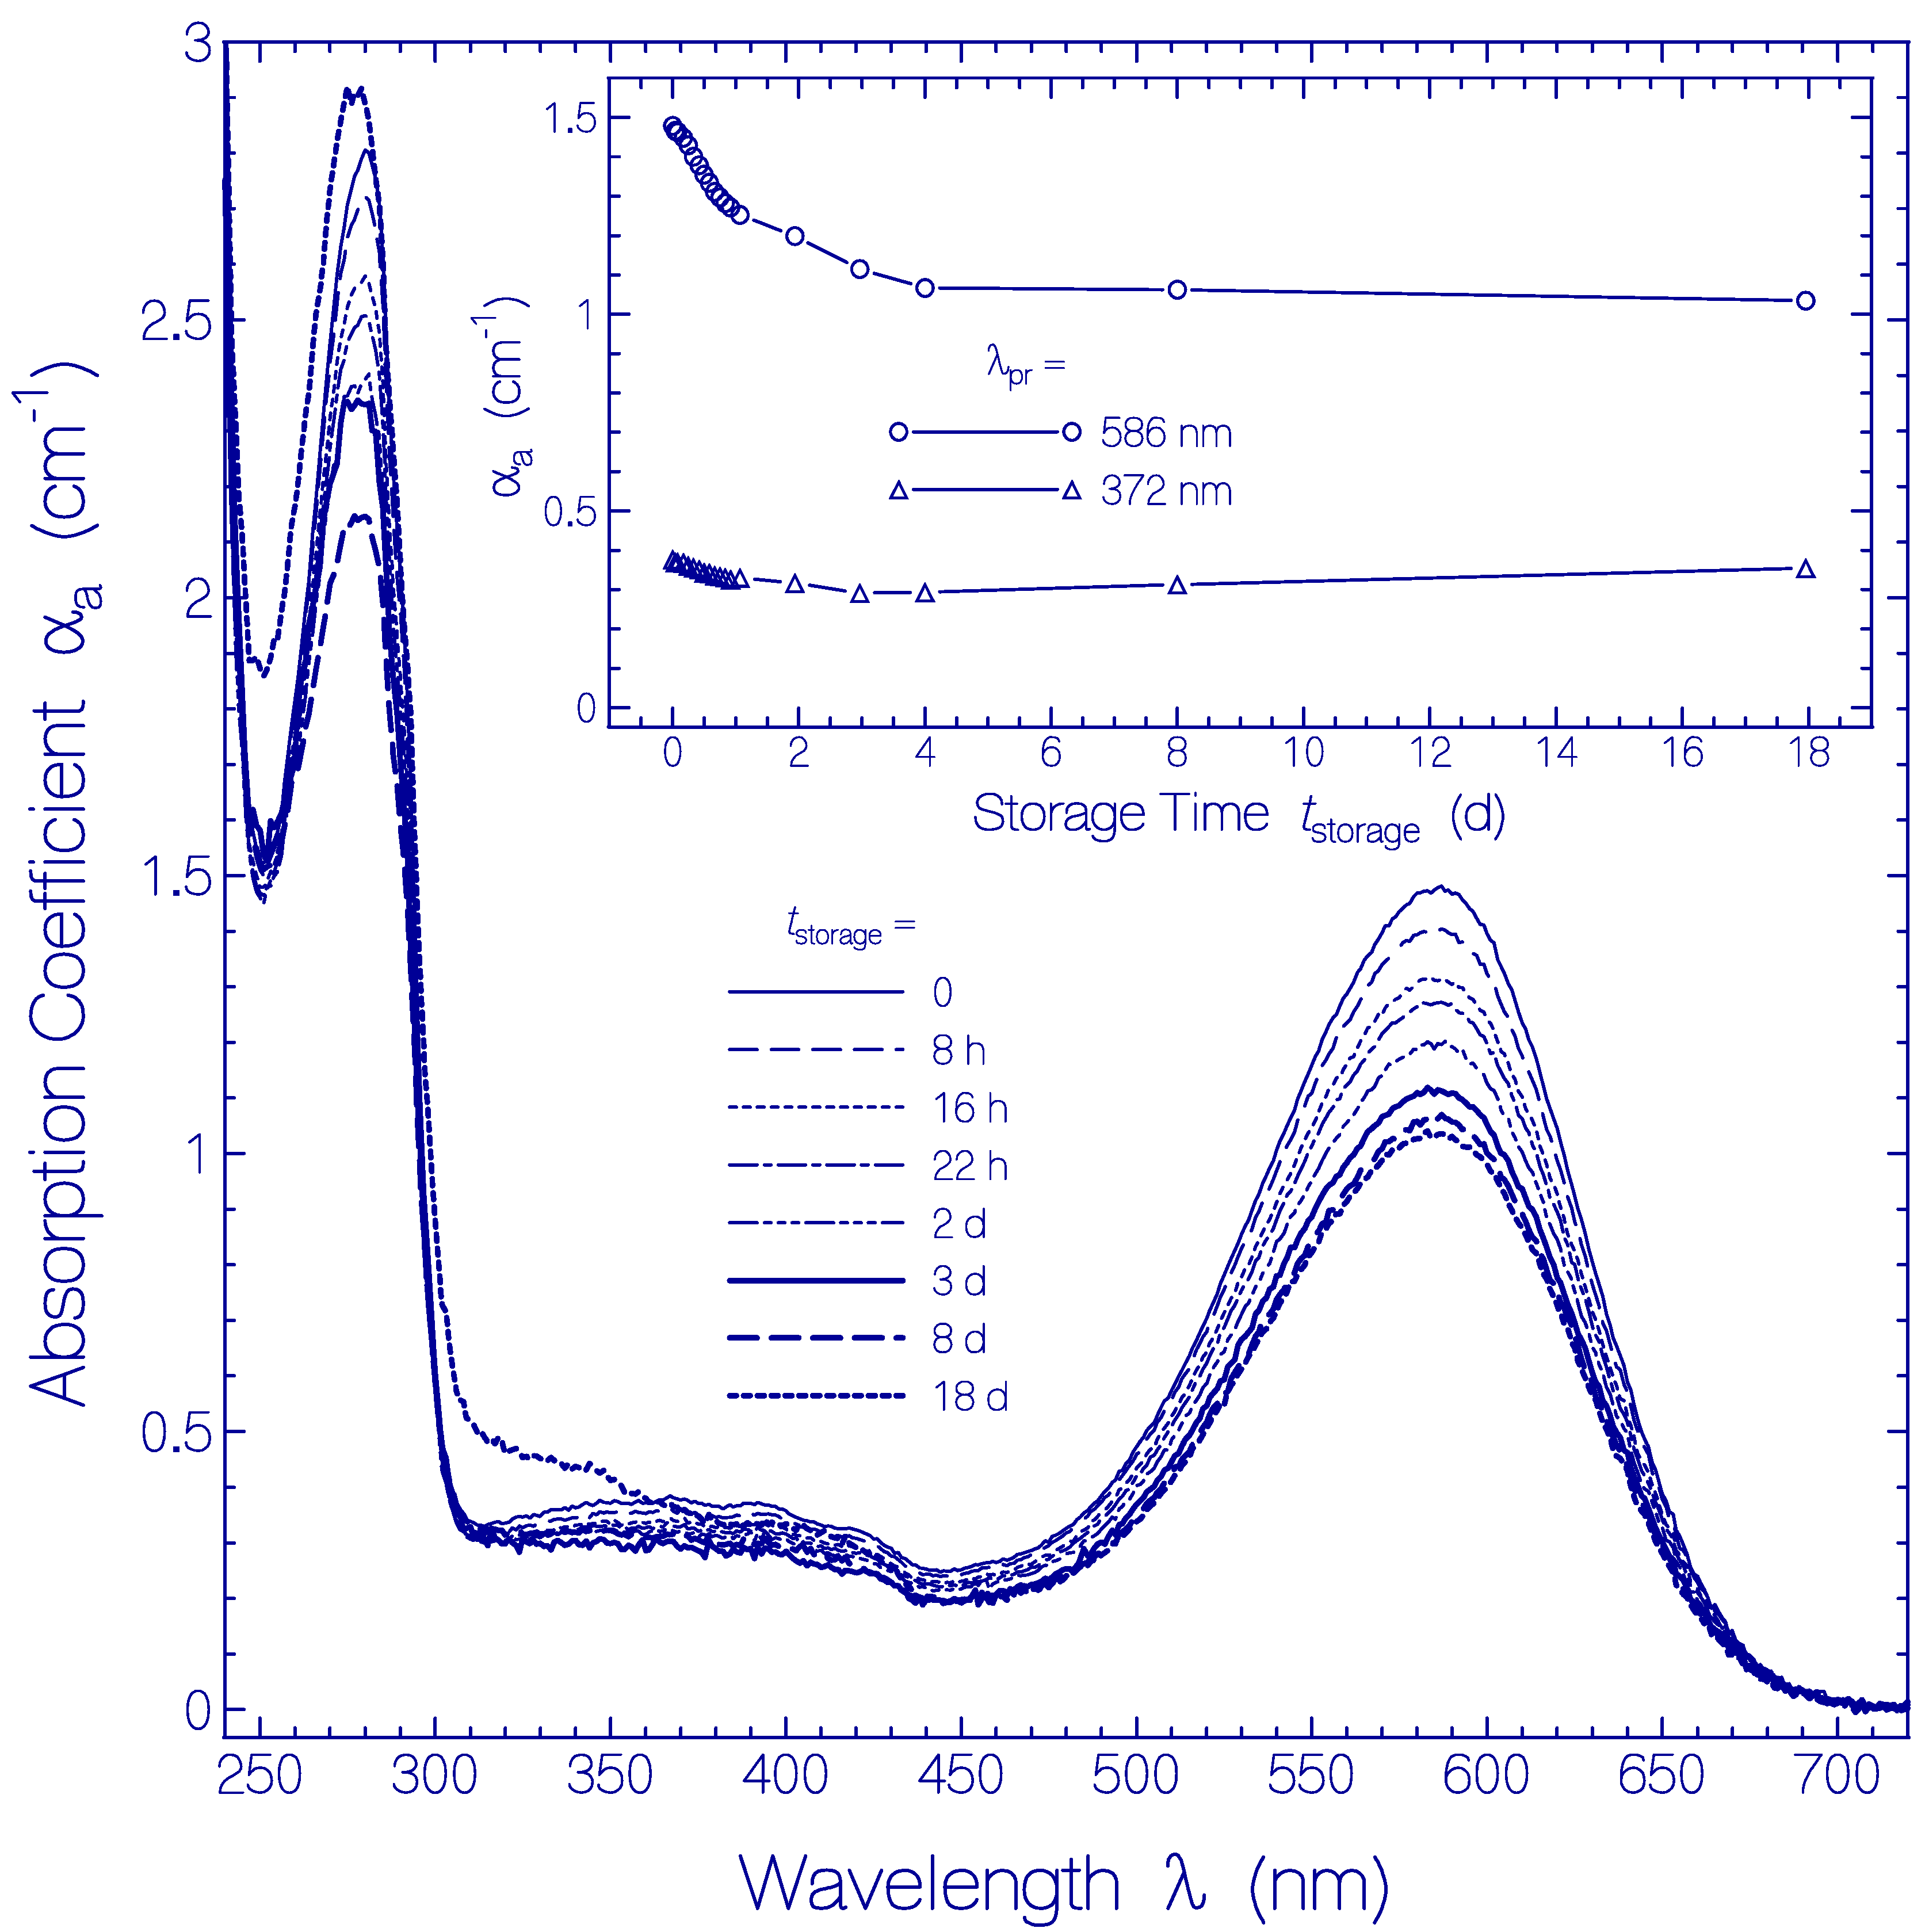
2.3. Temporal Development of Archon2 at Room Temperature

The thermal stability of Archon2 in pH 8 Tris buffer at room temperature (ϑ = 21 ± 1 °C) in the dark was studied by carrying out transmission spectra measurements T(λ) over a duration of 18 days.
The obtained attenuation coefficient spectra α(λ) = −ln[T(λ)]/l, where l is the sample length, are presented in Figure S5 of the Supplementary Materials (Section S6). The attenuation coefficient spectra α(λ) are composed of absorption coefficient contributions αa(λ) and scattering coefficient contributions αs(λ). In Figure S5, onset of light attenuation in the Archon2 transparency region (λ > 700 nm) due to light scattering was observed after two days of sample storage indicating the onset of some protein unfolding with associated aggregation [53] (see discussion in Section S6 of the Supplementary Materials).
In Figure 5 the temporal development of the absorption coefficient spectra αa(λ) is shown. They are obtained from Figure S5 by subtracting the scattering contributions αs(λ) from the attenuation coefficient spectra (for procedure see below Section 4.2). The main part of Figure 5 shows absorption coefficient spectra for the storage times tstorage listed in the legend. The inset shows the development of αa(586 nm) and αa(372 nm) versus storage time. The absorption coefficient spectra decrease with storage time over the displayed wavelength range. The decrease is stronger during the first two days of storage and levels off after four days of storage. The absorption coefficient decrease with storage time is thought to be due to partial protein clustering to aggregates at condensation nuclei (absorption relevant cross-sectional area reduction of aggregates compared to monomers [54]) and subsequent onset of cluster sedimentation (sedimented clusters are no longer in the light transmission path). The absorption coefficient spectrum belonging to tstorage = 18 d shows increased absorption in the wavelength range λ < 350 nm, indicating some Archon2 apoprotein degradation.

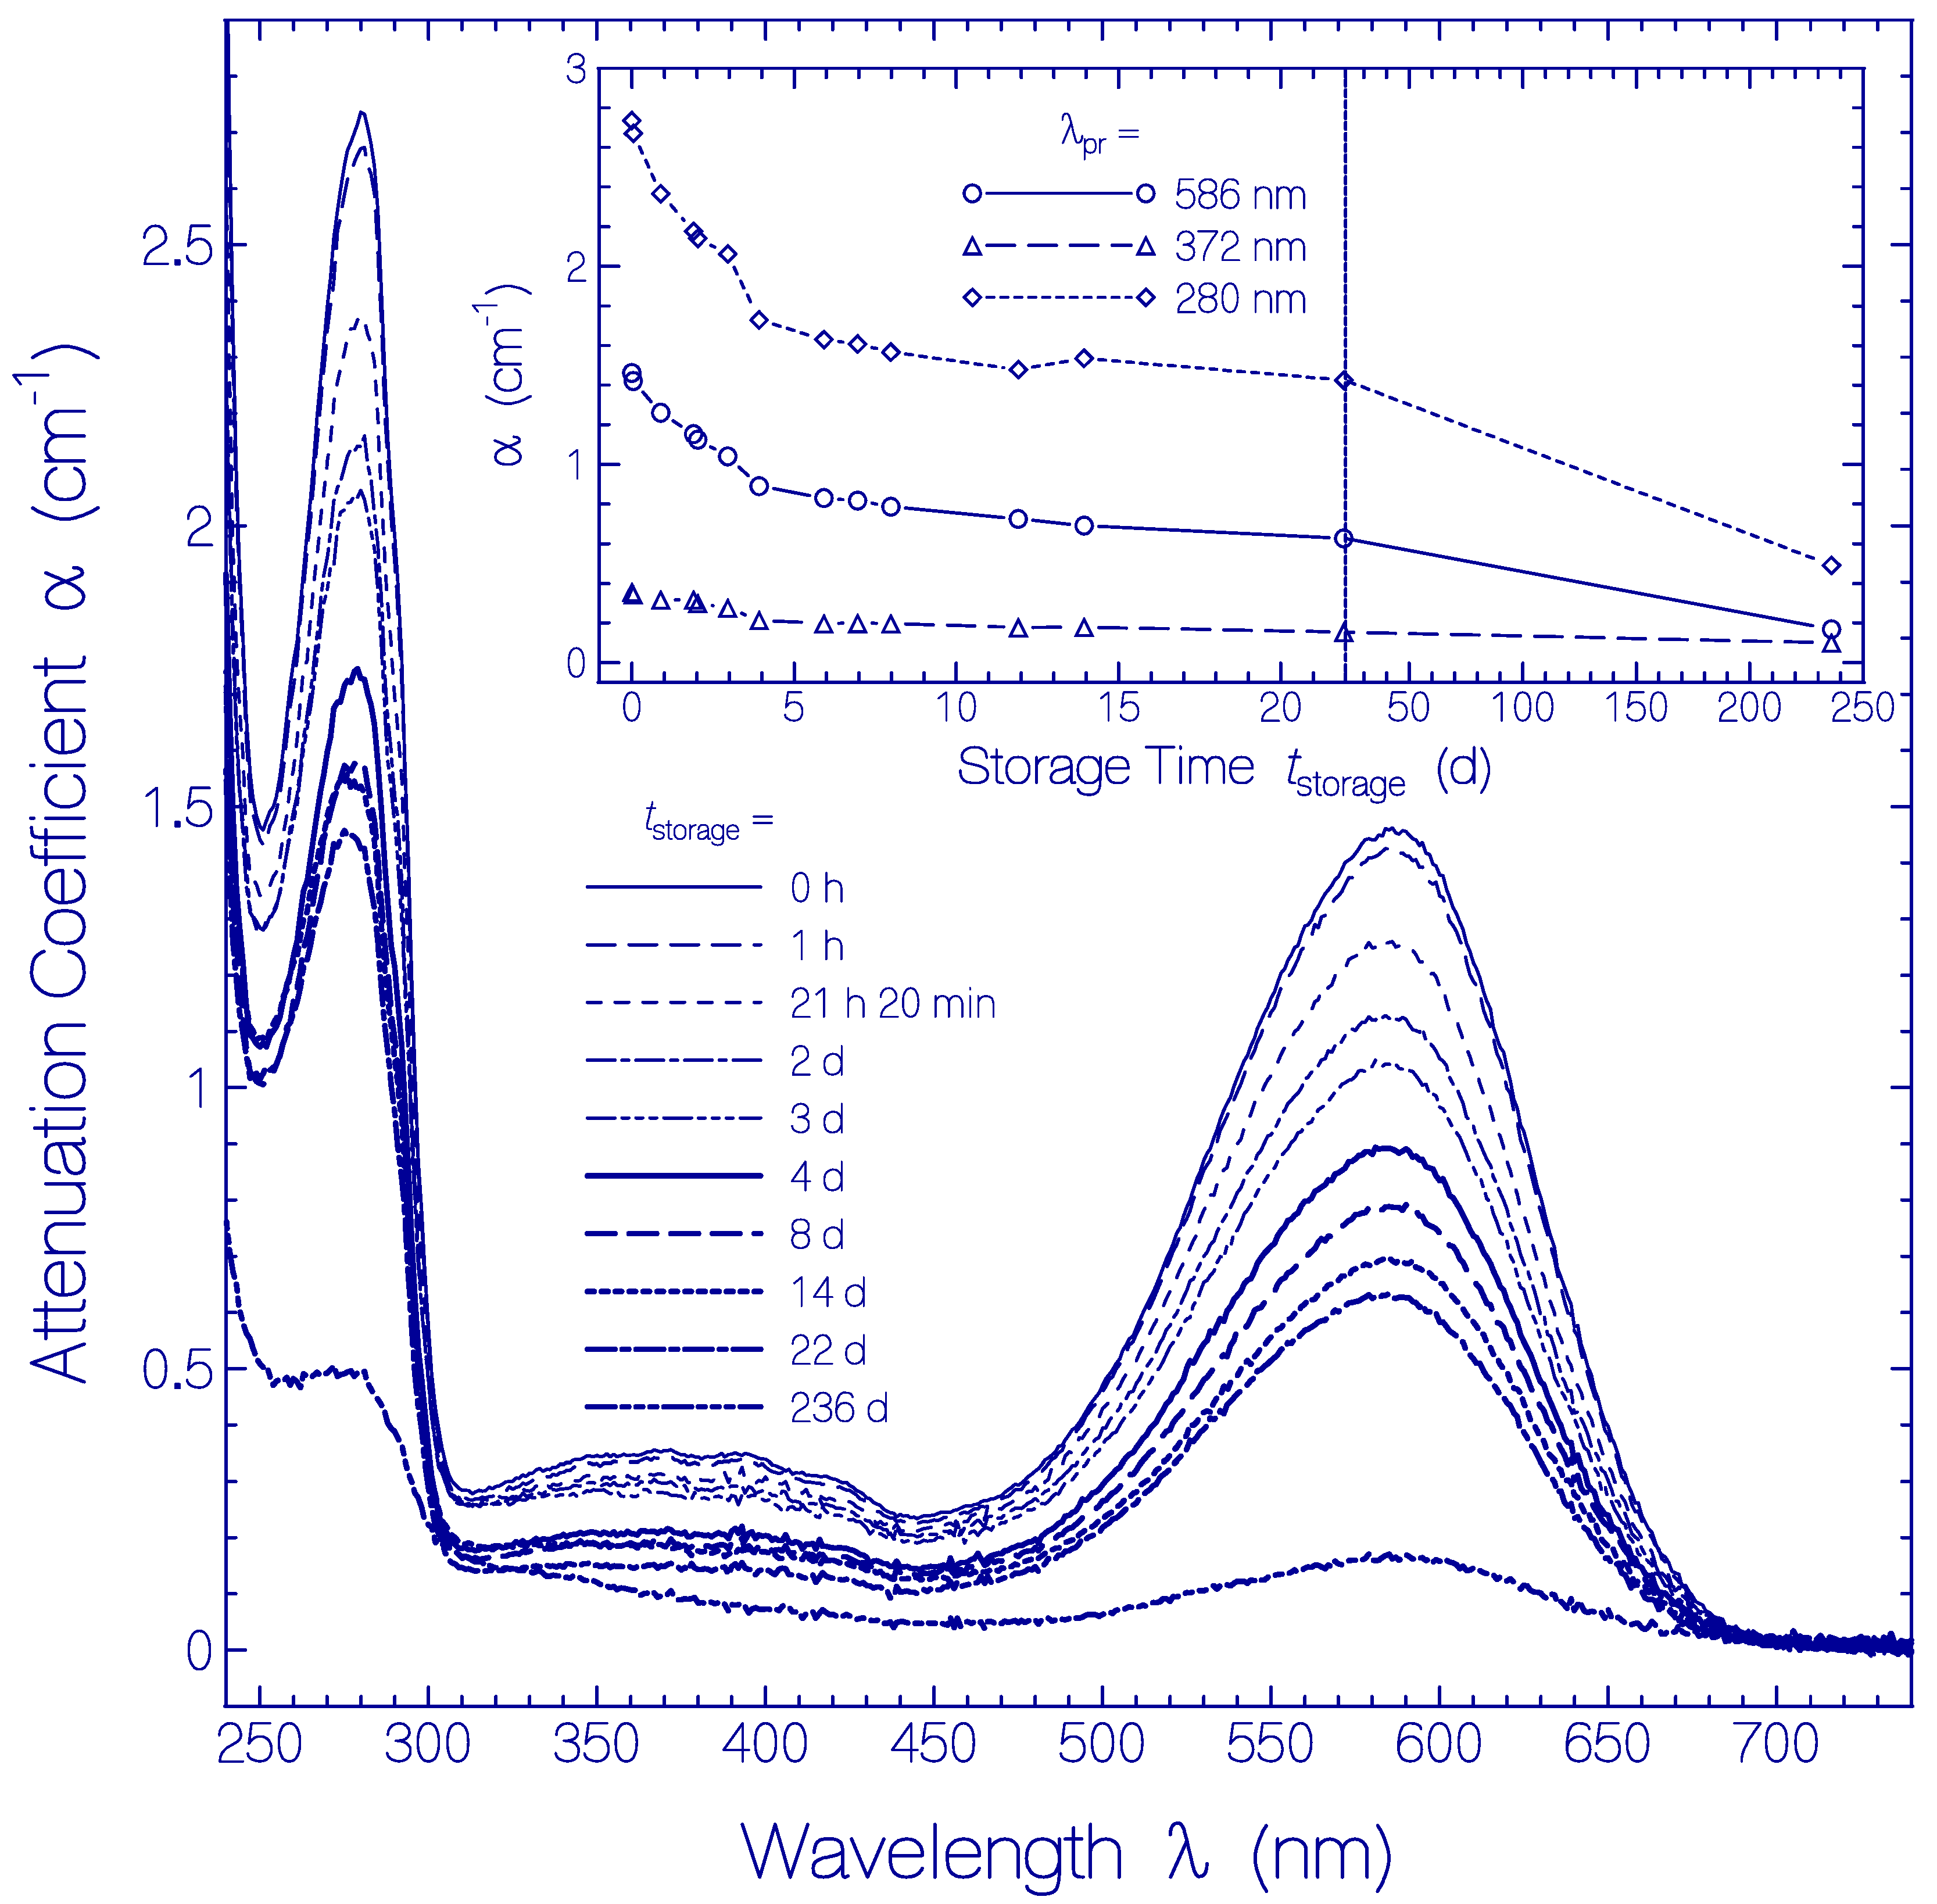
2.4. Temporal Development of Archon2 at Refrigerator Temperature

The thermal stability of Archon2 in pH 8 Tris buffer at ϑ = 3 ± 1 °C in the dark was studied by carrying out frequent transmission spectra measurements during the first 22 days after sample thawing, and a final transmission spectrum measurement after 236 days.
The temporal development of the attenuation coefficient spectra α(λ) is displayed in Figure 6. In the main part attenuation coefficient spectra are shown at selected storage times tstorage in the region between tstorage = 0 (measurement immediately after sample thawing and centrifugation) and tstorage = 236 d. The inset shows the temporal attenuation coefficient development for the selected wavelengths λpr = 586 nm (peak absorption wavelength of Ret_586), 372 nm (S0–Sn absorption of Ret_586 and absorption of residual retinal isomers) and 280 nm (wavelength position of peak apoprotein Trp absorption).
Over the whole studied storage time range no measurable scattering coefficient contribution is resolved (αs(λ) ≈ 0). This fact is seen in the Archon2 transparency region of λ > 700 nm, where α(λ) = αs(λ) ≈ 0. There is no indication of any partial protein unfolding during the investigated storage time of 236 days.
The attenuation coefficient spectra decrease with storage time is attributed to partial protein clustering to aggregates at condensation nuclei (these clusters have less effective absorption [54]) and subsequent cluster sedimentation (clusters which sedimented are no longer in the light transmission path and therefore do not contribute to absorption).

3. Discussion

In Section 2 we reported spectroscopic investigation of Archon2 at pH 8 in Tris buffer. The samples were studied under different conditions: (i) fresh thawed samples, (ii) thermally aged samples at refrigerator temperature (≈3 °C) and room temperature (≈21 °C), and (iii) heat-denaturized samples. The measurements provided information on the original retinal isomer composition of Archon2, the thermal stability of Archon2 at room temperature and refrigerator temperature, and the protonated retinal Schiff base (PRSB) deprotonation to neutral retinal Schiff base (RSB) in the case of thermal protein denaturation (protein melting).

3.1. Behavior of Fresh Thawed Archon2

In the heterologous expression of Archon2 the retinal cofactor is covalently bound to the opsin protein via a lysine Schiff base. It is dominantly present in protonated form. About 78.4% of retinal was found to be present as the protonated retinal Schiff base (PRSB) isomer Ret_586 with S0-S1 absorption maximum at 586 nm, and about 21.6% were found to be present as other retinal Schiff base isomers with S0–S1 absorption maxima below 480 nm (named residual retinals). Below 400 nm they are thought to be neutral retinal Schiff base (RSB) isomers (see Figure 1).
The absorption cross-section spectrum σa(λ) of Ret_586 could be determined in Section S3 of the Supplementary Materials by determining the Archon2 concentration from the apoprotein absorption in the UV spectral range, the absorption coefficient of Archon2 at λa,max = 586 nm (there only Ret_586 is absorbing), and the fluorescence excitation spectrum Eex(λ) of Archon2 for λF,det = 700 nm (there spectral shape of Eex(λ) of Archon2 agrees with the spectral shape of σa(λ) of Ret_586 in the wavelength range of λ > 310 nm).
The fluorescence quantum yield ϕF of the protonated retinal Schiff base isomer Ret_586 was determined to be ϕF(S1–S0) = 0.0105 ± 0.0015. This value is large for retinals in rhodopsins where the fluorescence emission is severely quenched by photoisomerization [38,39,40,41,42]. The special engineered Archon2 variant of Arch for optimal fluorescent voltage sensing slows down the excited state isomerization dynamics which results in the desired increase of fluorescence emission efficiency.

3.2. Heat Denaturation of Archon2

In the stepwise Archon2 heating up and subsequent cooling down the apparent protein melting temperature ϑm of Archon2 was determined. The obtained value of ϑm ≈ 63 °C indicates high thermal protein stability. The heat denaturation of Archon2 was irreversible: after protein melting (protein unfolding) no native protein restructuring occurred in cooling down of the sample (no protein refolding). The denaturation of Archon2 resulted in deprotonation of the PRSB Ret_586 to the neutral RSB Ret_380. The protein unfolding changed the amino acid arrangement around the covalently bound retinal losing the proton fixation to the Schiff base. Data analysis in Section S3 of the Supplementary Materials allowed the determination of the absorption cross-section spectrum of Ret_380. Using the absorption cross-section spectrum together with fluorescence measurements on the denatured centrifuged sample (fluorescence quantum yield ϕF ≈ 0.008), the S1–S0 radiative lifetime τrad and Stickler-Berg fluorescence lifetime τF,SB of the RSB isomer Ret_380 could be approximately determined, giving τrad(Ret_380) ≈ 3.31 ns and τF,SB ≈ 26.5 ps.

3.3. Thermal Aging of Archon2

At refrigerator temperature (≈3 °C) over a period of 22 days and at room temperature (≈21 °C) over a period of 18 days no thermal conversion of Ret_586 to other PRSB isomers and no deprotonation of Ret_586 were observed. At room temperature and lower temperature no thermal-activated S0 ground-state protonated retinal Schiff base isomerization and deprotonation occurred. Obviously the potential energy barrier along the S0 ground-state isomerization path is too high for thermal overcoming. In Section S7 of the Supplementary Materials a lower limit of the Arrhenius-type activation energy barrier Eact,Ret_586 is determined to be 9152 cm−1 × hc0.
At refrigerator temperature over a period of 236 days no measurable attenuation coefficient increase due to light scattering was observed giving no indication of any protein denaturation (protein unfolding) during this time period at 3 °C. Over the whole wavelength region (240 nm to 680 nm) the light absorption decreased with storage time. This absorption decrease is thought to be due to partial protein clustering to aggregates at condensation nuclei and subsequent cluster sedimentation. The effective sample absorption reduces with growing cluster size because of reduced number density of non-clustered Archon2 and less effective absorption of Archon2 in clusters [54]. Sedimented clusters do not contribute to the light absorption since they are no longer in the light transmission path.
At room temperature an attenuation coefficient increase due to light scattering was seen after two days of sample storage in the dark indicating an onset of partial protein denaturation (protein unfolding, see dotted line connected square curve in the inset of Figure S5 of Section S6 of the Supplementary Materials). The absorption coefficient spectra decreased during the first four days of sample storage in the dark and then leveled off (see Figure 5). The Archon2 partial protein clustering to aggregates at condensation nuclei during the first two days at room temperature was similarly effective as at 3 °C (see insets in Figure 5 and Figure 6). But the efficiency of Archon2 partial protein clustering reduced with the onset of partial protein denaturation and leveled off after four days of storage because of continued protein unfolding.

3.4. Comparison of Archon2 with QuasAr1

In a previous study the thermal dynamics was investigated of the fluorescent voltage sensor QuasAr1 obtained from Archaerhodopsin 3 (Arch) by direct evolution site directed mutation [44]. Here the thermal dynamics is investigated of the fluorescent voltage sensor Archon2 derived from Arch by a robotic multidimensional-directed evolution approach for optimal fluorescent voltage sensing [32]. In the following the dark state behaviors of Archon2 and QuasAr1 are compared. Relevant parameters are collected in Table 1.
The applied molar protein concentrations were C(Archon2) = 20.1 μM and C(QuasAr1) = 27.6 μM ( C = N × 1000 / N A , N: number density in cm−3, NA: Avogadro constant in mol−1, C: molar concentration in mol dm−3). The absorption maximum of the dominant protonated retinal Schiff base isomer Ret_586 of Archon2 occurs at slightly longer wavelength than that of the dominant protonated retinal Schiff base isomer Ret_580 of QuasAr1 (λa,max,Archon2 = 586 nm, λa,max,QuasAr1 = 580 nm). The amount of residual retinal isomers besides the dominant PRSB is higher in Archon2 than in QuasAr1 (κresidual retinals,Archon2 ≈ 0.218, κresidual retinals,QuasAr1 ≈ 0.138). The fluorescence quantum yield of Ret_586 of Archon2 is a factor of 1.6 larger than the fluorescence quantum yield of Ret_580 of QuasAr1 (ϕF,Ret_586 of Archon2 ≈ 0.0105, ϕF,Ret_580 of QuasAr1 ≈ 0.0065). The apparent melting temperature of Archon2 is slightly lower than that of QuasAr1 (ϑm,Archon2 ≈ 63 °C, ϑm,QuasAr1 ≈ 65 °C). The similarity of the apparent melting temperatures indicates similar thermal stability of Archon2 and QuasAr1.
The thermal development of Archon2 and QuasAr1 versus storage time in the dark at room temperature is different. Onset of light scattering, which is an indication of the onset of protein unfolding, is observed earlier for QuasAr1 than for Archon2 (tonset of light scattering ≈ 12 h for QuasAr1 and ≈ 48 h for Archon2). The initial rate of absorption decrease due to partial protein clustering to aggregates at condensation nuclei is large for Archon2 and negligible for QuasAr1 ( ( α a ( λ a , max ) / t s t o r a g e | t s t o r a g e = 0 ) / α a ( λ a , max , t s t o r a g e = 0 ) ≈ 0.14 d−1 for Archon2 and ≈ 0 for QuasAr1). For Archon2 no ground-state isomerization of the PRSB Ret_586 isomer to other PRSB isomers and no deprotonation of Ret_586 are observed. For QuasAr1 ground-state isomerization of PRSB Ret_580 to other PRSB isomers and subsequent deprotonation occurred. Ret_580 was found to be composed of the PRSB isomers Ret_580I and Ret_580II whereby Ret_580I converted the PRSB Ret_530, and Ret_580II converted to the PRSB Ret_640. Ret_530 deprotonated to the RSB Ret_400, and Ret_640 deprotonated to the RSB Ret_350. The non-occurrence of ground-state isomerization of Archon2 is attributed to a high ground-state activation barrier (Eact,Ret_586 > 9152 cm−1 × hc0 (see Section S7 of the Supplementary Materials), while E a c t , Ret _ 580 I = 8670 cm−1 × hc0 and E a c t , Ret _ 580 II = 9380 cm−1 × hc0 [44]). The non-observation of Ret_586 ground-state isomerization hinders to get any information whether Ret_586 of Archon2 is composed of an isomer mixture as was resolved for Ret_580 of QuasAr1.
At refrigerator temperature thermal protein unfolding plays no role both for Archon2 and QuasAr1 (tonset of light scattering ≈ 50 d for QuasAr1 and > 236 d for Archon2). The initial rate of absorption decrease due to partial protein clustering to aggregates at condensation nuclei is higher for Archon2 than for QuasAr1 ( ( α a ( λ a , max ) / t s t o r a g e | t s t o r a g e = 0 ) / α a ( λ a , max , t s t o r a g e = 0 ) ≈ 0.15 d−1 for Archon2 and ≈ 0.054 d−1 for QuasAr1). No ground-state isomerization and no deprotonation of the PRSB Ret_586 are observed for Archon2 in the dark at 3 °C over a period of 22 days. For QuasAr1 ground-state isomerization of PRSB Ret_580 to other PRSB isomers and subsequent deprotonation was found to be small in the dark at 2.5 °C.

4. Materials and Methods

4.1. Sample Preparation

For high yield purification, an E.coli codon-optimized genes encoding for Arch (UniProtKB-P96787 amino acids 1–253, with mutations adapted from [32]) with a TEV protease cleavage site and a 6xHis tag at the C-terminal (ENLYFQGLEHHHHHH) were synthesized by (GenScript, Nanjing, China) and cloned into a pET21a(+) expression vector between the NdeI and SalI restriction sites. In difference to Arch the following mutants were introduced: T56P-P60S-T80P-D95H-T99S-T116I-F161V-T183I-L197I-A225C.
The expression plasmid (pET21a(+)) carrying Archon2 was transformed into C41(DE3) E. coli cells. To induce the protein expression we used 0.5 mM isopropyl β-D-thiogalactopyranoside (IPTG; Carl Roth GmbH, Karlsruhe, Germany) and the LB media was supplemented with 5 µM all-trans retinal (ATR; Sigma-Aldrich, St. Louis, MO, USA). The cells were incubated at 37 °C for 4 h and then harvested. The cells were disrupted using an EmulsiFlex-C3 Homogenizer (AVESTIN Inc., Ottawa, Canada). The membrane fraction was collected by ultracentrifugation (45,000 rpm) for 1 h at 4 °C (Type 45 Ti; Beckman Inc., Indianapolis, IN, USA) and then resuspended in buffer containing 50 mM Tris-HCl (pH 8.0), 300 mM NaCl, 0.1 mM PMSF, 1.5% n-dodecyl-β-d-maltoside (DDM, GLYCON Biochemicals GmbH, Luckenwalde, Germany), and 0.3% cholesteryl hemisuccinate (CHS, Sigma-Aldrich, St. Louis, MO, USA) and stirred overnight for solubilization. The insoluble fraction was removed by ultracentrifugation (200,000× g, 1 h at 4 °C). The Archon2 protein was purified by Ni-NTA affinity and using an ÄKTAxpress protein purification system (GE Healthcare Life Science, Chicago, IL, USA) configured with a HisTrap HP Ni-NTA column. The protein was collected in the final buffer containing 50 mM Tris-HCl (pH 8.0), 150 mM NaCl, 0.1 mM PMSF, 0.02% DDM, and 0.004% CHS. The purity of the protein was checked by a SDS-PAGE gel investigation. The expressed Archon2 solution was aliquoted to amounts of 30 μL in Eppendorf tubes, shock-frozen, and stored at −80 °C.

4.2. Spectroscopic Measurements

For experimental investigations the Archon2 samples stored at −80 °C were thawed and then transferred to ultra-micro fused silica fluorescence cells (inner cell dimensions relevant for measurements: 3 mm length, 1.5 mm width, and 5 mm height; special fabrication of Hellma GmbH, Müllheim/Baden, Germany). Fresh thawed samples were centrifuged with 4400 rpm for 30 min at 4 °C (Centrifuge 5702 R, Eppendorf AG, Hamburg, Germany).
Transmission measurements versus wavelength, T(λ), were carried out with a spectrophotometer (Cary 50, Varian Australia Pty Ltd., Mulgrave, Victoria, Australia). Attenuation coefficient spectra were calculated by the relation, α ( λ ) = ln [ T ( λ ) ] / l , were l is the sample length. In the case of negligible protein light scattering the attenuation coefficient spectrum α(λ) is equal to the absorption coefficient spectrum αa(λ). The attenuation coefficient spectrum α(λ) comprises absorption (αa) and scattering (αs) contributions according to α ( λ ) = α a ( λ ) + α s ( λ ) . The scattering coefficient spectrum is approximated by the empirical relation [55] α s ( λ ) = α s ( λ 0 ) ( λ 0 / λ ) γ where the wavelength λ0 is selected in the transparency region and γ ≤ 4 is fitted to the experimental attenuation in the transparency region. Absorption coefficient spectra were determined by subtracting the scattering contribution from the measured attenuation coefficient spectra.
The Archon2 melting was studied by stepwise sample heating up, then cooling down and thereby measuring the attenuation coefficient spectra development [52,53]. The apparent protein melting temperature ϑm was derived from the onset of strong light attenuation in the transparency region of Archon2.
The thermal stability of Archon2 at room temperature (21 ± 1 °C) and refrigerator temperature (3 ± 1 °C) was determined by storing Archon2 samples at these temperatures in the dark and measuring transmission spectra at certain time intervals.
Fluorescence spectroscopic measurements were carried out with a spectrofluorimeter (Cary Eclipse, Varian Australia Pty Ltd., Mulgrave, Victoria, Australia). Fluorescence emission quantum distributions EF(λ) were determined from fluorescence emission spectra measurements at fixed excitation wavelengths [33,56,57]. The dye rhodamine 6G in methanol was used as reference standard for fluorescence quantum distribution calibration (fluorescence quantum yield ϕF,ref = 0.93 [58]). The fluorescence quantum yield ϕF was calculated using the relation ϕ F = e m E F ( λ ) d λ where the integration runs over the fluorescence emission wavelength region (see Equation (1) above). Fluorescence excitation quantum distributions Eex(λ) were recorded by scanning the fluorescence excitation wavelength over the absorption wavelength region at fixed fluorescence detection wavelengths λF,det [59]. Magic angle conditions were applied for the fluorescence recordings (vertical polarized excitation and orientation of the fluorescence detection polarizer at an angle of 54.7° to the vertical [60]). The spectra were corrected for the spectral sensitivity of the spectrometer and the photodetector.

5. Conclusions

The Archaerhodopsin 3-based fluorescent voltage sensor Archon2 optimized by a robotic multidimensional directed evolution approach [32] was characterized by its absorption and emission spectroscopic behavior and its long-time thermal stability. The measured fluorescence quantum yield of ϕF ≈ 1.05% was approximately a factor of 1.6 higher than that of the previously highest fluorescent Archaerhodopsin 3-based voltage sensor QuasAr1 [17,44]. Archon2 in pH 8 Tris buffer turned out to be thermally very stable in the dark. At room temperature after two days of storage in the dark some onset of light scattering was observed indicating an onset of partial protein unfolding. The attenuation spectrum decreased with storage time before the onset of light scattering indicating partial native protein clustering to aggregates at condensation nuclei before the onset of partial protein unfolding. At refrigerator temperature no protein unfolding occurred during long-time storage in the dark, only partial protein clustering at condensation nuclei and cluster sedimentation were observed. At refrigerator temperature and even room temperature the Archon2 protonated retinal Schiff base isomer composition and deprotonated retinal Schiff base isomer composition did not change with storage time indicating high activation barriers for ground-state isomerization and protonation/deprotonation changes.

Supplementary Materials

Supplementary Materials can be found at https://www.mdpi.com/1422-0067/21/18/6576/s1. Figure S1. Amino acid sequence of Archon2; Figure S2. Structural formulae of some protonated and neutral retinal Schiff base isomers; Figure S3. Absorption cross-section spectra of Ret_586 and Ret_380; Figure S4. Normalized fluorescence excitation quantum distributions of Archon2 in pH 8 Tris buffer; Figure S5. Temporal development of attenuation coefficient spectra of Archon2 in pH 8 Tris buffer at room temperature. References [61,62,63,64,65,66,67,68,69,70] are cited in the Supplementary Materials.

Author Contributions

The study was initiated by A.S. and P.H. who expressed, purified, and delivered the protein. A.P. carried out the absorption and emission spectroscopic measurements. The manuscript was written by A.P. and commented and improved by A.S. and P.H. All authors have read and agreed to the published version of the manuscript.

Funding

This research received no external funding.

Acknowledgments

A.P. thanks Franz J. Gießibl, University of Regensburg, for his kind hospitality. The work was supported by the European Research Council (ERC, MERA project), the DFG Cluster of Excellence “Unifying Systems in Catalysis” EXC314, and the Gottfried Wilhelm Leibniz Prize to P.H. and A.S. P.H. is a Hertie Professor for Neuroscience and supported by the Hertie-Foundation.

Conflicts of Interest

The authors declare no conflict of interest.

Abbreviations

ArchArchaerhodopsin 3 from Halorubrum sodomense
Archon1Rhodopsin based on Arch with thirteen point mutations
Archon2Rhodopsin based on Arch with ten point mutations
FRETFörster resonance energy transfer
GECIGenetically encoded calcium indicator
GEVIGenetically encoded voltage indicator
PRSBProtonated retinal Schiff base
QuasArQuality superior to Arch
Ret_xxxRetinal with absorption maximum approximately at xxx nm
RSBRetinal Schiff base
TrpTryptophan
TyrTyrosine
VSDVoltage sensing domain

References

  1. Ainsworth, M.; Lee, S.; Cunningham, M.O.; Traub, R.D.; Kopell, N.J.; Whittington, M.A. Rates and rhythms: A synergistic view of frequency and temporal coding in neural networks. Neuron 2012, 75, 572–583. [Google Scholar] [CrossRef] [PubMed] [Green Version]
  2. Shoham, D.; Glaser, D.E.; Arieli, A.; Kenet, T.; Wijnbergen, C.; Toledo, Y.; Hildesheim, R.; Grinvald, A. Imaging cortical dynamics at high spatial and temporal resolution with novel blue voltage-sensitive dyes. Neuron 1999, 24, 791–802. [Google Scholar] [CrossRef] [Green Version]
  3. Ortiz, G.; Liu, P.; Naing, S.H.H.; Muller, V.R.; Miller, E.W. Synthesis of sulfonated carbofluoresceins for voltage imaging. J. Am. Chem. Soc. 2019, 141, 6631–6638. [Google Scholar] [CrossRef]
  4. Mank, M.; Griesbeck, O. Genetically encoded calcium indicators. Chem. Rev. 2008, 108, 1550–1564. [Google Scholar] [CrossRef] [PubMed]
  5. Nguyen, C.; Upadhyay, H.; Murphy, M.; Borja, G.; Rozsahegyi, E.M.; Barnett, A.; Brookings, T.; McManus, O.B.; Werley, C.A. Simultanous voltage and calcium imaging and optogenetic stimulation with high sensitivity and a wide field of view. Biomed. Opt. Express 2019, 10, 789–806. [Google Scholar] [CrossRef]
  6. Bando, Y.; Grimm, C.; Cornejo, V.H.; Yuste, R. Genetic voltage indicators. BMC Biol. 2019, 17, 71. [Google Scholar] [CrossRef]
  7. Panzera, L.C.; Hoppa, M.B. Genetically encoded voltage indicators are illuminating subcellular physiology of the axon. Front. Cell. Neurosci. 2019, 13, 52. [Google Scholar] [CrossRef] [Green Version]
  8. Murata, Y.; Iwasaki, H.; Sasaki, M.; Inaba, K.; Okamura, Y. Phosphoinositide phosphatase activity coupled to an intrinsic voltage sensor. Nature 2005, 435, 1239–1243. [Google Scholar] [CrossRef]
  9. Mutoh, H.; Akemann, W.; Knöpfel, T. Genetically engineered fluorescent voltage reporters. ACS Chem. Neurosci. 2012, 3, 585–592. [Google Scholar] [CrossRef] [Green Version]
  10. Lin, M.Z.; Schnitzer, M.J. Genetically encoded indicators of neuronal activity. Nat. Neurosci. 2016, 19, 1142–1153. [Google Scholar] [CrossRef] [Green Version]
  11. Xu, Y.; Zou, P.; Cohen, A.E. Voltage imaging with genetically encoded indicators. Curr. Opin. Chem. Biol. 2017, 39, 1–10. [Google Scholar] [CrossRef] [PubMed]
  12. Bando, Y.; Sakamoto, M.; Kim, S.; Ayzenshtat, I.; Yuste, R. Comparative evaluation of genetically encoded voltage indicators. Cell Rep. 2019, 26, 802–813. [Google Scholar] [CrossRef] [PubMed] [Green Version]
  13. Kang, B.E.; Lee, S.; Baker, B.J. Optical consequences of a genetically-encoded voltage indicator with a pH sensitive fluorescent protein. Neurosci. Res. 2019, 146, 13–21. [Google Scholar] [CrossRef]
  14. Kralj, J.M.; Hochbaum, D.R.; Douglass, A.D.; Cohen, A.E. Electrical spiking in Escherichia coli probed with a fluorescent voltage-indicating protein. Science 2011, 333, 345–348. [Google Scholar] [CrossRef]
  15. Gong, Y. The evolving capabilities of rhodopsin-based genetically encoded voltage indicators. Curr. Opin. Chem. Biol. 2015, 27, 84–89. [Google Scholar] [CrossRef] [Green Version]
  16. Hashemi, N.A.; Beergs, A.C.F.; Schüler, C.; Scheiwe, A.R.; Costa, W.S.; Bach, M.; Liewald, J.F.; Gottschalk, A. Rhodopsin-based voltage imaging tools for use in muscles and neurons of Caenorhabditis elegans. Proc. Natl. Acad. Sci. USA 2019, 116, 17051–17060. [Google Scholar] [CrossRef] [PubMed] [Green Version]
  17. Hochbaum, D.R.; Zhao, Y.; Farhi, S.L.; Klapoetke, N.; Werley, C.A.; Kapoor, V.; Zou, P.; Kralj, J.M.; Maclaurin, D.; Smedemark-Margulies, N.; et al. All-optical electrophysiology in mammalian neurons using engineered microbial rhodopsins. Nat. Methods 2014, 11, 825–833. [Google Scholar] [CrossRef] [Green Version]
  18. Zou, P.; Zhao, Y.; Douglass, A.D.; Hochbaum, D.R.; Brinks, D.; Werley, C.A.; Harrison, D.J.; Campbell, R.E.; Cohen, A.E. Bright and fast multicoloured voltage reporters via electrochromic FRET. Nat. Commun. 2014, 5, 4625. [Google Scholar] [CrossRef] [Green Version]
  19. Gong, Y.; Wagner, M.J.; Li, Z.; Schnitzer, M.J. Imaging neural spiking in brain tissue using FRET-opsin protein voltage sensors. Nat. Commun. 2014, 5, 3674. [Google Scholar] [CrossRef]
  20. Gong, Y.; Huang, C.; Li, J.Z.; Grewe, B.F.; Zhang, Y.; Eismann, S.; Schnitzer, M.J. High-speed recoding of neural spikes in awake mice and flies with a fluorescent voltage sensor. Science 2015, 350, 1361–1366. [Google Scholar] [CrossRef] [Green Version]
  21. González, J.E.; Tsien, R.Y. Voltage sensing by fluorescence resonance energy transfer in single cells. Biophys. J. 1995, 69, 1272–1280. [Google Scholar] [CrossRef] [Green Version]
  22. Chanda, B.; Blunck, R.; Faria, L.C.; Schweizer, F.E.; Mody, I.; Bezanilla, F. A hybrid approach to measuring electrical activity in genetically specified neurons. Nat. Neurosci. 2005, 8, 1619–1626. [Google Scholar] [CrossRef] [PubMed]
  23. Abdelfattah, A.S.; Farhi, S.L.; Zhao, Y.; Brinks, D.; Zou, P.; Ruangkittisakul, A.; Platisa, J.; Pieribone, V.A.; Ballanyi, K.; Cohen, A.E.; et al. A bright and fast red fluorescent voltage indicator that reports neuronal activity in organotypic brain slices. J. Neurosci. 2016, 36, 2458–2472. [Google Scholar] [CrossRef] [PubMed]
  24. Lui, P.; Grenier, V.; Hong, W.; Muller, V.R.; Miller, E.W. Fluorgenic targeting of voltage-sensitive dyes to neurons. J. Am. Chem. Soc. 2017, 139, 17334–17340. [Google Scholar]
  25. Grenier, V.; Daws, B.R.; Liu, P.; Miller, E.W. Spying on neuronal membrane potential with genetically targetable voltage indicators. J. Am. Chem. Soc. 2019, 141, 1349–1358. [Google Scholar] [CrossRef] [PubMed]
  26. Sundukova, M.; Prifti, E.; Bucci, A.; Krillova, K.; Serrao, J.; Reymond, L.; Umebayashi, M.; Hovius, R.; Riezman, H.; Johnsson, K.; et al. A chemogenetic approach for optical monitoring of voltage in neurons. Angew. Chem. Int. Ed. 2018, 58, 2341–2344. [Google Scholar] [CrossRef] [PubMed] [Green Version]
  27. Abdelfattah, A.S.; Kawashima, T.; Singh, A.; Novak, O.; Liu, H.; Shuai, Y.; Huang, Y.-C.; Campagnola, L.; Seeman, S.C.; Yu, J.; et al. Bright and photostable chemigenetic indicators for extended in vivo voltage imaging. Science 2019, 364, 699–704. [Google Scholar] [CrossRef]
  28. Kralj, J.; Douglass, A.D.; Hochbaum, D.R.; Maclaurin, D.; Cohen, A.E. Optical recording of action potentials in mammalian neurons using a microbial rhodopsin. Nat. Methods 2012, 9, 90–95. [Google Scholar] [CrossRef] [Green Version]
  29. Maclaurin, D.; Venkatachalam, V.; Lee, H.; Cohen, A.E. Mechanism of voltage-sensitive fluorescence in a microbial rhodopsin. Proc. Natl. Acad. Sci. USA 2013, 110, 5939–5944. [Google Scholar] [CrossRef] [Green Version]
  30. Flytzanis, N.C.; Bedbrook, C.N.; Engqvist, M.K.M.; Xiao, C.; Chan, K.Y.; Sternberg, P.W.; Arnold, F.H.; Gradinaru, V. Archaerhodopsin variants with enhanced voltage-sensitive fluorescence in mammalian and Caenorhabditis elegans neurons. Nat. Commun. 2014, 5, 4894. [Google Scholar] [CrossRef] [Green Version]
  31. Adam, Y.; Kim, J.J.; Lou, S.; Zhao, Y.; Brinks, D.; Wu, H.; Mostajo-Radji, M.A.; Kheifets, S.; Parot, V.; Chettih, S.; et al. All-optical electrophysiology reveals brain-state dependent changes in hippocampal subthreshold dynamics and excitability. bioRxiv 2018. [Google Scholar] [CrossRef] [Green Version]
  32. Piatkevich, K.D.; Jung, E.E.; Straub, C.; Linghu, C.; Park, D.; Suk, H.J.; Hochbaum, D.R.; Goodwin, D.; Pnevmatikakis, E.; Pak, N.; et al. A robotic multidimensional directed evolution approach applied to fluorescent voltage reporters. Nat. Chem. Biol. 2018, 14, 352–360. [Google Scholar] [CrossRef] [PubMed]
  33. Förster, T. Fluoreszenz Organischer Verbindungen; Vandenhoeck und Ruprecht: Göttingen, Germany, 1951; pp. 83–86. [Google Scholar]
  34. Valeur, B.; Berberan-Santos, M.N. Molecular Fluorescence: Principles and Applications, 2nd ed.; Wiley-VCH: Weinheim, Germany, 2012; pp. 213–261. [Google Scholar]
  35. Gong, Y.; Li, J.Z.; Schnitzer, M.J. Enhanced Archaerhodopsin fluorescent protein voltage indicators. PLoS ONE 2013, 8, e66959. [Google Scholar] [CrossRef] [PubMed]
  36. Kannan, M.; Vasan, G.; Huang, C.; Haziza, S.; Li, J.Z.; Inan, H.; Schnitzer, M.J.; Pieribone, V.A. Fast, in vivo voltage imaging using a red fluorescent indicator. Nat. Methods 2018, 15, 108–116. [Google Scholar] [CrossRef] [PubMed]
  37. Piatkevich, K.D.; Bensussen, S.; Tseng, H.-A.; Shroff, S.N.; Lopez-Huerta, V.G.; Park, G.; Jung, E.E.; Shemesh, O.A.; Straub, C.; Gritton, H.J.; et al. Population imaging of neural activity in awake behaving mice. Nature 2019, 574, 413–417. [Google Scholar] [CrossRef]
  38. Kandori, H.; Shichida, Y.; Yoshizawa, T. Photoisomerization in rhodopsin. Biochemistry 2001, 66, 1197–1209. [Google Scholar] [CrossRef]
  39. Wand, A.; Gdor, I.; Zhu, J.; Sheves, M.; Ruhman, S. Shedding new light on retinal protein photochemistry. Annu. Rev. Phys. Chem. 2013, 64, 437–458. [Google Scholar] [CrossRef]
  40. Alexiev, U.; Farrens, D.L. Fluorescence spectroscopy of rhodopsins: Insights and approaches. Biochim. Biophys. Acta 2014, 1837, 694–709. [Google Scholar] [CrossRef] [Green Version]
  41. Ernst, O.P.; Lodowski, D.T.; Elstner, M.; Hegemann, P.; Brown, L.S.; Kandori, H. Microbial and animal rhodopsins: Structures, functions, and molecular mechanisms. Chem. Rev. 2014, 114, 126–163. [Google Scholar] [CrossRef]
  42. Penzkofer, A.; Hegemann, P.; Kateriya, S. Organic dyes in optogenetics. In Organic Lasers and Organic Photonics; Duarte, F.J., Ed.; IOP Publishing: Bristol, UK, 2018; pp. 13-1–13-114. [Google Scholar]
  43. Adam, Y.; Kim, J.J.; Lou, S.; Zhao, Y.; Xie, M.E.; Brinks, D.; Wu, H.; Mostajo-Radji, M.A.; Kheifets, S.; Parot, V.; et al. Voltage imaging and optogenetics reveal behaviour-dependent changes in hippocampal dynamics. Nature 2019, 569, 413–417. [Google Scholar] [CrossRef] [Green Version]
  44. Penzkofer, A.; Silapetere, A.; Hegemann, P. Absorption and emission spectroscopic investigation of the thermal dynamics of the Archaerhodopsin 3 based fluorescent voltage sensor QuasAr1. Int. J. Mol. Sci. 2019, 20, 4086. [Google Scholar] [CrossRef] [PubMed] [Green Version]
  45. Penzkofer, A.; Silapetere, A.; Hegemann, P. Photocycle dynamics of the Archaerhodopsin 3 based fluorescent voltage sensor QuasAr1. Int. J. Mol. Sci. 2020, 21, 160. [Google Scholar] [CrossRef] [PubMed] [Green Version]
  46. Lou, S.; Adam, Y.; Weinstein, E.N.; Williams, E.; Williams, K.; Parot, V.; Kavokine, N.; Liberles, S.; Madisen, L.; Zeng, H.; et al. Genetically targeted all-optical electrophysiology with a transgenic Cre-dependent Optopatch mouse. J. Neurosci. 2016, 36, 11059–11073. [Google Scholar] [CrossRef] [PubMed]
  47. Penzkofer, A.; Luck, M.; Mathes, T.; Hegemann, P. Bistable retinal Schiff base photodynamics of histidine kinase rhodopsin HKR1 from Chlamydomonas reinhardtii. Photochem. Photobiol. 2014, 90, 773–785. [Google Scholar] [PubMed]
  48. Chen, R.F. Fluorescence quantum yields of tryptophan and tyrosine. Anal. Lett. 1967, 1, 35–42. [Google Scholar] [CrossRef]
  49. Eisinger, J.; Navon, G. Fluorescence quenching and isotope effect of tryptophan. J. Chem. Phys. 1969, 50, 2069–2077. [Google Scholar] [CrossRef]
  50. Kirby, E.P.; Steiner, R.F. The influence of solvent and temperature upon the fluorescence of indole derivatives. J. Phys. Chem. 1970, 74, 4480–4490. [Google Scholar] [CrossRef]
  51. Reineck, P.; Francis, A.; Orth, A.; Lau, D.W.M.; Nixon-Luke, R.D.V.; Rastogi, I.D.; Razali, W.A.W.; Cordina, N.M.; Parker, L.M.; Sreenivasan, V.K.A.; et al. Brightness and photostability of emerging red and near-IR fluorescent nanomaterials for bioimaging. Adv. Opt. Mater. 2016, 4, 1549–1557. [Google Scholar] [CrossRef]
  52. Penzkofer, A.; Scheib, U.; Hegemann, P.; Stehfest, K. Absorption and emission spectroscopic investigation of thermal dynamics and photo-dynamics of the rhodopsin domain of the rhodopsin-guanylyl cyclase from the aquatic fungus Blastocladiella emersonii. BAOJ Phys. 2016, 2, 6. [Google Scholar]
  53. Penzkofer, A.; Stierl, M.; Hegemann, P.; Kateriya, S. Thermal protein unfolding in photo-activated adenylate cyclase nano-clusters from the amoeboflagellate Naegleria gruberi NEG-M strain. J. Photochem. Photobiol. A Chem. 2011, 225, 42–51. [Google Scholar] [CrossRef]
  54. Weigand, R.; Rotermund, F.; Penzkofer, A. Aggregation dependent absorption reduction of indocyanine green. J. Phys. Chem. A 1997, 101, 7729–7734. [Google Scholar] [CrossRef]
  55. Penzkofer, A.; Shirdel, J.; Zirak, P.; Breitkreuz, H.; Wolf, E. Protein aggregation studied by forward light scattering and light transmission analysis. Chem. Phys. 2007, 342, 55–63. [Google Scholar] [CrossRef]
  56. Holzer, W.; Pichlmaier, M.; Penzkofer, A.; Bradley, D.D.C.; Blau, W.J. Fluorescence spectroscopic behavior of neat and blended polymer thin films. Chem. Phys. 1999, 246, 445–462. [Google Scholar] [CrossRef]
  57. Penzkofer, A. Photoluminescence behavior of riboflavin and lumiflavin in liquid solutions and solid films. Chem. Phys. 2012, 400, 142–153. [Google Scholar] [CrossRef]
  58. Madge, D.; Wong, R.; Seybold, P.G. Fluorescence quantum yields and their relation to lifetimes of rhodamine 6G and fluorescein in nine solvents: Improved absolute standards for quantum yields. Photochem. Photobiol. 2002, 75, 327–334. [Google Scholar]
  59. Birkmann, C.; Penzkofer, A.; Tsuboi, T. Fluorescence excitation spectroscopic characterization of colour centres in a LiF crystal. Appl. Phys. B 2003, 77, 625–632. [Google Scholar] [CrossRef]
  60. Dörr, F. Spectroscopy with polarized light. Angew. Chem. Int. Ed. 1966, 5, 478–495. [Google Scholar] [CrossRef]
  61. Lindsey, J. PhotochemCAD Spectra by Category. Available online: https://omlc.org/spectra/PhotochemCAD/html/ (accessed on 7 July 2019).
  62. Tsuboi, T.; Penzkofer, A.; Lammel, O. Oscillator strength of F2- colour centres in LiF crystal. Opt. Quantum Electron. 2003, 35, 267–274. [Google Scholar] [CrossRef]
  63. Strickler, S.J.; Berg, R.A. Relationship between absorption intensity and fluorescence lifetime of molecules. J. Chem. Phys. 1962, 37, 814–822. [Google Scholar] [CrossRef] [Green Version]
  64. Birks, J.B.; Dyson, D.J. The relations between the fluorescence and absorption properties of organic molecules. Proc. R. Soc. Lond. Ser. A 1963, 275, 135–148. [Google Scholar]
  65. Deshpande, A.V.; Beidoun, A.; Penzkofer, A.; Wagenblast, G. Absorption and emission spectroscopic investigation of cyanovinyldiethylaniline dye vapors. Chem. Phys. 1990, 142, 123–131. [Google Scholar] [CrossRef] [Green Version]
  66. Weigand, R.; Rotermund, F.; Penzkofer, A. Degree of aggregation of indocyanine green in aqueous solutions determined by Mie scattering. Chem. Phys. 1997, 220, 373–384. [Google Scholar] [CrossRef]
  67. Bohren, G.F.; Huffman, D.R. Absorption and Scattering of Light by Small Particles; John Wiley and Sons: Hoboken, NJ, USA, 1983; pp. 3–429. [Google Scholar]
  68. Gratz, H.; Penzkofer, A.; Weidner, P. Nanometer particle size, pore size, and specific surface determination of colloidal suspensions and porous glasses by Rayleigh light scattering. J. Non Cryst. Solids 1995, 189, 50–54. [Google Scholar] [CrossRef]
  69. Fleming, G.R. Chemical Applications in Ultrafast Spectroscopy; Oxford University Press: New York, NY, USA, 1986; pp. 179–195. [Google Scholar]
  70. Voet, D.; Voet, J.G. Biochemistry, 4th ed.; John Wiley & Sons: Hoboken, NJ, USA, 2004; pp. 482–505. [Google Scholar]
Figure 1. Absorption coefficient spectrum of a fresh thawed Archon2 sample in pH 8 Tris buffer at room temperature. Solid curve: measured absorption coefficient spectrum αa,Archon2(λ). Dashed curve: absorption coefficient spectrum αa,Ret_586(λ) of PRSB Ret_586. Dotted curve: absorption coefficient spectrum of residual retinal components αa,residual retinals(λ) = αa,Archon2(λ) − αa,Ret_586(λ).
Ijms 21 06576 g001
Figure 2. Fluorescence emission quantum distributions of fresh thawed Archon2 in pH 8 Tris buffer at room temperature. The fluorescence excitation wavelengths λF,exc are indicated in the sub-figures.
Ijms 21 06576 g002
Figure 3. Dependence of the total fluorescence quantum yield ϕF on fluorescence excitation wavelength λF,exc for fresh thawed Archon2 in pH 8 Tris buffer.
Ijms 21 06576 g003
Figure 4. Heating-cooling cycle behavior of a fresh thawed Archon2 sample in pH 8 Tris buffer. (a) Attenuation coefficient spectra α(λ) development during stepwise sample heating up (top part) and cooling down (bottom part). Inset in top part: temperature-dependent attenuation coefficient development α(800 nm) during sample heating up. ϑm indicates apparent melting temperature position. (b) Absorption coefficient spectra αa(λ) development during stepwise sample heating up. Left inset: temperature-dependent absorption coefficient development αa(586 nm) and αa(380 nm). Right inset: applied heating and cooling temperature profile ϑ(t).
Ijms 21 06576 g004
Figure 5. Temporal development of absorption coefficient spectra αa(λ,tstorage) of Archon2 in pH 8 Tris buffer stored in the dark at room temperature (ϑ = 21 ± 1 °C). The storage times are listed in the legend (tstorage = 0 shows the absorption coefficient spectrum immediately after sample thawing and centrifugation). The inset shows the temporal development of αa(586 nm) (S0–S1 absorption of Ret_586) and of αa(372 nm) (S0–Sn absorption of Ret_586 and absorption of residual retinal isomers present in Archon2).
Ijms 21 06576 g005
Figure 6. Temporal development of attenuation coefficient spectra α(λ,tstorage) of Archon2 in pH 8 Tris buffer stored in the dark at temperature ϑ = 3 ± 1 °C. The storage times are listed in the legend (tstorage = 0 shows the absorption coefficient spectrum immediately after sample thawing and centrifugation). The inset shows the temporal development of α(586 nm) (S0–S1 absorption of Ret_586), of α(372 nm) (S0–Sn absorption of Ret_586 and absorption of residual retinal isomers present in Archon2), and α(280 nm) (dominant Trp absorption of apoprotein).
Ijms 21 06576 g006
Table 1. Comparison of thermal behavior of Archon2 with QuasAr1.
ParameterArchon2QuasAr1
C (mol dm−3)2.01 × 10−52.76 × 10−5
Fresh Thawed Sample
Dominant PRSBRet_586Ret_580
λa,max (nm)586580
κ0.7840.862
σaa,max) (cm2)1.485 × 10−161.593 × 10⁻¹⁶
σa,int (cm)5.75 × 10−136.1 × 10⁻¹³
f0.5460.58
ϕF(1.05 ± 0.15) × 10−2(6.5 ± 0.5) × 10−3
Bmax (M−1cm−1)408 ± 60270 ± 20
τrad (ns)10.19.32
τF,SB (ps)10661.5
Heat Denatured Sample
ϑm (°C)63 ± 365 ± 3
Dominant RSBRet_380Ret_380
λa,max (nm)380380
σaa,max) (cm2)9.08 × 10−177.4 × 10⁻¹⁷
σa,int (cm)5.95 × 10−135.2 × 10⁻¹³
f0.560.49
ϕF0.008 ± 0.001≈0.04
τrad (ns)3.313.74
τF (ps)26.5150
Aging at Room Temperature
ϑ (°C)21 ± 121–25
tonset of light scattering (h)≈48≈12
α a ( λ a , max ) / t s t o r a g e | t s t o r a g e = 0 α a ( λ a , max , t s t o r a g e = 0 ) (d−1)≈0.14≈0
Ground-state isomerizationnoyes
Aging at Refrigerator Temperature
ϑ (°C)3 ± 12.5 ± 0.5
tonset of light scattering (d)>22≈50
α a ( λ a , max ) / t s t o r a g e | t s t o r a g e = 0 α a ( λ a , max , t s t o r a g e = 0 ) (d−1)≈0.150.054
Ground-state isomerizationnosmall
Abbreviations: C: applied protein molar concentration of fresh thawed sample. λa,max: wavelength position of maximum absorption cross-section of the S0–S1 absorption band of the considered retinal Schiff base isomer. κ: fraction of protonated retinal Schiff base. σaa,max): absorption cross-section at λa,max. σa,int: absorption cross-section integral of considered S0-S1 absorption band. f: oscillator strength. ϕF: fluorescence quantum yield. Bmax: maximum molar fluorescence brightness. τrad: radiative lifetime. τF,SB: Strickler-Berg fluorescence lifetime. ϑ: temperature. tonset of light scattering: time of sample storage in the dark before observation of light scattering. ( α a ( λ a , max ) / t s t o r a g e | t s t o r a g e = 0 ) / α a ( λ a , max , t s t o r a g e = 0 ) : initial rate of absorption decrease at λa,max.

