Article

Dynamic Transcriptome Analysis Reveals Uncharacterized Complex Regulatory Pathway Underlying Dose IBA-Induced Embryogenic Redifferentiation in Cotton

1
State Key Laboratory of Crop Biology, College of Agronomy, Shandong Agricultural University, Tai’an 271018, China
2
College of Life Sciences, Huaibei Normal University, Huaibei 235000, China
*
Author to whom correspondence should be addressed.
These authors contributed equally to this work.
Int. J. Mol. Sci. 2020, 21(2), 426; https://doi.org/10.3390/ijms21020426
Submission received: 18 October 2019 / Revised: 3 January 2020 / Accepted: 7 January 2020 / Published: 9 January 2020
(This article belongs to the Special Issue Plant Respiration)

Abstract

:
The somatic embryogenesis (SE) process of plants is regulated by exogenous hormones. During the SE, different genes sensitively respond to hormone signals through complex regulatory networks to exhibit plant totipotency. When cultured in indole-3-butyric acid (IBA) concentration gradient medium supplemented with 0 mg dm−3, 0.025 mg dm−3, and 0.05 mg dm−3 IBA, the callus differentiation rate first increased then decreased in cotton. To characterize the molecular basis of IBA-induced regulating SE, transcriptome analysis was conducted on embryogenic redifferentiation. Upon the examination of the IBA’s embryogenic inductive effect, it was revealed that pathways related to plant hormone signal transduction and alcohol degradation were significantly enriched in the embryogenic responsive stage (5 days). The photosynthesis, alcohol metabolism and cell cycle pathways were specifically regulated in the pre-embryonic initial period (20 days). Upon the effect of the IBA dose, in the embryogenic responsive stage (5 days), the metabolism of xenobiotics by the cytochrome P450 pathway and secondary metabolism pathways of steroid, flavonoid, and anthocyanin biosynthesis were significantly enriched. The phenylpropanoid, brassinosteroid, and anthocyanin biosynthesis pathways were specifically associated in the pre-embryonic initial period (20 days). At different developmental stages of embryogenic induction, photosynthesis, flavonoid biosynthesis, phenylpropanoid biosynthesis, mitogen-activated protein kinase (MAPK) signaling, xenobiotics metabolism by cytochrome P450, and brassinosteroid biosynthesis pathways were enriched at low a IBA concentration. Meanwhile, at high IBA concentration, the carbon metabolism, alcohol degradation, circadian rhythm and biosynthesis of amino acids pathways were significantly enriched. The results reveal that complex regulating pathways participate in the process of IBA-induced redifferentiation in cotton somatic embryogenesis. In addition, collections of potential essential signaling and regulatory genes responsible for dose IBA-induced efficient embryogenic redifferentiation were identified. Quantitative real-time PCR (qRT-PCR) was performed on the candidate genes with different expression patterns, and the results are basically consistent with the RNA-seq data. The results suggest that the complicated and concerted IBA-induced mechanisms involving multiple cellular pathways are responsible for dose-dependent plant growth regulator-induced SE. This report represents a systematic study and provides new insight into molecular signaling and regulatory basis underlying the process of dose IBA-induced embryogenic redifferentiation during SE.

Graphical Abstract

1. Introduction

Somatic embryogenesis (SE) is a process by which embryogenic differentiation is generated directly from somatic cells, similarly to the development of zygotic embryos, and it involves the developmental reprogramming of somatic cells toward the embryogenesis pathway. Somatic embryogenesis can be carried out in vitro under artificially controlled conditions to generate the most complete cell totipotency. Somatic embryogenesis plays an important role in cell fusion, genetic engineering, and somaclonal variation. SE was discovered in the 1950s [1]. Since then, scientists have conducted extensive research on the mechanism of somatic embryogenesis. It has been concluded that under artificially controlled in vitro conditions, plant somatic cells can regain their ability to regenerate after cell dedifferentiation and redifferentiation and can develop into seedlings. At present, more than 100 species are known to be capable of plant regeneration through somatic embryogenesis, mainly including alfalfa, soybean, cotton, spruce, pine and cypress. However, few of the molecular events involved in the transition of a somatic cell to an embryogenic-competent cell are known thus far [2,3].
Cotton is globally one of the most important commercial crops. Biotechnology approaches, including genetic engineering and tissue culture, have been widely applied to cotton breeding. All transgenic cotton production demands a productive plant regeneration procedure from the somatic cells in cotton. Cotton transgenic technology relies heavily on somatic embryogenesis [4]. Genotypes have a decisive influence on somatic embryogenesis in cotton. Xie et al. [5] believed that the genotype of the material is the first factor to affect the somatic embryogenesis and plant regeneration of cotton, followed by the type of phytohormone and its concentration. Since the 1970s, more than 100 cotton varieties have been used for tissue culture research. Approximately one half of these materials have embryogenic ability, while the remaining half are unable or extremely unlikely to induce somatic embryos [6,7]. Most cultivars have been recalcitrant, and few reports of high-frequency regeneration in cotton via SE have come forth, due to a genotype-dependent response [8,9,10].
Exogenous hormones are another important factor that induce somatic embryogenesis in cotton in addition to genotype. Currently, 2, 4-dichlorophenoxyacetic acid (2, 4-D), indole-3-butyric acid (IBA) and kinetin (KT) are commonly used. Some scholars have pointed out that among all auxins and auxin analogues, 2, 4-D has a relatively good effect on promoting the induction of explant callus [8,11,12,13]. Furthermore, the addition of 2, 4-D in a suspension culture contributes to the formation of somatic embryos [14]. It has been reported that the combination of IBA and KT hormones contributes to embryogenic callus (EC) differentiation [12,15,16,17]. Moreover, the combination of IBA and KT has good effects on some stubborn varieties in which induced differentiation has been difficult. Zhu et al. [15] found that simultaneous treatment with 2, 4-D, indole acetic acid (IAA) and KT yielded better effects, but the calli induced by the 2, 4-D medium must be transformed to 2, 4-D removed or replaced medium to ultimately undergo somatic embryogenesis. If 2, 4-D was removed and the hypocotyl segment was inoculated with ZSW-2 (Murashige and Skoog (MS) + 0.1 mg dm−3 KT + 0.1–0.5 mg dm−3 IBA + 3% (w/v) glucose + 6.5 g dm−3 agar, pH 6.2) [15] medium containing only KT and IBA, the ideal state of callus was achieved, and, therefore, the appropriate ratio of cytokinin and auxin yields a better induction rate. Chen et al. [18] found that an MSB (MS inorganic salt + B5 vitamin) medium supplemented with IBA could directly induce embryogenic calli and that appropriate concentrations of KT could promote the effect of IBA. IBA is used to induce root organogenesis [19], but studies have found that either IBA alone or in combination with KT can directly induce a certain amount of embryogenic callus from the hypocotyl segment. More extensive experiments are yet to be done to determine the mechanism through which IBA acts.
Furthermore, the auxin and cytokinin signaling pathways play an important regulatory role in cotton somatic cell dedifferentiation and embryogenic cell redifferentiation [20,21,22,23]. Cotton plantlets can be regenerated via SE using various combinations of plant growth regulators, such as 2, 4-dichlorophenoxyacetic acid (2, 4-D), indole-3-butyricacid (IBA), and naphthalene acetic acid (NAA) in combination with Kinetin (KT) [24]. Global transcriptome analyses have suggested that the auxin and cytokinin signaling pathways are critical in the dedifferentiation of somatic cells and the redifferentiation of SEs in cotton. Additionally, stress-responsive genes and pathways have also been found to be involved in SE [21]. The ethylene response factor (ERF) plays an important role in hormone signal transduction and interconnecting different hormone pathways [25]. Despite these reports, we still know little about the molecular mechanisms underlying plant growth regulator-induced SE in cotton.
Scientists found that auxin plays an important role in this process [21] while using small RNA sequencing (sRNA-seq) and degradome sequencing to find multiple small RNAs and their targets in somatic embryos. The occurrence of differential expression [26] indicates that cotton somatic embryogenesis is regulated by complex gene expression. With the development of next-generation sequencing technology and the continuous improvement of cotton genome information [27,28], more than 5000 differential expression genes have been discovered in cotton somatic embryogenesis using digital gene expression (DGE) technology. Our primary strategy was to use transcriptome sequencing techniques with the YZ-1 genotype material of highly embryogenic to identify genes expressed during early induction of SE under induction culture treatment in the IBA concentration gradient medium.

2. Results

2.1. Callus Differentiation Rate of Cotton Induced by Different IBA Concentration and KT Combinations

Hypocotyl segments 5–7 mm in size were cultured on an MS medium supplemented with 0.1 mg dm−3 2, 4-D and 0.1 mg dm−3 KT (this hormone combination is named C3 in the following description). After 6 weeks of culture, all explants were transferred to different IBA concentration gradient mediums to induce embryogenic callus. The rate of embryogenic callus induction was calculated after 30 days. The results show that the callus tissue differentiation rate was the lowest on the medium supplemented with 0.1 mg dm−3 KT alone. After adding different IBA based on the 0.1 mg dm−3 KT, the callus tissue differentiation rate increased significantly, especially in the 0.1 mg dm−3 KT + 0.025 mg dm−3 IBA medium (Table 1). The use of KT and IBA in the differentiation process of cotton calli is beneficial.

2.2. Density Distribution of Reads on Chromosomes

The total reads were mapped to all of the chromosomes in the genome, as shown in Figure A1. The specific mapping method was used to calculate the number of reads aligned to the base position in the window, calculate its depth distribution on the chromosome, and take the log2 value. Under optimal conditions, the longer the length of the entire chromosome, the more reads localized within the chromosome. From the diagram of the relationship between the number of reads localized in the chromosome and the length of chromosome, the uniformity of sequencing can be seen more intuitively.

2.3. Screening of Differentially Expressed Genes

The Reads Per Kilo bases per Million reads (RPKM) method was used to calculate the gene expression level. The sequencing depth and gene length were also normalized, making the gene expression levels estimated for different lengths of genes at different sequencing depths comparable.
Volcano plots were drawn based on the results of the tests and were screened according to the differential significance criteria (greater than two-fold changes in the expression of differential genes and FDR ≤ 0.05), and the statistically significant differences in gene expression were measured (Figure 1). The volcano plot indicates that there are many genes up- and down-regulated in callus tissue compared to the C0 treatment group (Figure 1a,b).

2.4. Overall Transcriptome Sequencing Analysis

In the process of cotton somatic embryogenesis, transcriptome sequencing analysis was used by high-throughput sequencing technology. Comparing with the database, 1542–11,235 genes were matched to the Non-Redundant Protein Sequence Database in GenBank (Nr), 1038–7564 genes were matched to the Gene Ontology (GO) database, and 333–2828 genes were matched to the Kyoto Encyclopedia of Genes and Genomes (KEGG) database (Table 2).

2.5. Screening of Differentially Expressed Genes from Venn Diagram between Different Comparison Groups

Transcriptome analysis found 1211 common genes expressed during 2, 4-D-induced dedifferentiaion (24D-C3-0D) compared with series of IBA-induced redifferentiaion (Figure 2). In the embryogenic responsive stage of redifferentiation, the higher IBA concentration (24D-C3-0D VS IBA-C2-5D) induced much more specific expression genes (4936) compared with 1876 genes in the lower IBA (24D-C3-0D VS IBA-C1-5D) (Figure 2), but the callus differentiation rate was low (52.63% VS 72.22%) (Table 1). The results suggest that excessive expression genes are activated in the higher concentration, but this is not beneficial to embryogenic responsiveness for redifferentiation (5 days). An appropriate and concerted amount of gene expression facilitates differentiation. As in the pre-embryonic initial period (20 days), the callus could adapt to different IBA concentrations—therefore, the specific expressed genes have little difference post responsive stage.

2.6. Type and Number of Alternative Splicing

Variable splicing allows a gene to produce multiple mRNA transcripts, and different mRNAs may be translated into different proteins. Therefore, multiple proteins can be produced by the variable splicing of a gene, which greatly increases protein diversity. ASprofile software (http://ccb.jhu.edu/software/ASprofile/, v1.0.4, The Center for Computational Biology at Johns Hopkins University, Baltimore, MD, USA) was used to classify and count the variable splicing events of StringTie (v1.0.4)-predicted transcripts, as shown in Figure 3. There were many variable splicing events in all samples. The results show that the overall patterns of variable splicing events were similar among all samples, with more than 66% of the variable splicing events being concentrated in the TTS (Alternative 3′ last exon), TSS (Alternative 5′ first exon), and AE (Alternative exon ends (5′ 3′, or both) categories. The results indicate that there is no difference between the samples treated with different IBA concentrations. Variable splicing events proceed steadily and are not affected by different IBA concentrations.

2.7. Functional Annotation of Differentially Expressed Genes

GO level secondary gene annotation of differentially expressed genes (DEGs) during somatic embryogenesis in cotton was induced by applying different IBA serial concentration gradients. These results indicate that the relative differential gene expression patterns induced by different IBA concentrations are similar (Figure A2), while the scale of differentially induced genes is greatly different (Table 2).
When comparing different IBA concentrations in the C0-5D VS IBA-C1-5D, C0-5D VS IBA-C2-5D groups (Figure A2a,b) at 5 d when plant hormone IBA was added, the number of differential genes increased with increasing concentrations of IBA. When comparing different IBA concentrations in the C0-20D VS IBA-C1-20D and C0-20D VS IBA-C2-20D groups (Figure A2c,d) at 20 days when plant hormone IBA was added, the number of differential genes decreased with increasing concentrations of IBA. In the same concentration when comparing 5 days with 20 days, the number of differential genes decreased with the increase in culture time.

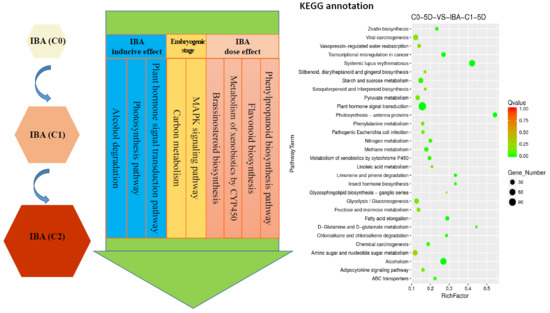
2.8. Differential Metabolic Pathway Analysis

2.8.1. Enriched Metabolic Pathway in Comparison Groups with and without IBA

IBA had a great influence on the differentiation rate, and the callus differentiation rate was very low (7.81%) when IBA was not added. The differentiation rate upon the addition of IBA significantly increased (72.22%) nearly nine-fold.
To analyze the differential genes related to the IBA-induced cotton callus differentiation rate, we chose a combination of samples treated with IBA and without IBA to find the metabolic pathway that affected the differentiation rate. The high-differentiation combination selected was 0.1 mg dm−3 KT+ 0.025 mg dm−3 IBA, and the poorly differentiated combination was 0.1 mg dm−3 KT + 0 mg dm−3 IBA. At 5 d, the metabolic pathways for differentially expressed genes were significantly enriched in plant hormone signal transduction, zeatin biosynthesis, starch and sucrose metabolism, nitrogen metabolism, methane metabolism, metabolism of xenobiotics by cytochrome P450, fatty acid elongation, alcohol degradation, and ABC transporters (Figure 4a). The plant hormone signal transduction pathway was highly enriched at 5 d, indicating that these series endogenous critical corresponding genes were induced and stimulated greatly by external IBA. At 20 days, the pathways with differentially expressed genes were significantly enriched in photosynthetic-antennary proteins, photosynthesis, mineral absorption, cell cycle, carbon fixation in photosynthetic organisms, alcohol degradation, and ABC transporters (Figure 4b). The pathways enriched in photosynthesis, photosynthetic-antennary proteins, and carbon fixation in photosynthetic organisms indicated that genes related to photosynthesis were also essential in the cotton SE, especially at 20 days. The alcohol degradation pathway was significantly enriched in both periods, and these enriched differential genes were upregulated, which suggests that the alcohol degradation pathway may play a positive role in IBA-induced cotton somatic embryogenesis. The differentially expressed genes (photosystem II proteins PSBQ2, PSBS, PSBW, and ferredoxin SEND33) that were significantly enriched in photosynthetic pathways were downregulated at 20 days. Differential genes enriched in cell cycle pathways were upregulated, indicating that the photosynthetic pathway plays a negative regulatory role and the cell cycle pathway plays a positive regulatory role in somatic embryogenesis.

2.8.2. Enriched Differential Metabolic Pathway in Different IBA Doses

When adding different concentrations of IBA, the frequency of callus differentiation induced in cotton was also different. Compared with the ideal concentration of 0.025 mg dm−3, a high concentration of 0.05 mg dm−3 inhibited embryonic differentiation. To analyze the difference in dose effects of IBA, we compared the concentration of 0 mg dm−3, 0.025 mg dm−3, and 0.05 mg dm−3 of IBA and found that the metabolism of xenobiotics by the cytochrome P450 pathway was enriched both in C0-5D VS IBA-C1-5D and IBA-C1-5D VS IBA-C2-5D (Figure 4a, Figure 5a). This indicated that the metabolism of xenobiotics by the cytochrome P450 pathway was dose-dependently expressed. In IBA-C1-5D VS IBA-C2-5D (Figure 5a), the specific enriched pathways were involved in secondary metabolisms such as steroid biosynthesis, flavonoid biosynthesis, and anthocyanin biosynthesis. Corresponding to the phenotypic results, the IBA concentration increases, while the differentiation rate of callus decreases. Therefore, we conclude that the secondary metabolites such as steroids, flavonoids, and anthocyanin may not be conducive to differentiation. At 20 days, photosynthesis-antenna pathway proteins were enriched in both C0-20D VS IBA-C1-20D and IBA-C1-20D VS IBA-C2-20D (Figure 4b, Figure 5b). In IBA-C1-20D VS IBA-C2-20D, the significantly enriched relevant pathways were phenylpropanoid biosynthesis, brassinosteroid biosynthesis and anthocyanin biosynthesis. We speculated that secondary metabolism affects the somatic embryogenesis of cotton. In particular, the results showed that in the IBA-induced cotton calli pre-embryonic initial period (20 days), the phenylpropanoid biosynthesis pathway, which has broad physiological activities and is related to plant growth regulation, was most highly enriched in comparison group of IBA-C1-20D VS IBA-C2-20D.

2.8.3. Enriched Differential Metabolic Pathway with Different Culture Times

With the ideal IBA concentration of 0.025 mg dm−3, we compared samples at 0 day, 5 days, and 20 days. In the embryogenic responsive stage (5 days), the photosynthesis, flavonoid biosynthesis, phenylalanine metabolism pathways were significantly enriched. And in the pre-embryonic initial period (20 days), the differentially enriched pathways were those of phenylpropanoid biosynthesis, MAPK signaling, glutathione metabolism, fatty acid elongation and brassinosteroid biosynthesis. (Figure 6a,b). Therefore, it is suggested that the pathways above and the corresponding signaling and regulatory genes essentially affect cotton somatic embryogenesis in low IBA concentrations.
When the IBA concentration was 0.05 mg dm−3 and we compared samples at 0 day, 5 days and 20 days, it was found that the differentially enriched pathways were those of carbon metabolism, alcohol degradation, fatty acid degradation, circadian rhythm, carbon fixation in photosynthetic organisms, and biosynthesis of amino acids. The results show that in IBA-induced cotton embryogenic redifferentiation (0.05 mg dm−3), the carbon metabolism pathway is highly enriched in the comparison groups of 24D-C3-0D VS IBA-C2-5D and IBA-C2-5D VS IBA-C2-20D simultaneously (Figure 6c,d). We speculated that dominant carbon metabolism sequentially affects somatic embryogenesis of cotton at high IBA concentrations.

2.9. Expression Profiles of Major Genes Associated with SE Regulation

Transcriptome analysis showed that the complicated and concerted IBA-induced multiple cellular pathways, as well as the corresponding signaling and regulatory genes, are responsible for plant growth regulator-induced SE. We comprehensively explored and mined the significantly representative regulatory pathway and essential genes for cotton SE enriched by KEGG analysis (Table 3), and candidate SE-related crucial transcription factor genes that were not enriched by KEGG (Table 4).

2.10. Candidate Gene Expression Pattern Validation

The differentially expressed genes analyzed in the expression profiling were verified using real-time fluorescence quantitative PCR. Six genes were randomly selected for validation. These six genes include endochitinases (CHIT1B), calcineurin B-like protein (CBL4), peroxidase (PER73), cytochrome P450 (CYP82A3), auxin response factor (ARF4), and auxin-inducible protein (AUX22B). Endochitinase (CHIT1B) plays an important role in somatic embryogenesis. For example, carrot embryogenic callus contains glycosylated acidic endochitinase, which can promote somatic embryogenesis. The endochitinase in sugar beet can also promote the early progression of this process. It is suggested that endochitinase is related to some somatic embryogenesis signal molecules. Calcineurin B-like protein (CBL4) was selected from the calcium signaling pathway. CBLs represent a family of plant calcium-binding proteins that function in calcium signaling by interacting with their interacting protein kinases. These roles are essential for plant growth and development. Cytochrome P450 (CYP82A3) is enriched in the brassinosteroid biosynthesis pathway. Peroxidase (PER73) was selected from phenylpropanoid biosynthesis pathway. Peroxidase is considered to take part in diverse plant processes, such as auxin metabolism, cell wall elongation and stiffening, and it is also related to different metabolic pathways to regulate somatic embryogenesis [29,30]. ARF4 and AUX22B genes were selected from the plant hormone signal transduction pathway, which are the two key transcription factors involved in regulating the expression of auxin-responsive genes. Auxin response factor (ARFs) is considered as essential SE genes that are specifically activated during embryogenic differentiation [31,32,33,34]. ARFs bind auxin response promoter elements, mediate transcriptional responses to auxin and regulate auxin-mediated transcriptional activation/repression, together with Aux/IAA [35,36]. Three repetitions of the biological experiments were performed. The results are shown in Figure 7. The results of the fluorescent quantitative PCR analysis are basically consistent with the gene expression patterns obtained by RNA-sequencing, indicating that the transcriptome data are reliable and that these genes are regulated during hormone-induced somatic embryogenesis in cotton. Their role can be determined by further studying their function.

3. Discussion

Somatic embryogenesis (SE) is a very complex biological process that is affected by genotypes, hormones, stress, light, mineral elements, nitrogen sources, and carbon sources in the medium. However, somatic cells under the influence of various internal and external factors initiate the expression of certain specific genes and then redifferentiate into embryonic cells. Comparative transcriptome analysis is useful to dissect the molecular mechanism of SE. The differentiation ability of plants is affected by the interaction of two factors in vivo and in vitro. Therefore, this experiment detected endogenous gene changes through exogenous IBA treatment and tried to find endogenous factors responding to exogenous IBA changes, to provide a reliable theoretical and experimental basis for cotton somatic embryogenesis.

3.1. IBA Embryogenic Inductive Effect and Dose Effect During Differentiation of Cotton SE

In this experiment, we found that different concentrations of IBA had different effects on embryonic differentiation, as demonstrated by the differentiation rate statistics in cotton calli. The results (Table 1) show that the combination of 0.1 mg dm−3 KT + 0.025 mg dm−3 IBA induced the highest differentiation rate of cotton. Our callus differentiation rate statistics for exogenously applied auxin and cytokinin were consistent with previous studies, i.e., the induction of EC and SEs, and the concentration of 2, 4-D in the medium was replaced by a combination of IBA and KT [24,37]. In this experiment, the role of auxin and cytokinin was not achieved alone, but by interacting with other pathways and components involved in the differentiation and development of SEs, such as their upstream TF regulators and hormone signaling pathways [38]. Wang et al. [39] found that, in cotton tissue cultures, the effect of IBA is stronger than that of the other auxins or auxin analogues. Comparing 0.025 mg dm−3 and 0.05 mg dm−3, the high concentration of IBA inhibited callus differentiation. Under 0.1 mg dm−3 KT medium, the differentiation rate was lowest, further indicating that cytokinin alone inhibited cell differentiation and that appropriate ratio between auxin and cytokinin is necessary in callus culture. Moreover, these results indicate that the appropriate concentration of IBA is conducive to callus differentiation.
The investigation in this study shows that a series of different IBA concentrations induced similar relative differential gene expression patterns (Figure A2), while the concentrations had different induction rates in cotton somatic embryogenesis (Table 1) and the amount of differentially induced genes were greatly different (Table 2). To resolve different IBA concentration induction rates, we analyzed the different IBA comparison groups under 0 mg dm−3, 0.025 mg dm−3, and 0.05 mg dm−3 concentrations. We found that the metabolism of xenobiotics by the cytochrome P450 and photosynthetic pathway shows a dose-dependent pattern. Meanwhile, the secondary metabolism and phenylpropanoid biosynthesis pathways were significantly enriched. These results indicate that these pathways could essentially affect the somatic embryogenesis of cotton. Previous studies have shown that secondary metabolites in the embryogenic callus are lower than in the nonembryonic callus. This indicates that secondary metabolism is relatively vigorous in a nonembryonic callus, which may affect the main metabolic rate and intensity and, ultimately, the cell differentiation, which is consistent with our findings. Especially, highly enriched phenylpropanoid biosynthesis in our study may play an important role in the SE. The data were consistent with and extended the broad physiological activities and related to plant growth regulation of phenylpropanoid metabolism.

3.2. Plant Hormone Signal Transduction and Alcohol Degradation Pathway in Embryogenic Induction Responsive Stage

The exogenous hormone is essential during cotton somatic embryogenesis [40]. The results in this study show that IBA has a great influence on the differentiation rate, and that the plant hormone signal transduction pathway is significantly enriched in the embryogenic induction responsive stage. It is suggested that the plant growth regulator IBA response generally involves initiating signals through receptor binding, transducing signals through complex downstream molecular events, and inducing changes in cell morphology and metabolism to achieve signal output. The signal of exogenous IBA is recognized by a receptor, thus triggering intracellular transduction and amplification of the signal, and will ultimately lead to cellular and organ responses. Hormone production, signaling and responses can affect plant growth and development, which are of high importance for cotton somatic embryogenesis.
In 1991, Perata P and Alpi A [41] detected the formation of 14C carbon dioxide by adding 14C-labeled ethanol to carrot cell suspensions. They thus deduced that carrot cells had the ability to degrade ethanol. Later, the scientists found that the tobacco callus is able to digest and metabolize ethanol. At the time of cultivation, the tobacco callus converts ethanol into acetic acid, which is almost harmless to plants [42]. Further experiments have also found that plant hormones have a significant regulatory effect on ethanol digestion and metabolism of plants. In this study, when the high differentiation rate IBA combination (0.025 mg dm−3 IBA) was compared with the low differentiation rate IBA combination (0 mg dm−3 IBA), we found that the alcohol degradation pathway was significantly enriched in both 5 days and 20 days cultures (Figure 4), and the genes enriched in this pathway were upregulated. We speculated that the alcohol degradation pathway plays a positive role in the regulation of IBA-induced cotton callus differentiation, which is consistent with previous studies.

3.3. Photosynthesis, Cell Cycle and SERK Pathway During Somatic Embryogenesis in Cotton

When the high differentiation rate of IBA combination (0.025 mg dm−3 IBA) was compared with the low differentiation rate of IBA combination (0 mg dm−3 IBA), the differentially expressed genes (the photosystem II proteins PSBQ2, PSBS, PSBW and ferredoxin SEND33) that were significantly enriched in the photosynthesis pathway were downregulated at 20 days of culture. The differentially expressed genes enriched in the cell cycle pathway (cell division regulatory protein sna41, CDC6B, DNA replication licenser MCM3, cell division cycle protein CDC20-1) were upregulated, indicating that photosynthesis may play a negative regulatory role in somatic embryogenesis, and that the cell cycle plays a positive regulatory role.
Some of the identified genes have been experimentally demonstrated to play an important role in SE [29,35,43,44]. Somatic embryogenesis receptor kinase (SERK) is involved in the signal transduction pathway during somatic embryogenesis and is a marker gene for the embryotic state. Schmidt et al. [45] screened a key gene regulating the transformation of somatic cells into embryonic cells in the hypocotyl regeneration of carrots, and this gene is named SERK1 (somatic embryogenesis receptor protein kinase 1). In this study, GhSERK1 (Gh_A01G0158) was found in four comparison groups, including 24D-C3-0D VS C0-5D, 24D-C3-0D VS IBA-C1-5D, 24D-C3-0D VS IBA-C1-20D, and 24D–C3-0D VS IBA-C2-20D. It was up-regulated in all of them, indicating that the up-regulated expression of SERK plays an important role in cotton somatic embryogenesis induction.

4. Materials and Methods

4.1. Plant Materials and Culture Conditions

One cotton accession, the tetraploid upland cotton species cultivar YZ-1 (Institute of Cotton Research of the Chinese Academy of Agricultural Sciences (CAAS)), which has medium to high somatic embryogenesis, was used for the study. Seeds of the cotton cultivar YZ-1, after uncovering the coats, were sterilized in 0.1% (w/v) HgCl2 (Beijing chemical Co. Ltd, Beijing China) solution for 10 min, then rinsed four times with sterilized distilled water and germinated on a 1/2 MS (Murashige and Skoog) (Qingdao Hope Bio-Technology Co. Ltd, Qingdao, China) medium containing 1.5% (w/v) sucrose (Hushi Co. Ltd, Shanghai, China) and 0.25% (w/v) phytagel (Sigma, St. Louis, MO, USA). Callus initiation was conducted with 5 to 7 mm long hypocotyl sections of YZ-1, as described by Wu et al. [12], in the dedifferentiation induction medium containing MS+ 0.1 mg dm−3 KT (Sigma-Aldrich, Co., St. Louis, MO, USA, purity ≥ 99.0%) + 0.1 mg dm−3 2, 4-D (Sigma-Aldrich, Co., St. Louis, MO, USA, purity ≥ 97.0%) + 30 g dm−3 sucrose+ 2.5 g dm−3 phytagel [46]. Additionally, among the 24D-C3-0D, C3 remarked the concentration of 0.1 mg dm−3 KT+ 0.1 mg dm−3 2, 4-D. Following callus initiation and six weeks of callus proliferation, the calli were subsequently isolated and subcultured in the redifferentiation medium with 0.1 mg dm−3 KT and different degraded exogenous IBA (Sigma-Aldrich, Co., St. Louis, MO, USA, purity ≥ 99.0%) concentrations to induce somatic cell development program reconstruction and embryonic redifferentiation, as described by Zeng et al. [4]. For IBA concentrations, a series of descending concentration gradients were used (0 mg dm−3, 0.025 mg dm−3, and 0.05 mg dm−3) during embryogenic callus induction process. The pH of the medium was 6.0. Primary dedifferentiated calli were respectively sampled at 0 day, 5 days and 20 days after callus initiation. All experimental treatments were set up for three biological replications.

4.2. RNA Extraction, cDNA Library Preparation, and RNA-Seq

The total RNA of each sample was extracted by using the EASYspin Plus plant RNA rapid extraction kit (Aidlab Biotechnologies Co. Ltd., Beijing, China), following the manufacturer’s protocol. The total RNA of each sample was quantified and verified with an Agilent 2100 Bioanalyzer (Agilent Technologies, Santa Clara, CA, USA), NanoDrop2000 (Thermo Fisher Scientific, Inc, Waltham, MA, USA) and 1% agarose gel electrophoresis. Next-generation sequencing libraries were prepared using NEBNext ® Ultra™ RNA Library Prep Kit for Illumina® (NEB, USA), following the manufacturer’s instructions. After library purification (Beckman Agencourt AMPure XP beads), the PCR products were cleaned up using AxyPrep Mag PCR Clean-up (Axygen, Union City, CA), validated using an Agilent 2100 Bioanalyzer, and quantified by Qubit 2.0 Fluorometer (Invitrogen, Carlsbad, CA, USA). Then, the libraries with different indices were multiplexed and loaded on an Illumina HiSeq instrument according to the manufacturer’s instructions (Illumina, San Diego, CA, USA). Sequencing was carried out using a 2 × 150 bp paired-end configuration; image analysis and base calling were conducted using HiSeq Control Software (v2.0.5, HCS, Illumina, San Diego, CA, USA), Off-Line Base caller and GAPipeline-1.6 on the HiSeq instrument.

4.3. Mapping and Differential Expression Analysis

The filtered sequencing clean data were compared with the upland cotton reference genome (https://www.cottongen.org/species/Gossypium_hirsutum/nbi-AD1_genome_v1.1). Hisat2 (v2.0.1) was used to index the reference genome sequences. First, transcripts in fasta format were converted from known gff annotation files and indexed properly. Then, with the file as a reference gene file, HTSeq (v0.6.1) estimated the gene and isoform expression levels from the pair-end clean data. RPKM (Reads Per Kilo bases per Million reads) was applied to calculate the level of the gene expression indifferent groups. The read counts were normalized with DESeq2 (v1.6.3, open source, http://www.bioconductor.org/) [47]. Differentially expressed genes (DEGs) were defined as those with ≥2-fold change and FDR ≤ 0.05. The normalized sequencing data of three replicates with repeatability were used for analysis.

4.4. GO Functional Annotation and KEGG Enrichment Analysis

Gene Ontology (GO) terms describe cellular components, biological processes, and molecular functions of gene sets from differentially expressed genes. GO-TermFinder (v0.86, http://search.cpan.org/dist/GO-TermFinder/) was used to identify GO terms that annotate a list of enriched genes with a significant P-value of less than 0.05. KEGG (Kyoto Encyclopedia of Genes and Genomes) is a collection of databases dealing with genomes, biological pathways, diseases, drugs, and chemical substances (http://en.wikipedia.org/wiki/KEGG). We used scripts in house to determine which KEGG pathways the significantly differentially expressed genes were in.

4.5. Alternative Splicing Analysis

ASprofile v1.0.4 is a suite of programs for extracting, quantifying and comparing alternative splicing (AS) events from RNA-seq data. It took a GTF transcript file created by Cufflinks [48] as its input.

4.6. Validation of RNA-Seq Data by Real-Time RT-PCR

To verify the differentially expressed genes detected by the Illumina RNA-Seq data, real-time RT-PCR (qRT-PCR) was performed on a set of 3 replicates for each sample and the expression levels calculated were based on three technical replicates. Six genes were chosen for digital gene expression analysis. The gene-specific primers (Table A1) were designed using Primer Premier 5.0 software (http://www.premierbiosoft.com/primerdesign/, Premier Biosoft International, Palo Alto, CA, USA) and synthesized by the Shanghai Shenggong Company. The length of the products ranged was 100–300 bp. The cDNA was synthesized using EasyScript One-Step gDNA Removal and cDNA Synthesis SuperMix (TransGen Biotech, Beijing, China) in a 20 mm3. reaction mixture according to the manufacturer’s instructions. For reverse transcription, an RNA-amount of 5 μg was used. A total of 20 mm3 reaction system as follows: Total RNA/mRNA 7 mm3, Anchored Oligo (dT)18 Primer (0.5 μg mm−3) 1 mm3, 2 × TS Reaction mix 10 mm3, Tran Script RT/RI Enzyme Mix 1 mm3, gDNA Remover 1 mm3. The first step was to remove gDNA: added 5 × gDNA Buffer, Total RNA, Rnase-Free ddH2O, 65 °C incubation 5 min. Then, the solution with Anchored Oligo(dT)18 Primer, 2 × TS Reaction mix, and Tran Script RT/RI Enzyme Mix added, was incubated at 42 °C for 15 min. Following this step, Trans Script RT/RI and gDNA Remover enzyme were heat-inactivated at 85 °C for 5 s and subsequently chilled on ice. The obtained cDNA was either subsequently processed or stored at −20 °C until use. qRT-PCR was performed in 15 mm3 reactions on the Real-Time PCR Thermal Cycler (Analytik Jena AG, qTOWER3 G, Germany), using 1.5 mm3 of first-strand cDNA as the template, 7.5 mm3 of 2 × UltraSYBR Mixture (with ROX) (CWBIO, Beijing, China), 1.2 mm3 each of 10 μM forward and reverse gene-specific primer and 3.6 mm3 of ddH2O. GhUB7 was used as the reference gene. The qRT-PCR conditions were as follows; pre-incubation at 95 °C for 10 min, followed by amplification by 38 cycles at 95 °C for 15 s, 60 °C for 30 s, and 72 °C for 30 s. A melting curve analysis was conducted to evaluate the primer specificity for each primer set to verify the presence of a single melting peak after amplification. The melting curve analysis conditions were as follows: 95 °C 15 s, 60 °C 1 min, 95 °C 15 s, 60 °C 15 s.

Author Contributions

Data curation, Y.F., H.G. (Huihui Guo) and L.Z.; Formal analysis, F.Z., Y.F., X.Y. and H.G. (Huihui Guo). Funding acquisition, F.Z.; Investigation, Y.F., X.Y., H.G. (Huihui Guo) and J.W.; Methodology, X.Y., H.G. (Huihui Guo), J.W., H.G. (Haixia Guo) and L.Z.; Resources, J.W., H.G. (Haixia Guo) and L.Z.; Supervision, F.Z.; Writing—original draft, Y.F. and X.Y.; Writing—review & editing, F.Z. and H.G. (Huihui Guo). All authors have read and agreed to the published version of the manuscript.

Acknowledgments

This work was supported by National Key Research and Development Program (2016YFD0100306, 2016YFD0100303), Taishan Scholar Talent Project from PRC (TSQN20161018) and the National Natural Science Foundation of China (31401428).

Conflicts of Interest

The authors declare no conflict of interest.

Abbreviations

DEGDifferentially expressed gene
DGEDigital gene expression
ECEmbryogenic callus
ERFEthylene response factor
GOGene Ontology
IAAIndole acetic acid
IBAIndole-3-butyric acid
KEGGKyoto Encyclopedia of Genes and Genomes
KTKinetin
MAPKMitogen-activated protein kinase
MSMurashige and Skoog
NAANaphthalene acetic acid
NRNon-redundant Protein Sequence Database in GenBank
RPKMReads Per Kilo bases per Million reads
RT-PCRReverse-transcription-polymerase chain reaction
SESomatic embryogenesis
SERKSomatic embryogenesis receptor kinase
2, 4-D2, 4-dichlorophenoxyacetic acid

Appendix A

Figure A1. Density distribution map of reads on chromosomes. Ordinate is the depth distribution of the sequence on the chromosome, and log2 value is taken. Abscissa is the length of the chromosome. (A01–A13 refers to chromosome 01–13 in cotton A genome, and D01-D13 refers to chromosome 01–13 in cotton D genome).
Ijms 21 00426 g0a1
Figure A2. Histogram of Gene Ontology annotation of DEGs from samples treated with different IBA concentrations. (a) Enriched GO terms in C0-5D VS IBA-C1-5D; (b) Enriched GO terms in C0-5D VS IBA-C2-5D; (c) Enriched GO terms in C0-20D VS IBA-C1-20D; (d) Enriched GO terms in C0-20D VS IBA-C2-20D. IBA: indole-3-butyric acid; C0: 0 mg dm−3 IBA; C1: 0.025 mg dm−3 IBA; C2: 0.05 mg dm−3 IBA; 0D: 0 day treatment; 5D: 5 days treatment; 20D: 20 days treatment.
Ijms 21 00426 g0a2aIjms 21 00426 g0a2bIjms 21 00426 g0a2c
Table A1. Primers sequence for qRT-PCR.
GeneGene IDFull NamePrimer Sequence (Forward/Reverse)Tm (°C)Product (bp)
CHIT1BGh_D06G0479Basic endochitinaseAGCAGGAGAAGCAATAAAGG/ATGACACCGTATCCAGGGAC56.6201
CBL4Gh_D11G0140Calcineurin B-like protein 4TCTTGCTGCTGAAACACCT/TCTAACGAACTCACCGAAC53.4235
PER73Gh_D03G0246Peroxidase 73GCAACTATCCGCCTCTTCT/GCTTAACCCATCCAACCTC54.3291
CYP82A3Gh_D05G2983Cytochrome P450 82A3CTTTGGTAGTGGTAGGAGGAG/GAGCAAGACGAGGTGAGAC51.9194
ARF4Gh_D05G0755Auxin response factor 4CAACATGAATCAAGCACCCAA/GTTTCCTGATGTCGTCCAC53194
AUX22BGh_D13G1819Auxin-induced protein 22BGGCAACTCTTCGGAGCAAC/TATCCCACTAATTTCACCC49.8193
GhUB7DQ116441Ubiquitin 7GAAGGCATTCCACCTGACCAAC/CTTGACCTTCTTCTTCTTGTGCTT59198

References

  1. Steward, F.C.; Mapes, M.O.; Smith, J. Growth and organized development of cultured cells I. Growth and division of freely suspended cells. Am. J. Bot. 1958, 45, 693–703. [Google Scholar] [CrossRef]
  2. Zimmerman, J.L. Somatic embryogenesis: A model for early development in higher plants. Plant Cell 1993, 5, 1411–1423. [Google Scholar] [CrossRef] [PubMed] [Green Version]
  3. Chugh, A.; Khurana, P. Gene expression during somatic embryogenesis: Recent advances. Curr. Sci. 2002, 83, 715–730. [Google Scholar]
  4. Zeng, F.; Zhang, X.; Zhu, L. Isolation and characterization of genes associated to cotton somatic embryogenesis by suppression subtractive hybridization and macroarray. Plant Mol. Biol. 2006, 60, 167–183. [Google Scholar] [CrossRef] [PubMed]
  5. Xie, D.; Jin, S.; Guo, X.; Zhang, X. Somatic Embryogenesis and Plant Regeneration in Cotton Cultivars from Yellow and Yangtze River Planting Areas. Acta Agron. Sin. 2007, 33, 394–400. [Google Scholar]
  6. Feng, R.; Wang, Q.; Zhang, B.; Yu, X. Genotype analysis in cotton tissue culture and plant regeneration. Acta Agriculturae Boreali Occidentalis Sinica 1997, 6, 27–30. [Google Scholar]
  7. Zhang, C.; Yu, S.; Fan, S.; Zhang, J.; Li, F. Inheritance of somatic embryogenesis using leaf petioles as explants in upland cotton. Euphytica 2011, 181, 55–63. [Google Scholar] [CrossRef]
  8. Zhang, X.L.; Sun, J.Z.; Liu, J.L. Somatic embryogenesis and plant regeneration in upland cotton. Acta Genet. Sin. 1991, 18, 461–467. [Google Scholar]
  9. Mishra, R.; Wang, H.Y.; Yadav, N.R.; Wilkins, T.A. Development of a highly regenerable elite Acala cotton (Gossypium hirsutum cv. Maxxa): A step towards genotype-independent regeneration. Plant Cell Tissue Organ Cult. 2003, 73, 21–35. [Google Scholar] [CrossRef]
  10. Ganesan, M.; Jayabalan, N. Evaluation of haemoglobin (erythrogen): For improved somatic embryogenesis and plant regeneration in cotton (Gossypium hirsutum L. cv. SVPR 2). Plant Cell Rep. 2004, 23, 181–187. [Google Scholar] [CrossRef]
  11. Wang, W.; Zhang, X.L. Effects of brassinolide on somatic embryogenesis of Gossypium hirsutum. Plant Physiol. Commun. 1992, 28, 15–18. [Google Scholar]
  12. Wu, J.; Zhang, X.; Nie, Y. Factors affecting somatic embryogenesis and plant regeneration from a range of recalcitrant genotypes of Chinese cottons (Gossypium hirsutum L.). In Vitro Cell. Dev. Biol. Plant 2004, 40, 371–375. [Google Scholar] [CrossRef]
  13. Chen, Z.X.; Li, S.J.; Trolinder, N.L.; Goodin, J.R. Studies on some characteristics of cotton cell suspension culture embryogenesis and plant regeneration. Chin. Agric. Sci. 1987, 5, 6–11. [Google Scholar]
  14. Price, H.J.; Smith, R.H. Somatic embryogenesis in suspension cultures of Gossypium klotzschianum anderss. Planta 1979, 145, 305–307. [Google Scholar] [CrossRef] [PubMed]
  15. Zhu, S.W.; Sun, J.S. Method of rapid plant formation by somatic regeneration of upland cotton. Chin. Sci. Bull. 2000, 45, 1771–1774. [Google Scholar] [CrossRef]
  16. Li, G.D.; Xiao, J.L.; Luo, X.L.; Zhang, A.H.; Wu, J.H. Somatic embryogenesis and plant regeneration of calli derived from cotton (Gossypium hirsutum L.) depending on their quality. J. Shanxi Agric. Sci. 2006, 34, 29–31. [Google Scholar]
  17. Sun, J.Y.; Li, W.M.; Zhang, H.S.; Zhao, J.L.; Yin, X.L.; Wang, L.A. Direct somatic embryogenesis and plant regeneration in glandless upland cotton (Gossypium hirsutum). Acta Agriculture Boreali-Sinica 2009, 24, 81–84. [Google Scholar]
  18. Chen, M.Y.; Zhang, X.L.; Nie, Y.C.; Wu, J.H. Study on improvement of plant regeneration technology of upland cotton. Acta Cotton Sinica 2002, 14, 344–347. [Google Scholar]
  19. Li, S.W.; Shi, R.F.; Leng, Y.; Zhou, Y. Transcriptomic analysis reveals the gene expression profile that specifically responds to IBA during adventitious rooting in mung bean seedlings. BMC Genom. 2016, 17, 1–23. [Google Scholar] [CrossRef] [Green Version]
  20. Zeng, F.; Zhang, X.; Jin, S.; Cheng, L.; Liang, S.; Hu, L.; Guo, X.; Nie, Y.; Cao, J. Chromatin reorganization and endogenous auxin/cytokinin dynamic activity during somatic embryogenesis of cultured cotton cell. Plant Cell Tissue Organ Cult. 2007, 90, 63–70. [Google Scholar] [CrossRef]
  21. Yang, X.; Zhang, X.; Yuan, D.; Jin, F.; Zhang, Y.; Xu, J. Transcript profiling reveals complex auxin signalling pathway and transcription regulation involved in dedifferentiation and redifferentiation during SE in cotton. BMC Plant Biol. 2012, 12, 110. [Google Scholar] [CrossRef] [PubMed] [Green Version]
  22. Xu, Z.; Zhang, C.; Zhang, X.; Liu, C.; Wu, Z.; Yang, Z.; Zhou, K.; Yang, X.; Li, F. Transcriptome profiling reveals auxin and cytokinin regulating somatic embryogenesis in different sister lines of cotton cultivar CCRI24. J. Integr. Plant Biol. 2013, 55, 631–642. [Google Scholar] [CrossRef]
  23. Min, L.; Hu, Q.; Li, Y.; Xu, J.; Ma, Y.; Zhu, L.; Yang, X.; Zhang, X. LEAFY COTYLEDON1-CASEIN KINASE I-TCP15-PHYTOCHROME INTERACTING FACTOR4 network regulates somatic embryogenesis by regulating auxin homeostasis. Plant Physiol. 2015, 169, 2805–2821. [Google Scholar] [CrossRef] [Green Version]
  24. Sun, Y.; Zhang, X.; Huang, C.; Guo, X.; Nie, Y. Somatic embryogenesis and plant regeneration from different wild diploid cotton (Gossypium) species. Plant Cell Rep. 2006, 25, 289–296. [Google Scholar] [CrossRef] [PubMed]
  25. Mao, J.; Miao, Z.; Wang, Z.; Yu, L.; Cai, X.; Xiang, C.L. Arabidopsis ERF1 Mediates Cross-Talk between Ethylene and Auxin Biosynthesis during Primary Root Elongation by Regulating ASA1 Expression. PloS Genet. 2016, 12, e1005760. [Google Scholar] [CrossRef] [PubMed] [Green Version]
  26. Yang, X.; Wang, L.; Yuan, D.; Lindsey, K.; Zhang, X. Small RNA and degradome sequencing reveal complex miRNA regulation during cotton somatic embryogenesis. J. Exp. Bot. 2013, 64, 1521–1536. [Google Scholar] [CrossRef] [PubMed]
  27. Wang, K.; Wang, Z.; Li, F.; Ye, W.; Wang, J.; Song, G.; Yue, Z.; Cong, L.; Shang, H.; Zhu, S.; et al. The draft genome of a diploid cotton Gossypium raimondii. Nat. Genet. 2012, 44, 1098–1103. [Google Scholar] [CrossRef]
  28. Patel, R.K.; Jain, M. NGS QC Toolkit: A Toolkit for Quality Control of Next Generation Sequencing Data. PLoS ONE 2012, 7, e30619. [Google Scholar] [CrossRef]
  29. Passardi, F.; Theiler, G.; Zamocky, M.; Cosioa, C.; Rouhier, N.; Teixera, F.; Margis-Pinheiroe, M.; Ioannidis, V.; Penel, C.; Falquet, L.; et al. PeroxiBase: The peroxidase database. Phytochemistry 2007, 68, 1605–1611. [Google Scholar] [CrossRef]
  30. Guo, H.X.; Guo, H.H.; Zhang, L.; Fan, Y.J.; Fan, Y.P.; Tang, Z.; Zeng, F. Dynamic TMT-based quantitative proteomics analysis of critical initiation process of totipotency during cotton somatic embryogenesis transdifferentiation. Int. J. Mol. Sci. 2019, 20, 1691–1724. [Google Scholar]
  31. Guo, H.H.; Guo, H.X.; Zhang, L.; Tang, Z.; Yu, X.; Wu, J.; Zeng, F. Metabolome and transcriptome association analysis reveals dynamic regulation of purine metabolism and flavonoid synthesis in transdifferentiation during somatic embryogenesis in cotton. Int. J. Mol. Sci. 2019, 20, 2070. [Google Scholar] [CrossRef] [Green Version]
  32. Zhai, L.; Xu, L.; Wang, Y.; Zhu, X.; Feng, H.; Li, C.; Luo, X.; Everlyne, M.; Liu, L. Transcriptional identification and characterization of differentially expressed genes associated with embryogenesis in radish (Raphanus sativus L.). Sci. Rep. 2016, 6, 21652–21664. [Google Scholar] [CrossRef] [PubMed] [Green Version]
  33. Lin, Y.; Lai, Z.; Tian, Q.; Lin, L.; Lai, R.; Yang, M.; Zhang, D.; Chen, Y.; Zhang, Z. Endogenous target mimics down-regulate miR160 mediation of ARF10, -16, and -17 cleavage during somatic embryogenesis in Dimocarpus longan Lour. Front. Plant Sci. 2015, 6, 956–971. [Google Scholar] [CrossRef] [PubMed]
  34. Su, Y.; Liu, Y.; Zhou, C.; Li, X.; Zhang, X. The microRNA167 controls somatic embryogenesis in Arabidopsis through regulating its target genes ARF6 and ARF8. Plant Cell Tissue Organ Cult. 2016, 124, 405–417. [Google Scholar] [CrossRef]
  35. Cao, A.; Zheng, Y.; Yu, Y.; Wang, X.; Shao, D.; Sun, J.; Cui, B. Comparative Transcriptome Analysis of SE initial dedifferentiation in cotton of different SE capability. Sci Rep. 2017, 7, 8583. [Google Scholar] [CrossRef]
  36. Xiao-Yi, Z.; Li, S.; Hong-Wei, X. Brassinosteroids Regulate the Differential Growth of Arabidopsis Hypocotyls through Auxin Signaling Components IAA19 and ARF7. Mol. Plant 2013, 6, 887–904. [Google Scholar]
  37. Kumar, G.P.; Subiramani, S.; Govindarajan, S.; Sadasivam, V.; Manickam, V.; Mogilicherla, K.; Thiruppathi, S.K.; Narayanasamy, J. Evaluation of different carbon sources for high frequency callus culture with reduced phenolic secretion in cotton (Gossypium hirsutum L.) cv. SVPR-2. Biotechnol. Rep. 2015, 7, 72–80. [Google Scholar] [CrossRef] [Green Version]
  38. Cheng, W.; Zhu, H.; Tian, W.; Zhu, S.; Xiong, X.; Sun, Y.; Zhu, Q.; Sun, J. De novo transcriptome analysis reveals insights into dynamic homeostasis regulation of somatic embryogenesis in upland cotton (G. hirsutum L.). Plant Mol. Biol. 2016, 92, 279–292. [Google Scholar] [CrossRef] [Green Version]
  39. Wang, Q.; Wang, M.; Shi, H. Induction and Regulation of Plant Hormone on Somatic Embryogenesis in Cotton. Biotechnol. Commun. 2004, 15, 577–579. [Google Scholar]
  40. Wolters, H.; Jurgens, G. Survival of the flexible: Hormonal growth control and adaptation in plant development. Nat. Rev. Genet. 2009, 10, 305–317. [Google Scholar] [CrossRef]
  41. Perata, P.; Alpi, A. Ethanol-induced injuries to carrot cells: The role of acetaldehyde. Plant Physiol. 1991, 95, 748–752. [Google Scholar] [CrossRef] [PubMed] [Green Version]
  42. Yang, Y.; Chu, D.; Aizawa, M.; Kim, M.; Yamomoto, T. Ethanol metabolism by tobacco callus in vitro. Plant Sci. 1995, 104, 147–151. [Google Scholar] [CrossRef]
  43. Zeng, F.; Zhang, X.; Cheng, L.; Hu, L.; Zhu, L.; Cao, J.; Guo, X. A draft gene regulatory network for cellular totipotency reprogramming during plant somatic embryogenesis. Genomic 2007, 90, 620–628. [Google Scholar] [CrossRef] [PubMed] [Green Version]
  44. Guo, H.H.; Guo, H.X.; Zhang, L.; Fan, Y.J.; Fan, Y.P.; Zeng, F. SELTP assembled battery drives totipotency of somatic plant cell. Plant Biotechnol. J. 2019, 17, 1188–1190. [Google Scholar] [CrossRef] [PubMed] [Green Version]
  45. Schmidt, E.D.; Guzzo, F.; Toonen, M.A. A leucine-rich repeat containing receptor-like kinase marks somatic plant cells competent to form embryos. Development 1997, 124, 2049–2062. [Google Scholar]
  46. Guo, H.H.; Wu, J.; Chen, C.; Wang, H.; Zhao, Y.; Zhang, C.; Jia, Y.; Liu, F.; Ning, T.; Chu, Z.; et al. Identification and characterization of cell cultures with various embryogenic/regenerative potential in cotton based on morphological, cytochemical, and cytogenetical assessment. J. Integr. Agric. 2019, 18, 1–8. [Google Scholar] [CrossRef]
  47. Anders, S.; Huber, W. Differential expression analysis for sequence count data. Genome Biol. 2010, 11, R106. [Google Scholar] [CrossRef] [Green Version]
  48. Trapnell, C.; Williams, B.A.; Pertea, G.; Mortazavi, A.; Kwan, G.; van Baren, M.J.; Salzberg, S.L.; Wold, B.J.; Pachter, L. Transcript assembly and quantification by RNA-seq reveals unannotated transcripts and isoform switching during cell differentiation. Nat. Biotechnol. 2010, 28, 511–515. [Google Scholar] [CrossRef] [Green Version]
Figure 1. The up- and down-regulation of gene expression between the comparison group. (a,b) The volcano plot of differentially expressed genes. (The red dots represent up-regulated genes, the blue dots represent down-regulated genes, the abscissa represents the expression multiple change of genes in different samples, and the ordinate represents the statistical significance of the difference in gene expression) (c) The up- and down-regulation of gene expression was compared between samples.
Ijms 21 00426 g001
Figure 2. Venn diagram of differentially expressed genes between different comparison groups.
Ijms 21 00426 g002
Figure 3. Type and number of variable splicing statistics. AE: Alternative exon ends; IR: Intron retention; MIR: Multi-IR; MSKIP: Multi-exon SKIP; SKIP: Skipped exon; TSS: Alternative 5′ first exon; TTS: Alternative 3′ last exon; XAE: Approximate AE; XIR: Approximate IR; XMIR: Approximate MIR; XMSKIP: Approximate MSKIP; XSKIP: Approximate SKIP.
Ijms 21 00426 g003
Figure 4. The Kyoto Encyclopedia of Genes and Genomes (KEGG) annotation of DEGs in comparison groups with and without IBA. (a) Pathway enrichment in C0-5D VS IBA-C1-5D; (b) Pathway enrichment in C0-20D VS IBA-C1-20D. IBA: indole-3-butyric acid; C0: 0 mg dm−3 IBA; C1: 0.025 mg dm−3 IBA; 5D: 5 days treatment; 20D: 20 days treatment.
Ijms 21 00426 g004
Figure 5. KEGG annotation of differential expressed genes in different IBA doses. (a) Pathway enrichment in IBA-C1-5D VS IBA-C2-5D; (b) Pathway enrichment in IBA-C1-20D VS IBA-C2-20D. IBA: indole-3-butyric acid; C1: 0.025 mg dm−3 IBA; C2: 0.05 mg dm−3 IBA; 5D: 5 days treatment; 20D: 20 days treatment.
Ijms 21 00426 g005aIjms 21 00426 g005b
Figure 6. KEGG annotation of differential expressed genes in different culture times of 0 day, 5 days, and 20 days. (a) Pathway enrichment in 24D-C3-0D VS IBA-C1-5D; (b) Pathway enrichment in IBA-C1-5D VS IBA-C1-20D; (c) Pathway enrichment in 24D-C3-0D VS IBA-C2-5D; (d) Pathway enrichment in IBA-C2-5D VS IBA-C2-20D. IBA: indole-3-butyric acid; 2, 4-D: 2, 4-dichlorophenoxyacetic acid; C1: 0.025 mg dm−3 IBA; C2: 0.05 mg dm−3 IBA; C3: 0.1 mg dm−3 2, 4-D; 0D: 0 day treatment; 5D: 5 days treatment; 20D: 20 days treatment.
Ijms 21 00426 g006aIjms 21 00426 g006b
Figure 7. Comparison and confirmation of the RNA-seq data with qRT-PCR. (a)–(f) Relative expression of DEGs selected by comparative transcriptome induced by IBA. Bars represent SD, and gene abundance was calculated relative to the GhUB7 expression level.
Ijms 21 00426 g007aIjms 21 00426 g007b
Table 1. Statistics of callus differentiation rate of cotton YZ-1.
IBA Concentration
(mg dm−3)
KT Concentration
(mg dm−3)
Callus Differentiation Rate (%)
0.05 (C2)0.152.63
0.025 (C1)0.172.22
0 (C0)0.17.81
Table 2. Summary of annotated genes in each database of the pairwise comparisons.
Pairwise ComparisonsNRGOKEGG
24D-C3-0D VS IBA-C1-5D726450071789
24D-C3-0D VS IBA-C1-20D514135071300
24D-C3-0D VS IBA-C2-5D948664442524
24D-C3-0D VS IBA-C2-20D431429301080
24D-C3-0D VS C0-5D21351434550
24D-C3-0D VS C0-20D534937311415
IBA-C1-5D VS IBA-C1-20D29242036723
IBA-C2-5D VS IBA-C2-20D11,23575642828
C0-5D VS C0-20D411827851191
IBA-C1-5D VS IBA-C2-5D888960682318
IBA-C1-20D VS IBA-C2-20D15421038333
C0-5D VS IBA-C1-5D618142691518
C0-5D VS IBA-C2-5D10,22769262685
C0-20D VS IBA-C1-20D440429941244
C0-20D VS IBA-C2-20D23631626668
Table 3. Significantly representative differentially expressed genes were enriched by KEGG.
No.Gene IDGene DescriptionPathway Annotationp-ValueRegulationCompare Combination
1Gh_A05G0085EIN3-binding F-box protein 1-like isoform X2plant hormone signal transduction4.06 × 10−84DownC0-5D VS IBA-C1-5D
2Gh_D05G0148EIN3-binding F-box protein 1-like isoform X2plant hormone signal transduction1.08 × 10−67DownC0-5D VS IBA-C1-5D
3Gh_D09G0971pathogenesis-related protein 1-likeplant hormone signal transduction1.87 × 10−55DownC0-5D VS IBA-C1-5D
4Gh_D06G1764abscisic acid receptor PYL4-likeplant hormone signal transduction4.05 × 10−55DownC0-5D VS IBA-C1-5D
5Gh_A06G1418abscisic acid receptor PYL4-likeplant hormone signal transduction6.63 × 10−41DownC0-5D VS IBA-C1-5D
6Gh_D12G0182probable indole-3-acetic acid-amido synthetase GH3.1plant hormone signal transduction1.15 × 10−38UpsC0-5D VS IBA-C1-5D
7Gh_D08G0034histone H2A-likealcohol degradation4.07 × 10−24UpsC0-5D VS IBA-C1-5D
8Gh_D09G0854histone H2B-likealcohol degradation4.91 × 10−18UpsC0-5D VS IBA-C1-5D
9Gh_D02G1958histone deacetylase 19 isoform X1alcohol degradation5.05 × 10−16UpsC0-5D VS IBA-C1-5D
10Gh_A09G1018G2/mitotic-specific cyclin S13-7cell cycle1.47 × 10−15UpsC0-20D VS IBA-C1-20D
11Gh_D09G1039G2/mitotic-specific cyclin S13-7cell cycle2.00 × 10−6UpsC0-20D VS IBA-C1-20D
12Gh_D11G0102cell division cycle 20.2, cofactor of APC complex-likecell cycle2.08 × 10−6UpsC0-20D VS IBA-C1-20D
13Gh_A05G2161cyclin-B2-4-like isoform X2cell cycle3.36 × 10−6UpsC0-20D VS IBA-C1-20D
14Gh_A08G1487probable serine/threonine-protein kinase cdc7 isoform X1cell cycle5.93 × 10−6UpsC0-20D VS IBA-C1-20D
15Gh_D08G0847putative cyclin-B3-1cell cycle1.65 × 10−5UpsC0-20D VS IBA-C1-20D
16Gh_A08G2544histone H2Aalcohol degradation1.48 × 10−23UpsC0-20D VS IBA-C1-20D
17Gh_A09G0836probable histone H2B.1alcohol degradation6.06 × 10−8UpsC0-20D VS IBA-C1-20D
18Gh_D05G0853histone H2B-likealcohol degradation4.01 × 10−7UpsC0-20D VS IBA-C1-20D
19Gh_A11G1738oxygen-evolving enhancer protein 1, chloroplasticphotosynthesis4.66 × 10−54DownC0-20D VS IBA-C1-20D
20Gh_D11G1768ferredoxin--NADP reductase, leaf isozyme, chloroplasticphotosynthesis4.87 × 10−54DownC0-20D VS IBA-C1-20D
21Gh_D07G1624photosystem I reaction center subunit XI, chloroplastic-likephotosynthesis6.18 × 10−54DownC0-20D VS IBA-C1-20D
22Gh_D05G1742plastocyaninphotosynthesis6.16 × 10−50DownC0-20D VS IBA-C1-20D
23Gh_A02G1466peroxidase 73-likePhenylpropanoid biosynthesis1.25 × 10−283DownIBA-C1-5D VS IBA-C2-5D
24Gh_A09G1415peroxidase 21Phenylpropanoid biosynthesis4.58 × 10−248DownIBA-C1-5D VS IBA-C2-5D
25Gh_A08G0747peroxidase 16-likePhenylpropanoid biosynthesis3.63 × 10−226DownIBA-C1-5D VS IBA-C2-5D
26Gh_D08G0829peroxidase 59Phenylpropanoid biosynthesis4.52 × 10−207UpsIBA-C1-5D VS IBA-C2-5D
27Gh_D02G2386cytochrome P450 CYP749A22-like isoform X1Brassinosteroid biosynthesis5.39 × 10−19DownIBA-C1-5D VS IBA-C1-20D
28Gh_D08G2495cytochrome P450 734A1-likeBrassinosteroid biosynthesis3.35 × 10−17UpsIBA-C1-5D VS IBA-C1-20D
29Gh_A06G1446cytochrome P450 90A1Brassinosteroid biosynthesis7.63 × 10−5DownIBA-C1-5D VS IBA-C1-20D
30Gh_D02G0227crocetin glucosyltransferase, chloroplastic-likeAnthocyanin biosynthesis2.70 × 10−63DownIBA-C1-5D VS IBA-C1-20D
31Gh_D02G0225crocetin glucosyltransferase, chloroplastic-likeAnthocyanin biosynthesis1.09 × 10−60DownIBA-C1-5D VS IBA-C1-20D
32Gh_D02G0230crocetin glucosyltransferase, chloroplastic-likeAnthocyanin biosynthesis1.33 × 10−28DownIBA-C1-5D VS IBA-C1-20D
33Gh_A09G1509 glutathione S-transferase U8-likeMetabolism of xenobiotics by cytochrome P4502.76 × 10−118UpsIBA-C1-5D VS IBA-C2-5D
34Gh_D01G0907alcohol dehydrogenase-like 7Metabolism of xenobiotics by cytochrome P4502.01 × 10−44DownIBA-C1-5D VS IBA-C2-5D
35Gh_D02G2184squalene synthase-likeSteroid biosynthesis1.43 × 10−63DownIBA-C1-5D VS IBA-C2-5D
36Gh_D04G2024squalene monooxygenase-likeSteroid biosynthesis9.41 × 10−58UpsIBA-C1-5D VS IBA-C2-5D
37Gh_D06G08463beta-hydroxysteroid-dehydrogenase/decarboxylase isoform 2 isoform X1Steroid biosynthesis1.22 × 10−23DownIBA-C1-5D VS IBA-C2-5D
38Gh_A05G1647dihydroflavonol-4-reductase-likeFlavonoid biosynthesis2.65 × 10−37DownIBA-C1-5D VS IBA-C2-5D
39Gh_D12G1798Flavonoid 3’-monooxygenaseFlavonoid biosynthesis3.84 × 10−34DownIBA-C1-5D VS IBA-C2-5D
40Gh_D03G0311phosphoenolpyruvate carboxykinase [ATP]Carbon metabolism8.18 × 10−125Down24D-C3-0D VS IBA-C2-5D
41Gh_D07G0203ATP-dependent 6-phosphofructokinase 6 isoform X1Carbon metabolism3.85 × 10−90Ups24D-C3-0D VS IBA-C2-5D
42Gh_D05G3328malate dehydrogenase, mitochondrialCarbon metabolism2.09 × 10−57Down24D-C3-0D VS IBA-C2-5D
43Gh_D02G1553glyceraldehyde-3-phosphate dehydrogenase, cytosolic Carbon metabolism1.02 × 10−259UpsIBA-C2-5D VS IBA-C2-20D
44Gh_A02G0386malate dehydrogenaseCarbon metabolism1.12 × 10−177UpsIBA-C2-5D VS IBA-C2-20D
Table 4. Differentially expressed transcription factor genes were not enriched by KEGG in cotton SE.
No.Gene IDGene Descriptionp-ValueRegulationCompare Combination
1Gh_D05G1962WUSCHEL-related homeobox 4-like 1.37 × 10⁻¹²UpsC0-20D-VS-IBA-C1-20D
2Gh_D11G3261WUSCHEL-related homeobox 8-like4.35 × 10−3UpsC0-5D-VS-IBA-C1-5D
3Gh_D05G1503WUSCHEL-related homeobox 9-like1.76 × 10−31DownC0-5D-VS-IBA-C1-5D
4Gh_D10G0270WUSCHEL-related homeobox 9-like isoform X12.31 × 10−6DownC0-5D-VS-IBA-C1-5D
5Gh_D05G1962WUSCHEL-related homeobox 4-like 1.37 × 10⁻¹²UpsC0-5D-VS-IBA-C1-5D
6Gh_A07G1368zinc finger protein ZAT9-like 4.07 × 10⁻⁶DownC0-20D-VS-IBA-C1-20D
7Gh_A09G0899zinc finger protein WIP3-like1.76 × 10−5UpsC0-20D-VS-IBA-C1-20D
8Gh_D11G1518zinc finger protein CONSTANS-LIKE 9-like isoform X1 6.71 × 10⁻⁶UpsC0-20D-VS-IBA-C1-20D
9Gh_D12G0712zinc finger protein AZF1-like2.55 × 10−5UpsC0-5D-VS-IBA-C1-5D
10Gh_A01G0135zinc finger CCCH domain-containing protein 2-like 3.94 × 10⁻⁶DownC0-5D-VS-IBA-C1-5D/C0-20D-VS-IBA-C1-20D
11Gh_D01G0181zinc finger CCCH domain-containing protein 2-like1.17 × 10−5DownC0-20D-VS-IBA-C1-20D
12Gh_D11G0511transcription factor MYB44-like 2.63 × 10−47DownC0-5D-VS-IBA-C1-5D
13Gh_A06G0188transcription factor MYB44-like 2.21 × 10−66DownC0-5D-VS-IBA-C1-5D/ C0-20D-VS-IBA-C1-20D
14Gh_A09G0939transcription factor LHW 1.88 × 10−47UpsC0-5D-VS-IBA-C1-5D/ C0-20D-VS-IBA-C1-20D
15Gh_D02G0841transcription factor bHLH96-like9.80 × 10−56DownC0-5D-VS-IBA-C1-5D
16Gh_D07G0897transcription factor bHLH62-like 2.12 × 10−69DownC0-20D-VS-IBA-C1-20D
17Gh_A07G2268transcription factor bHLH62-like 3.76 × 10−46DownC0-5D-VS-IBA-C1-5D
18Gh_D07G0897transcription factor bHLH62-like2.12 × 10−69DownC0-5D-VS-IBA-C1-5D
19Gh_D11G3340transcription factor bHLH106 4.72 × 10−71UpsC0-5D-VS-IBA-C1-5D
20Gh_A09G0433somatic embryogenesis receptor kinase 5 3.30 × 10⁻⁴UpsIBA-C1-5D-VS-IBA-C2-5D
21Gh_D09G0447somatic embryogenesis receptor kinase 51.28 × 10⁻⁴UpsC0-20D-VS-IBA-C1-20D
22Gh_A01G0158somatic embryogenesis receptor kinase 2-like isoform X13.31 × 10−4UpsC0-20D-VS-IBA-C1-20D
23Gh_D07G1063serine/threonine-protein kinase D6PKL2-like1.04 × 10−88DownC0-5D-VS-IBA-C1-5D
24Gh_A10G1074receptor-like protein kinase 2 1.77 × 10−54DownC0-5D-VS-IBA-C1-5D
25Gh_D10G1439receptor-like protein kinase 24.76 × 10−86DownC0-20D-VS-IBA-C1-20D
26Gh_A09G1432putative receptor protein kinase ZmPK1 isoform X11.58 × 10−53UpsC0-5D-VS-IBA-C1-5D
27
28Gh_A06G0601probable nuclear hormone receptor HR38 isoform X2 3.92 × 10⁻³DownC0-5D-VS-IBA-C1-5D
29Gh_D06G0681probable nuclear hormone receptor HR38 isoform X22.00 × 10−8DownC0-5D-VS-IBA-C1-5D
30Gh_A06G1176ethylene-responsive transcription factor ERF091-like1.78 × 10−54DownC0-20D-VS-IBA-C1-20D
31Gh_D08G1225ethylene-responsive transcription factor ERF061-like 8.50 × 10−49UpsC0-5D-VS-IBA-C1-5D
32Gh_A08G1503ethylene-responsive transcription factor 5-like8.27 × 10−50DownC0-20D-VS-IBA-C1-20D
33Gh_A12G1021dof zinc finger protein DOF3.7 5.10 × 10⁻⁶UpsC0-20D-VS-IBA-C1-20D
34Gh_A06G1830B-box zinc finger protein 21-like, partial3.86 × 10−6DownC0-20D-VS-IBA-C1-20D
35Gh_D11G1798B-box zinc finger protein 18-like isoform X14.60 × 10−6UpsC0-5D-VS-IBA-C1-5D
36Gh_A11G1640B-box zinc finger protein 18-like isoform X14.61 × 10−6UpsC0-5D-VS-IBA-C1-5D

