1. Introduction
Osteoclasts (OCs) are responsible for degrading the bone matrix, thereby initiating bone repair, which allows osteoblasts to build new bone and thus maintain the integrity of the bone tissue [
1,
2]. An important tool for understanding OC biology is the use of in vitro models of OC differentiation and activation from OC progenitors/precursors. Currently, sources of OC precursors include primary cultures of mouse bone marrow macrophages, spleen macrophages or human CD14+ monocytes [
3,
4,
5], as well as immortalized cell lines [
6,
7] such as the ER-Hoxb8 [
8] and RAW264.7 cell lines [
9].
Common for both in vivo and in vitro OC differentiation is their dependence on two cytokines, M-CSF and receptor activator of NF-κB ligand (RANKL) [
10,
11,
12,
13,
14,
15]. OC precursors being stimulated with RANKL in combination with M-CSF leads to TRAF6 activation and the downstream triggering of several pathways (e.g., NF-kB, MEK, MKK6, MKK7), resulting in the activation of the master OC transcription factor, NFATc1, which is also activated though RANKL-dependent Ca
2+ signaling [
16]. This activation starts a program in the OC progenitor with increased expression of OC markers, such as tartrate-resistant acid phosphatase (TRAP), cathepsin K (CtsK), β3 integrin and calcitonin receptor (CTR), ending with OC fusion and differentiation [
17].
One commercially available OC precursor for generating in vitro OC-like cells is the mouse macrophage cell line RAW264.7 [
9,
18] which was originally derived from ascites of a tumor induced by the Abelson leukemia virus in a male BALB/14 mouse. RAW264.7 shows a stable [
19] mature adherent macrophage phenotype that, in response to RANKL stimulation, forms multinucleated TRAP-positive OC-like cells. Although widely used, it is debated whether OC-like cells derived from RAW264.7 can resorb bone—that is, if they exhibit biologically relevant OC functions resembling primary cells [
20]. RAW264.7s have been reported to both acidify the bone matrix as well as degrade collagen, but the combination present in bone is harder to perforate. Still, RAW264.7-derived OC-like cells have several advantages over primary macrophage-derived OCs, making them an interesting in vitro model to use as they are an immortalized cell-line with a simple culture protocol and can be used to generate an indefinite number of OC-like cells rapidly for high throughput assays, and also, they secrete M-CSF [
13,
14,
15], thus abolishing the need to add exogenous M-CSF during OC differentiation. Furthermore, they are easier to transfect compared to primary OCs or OC-precursors [
21] and they are capable of acidification to demineralize hydroxyapatite-coated surfaces [
22]. Despite differences in gene as well as protein expression patterns, recent investigations have indicated that, after RANKL-stimulation, RAW264.7s do resemble OCs [
22,
23].
The RAW264.7 cell line is heterogeneous, as macrophages typically are, and this introduces a set of problems in reproducibility of data between laboratories, cell batches and even experiments [
24]. However, it is hypothetically possible that OC-like precursors with a different capacity to form functional OCs are present in the RAW264.7 cell line. Thus, by screening RAW264.7-derived sub-clones it might be possible to isolate OC-precursor clones, which more resemble OC upon RANKL-stimulation, than the large mixture of clones in RAW264.7. One attempt to isolate different OC precursor populations present in RAW264.7 cells has been performed [
22] using single cell cloning. In this study, RAW264.7-clones with different capacities to form TRAP-positive multinucleated cells were isolated and characterized with regard to gene expression patterns and functional characteristics.
The aim of this study was therefore to investigate whether more homogenous OC-precursor sub-clones with the capacity to acidify as well as degrade collagen could be selected from RAW264.7 using a simpler method. Here, we present a RAW264.7-derived sub-clone, H9, with the ability to form TRAP-positive multinucleated OC capable of demineralization and collagen degradation faster than RAW264.7 due to increased mRNA expression and nuclear translocation of NFATc1. Furthermore, we present a thorough characterization of the attributes that lead to efficient OC-differentiation. Moreover, H9 is an additional experimental model in applications requiring rapid differentiation of large amounts of OCs.
3. Discussion and Conclusions
This study aimed to explore the heterogeneity of the mouse macrophage RAW264.7 cell line and if an OC-precursor could be isolated and enriched using initial gene expression levels of unstimulated sub-clone. The aim of the study was to establish a simple isolation protocol that could improve the performance of RAW264.7 cell line as a model of OCs.
Previously, it has been shown that it is possible to isolate OC-precursor sub-clones from RAW264.7 with different gene expression of the OC markers CtsK and TRAP in unstimulated and RANKL-stimulated sub-clones [
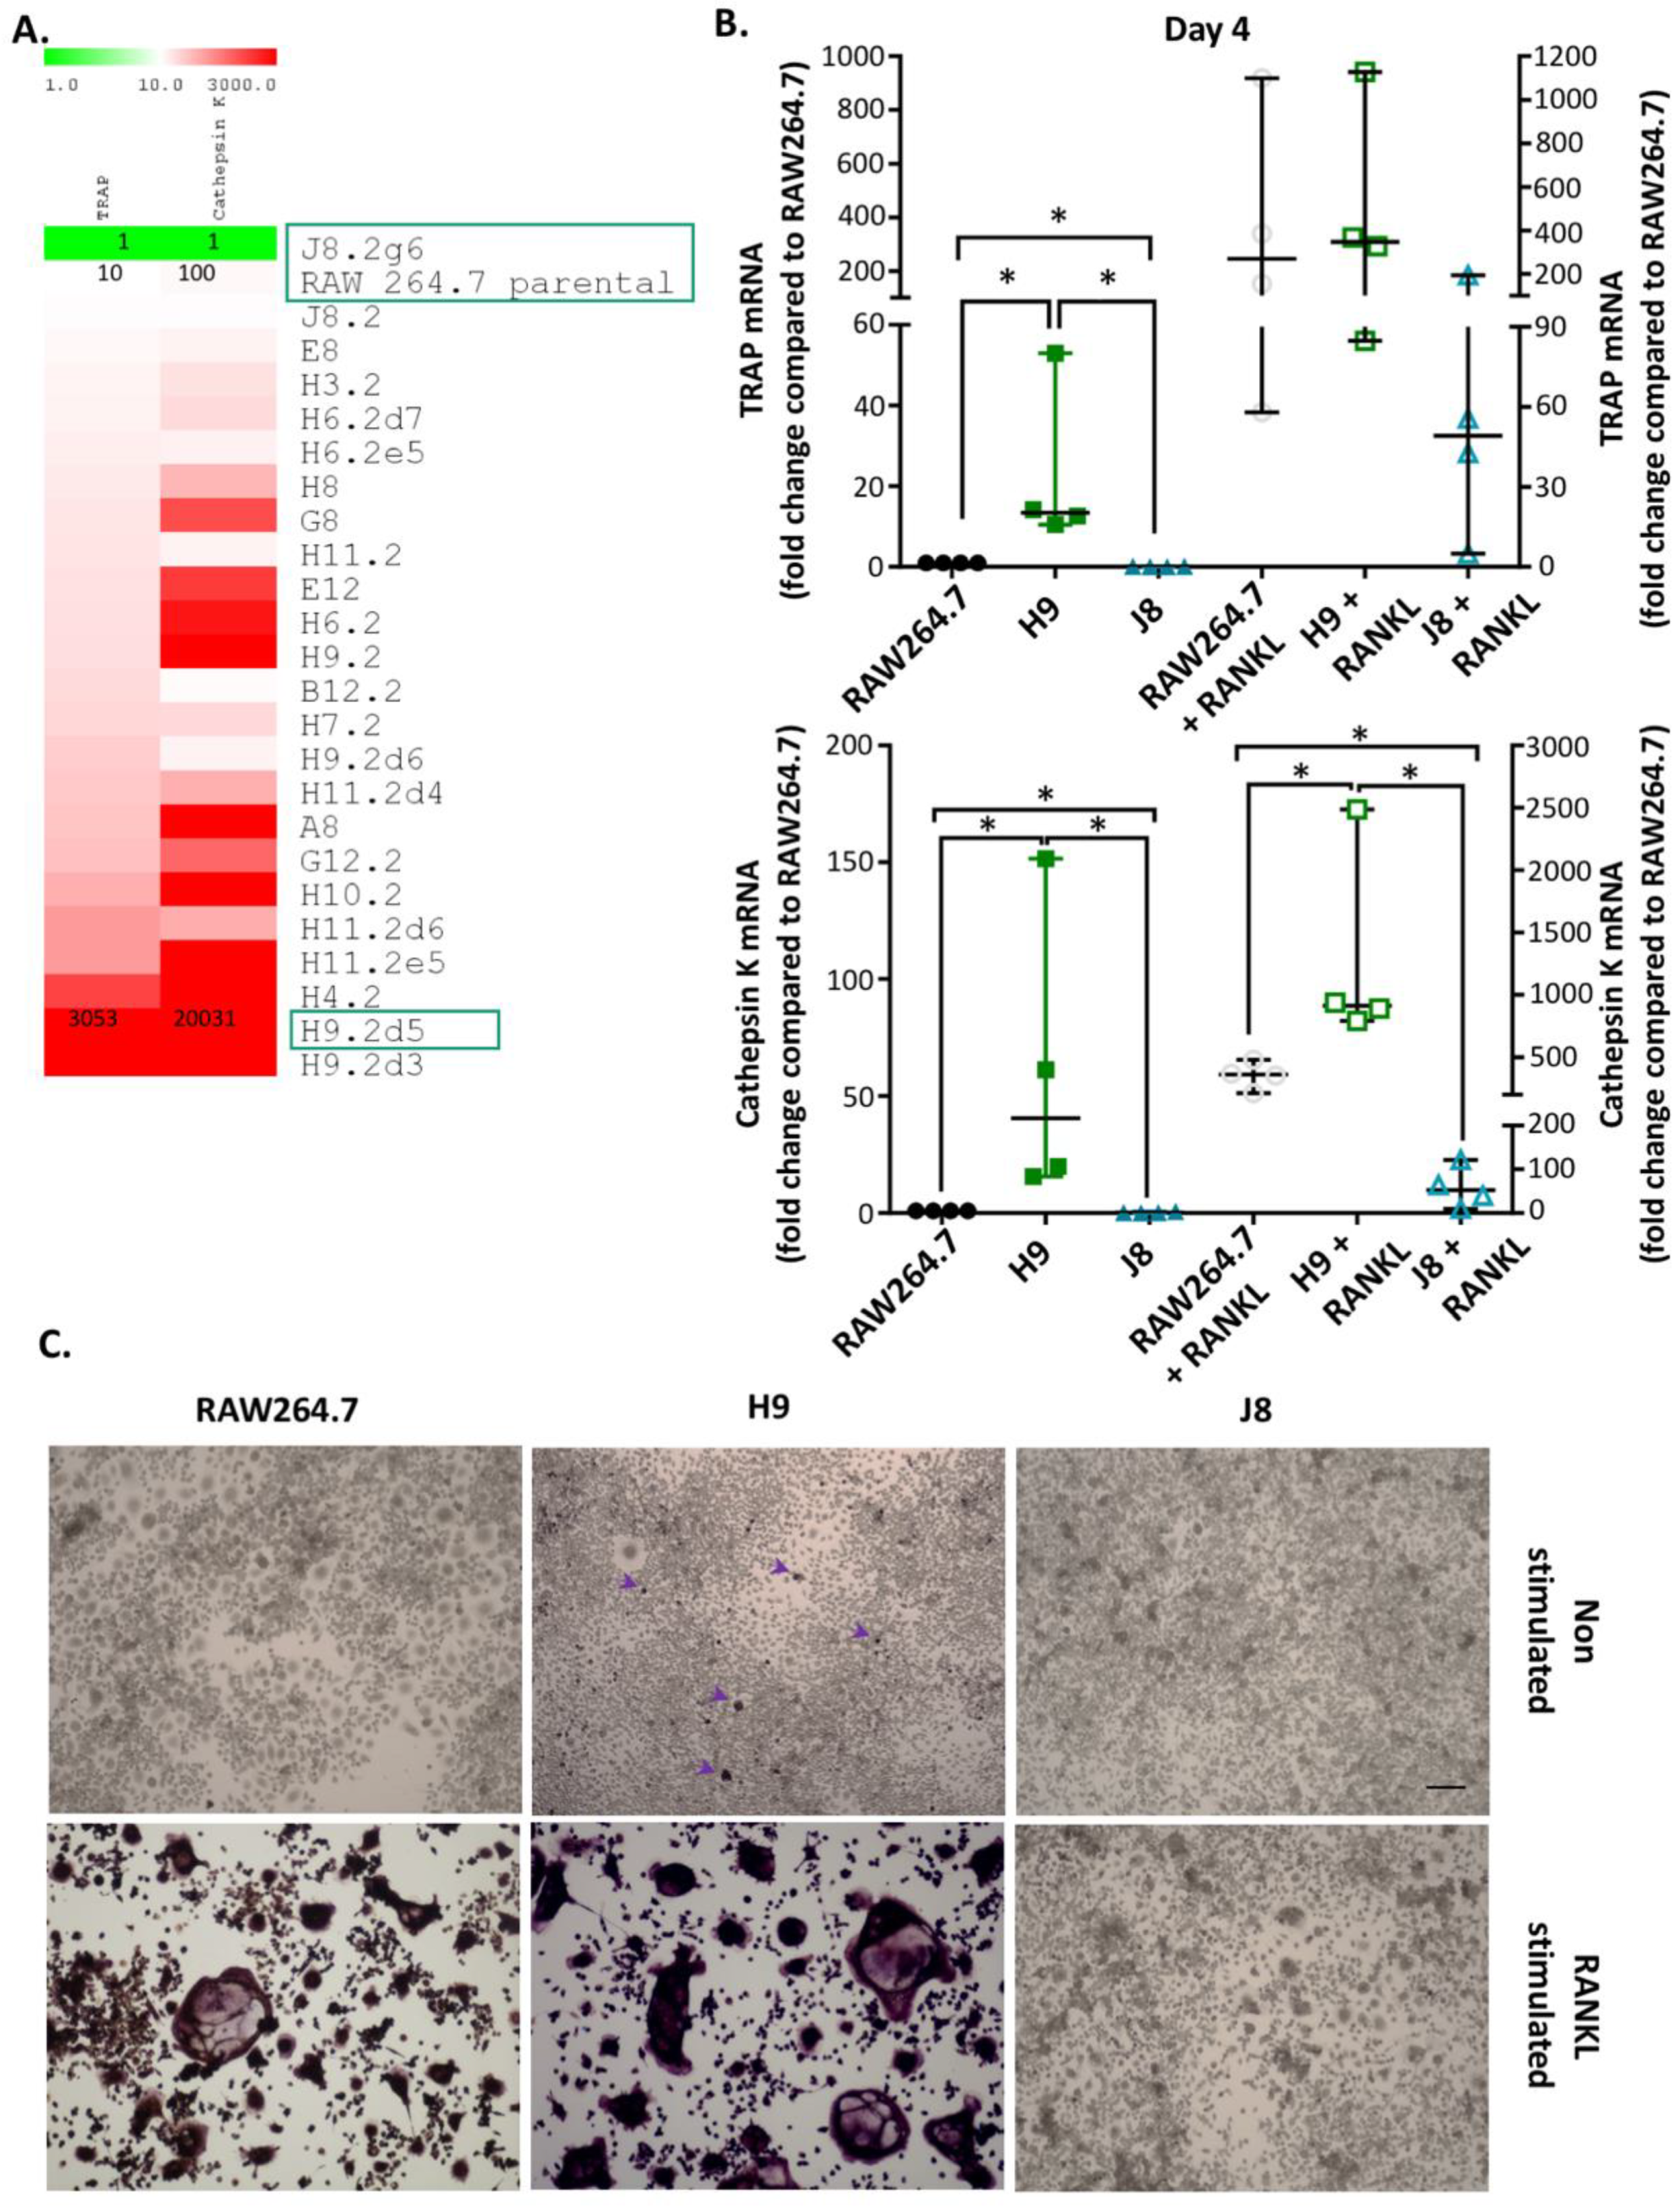
22]. In the current study, it was possible to rank unstimulated RAW264.7 sub-clones by their TRAP and CtsK mRNA expression. In line with a previous study [
22], there was a higher number of unstimulated sub-clones with high CtsK mRNA expression compared to high TRAP mRNA expression. Least frequent were sub-clones with both low CtsK and TRAP mRNA expression (i.e., only one clone with this phenotype was isolated). This indicates that the majority of RAW264.7 sub-clones likely exhibit some but variable potential for OC-like differentiation. Conversely, RANKL-stimulation was very inefficient in inducing the formation of multinucleated TRAP-positive cells in J8, the only sub-clone with low CtsK and TRAP mRNA expression. There are also sub-clones present in the RAW264.7 cell line lacking the ability to differentiate into OC-like cells after RANKL stimulation. The scarcity of low CtsK and TRAP expression in comparison to the parental line was unexpected but could reflect the selection bias for proliferating cells in the parental line, as OC differentiation and proliferation are mutually exclusive properties. This suggests that sub-cloning could indeed produce a more homogenous OC precursor population by eliminating sub-clones not able to differentiate into OCs upon RANKL stimulation. The apparent difference in TRAP-staining of the unstimulated H9 may be due to limited detection range of the assay or temporal changes in processing of TRAP 5a to the more active TRAP 5b and secretion of TRAP isoforms. Passaging the cells will eventually change the phenotype of macrophage-like cells, and therefore, we used low (<10) passage number in this study. Moreover, our method of sub-cloning followed by a screen of TRAP and CtsK expression can be used to revitalize and enhance OC-differentiation of cell lines capable of forming OCs.
Any cell line model of a mature OC needs the capability to carry out the specialized functions characterizing OCs, specifically the resorption of bone, consisting of demineralization of bone hydroxyapatite and degradation of collagen. RANKL-stimulated RAW264.7 have been shown to acidify and dissolve hydroxyapatite [
22] and to form resorption pits [
18,
30,
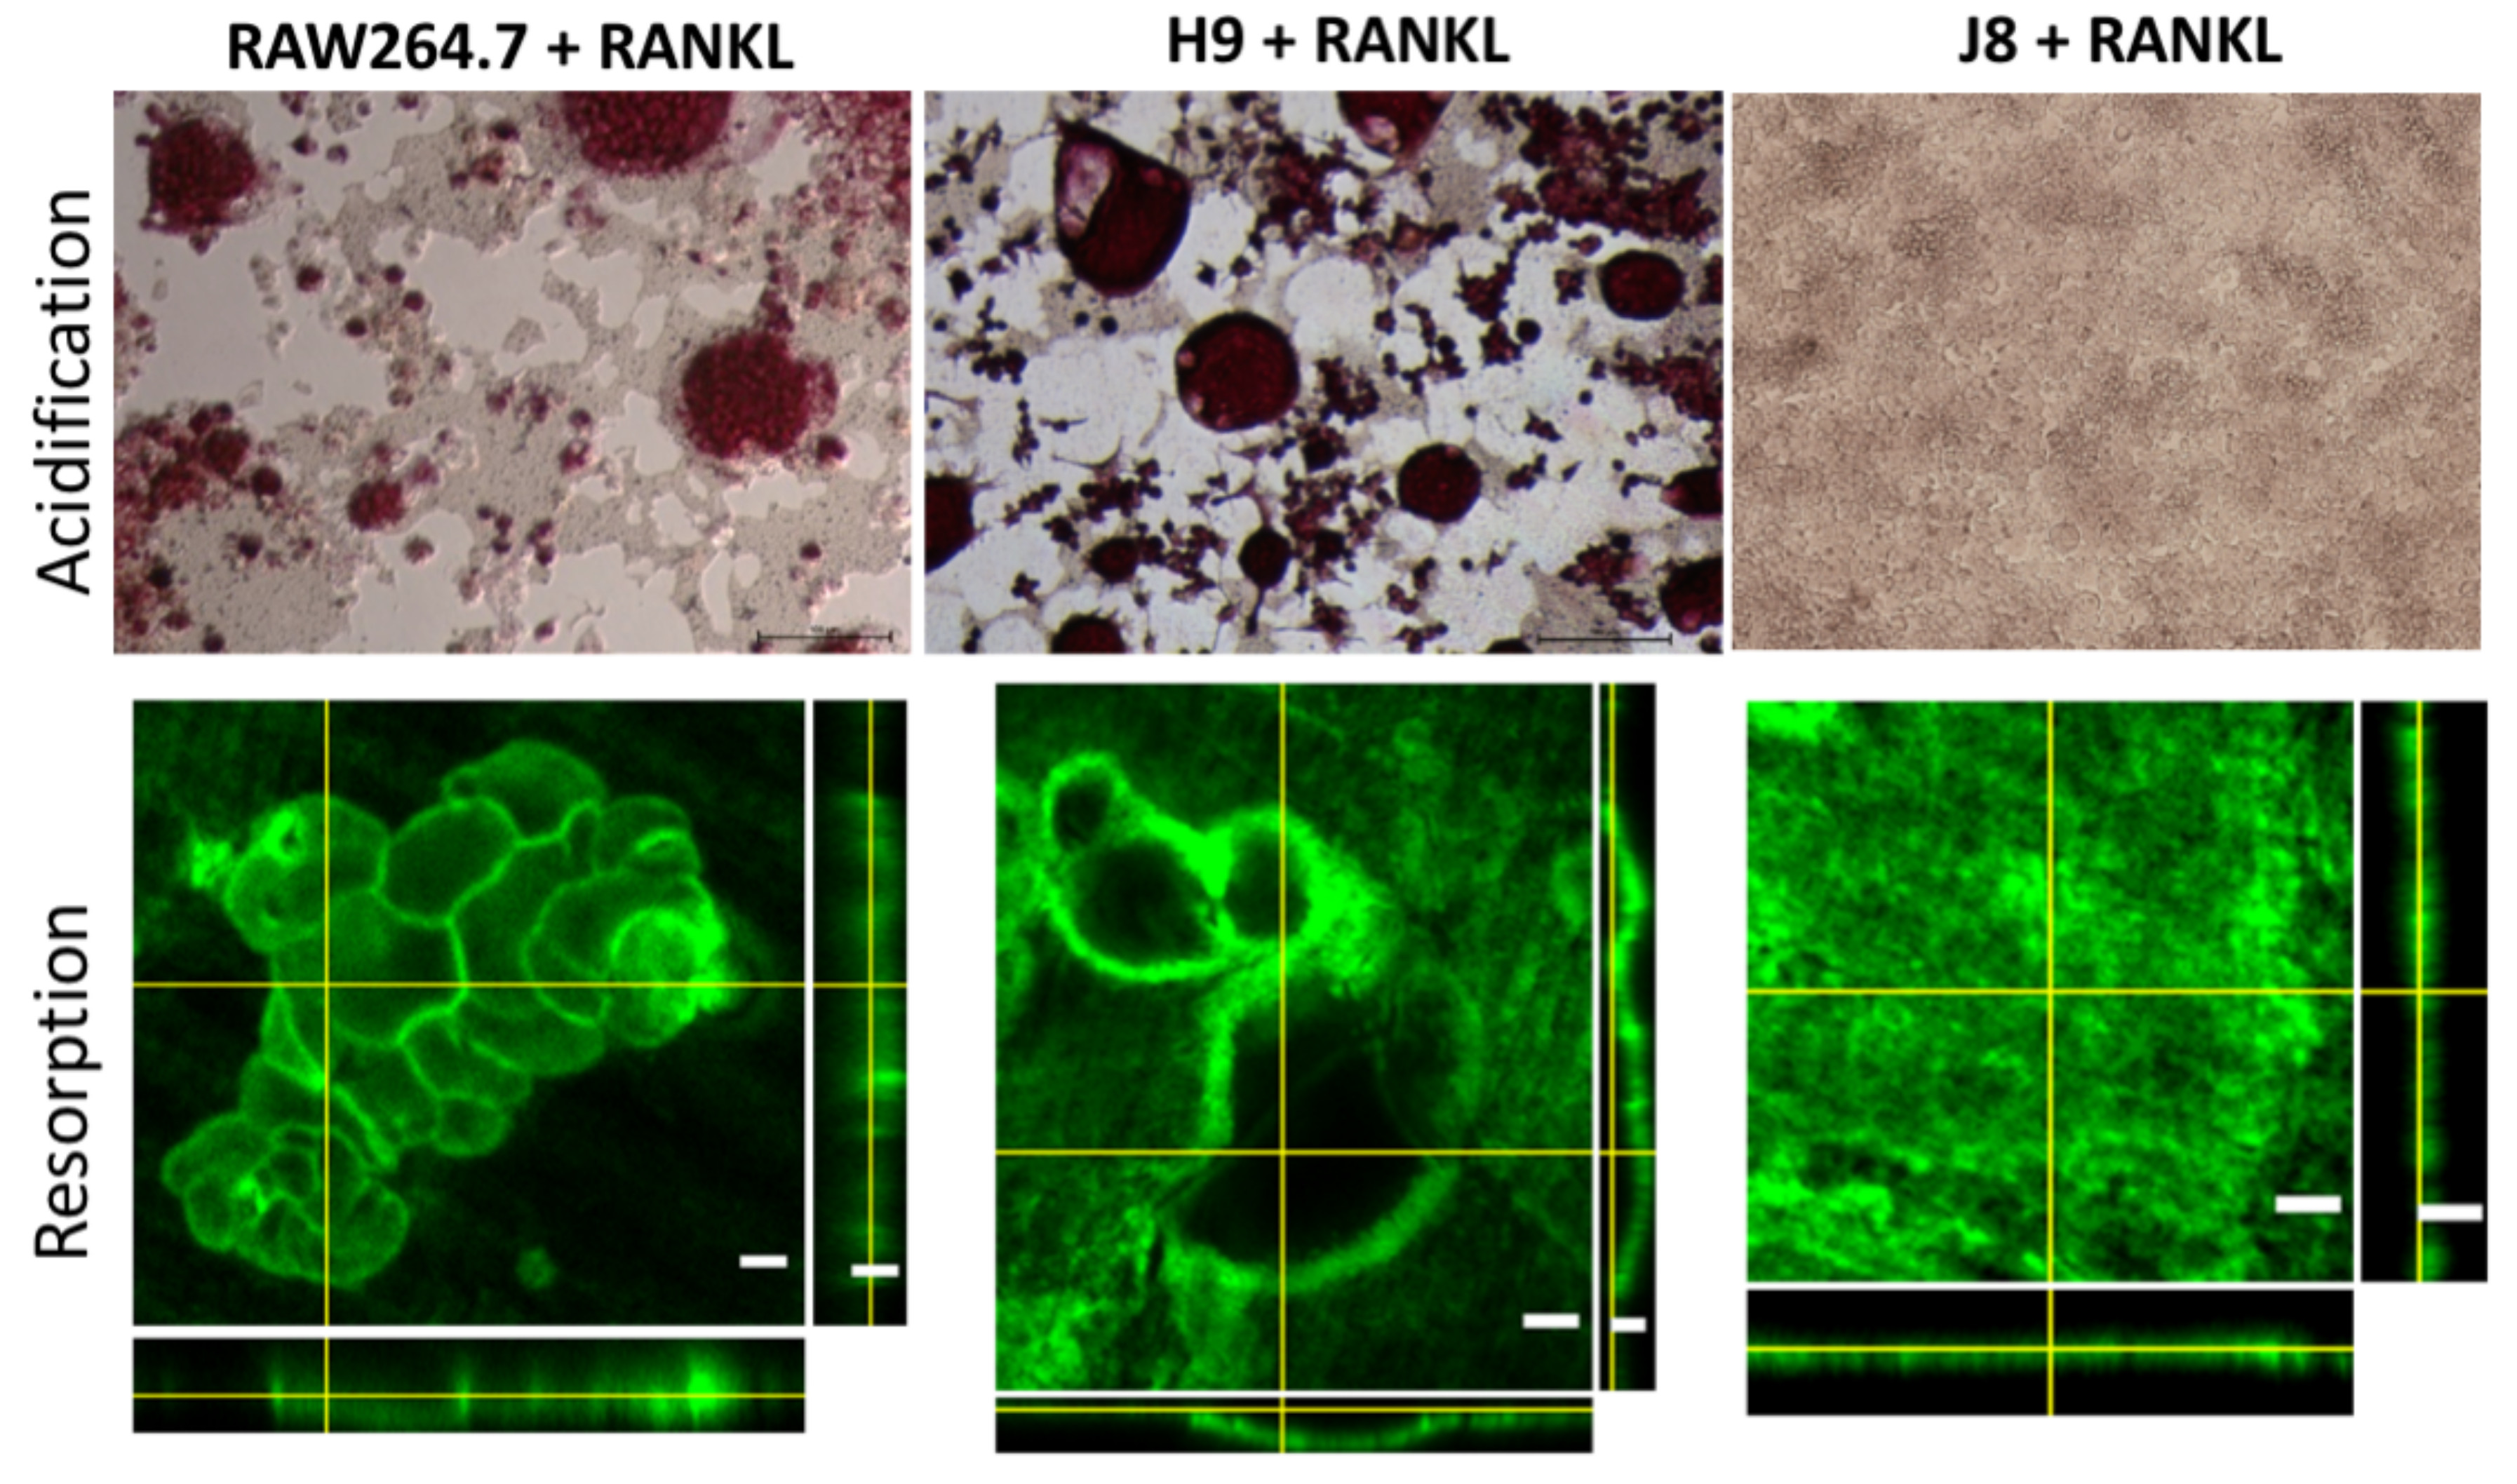
31]. Nevertheless, it has been debated whether RAW264.7 actually resorbs bone. RAW264.7 and sub-clone H9 were able to acidify to the same degree; however, H9 cultures seemed to form more sealing zones. Since demineralization likely requires the formation of polarized OCs with ruffled borders [
32,
33], formation of sealing zones and demineralization suggests that H9 and RAW264.7 can form polarized OCs.
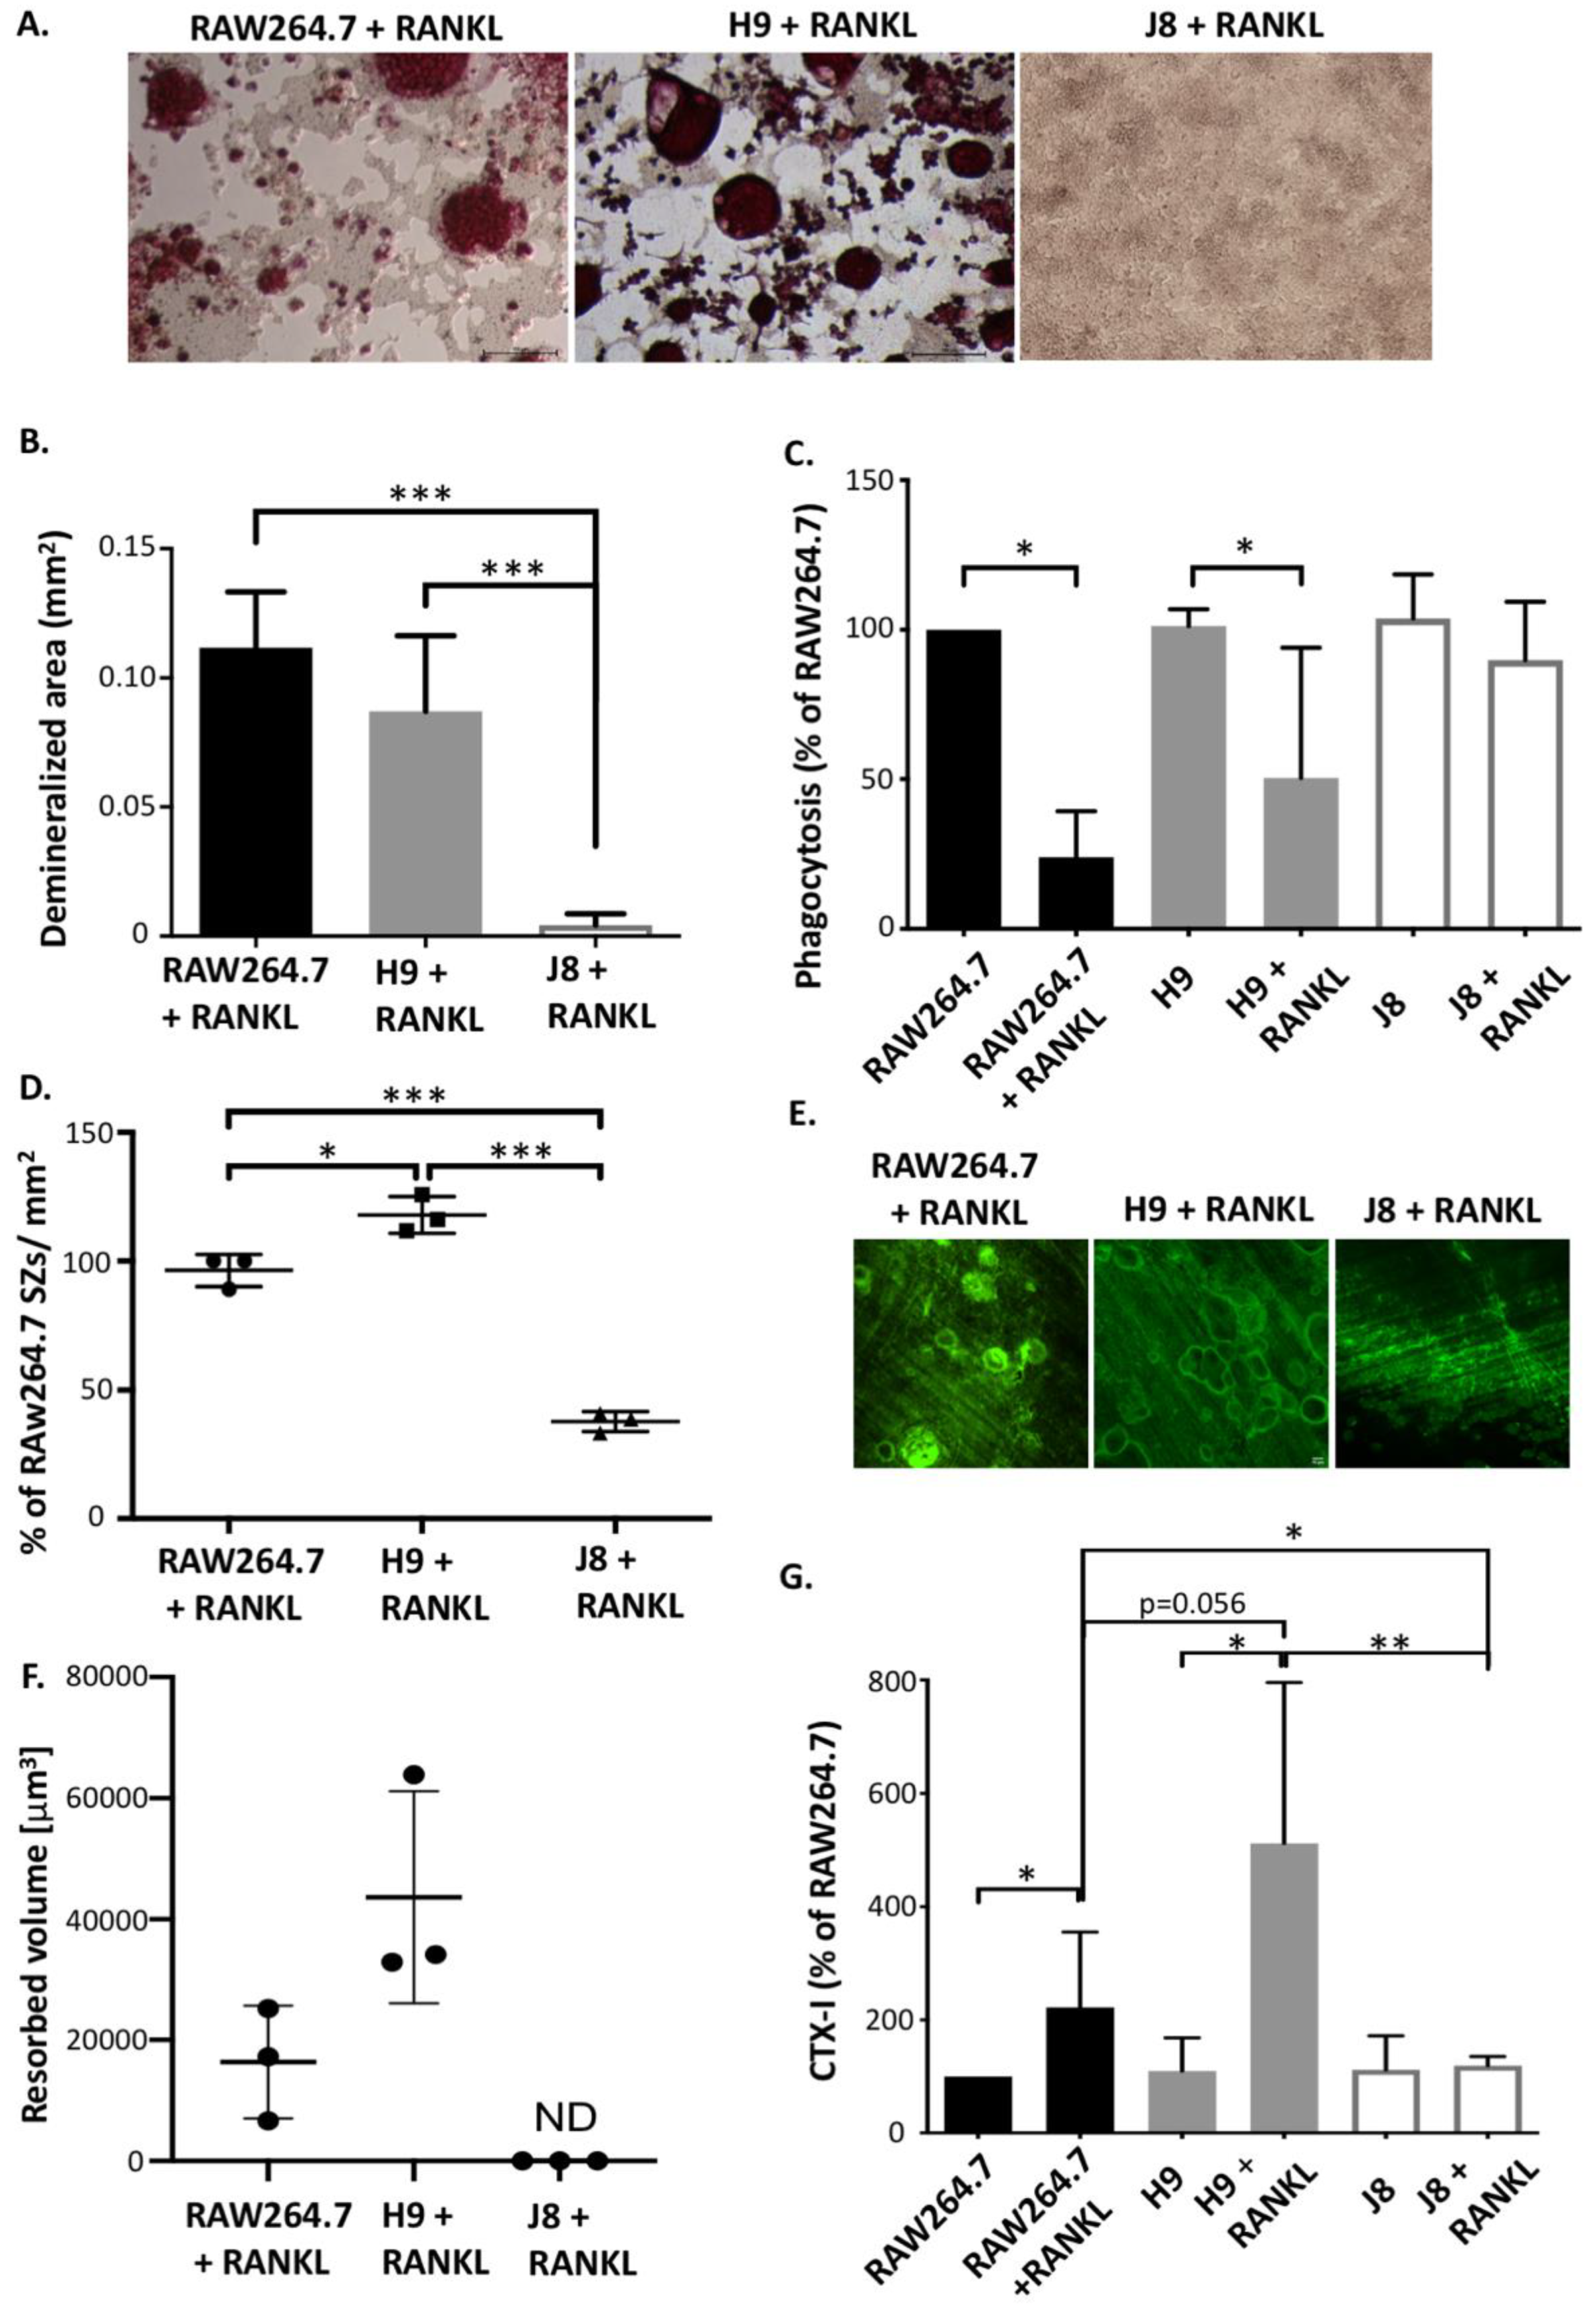
In addition to demineralization, sub-clone H9 and RAW264.7 also form resorption pits, thus further suggesting that under appropriate conditions H9 and RAW264.7 do resorb bone. Interestingly, H9 formed deeper resorption pits faster than RAW264.7, which could be an advantage in an experimental setup. Moreover, it has been shown that in the absence of CtsK, OCs form resorption pits that are more shallow but larger in area, indicating deficient collagen degradation [
34]. Furthermore, upon RANKL stimulation, both H9 and RAW264.7 produce detectable levels of the collagen degradation product CTX-I fragments. Therefore, the combined findings on the similarities and differences of H9s and RAW264.7s indicate that both degraded the mineral and the organic components of bone, and also that the measured difference in resorption could be due to lower CtsK expression in the parental RAW264.7.
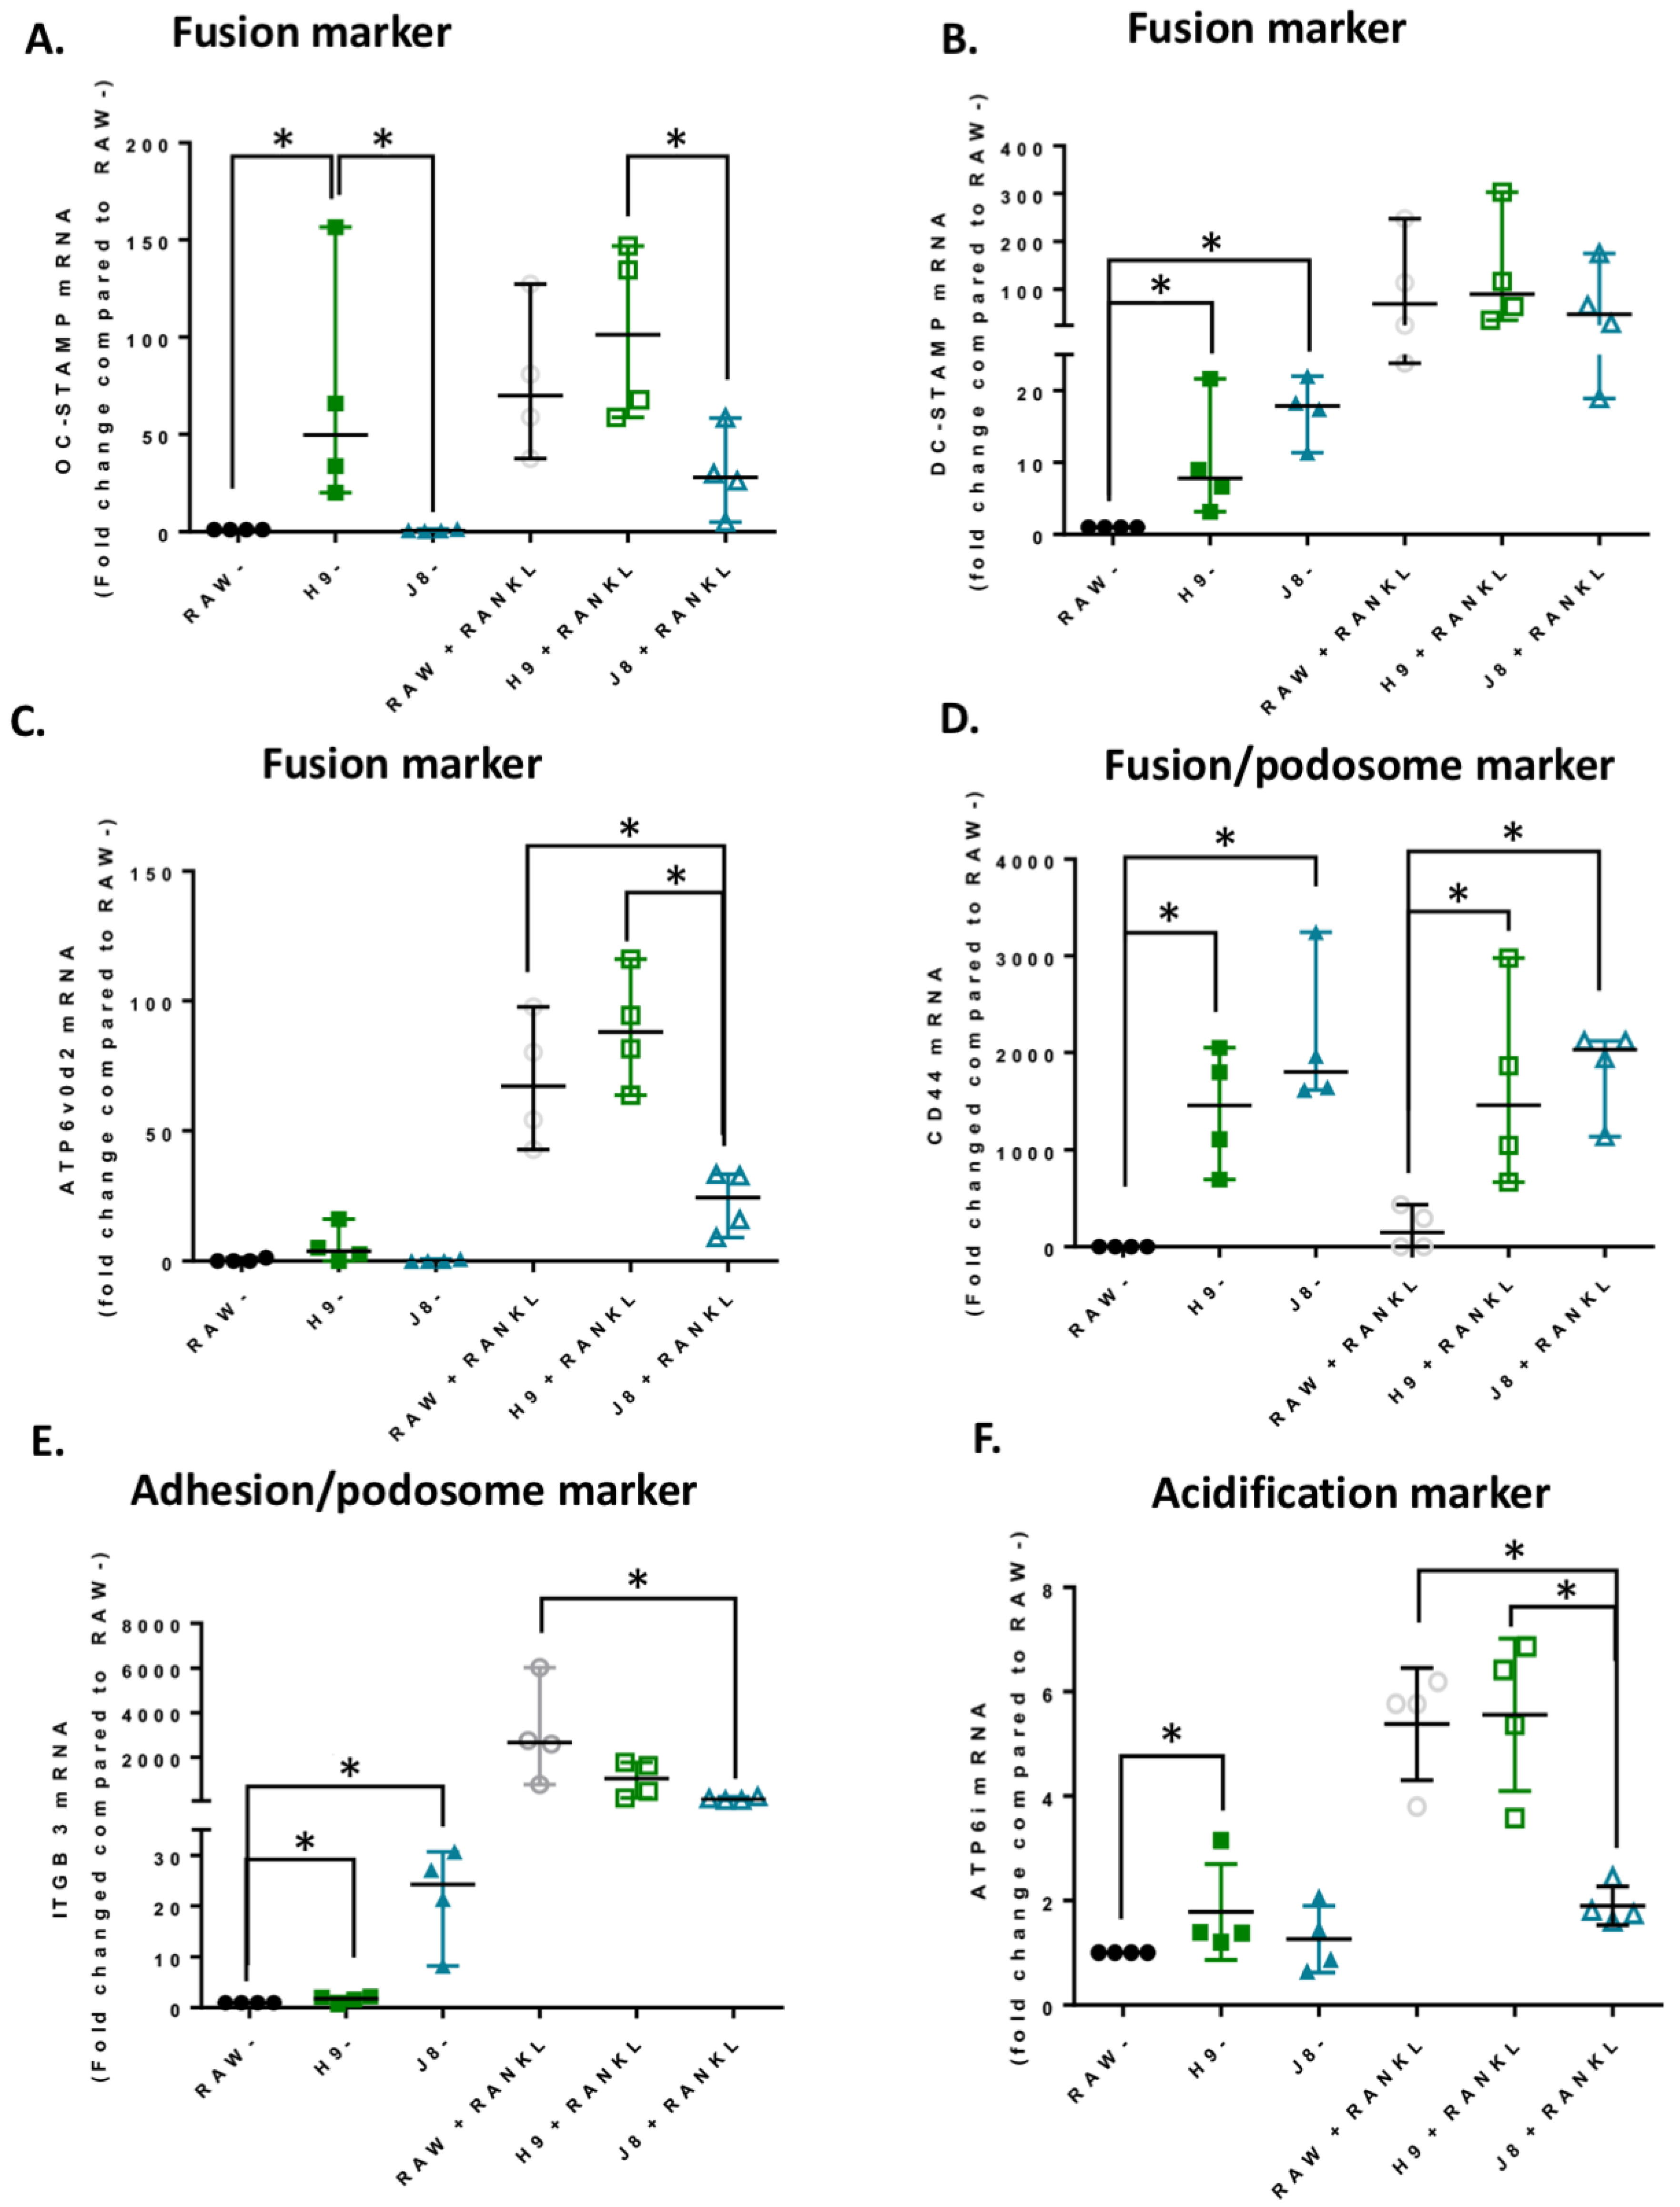
In line with the higher mRNA expression of CtsK and TRAP in unstimulated H9 compared with RAW264.7, the mRNA levels of several other OCs markers were elevated already in unstimulated H9. As expected, higher expression for OC-specific genes (e.g., OC-STAMP, ATP6i and ATP6v0d2) were measured in H9, while less specific OC-related genes (e.g., DC-STAMP and CD44) were higher in J8. However, after 4 days of RANKL stimulation mRNA expression of the OC-markers in H9 and RAW264.7 were similar. In summary, in experiments without RANKL-stimulation, the expression of OC-specific genes was significantly higher in sub-clone H9 and, typically, expression was also highest in RANKL-stimulated H9. However, the proportional difference between stimulated and unstimulated was highest in parental RAW264.7 cells, implying that they undergo the largest shift in expression of OC-specific genes upon RANKL-stimulation. This indicates an initial lower degree of differentiation and a higher potential to differentiate in any direction, but also, differentiation to OCs would occur slower when compared with the H9.
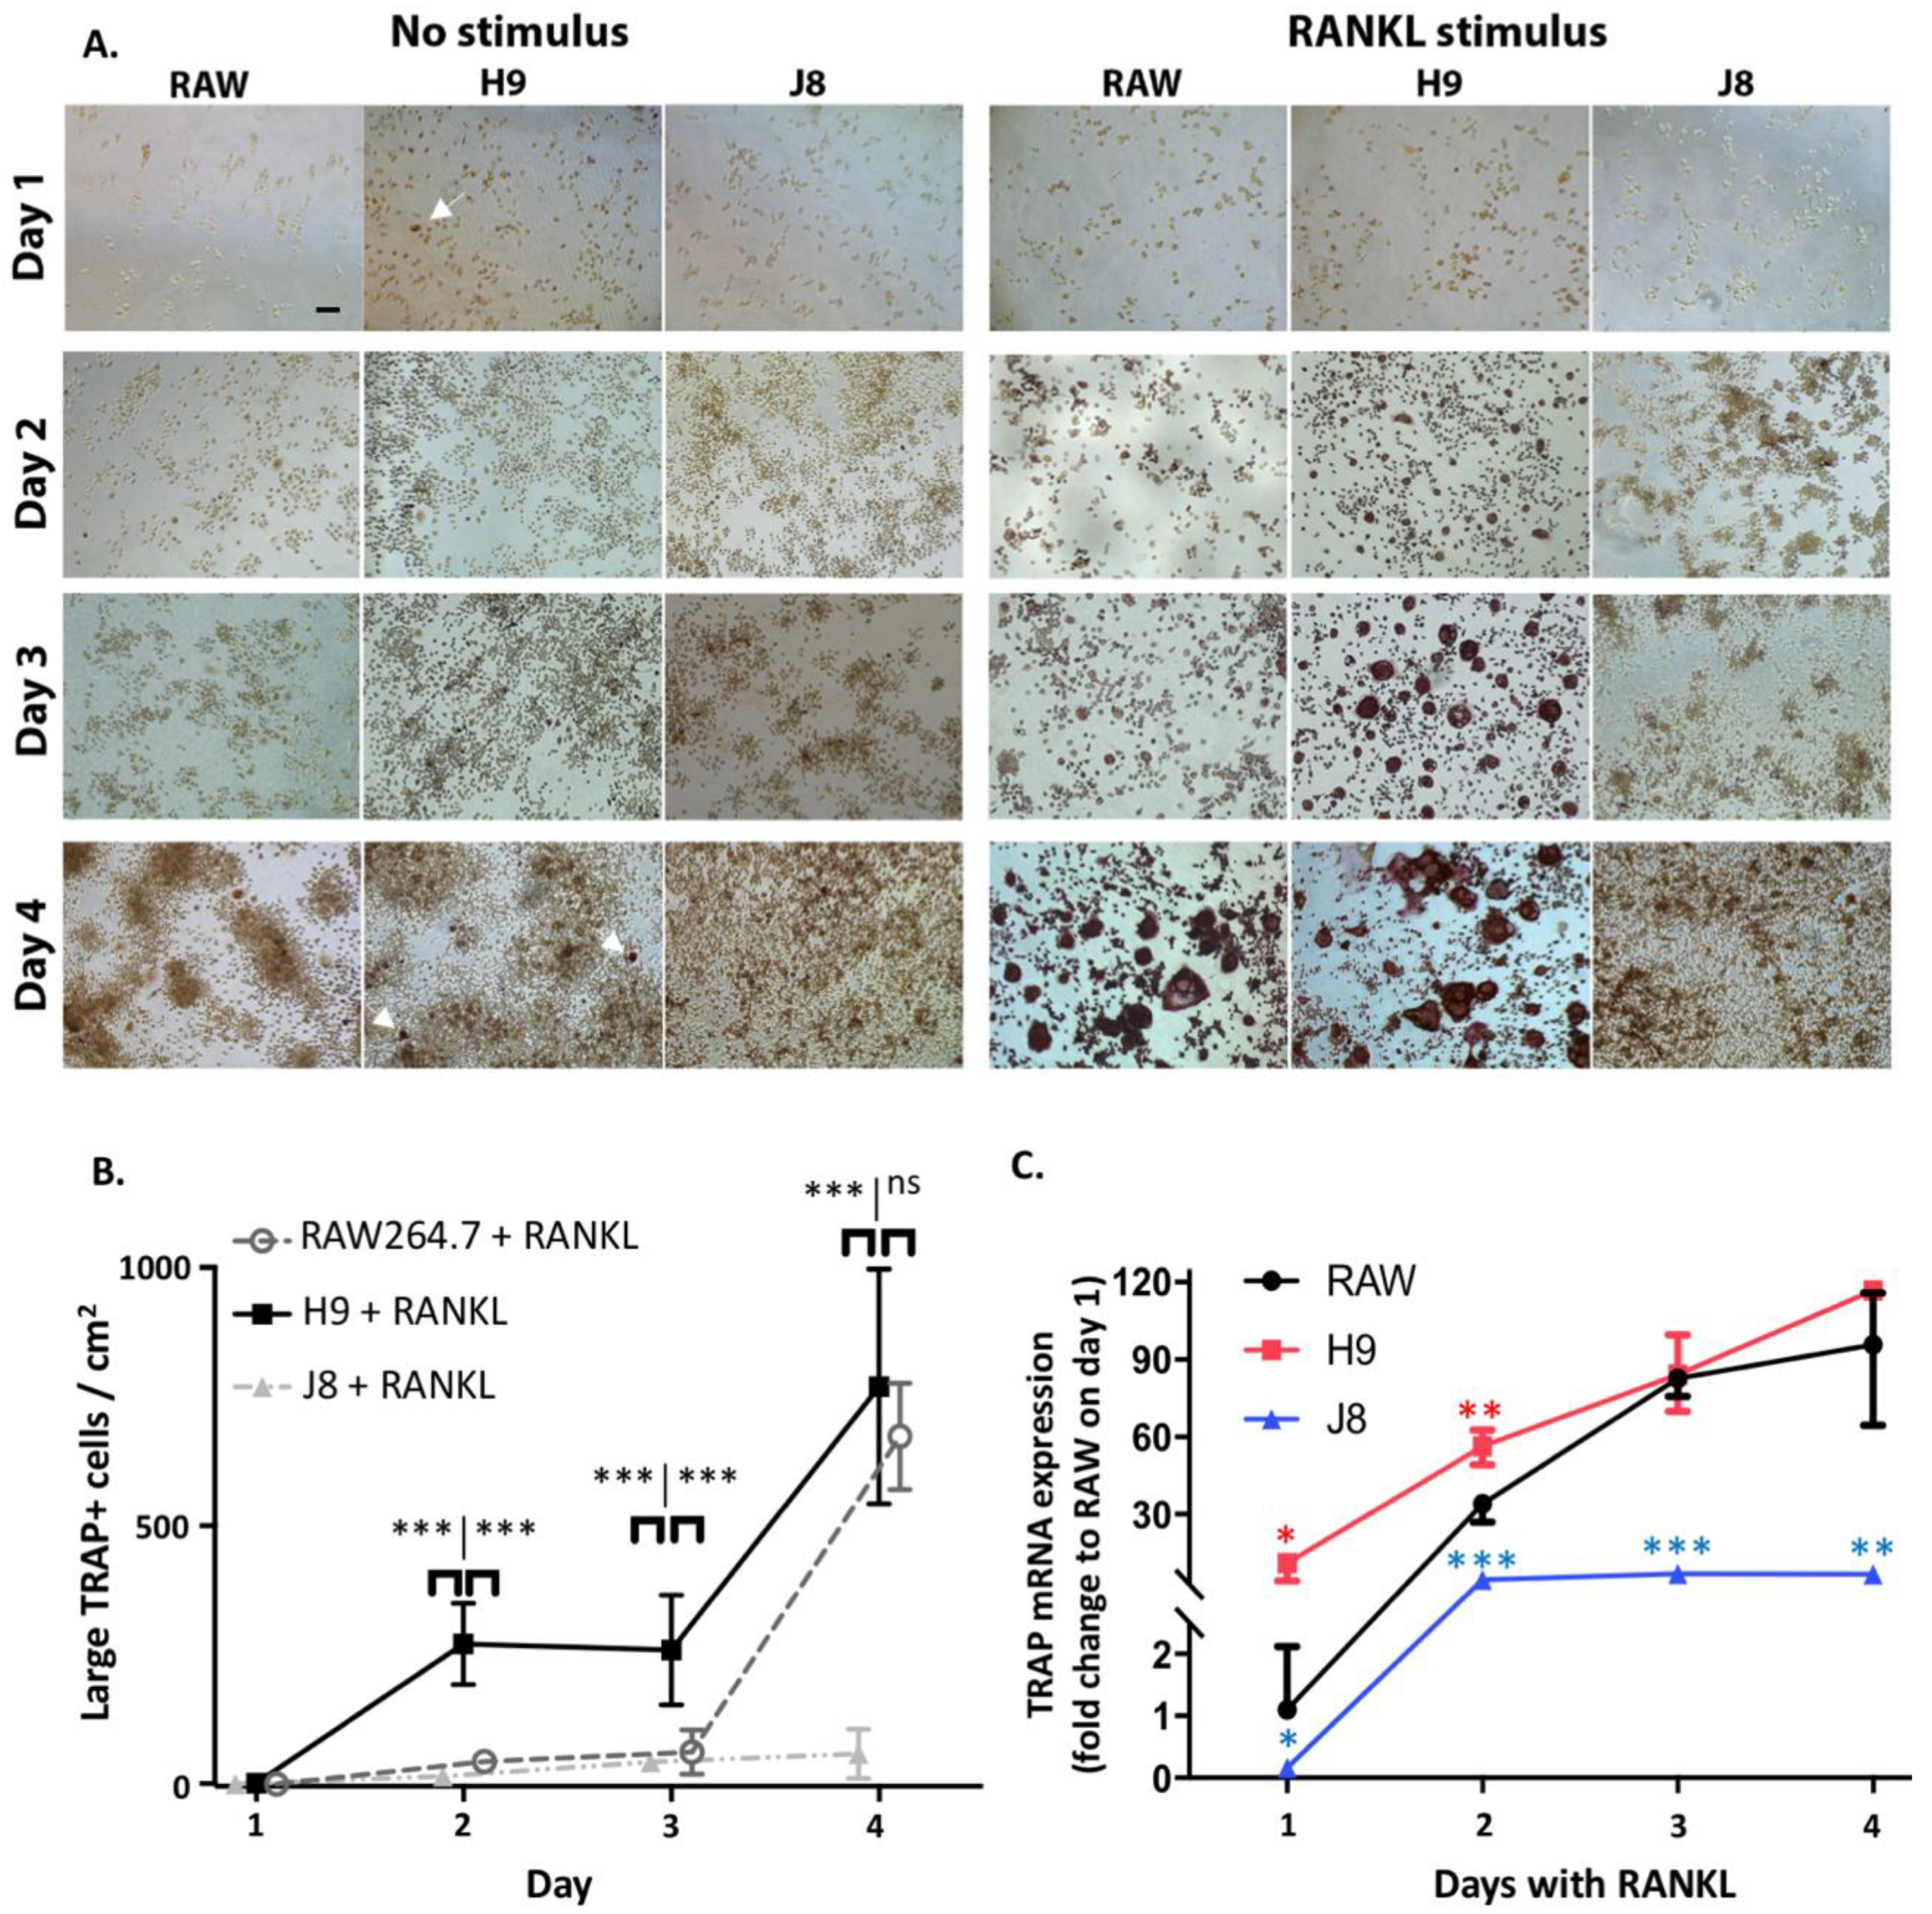
One reason behind this pattern was revealed by time course of differentiation following RANKL stimulation—that is, H9s are faster in forming OCs. The H9 cells form multinucleated TRAP-positive OCs already at Day 2 compared to Days 3–4 for RAW264.7. In more detail, the sub-clone H9 has an initial phase of OC differentiation between Days 1–2 which is lacking in RAW264.7. This is then followed by a second phase of OC differentiation between Days 3–4, which also occurs in RAW264.7. From these data, we hypothesize that H9 is more committed to the OC-lineage than the parental RAW264.7 population, but the parental population has the potential to differentiate into similar cells in most aspects. However, the large proportion of multinuclear TRAP-negative cells in unstimulated RAW264.7-cultures indicate that it may differentiate also to other directions in the absence of further stimulus.
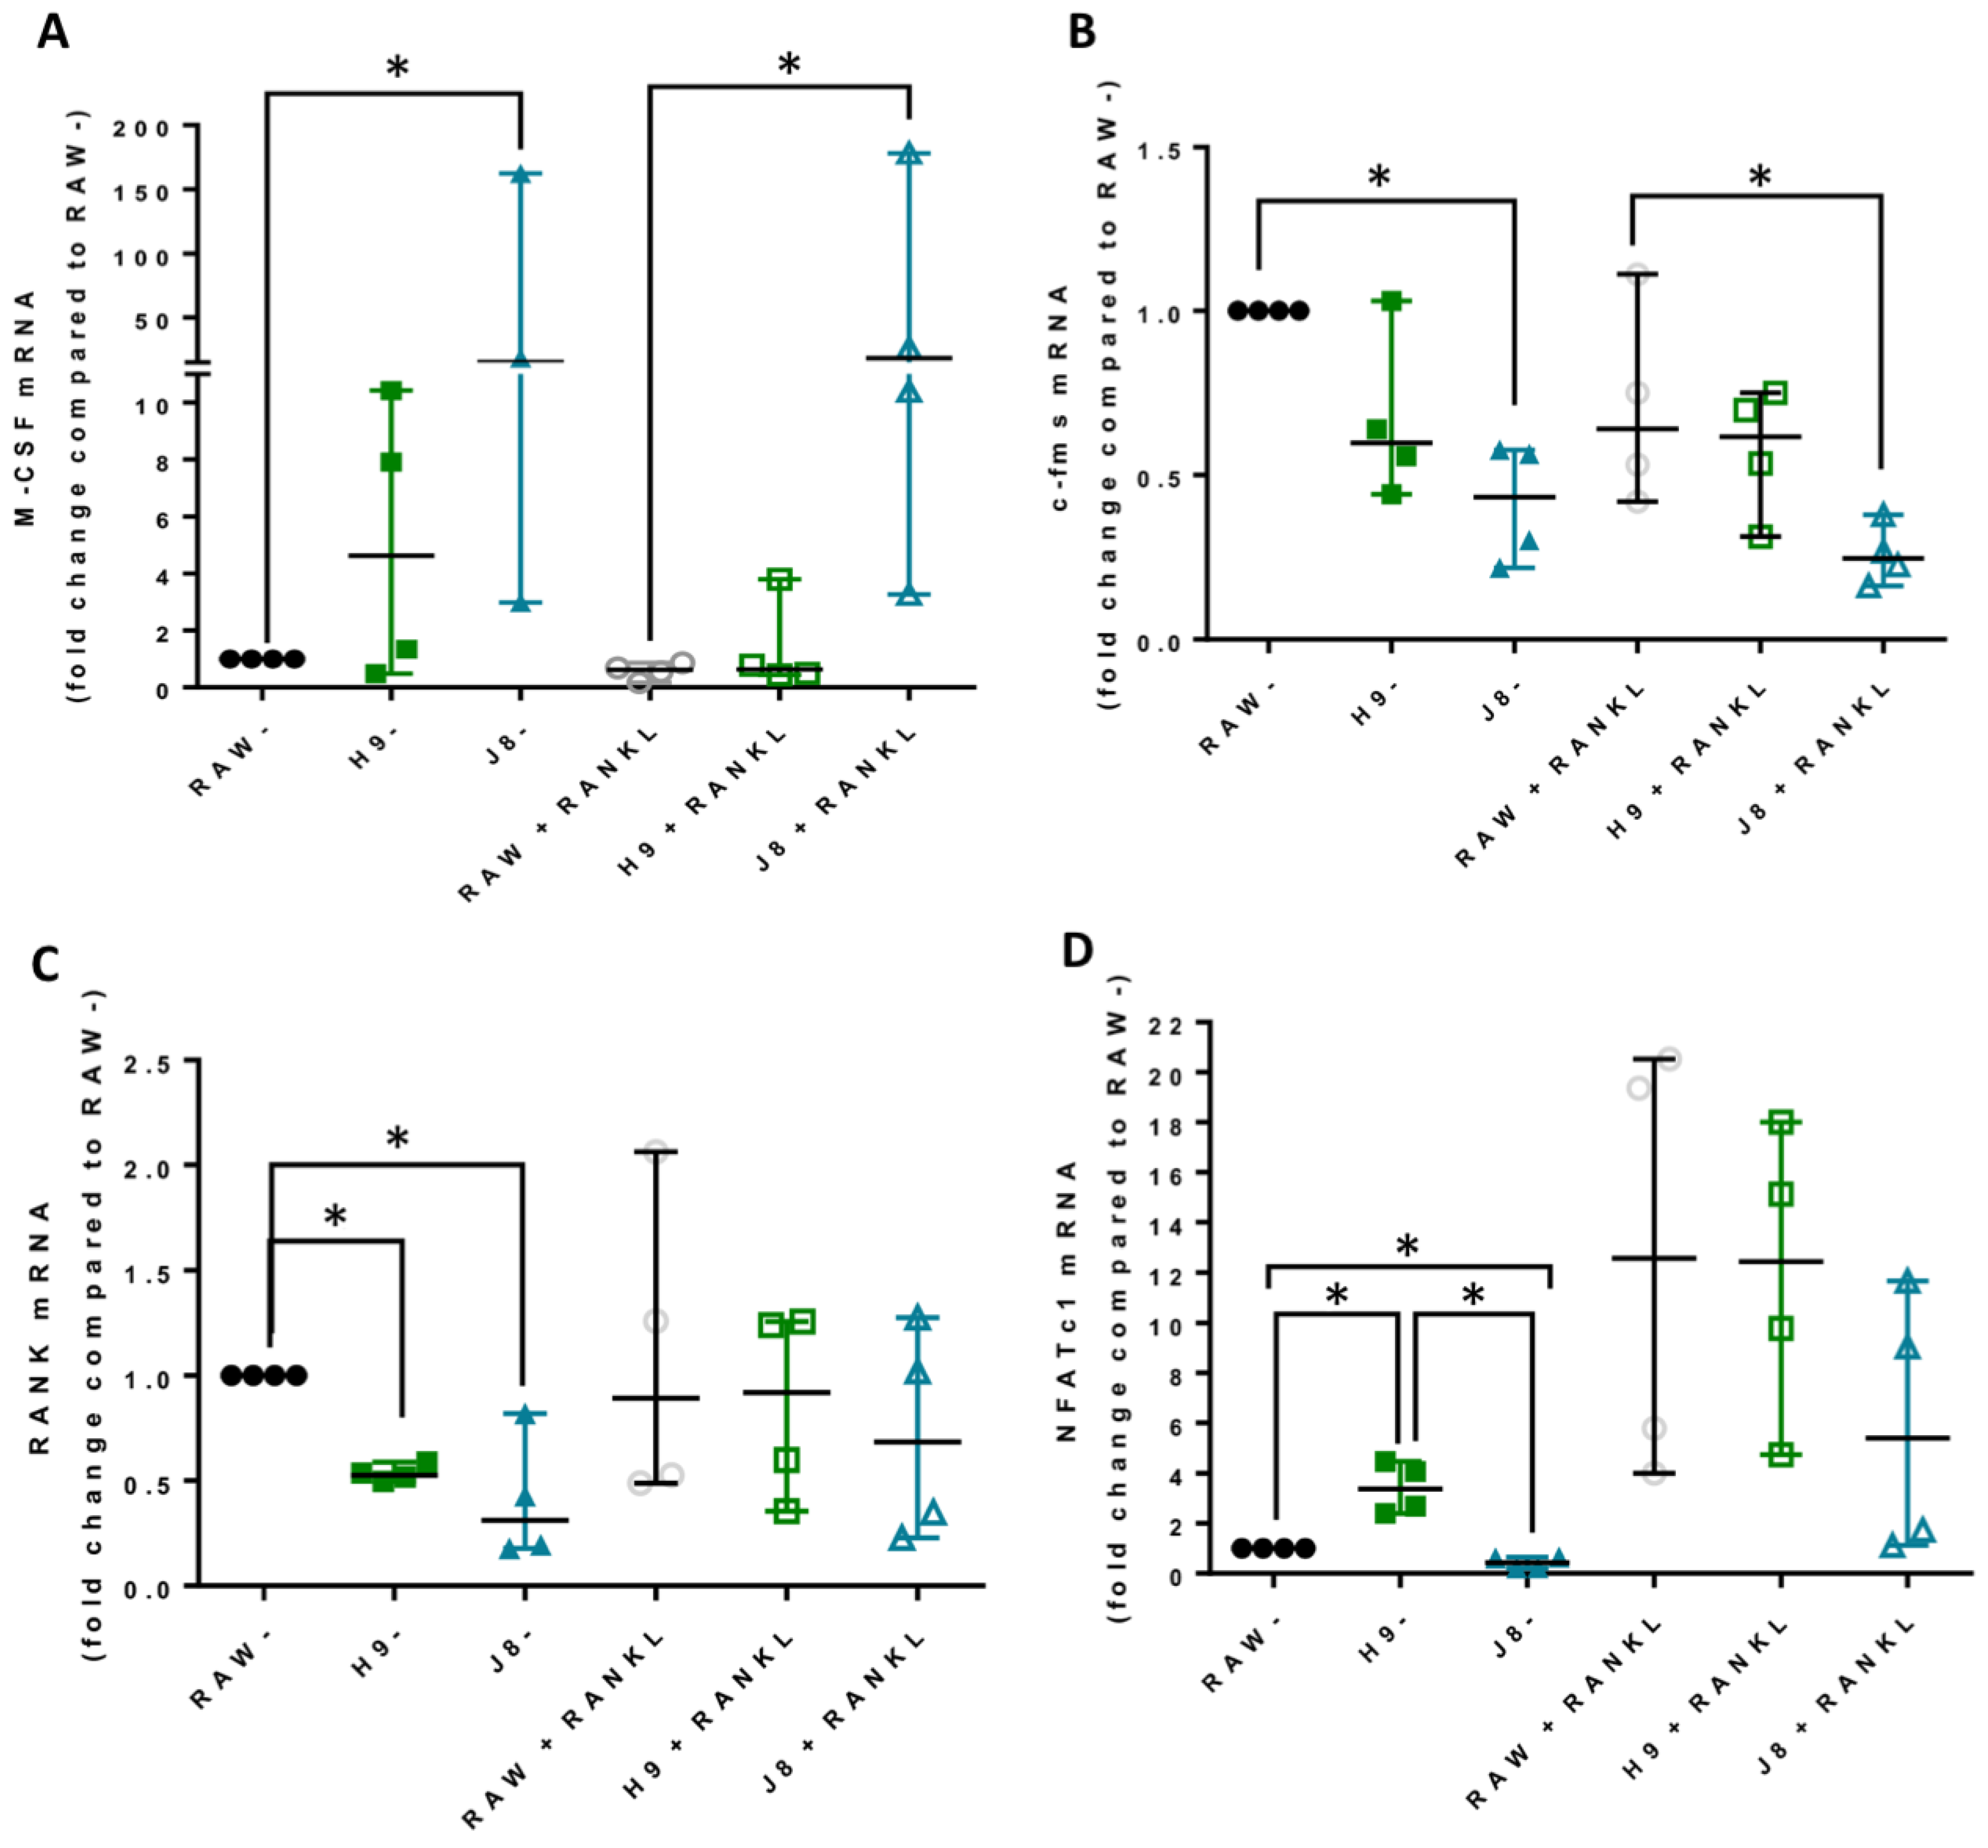
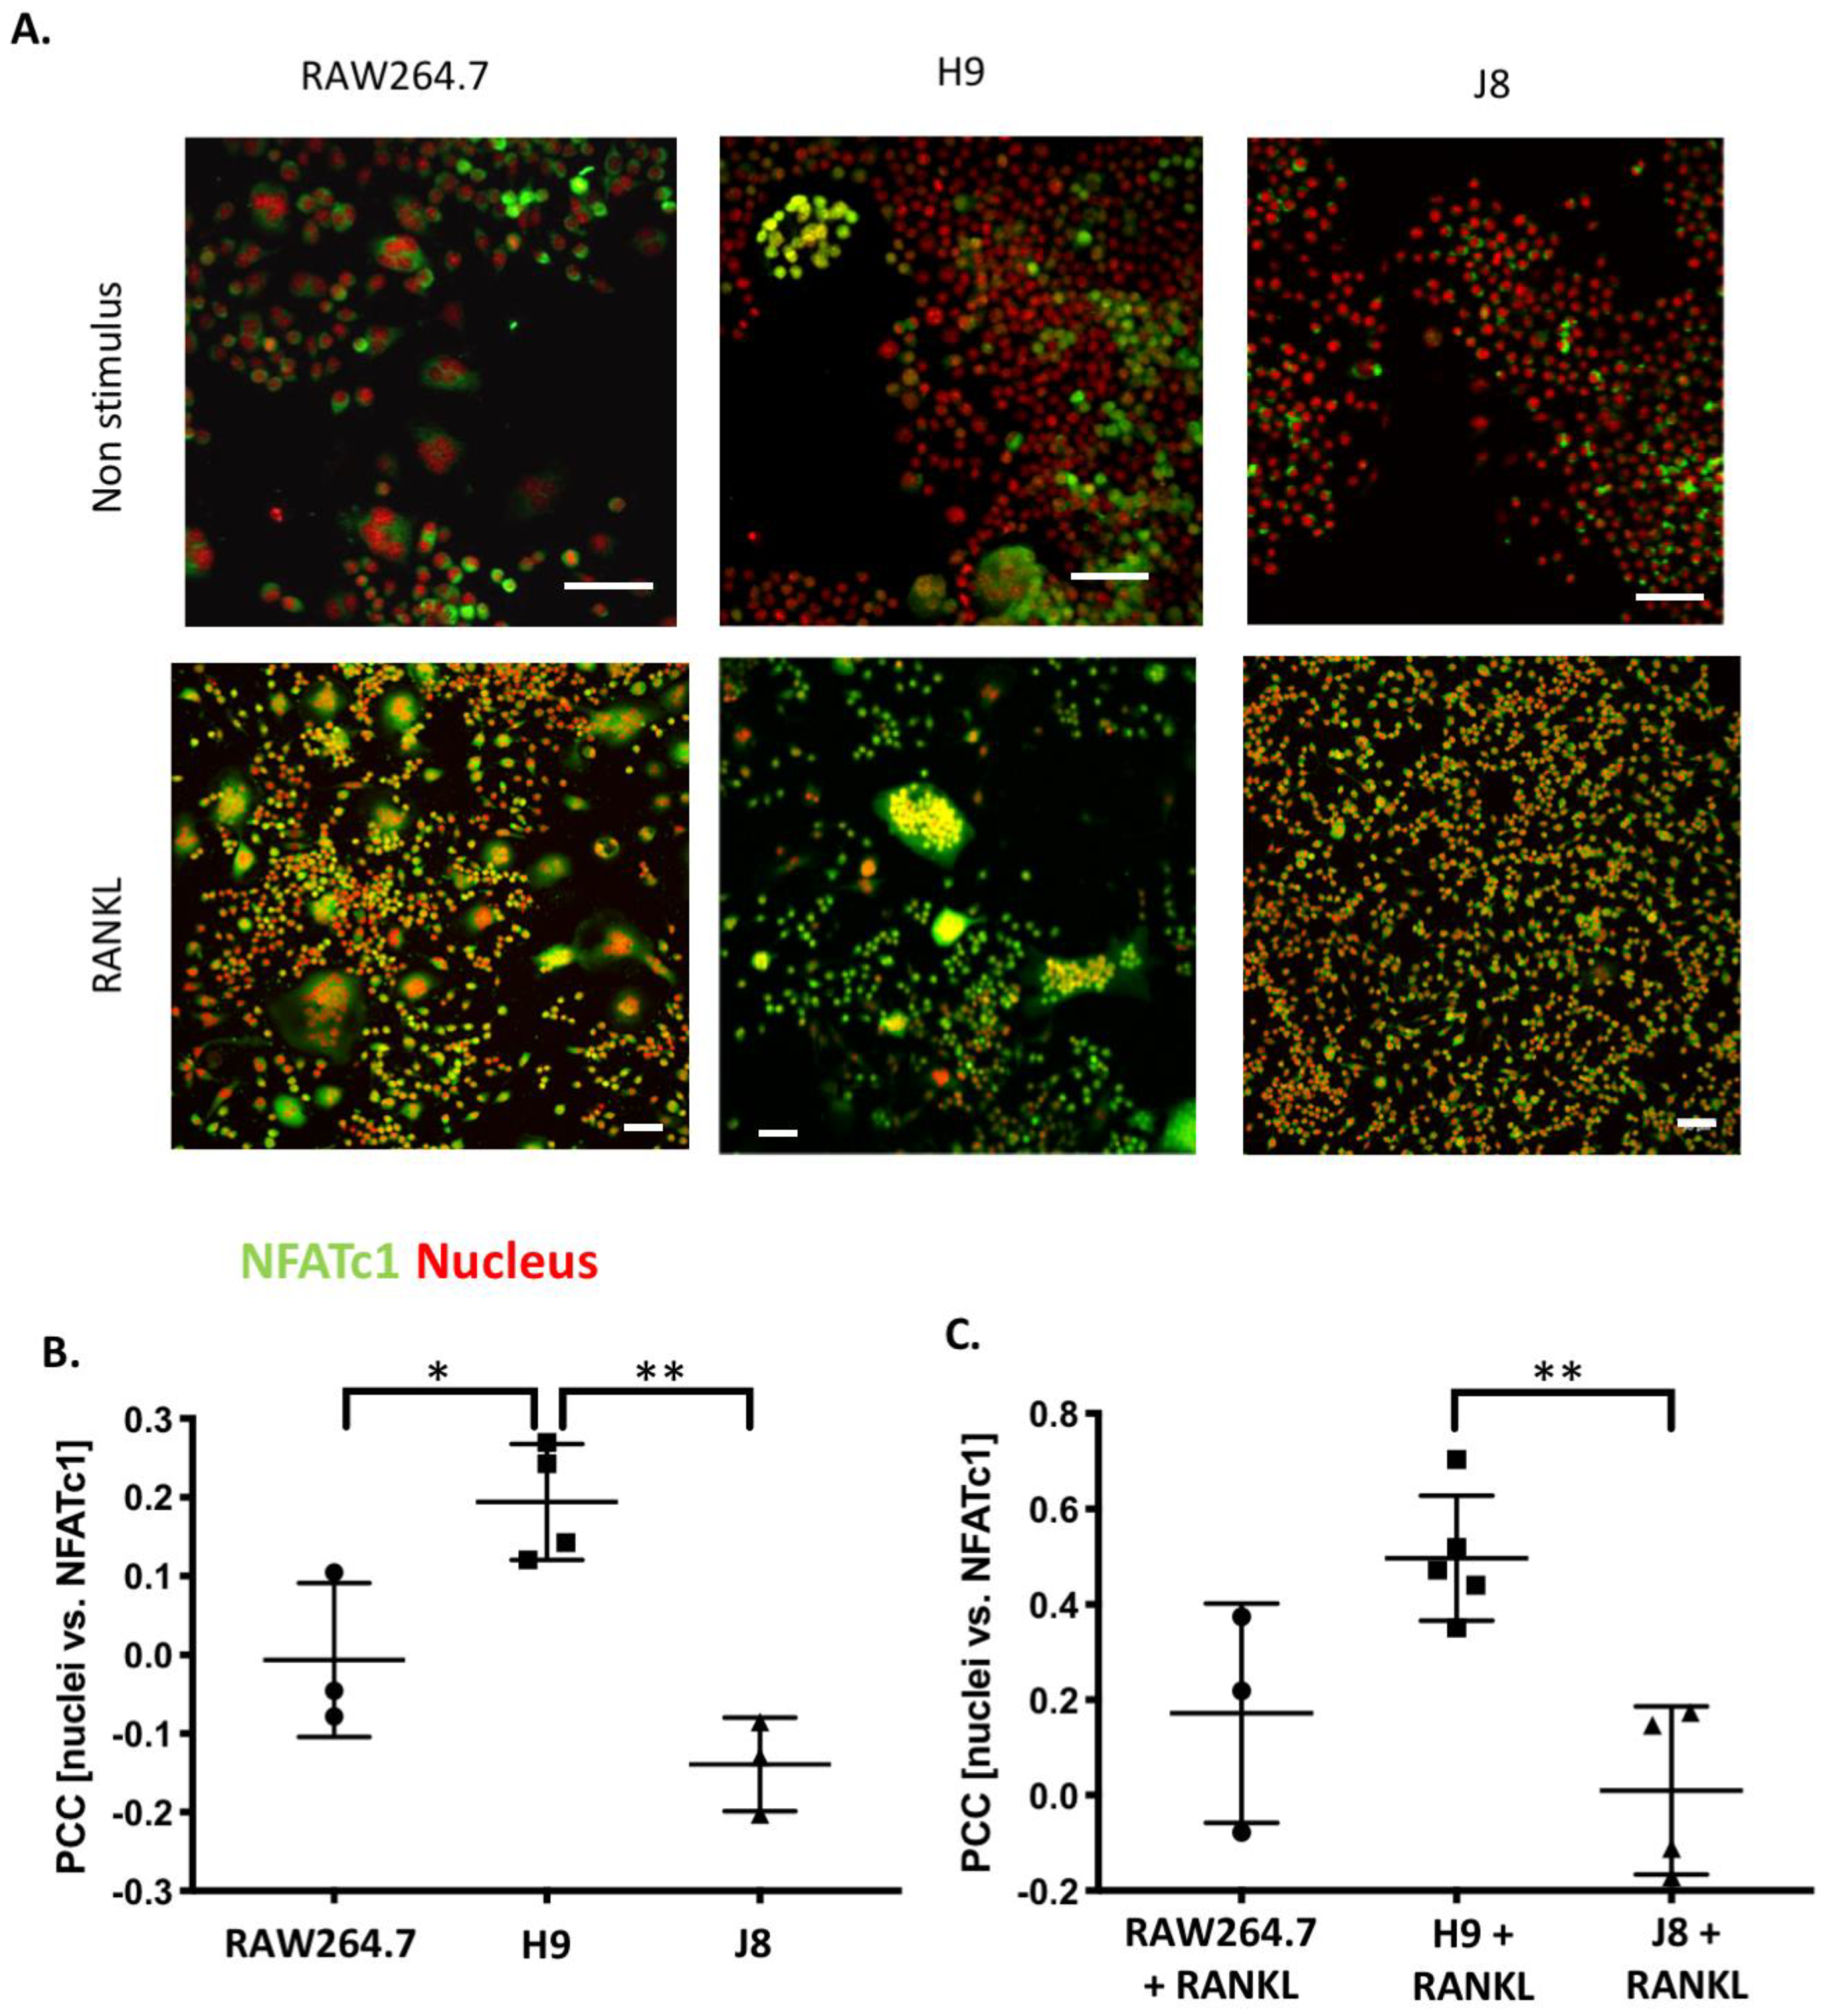
Considering OC-differentiation, mRNA expression of key osteoclastogenesis genes revealed that the most likely determinant of the difference between H9 and RAW264.7 was an elevated gene expression of the osteoclastogenesis master transcription factor, NFATc1, in unstimulated H9. Furthermore, unstimulated H9 also exhibits higher nuclear translocation of NFATc1, indicating that there is more active NFATc1 in unstimulated H9 compared to RAW264.7. On the contrary, gene expression of RANK was actually lower in H9 compared with RAW264.7, supporting the idea that RANK mRNA expression is not always correlated to the effect of RANKL stimulation in RAW264.7-derived cells [
22]. Combined, these data strongly suggest that H9 is a more committed OC precursor compared to the parental RAW264.7.
Sub-clone J8, selected for its low mRNA expression of TRAP and CtsK, did not exhibit any OC-like features. Instead, J8 presented a more macrophage-like phenotype, with low levels of TRAP+ cells, multinucleation, demineralization, resorption pit formation and expression of OC markers, but with high capacity for phagocytosis, also after RANKL stimulation. An inability of certain sub-clones of RAW264.7 to form multinuclear TRAP-positive OC-like cells has been reported before [
22] indicating the extent of heterogeneity in RAW264.7. Although J8 did not form multinucleated TRAP-positive cells or exhibit other OC-characteristics, it still responded to RANKL stimulation, since mRNA expression of M-CSF and its receptor were inversely regulated upon RANKL stimulation, suggesting a more active receptor signaling, consistent with a macrophage phenotype. Furthermore, an increased expression of OC-specific genes was also seen in J8. Still, nuclear translocation of NFATc1 seemed to be very low in J8. Characterization of J8 shows that J8 exhibits a macrophage phenotype dissimilar from the parental RAW264.7, one that is unable to fully differentiate to an OC. However, macrophage phenotypes are diverse and plastic (e.g., in vivo also TRAP-positive macrophages are common [
35,
36,
37]). Therefore, J8 does not represent macrophages in general.
In conclusion, RAW264.7 sub-clone H9 represent a more homogenous and OC-committed cell than the parental RAW264.7 cell line with OC features such as multinucleation, TRAP expression, demineralization and collagen degradation. Furthermore, H9 forms OCs in a short time span (i.e., on plastic TRAP-positive multinuclear cells appear in 2 days compared with 4 days for RAW264.7), and the first indications of resorption are observed after 3 days. This enables differentiation of a large number of OCs within a couple of days, thus reducing experiment time and reagent amounts. This could be especially valuable in initial larger screening experiments but also later in the scientific process to study osteoclastogenesis. Furthermore, we demonstrated that the expression of OC-genes, TRAP and CtsK, in unstimulated precursors can be used to purify heterogeneous OC-precursor populations and screen for clones that efficiently differentiate to OCs.
4. Material and Methods
4.1. Cell Culture
RAW264.7 and the selected clones were cultured in minimum essential medium (MEM-α) supplemented with 10% of heat inactivated fetal bovine serum (FBS), 100 µg/mL Gentamicin and 2 mM L-glutamine (all from Gibco, Life Technologies, Carlsbad, CA) referred to as cell culture media. All cells were incubated at 37 °C with 5% carbon dioxide (CO2).
4.2. RAW264.7 Single Cell Cloning
Single cell cloning of RAW264.7 was performed in 96-well plates (Nucleon, Delta surface, Nunc, Roskilde, Denmark). Single cell dilution was performed as follows (see also
Figure S1); 1 × 10
6 RAW264.7 cells were seeded into A1 and then serially diluted 1:2 in B1 to H1. This was followed by a second serial dilution in each row (e.g., A1–A12). Formation of single cell colonies was tracked, and the colonies later suspended by vigorous pipetting and expanded in T25 culture flasks (Sarstedt Inc, Leicester, UK), before freezing in cell culture medium supplemented with 10% dimethyl sulfoxide (DMSO) (Sigma, St. Louis, MO, USA). After selection, the sub-clones were expanded, and in the experiments the presented passage numbers were <10.
4.3. RANKL Stimulation
For gene expression analysis, RAW264.7 and sub-clones H9.2d5 (alias H9) and J8.2g6 (alias J8) were seeded at 5000 cells/well in 6-well plates (Nunc) +/− 10 ng/mL recombinant mouse RANK Ligand (R&D systems, Minneapolis, MN, United States) in cell culture media and cultured for 5 days. The medium was changed on every third day of culture.
4.4. RNA Purification and Reverse Transcription
For high-throughput screening and heat-mapping, the total RNA was purified using QIA Shredder + RNeasy Plus Mini or Micro Kit (Qiagen, Hilden, Germany) according to the manufacturer’s protocols. Quantification and the purity of the total RNA was determined using a NanoDrop Spectrophotometer ND-1000 (Thermo Scientific, Wilmington, DE, United States). Reverse transcription was performed on the total RNA using the SuperScript III Reverse Transcriptase Kit (Life Technologies) or iScript cDNA synthesis kit (BioRad, Hercules, CA, United States) according to manufacturer’s protocols on a Gene Amp® PCR System 9700 (Life Technologies, Carlsbad, CA, United States).
4.5. Real Time qPCR
PCR was run in duplicates of 10 µL with 1*iTaq™ Universal SYBR
® Green Supermix (BioRad, Hercules, CA, USA) or 1X KAPA SYBR FAST qPCR Master Mix (KAPA BioSystems, Wilmington, MA), 900 nM primer (
Table S1) in Hard-Shell
® High-Profile 96-Well Semi-Skirted PCR Plates (BioRad) sealed with Microseal ‘B’ Adhesive Seal (BioRad). The samples were run on the CFX96 Real Time PCR Detection System (Bio-Rad) according to the following process: 95 °C for 3 min followed by 40 cycles of 95 °C for 5 s, 60 °C for 5 s and 72 °C for 10 s followed by melt curve analysis. Analyses were made using CFX Manager 3.0 (Bio-Rad) and heat mapping was done using MultiExperiment Viewer 4.9 [
38].
4.6. TRAP Staining of OC Cultures
Samples were fixed with 4% formalin at room temperature for 30 s and then stained for tartrate resistant aid phosphatase activity using the Leukocyte acid phosphatase (TRAP) kit (Sigma-Aldrich Merck, Darmstadt, Germany) according to manufacturer’s protocols.
The cells were imaged using a Nikon Eclipse TE300 microscope (10X objective, Nikon, Stockholm, Sweden) and analysed using NIS-Elements software (Nikon, AR 4.30.01, Tokyo, Japan). TRAP-positive cells larger than 300 μm
2 (i.e., osteoclasts), were quantified using the ImageJ [
39] macro that counted cells gated positive for high staining intensity for red and blue RGB channels and size of stained area (code in
Supplementary material and methods).
4.7. Demineralization Assay
1 × 10⁴ cells/well of parental RAW264.7 and sub-clones H9 and J8 were plated on Corning Osteo Assay plates (Sigma, St- Louis, MO, United States) in cell culture media and treated with 10 ng/mL of RANKL (R&D Systems) for 7–8 days. The medium was changed every third day of culture. Finally, the cells were removed using water on Day 8 and the area acidified was measured using the Nikon Eclipse TE300 microscope (10X objective; Nikon, Tokyo, Japan) and analysed using NIS-Elements software (Nikon, AR 4.30.01 Tokyo, Japan).
4.8. Phagocytosis Assay
RAW264.7, H9 and J8 cells were seeded in a cell culture medium on 96-well plates (nucleon Δ surface, NUNC, Copenhagen, Denmark) at 5 × 10³ cells/well. The cells were treated with 10 ng/mL RANKL and the cell culture medium was changed on the third day. On Day 5, the cells were washed 3 times with PBS and incubated for 2 h with 100 µg/mL of fluorescent Alexa-488-labelled Escherichia coli bioparticles (Invitrogen Co., Carlsbad, CA, United States) in the cell culture medium. The cells were washed 3 times with PBS and the internalized bacteria was measured as an average value of 4 × 4 matrices and read at 490 nm using ClarioStar (BMG Labtch GMBH, Ortenburg, Germany) at room temperature.
4.9. Immunocytochemistry
RAW264.7, H9 and J8 (5 × 10³ cells/well) were grown in Lab-Tek II 8-well (Sigma-Aldrich, Saint Louis, MI, United States) plates in a cell culture medium for 4 days in 10 ng/mL mouse recombinant RANK Ligand (R&D systems). The cells were then washed twice with PBS, fixed with 4% paraformaldehyde for 15 min at 37 °C, and washed with PBS. After permeabilization with 0.1% Triton X-100 in PBS for 15 min, 0.1% BSA in PBS was added to the cells for another 60 min, both at room temperature. The cells were then stained overnight at 4 °C with anti-NFAT2 antibody (1:300) (#: ab2796, Abcam, Cambridge, UK). The wells were washed in PBS for 10 min 3 times, and the cells were stained with goat anti-mouse Alexa-488 (1:100) along with Hoechst 33342 (1:7000) and phalloidin-568 (1:400) (all Thermo Fisher Scientific, Waltham, MA, United States) overnight at 4 °C. The samples were washed 3 times (10 min/wash) in PBS and mounted onto glass microscope slides with ProLong Diamond (Thermo Fisher Scientific, Waltham, MA, United States) mounting medium. Z-stacks were captured with Nikon A1R+ confocal laser microscope system (NIKON) using 20X objective, a pixel size fulfilling Nyquist sampling theorem and NIS-Elements (Nikon, AR 4.30.01 Tokyo, Japan). Laser power and detector gain were adjusted to cover the widest possible range of intensity values for calculation of Pearson’s correlation coefficient (PCC). Three-dimensional colocalization was measured from the entire captured z-stacks as PCC with the ImageJ colocalization plugin using automated Costes approximation of background (Wright Cell Imaging Facility, UHN, Toronto, ON, Canada).
4.10. Bone Chips
Rods (6 mm in diameter) of bovine femoral cortical bone were cut with the ISOMET Low Speed Saw (Buehler, Esslingen, Germany) into 100–150 µm thick slices. The slices were washed by ultra-sonication for 20 min in 70% ethanol and rinsed extensively in distilled water. For long-term storage, the slices were kept in 20% ethanol at 4 °C.
4.11. Bisphosphonate Staining and Resorption Pit Imaging
The cells were plated on the bone discs at a density of 2 × 10
4 cells/well and treated with +/− 10 ng/mL mouse recombinant RANK Ligand (R&D Systems) for different time points. After the third day of culturing, the medium was acidified. The medium was changed every third day, coinciding with the collection and fixation with 4% formalin for 30 s. The fixed bone chip cultures were permeabilized with 0.1% Triton X/PBS for 15 min and incubated with fluorescent bisphosphonate (1:1000, kindly provided by Dr. Fraser Coxon, University of Aberdeen, Aberdeen, UK), Alexa Fluor 568 phalloidin (1:400; Thermo Fisher Scientific, Waltham, MA, United States) and Hoechst 33342 (1:3000; Thermo Fisher Scientific, Waltham, MA, United States) in 0.1% BSA/PBS for 30 min. The discs were washed twice in PBS, once in distilled water and mounted onto a microscope slide using the Prolong Diamond hard set mounting medium (Thermo Fisher Scientific, Waltham, MA, United States) and left to dry overnight at room temperature in the dark. Z stack images were acquired on the Nikon A1R+ confocal laser microscope system (Nikon, Tokyo, Japan) using 20X objective and NIS-Elements (Nikon, AR 4.30.01, Tokyo, Japan). The resorbed area was measured along the pit edges without considering the pit depth. Three fields of view from technical duplicates from 3 independent experiments were quantified. The pit depth was measured from the z-stacks by selecting the section with the highest fluorescence intensity at the pit bottom and measuring the difference between that and the surface of the un-resorbed bone using the section thickness. From the technical replicates from 3 independent experiments, the 8 deepest pits for each field of view were quantified—a total of 72 resorption pits per sub-clone for each time point. The resorbed volume was calculated by assuming a semi-ellipsoidal geometry of the resorption pit (Formula (1)).
4.12. Measurement of Type I Collagen Degradation Marker (CTX-I)
The cells were seeded at 2 × 10⁵ cells/well on bone chips in a cell culture medium. After 3 days of culturing, the cell culture medium was changed to an acidified medium (cell culture medium with a final pH of 6.5 (= 0.085% HCl)) and the cells were treated with +/− 10 ng/mL of recombinant mouse RANKL (R&D systems). The medium was collected on Day 3, 6, 9 and 12 after the start of culture. The bone resorption activity was determined by quantifying the C-terminal telopeptide degradation product of type I collagen in 50 L aliquots of the culture supernatants using CrossLaps® for culture (CTX-I) ELISA (IDS, Tyne and Wear, UK) according to the manufacturer’s instructions. The CTX-I concentrations present in the medium from cells on the plastic and bone slices without cells were subtracted.
4.13. Transmission Electron Microscopy (TEM)
RAW264.7 cells were seeded at 2 × 10⁴ cells/well on dentine and treated with 10 ng/mL mouse recombinant RANK Ligand (R&D systems). The RAW264.7 cells on dentine were fixed with 2.5% glutaraldehyde in 0.1 M cacodylate buffer pH 7.4 overnight at 4 °C. The discs were then decalcified in 2% glutaraldehyde in 0.1 M cacodylate buffer with 0.1 M EDTA pH 7.4, with changes every 2–3 days for approximately 3 weeks. Following decalcification, the discs were cut into quarters and processed for routine TEM as follows: the discs were first placed in 1% osmium tetroxide in water for 1 h, followed by 1 h in 1% uranyl acetate in H2O. The discs were then dehydrated through a graded series of ethanol and embedded in epoxy resin, which was polymerized at 60 °C for 2 days.
Once polymerized, the resin blocks containing the dentine discs were trimmed for ultramicrotomy using Leica EM UC7 (Leica Microsystems, Wetzlar, Germany). Initially, 500 nm-thick survey sections were stained with toluidine blue and examined by light microscopy to confirm the presence of resorbing osteoclasts on the dentine. Once an osteoclast was located, 200–300 nm-thick sections were cut and collected onto formvar coated copper grids. The sections were counterstained in Leica EM AC20 (Leica Microsystems, Wetzlar, Germany) with standard solutions of uranyl acetate and lead citrate to enhance contrast. Electron micrographs were taken using the JEOL 1400 Plus transmission electron microscope equipped with UltraVUE camera (AMT, Woburn, MA, USA).

 and
and 


