1. Introduction
The pineal indole melatonin is a tryptophan-derived hormone, synthesized and released by the pineal gland during the dark period in all vertebrates [
1]. Even though this gland is the organ responsible for the serum concentrations at night, both precursors and synthetic enzymes as well as melatonin itself have been found in many other tissues including the Harderian gland, retina, and gut among others [
2,
3,
4]. However, the contribution to the systemic circulation by these tissues is minimal—if any—as it is deduced from the fact that pinealectomy leads to a total drop in melatonin serum levels and, as a consequence, the lack of circadian rhythmicity [
5]. Melatonin has been highly conserved during evolution which has recently led to propose the well-known antioxidant activity of the indole as the first function, since there is evidence of its presence in primitive organisms with aerobic metabolism. Therefore, melatonin would help in eliminating reactive oxygen species generated during oxidative phosphorylation [
6]. In vertebrates, however, melatonin displays different functions, the most important being the biological clock indicating the light-dark period, and regulating the reproductive cycle, thus fulfilling an important role in organisms with seasonal reproduction [
7,
8].
At cellular level, melatonin can exert its functions in different ways. Firstly, by binding to specific G-coupled membrane receptors (i.e., MTNR1A, MTNR1B, and MTNR1C), which possess potential glycosylation and phosphorylation sites for various proteins such as protein kinases A and C (PKA, PKC). The corresponding associated G proteins will in turn give rise to signaling cascades that ultimately end up modifying different intracellular routes [
9]. As an alternative, a receptor-independent, direct antioxidant ability associate with its chemical structure has also been well documented. In this way melatonin molecule can donate one or more electrons to free radicals, thus neutralizing its oxidizing activity or can act synergistically with other antioxidant molecules such as ascorbic acid or α-tocopherol [
10].
In addition to its broad physiological properties, numerous research groups have reported different antitumor effects of the indole on several tumor types including breast, colon, ovary, endometrium, prostate, liver and skin cancer cells, among others [
11,
12,
13,
14,
15,
16,
17]. Furthermore, the indole is capable of inhibiting cell growth, either leading tumor cells to a cell cycle blockage at some stage, acting as an antagonist of other pro-tumorigenic molecules such as estradiol in breast cancer, or by preventing the activation of the androgen receptor in prostate cancer [
18,
19,
20]. Another reported antitumor activity of melatonin relates to its ability to regulate the cell death processes. Although the role of melatonin as an apoptosis inhibitor in immune and neuronal cells was described more than two decades ago, more recently some authors have also shown that melatonin may have proapoptotic effects on tumor cells, commonly associated to its ability to inactivate NF-κB or to increase specific cytokine levels such as IL-6 [
21].
The skin is one of the major defensive barriers against the environment, and also an organ where melatonin synthesis has been demonstrated [
22]. Skin has all the molecular and biochemical machinery to produce melatonin and is mainly located in the upper layers of the epidermis [
23]. Therefore, one of its main functions is the protection against UV radiation which, due to its high energy, can cause harmful alterations at genetic and cellular level, being therefore one of the main etiological agents involved in the development of skin cancer [
24]. Among skin tumors, melanoma is frequently characterized by its poor prognosis and low survival rate [
25]. These pigmented tumors are highly invasive and metastatic, generally appearing in cutaneous zones but also other tissues, i.e., intestine, oral cavity, or eye among others [
26]. According to WHO, there are roughly 132,000 new cases of melanoma each year worldwide, of which 66,000 are fatal [
27]. In addition to other well-demonstrated functions including the reduction of cell proliferation [
28] or induction of cell differentiation [
29], melatonin is involved in the modulation of melanin synthesis pathway. An increase in melanin pigment levels after melatonin treatment in vitro has been described [
30]. In addition, due to the high incidence and severity, it is necessary to search for new molecular routes and drugs that will reduce or halt the development and progression of melanoma. Melatonin, as already described above, has different antitumor properties and specifically in melanoma cells, several groups have previously shown that treatment with melatonin triggers a suppressive effect of cell growth mediated by an increase in apoptosis levels in melanoma cell lines SBCE2, WM-98, WM-169, or SKMEL-188 [
9], mainly throughout the interaction with specific membrane receptors. Other laboratories have described that melatonin can induce apoptosis in the murine B16-F10 melanoma model but when combined with other death-inducing agents such as endoplasmic reticulum, stress-inducing drugs [
28].
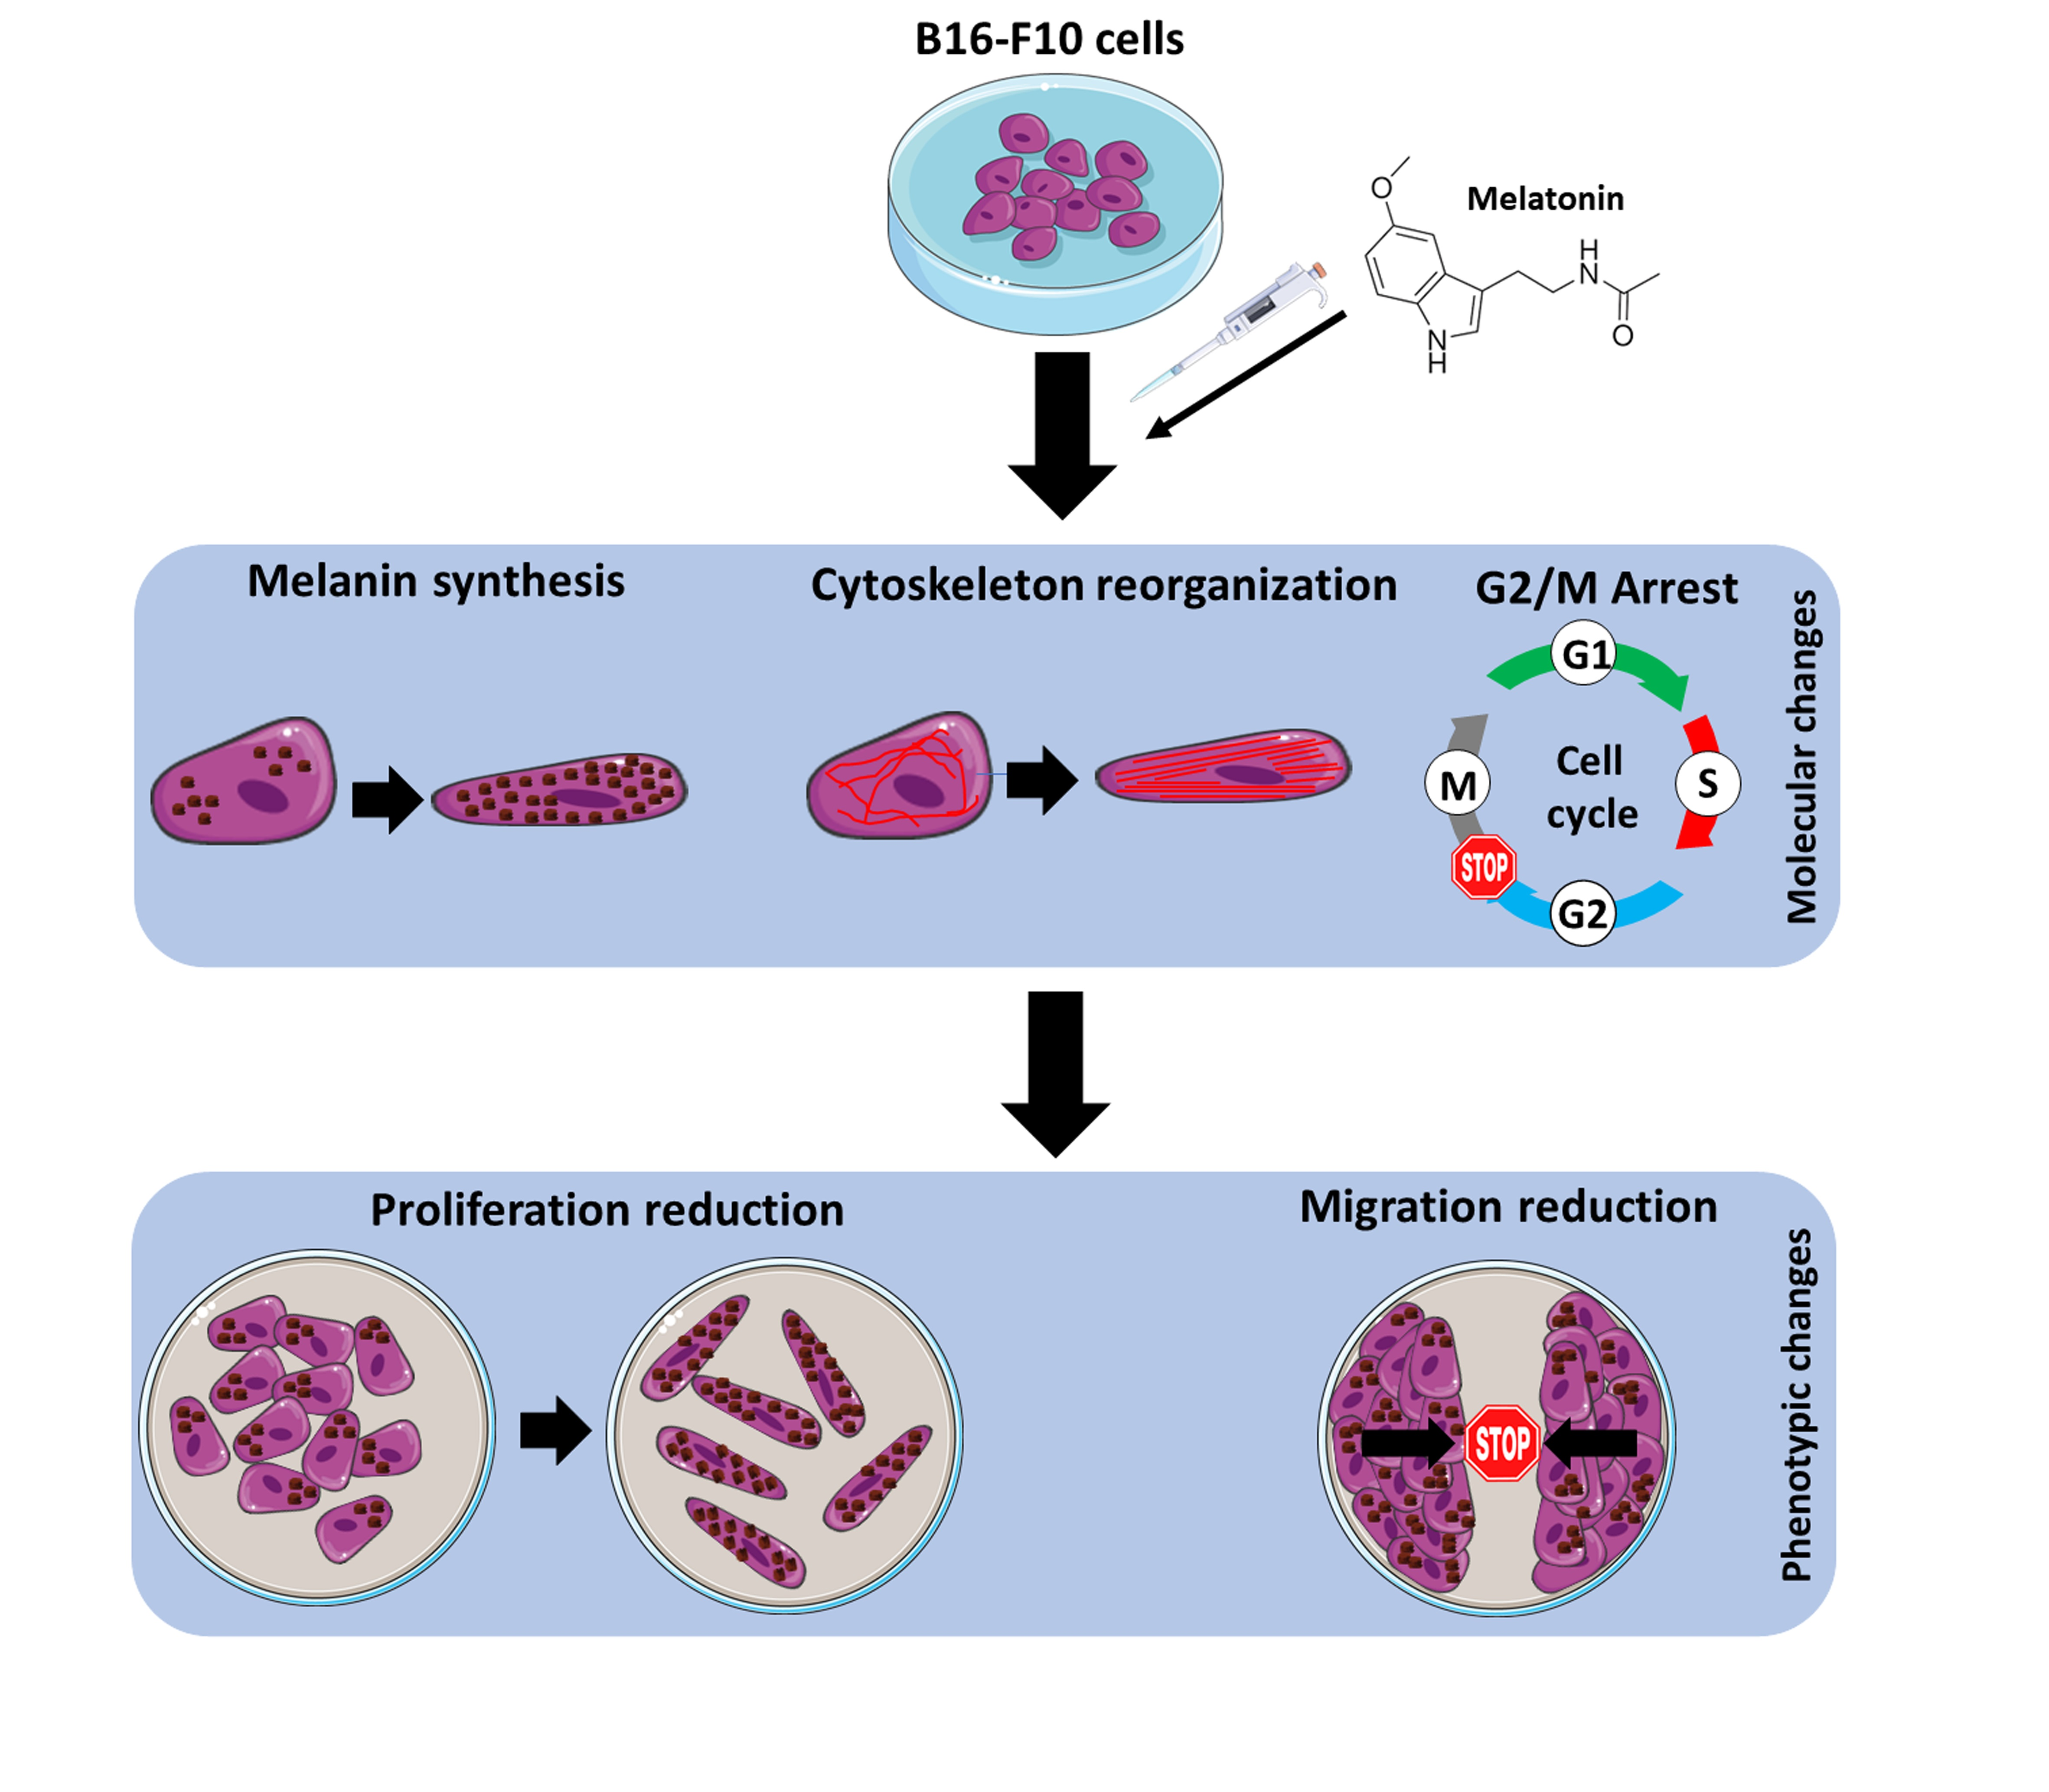
Since melanoma is considered one of the tumors with worse prognosis in Western countries and given the important antitumor and antioxidant activities of melatonin which make it an interesting molecule for the study of cancer therapies, the main objective of this work is to validate the antitumor role of the neuroindole pineal melatonin both in vitro and in vivo in the murine melanoma cell model B16-F10.
3. Discussion
As described earlier, the pineal neuroindole melatonin has important antitumor actions, among which the antiproliferative effect stands out [
31]. Previous studies have shown that concentrations ranging from high micromolar to 1 mM of this indole reduce cell proliferation and increase levels of cell death in this cell type [
24]. However, it has not only been described in this cell type but also been found to perform the same effect on other tumor types of melanoma, as well as in breast cancer and prostate cancer among others [
21,
32].
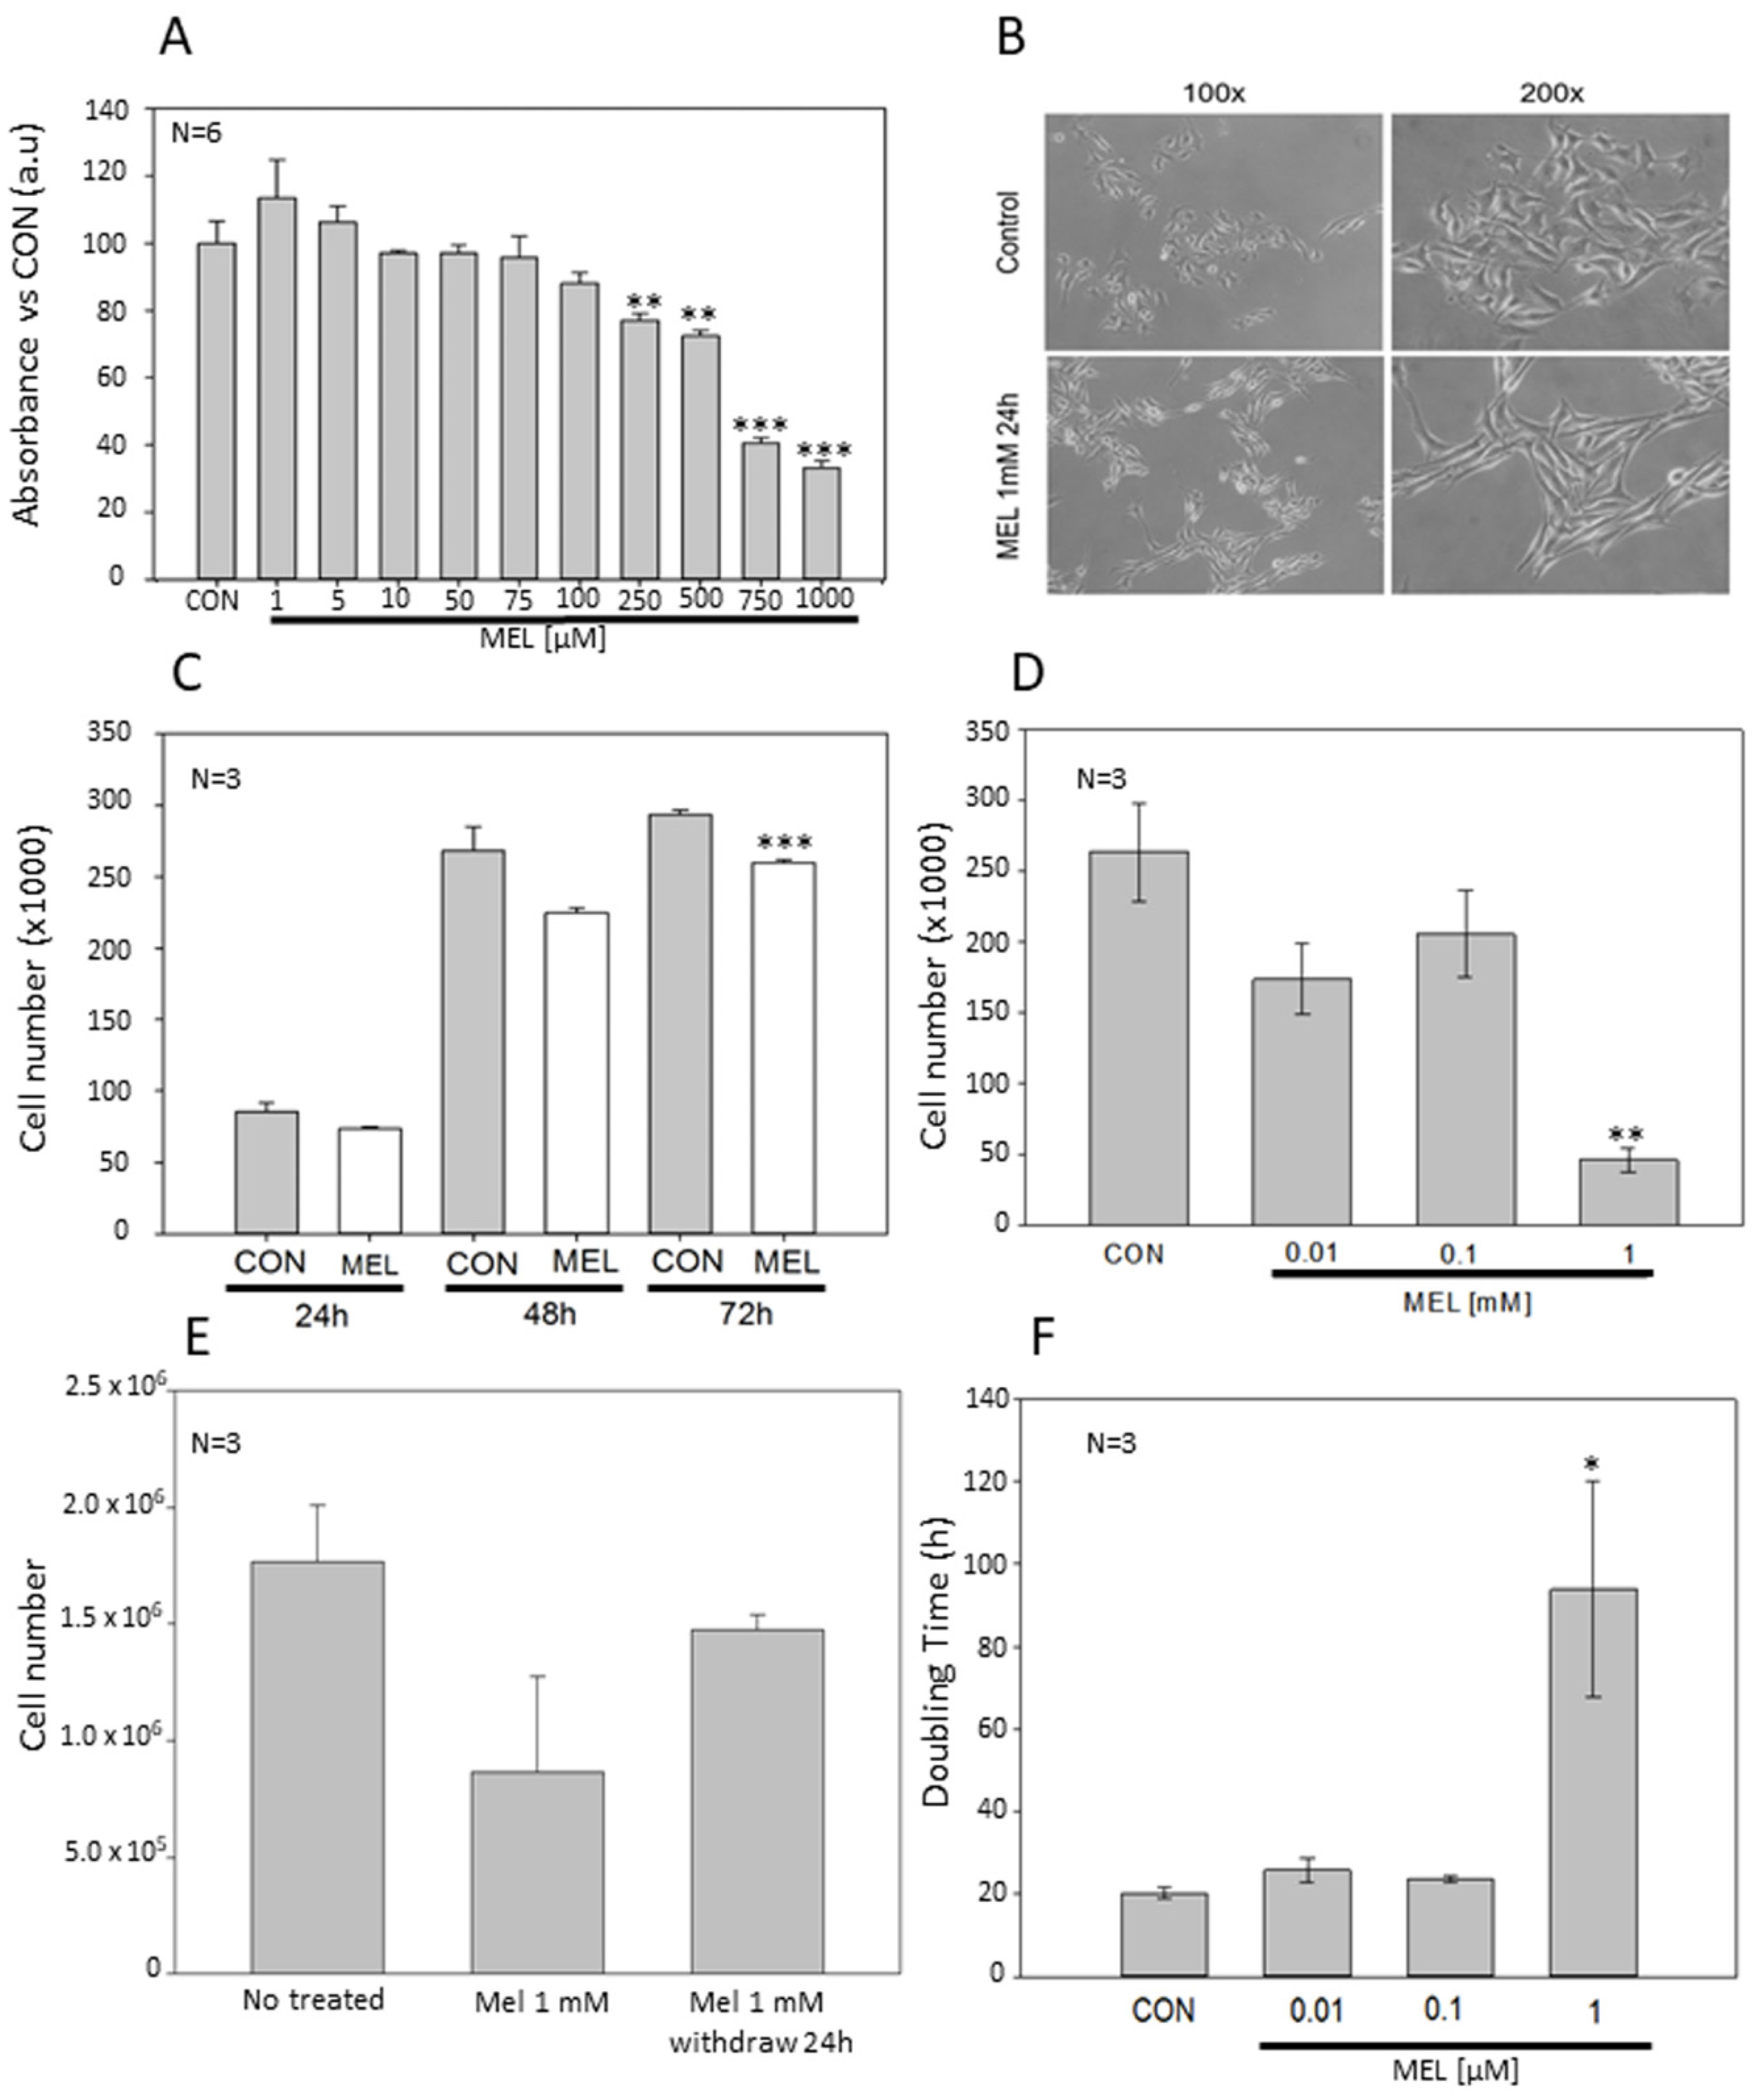
Results show that increasing concentrations of melatonin in the high micromolar range have a direct impact on cell proliferation, following a dose-dependent decreasing trend. In addition, the presence of indole is necessary for its effects to be maintained, since once removed, cell proliferation immediately recovers to a normal growth rate. Contrary to other studies using different cell lines, no signs of cytotoxicity and cell death were observed. Kim and co-workers have reported that melatonin compromises cell survival using the same cell model, i.e., B16-F10 cells. However, in this study, they combined the indole with the induction of endoplasmic reticulum stress, and they observed that melatonin enhanced p-PERK. Furthermore, cell death is significantly increased when the indole is combined, in a dose-dependent manner [
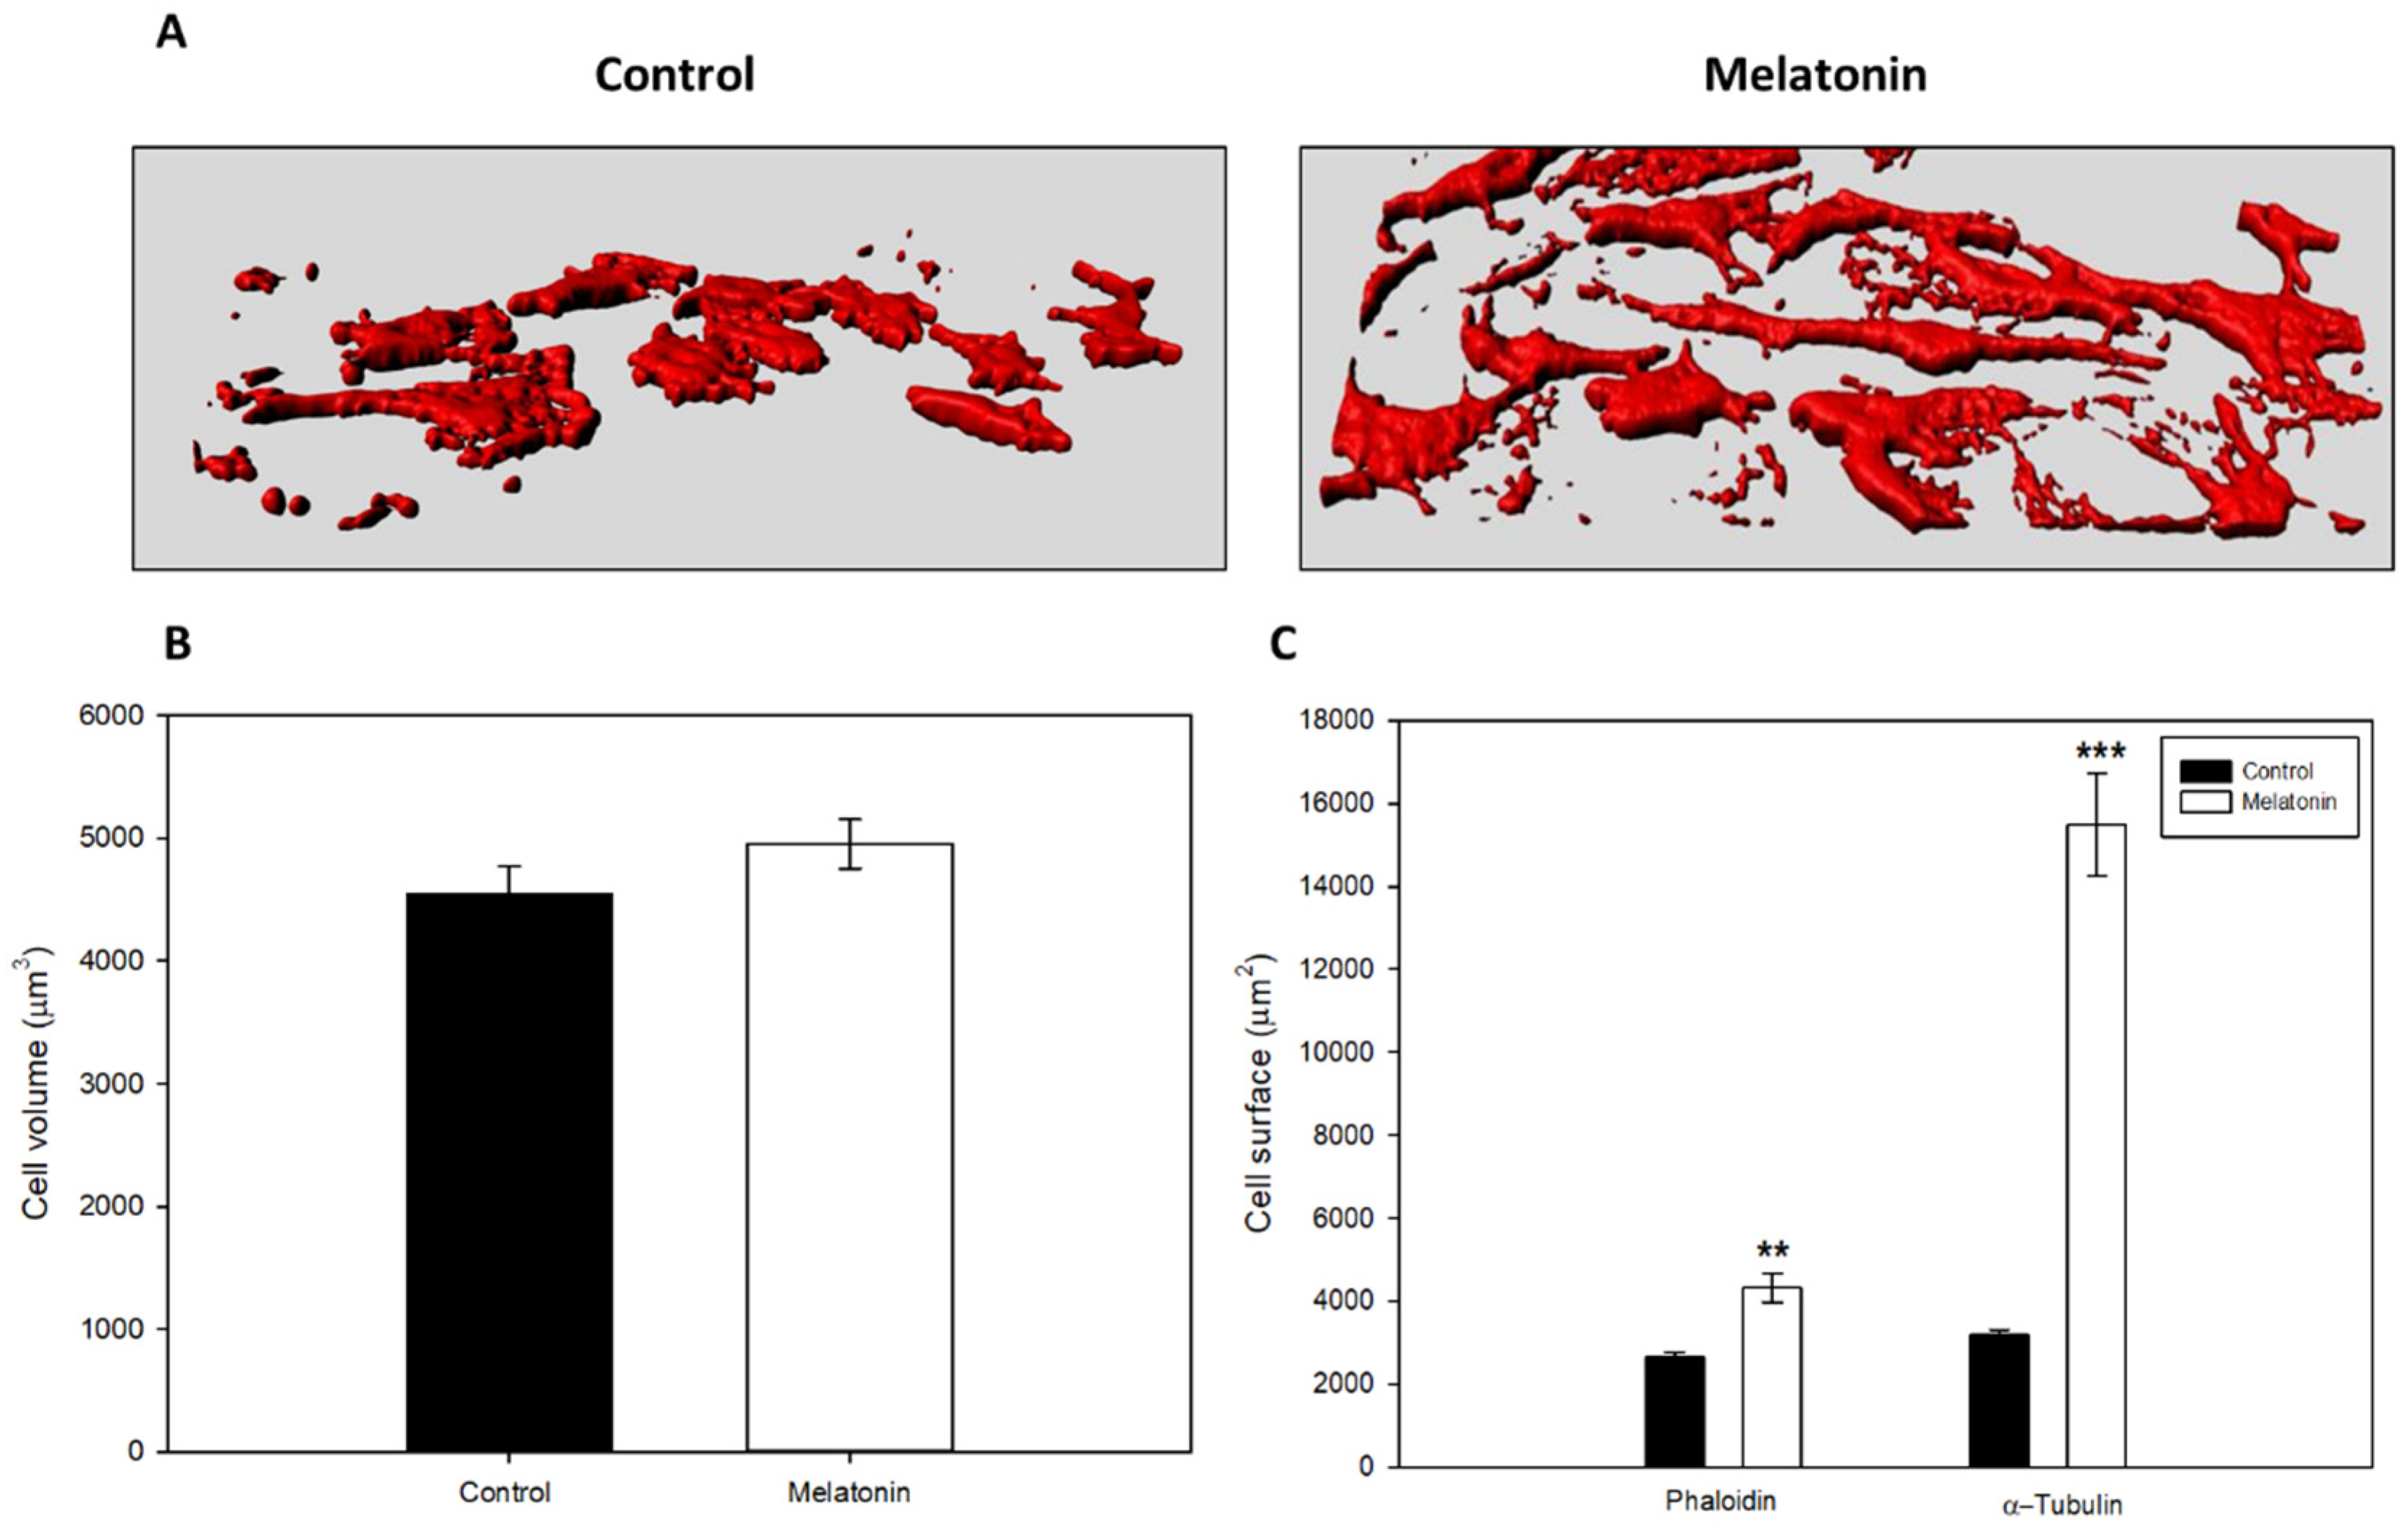
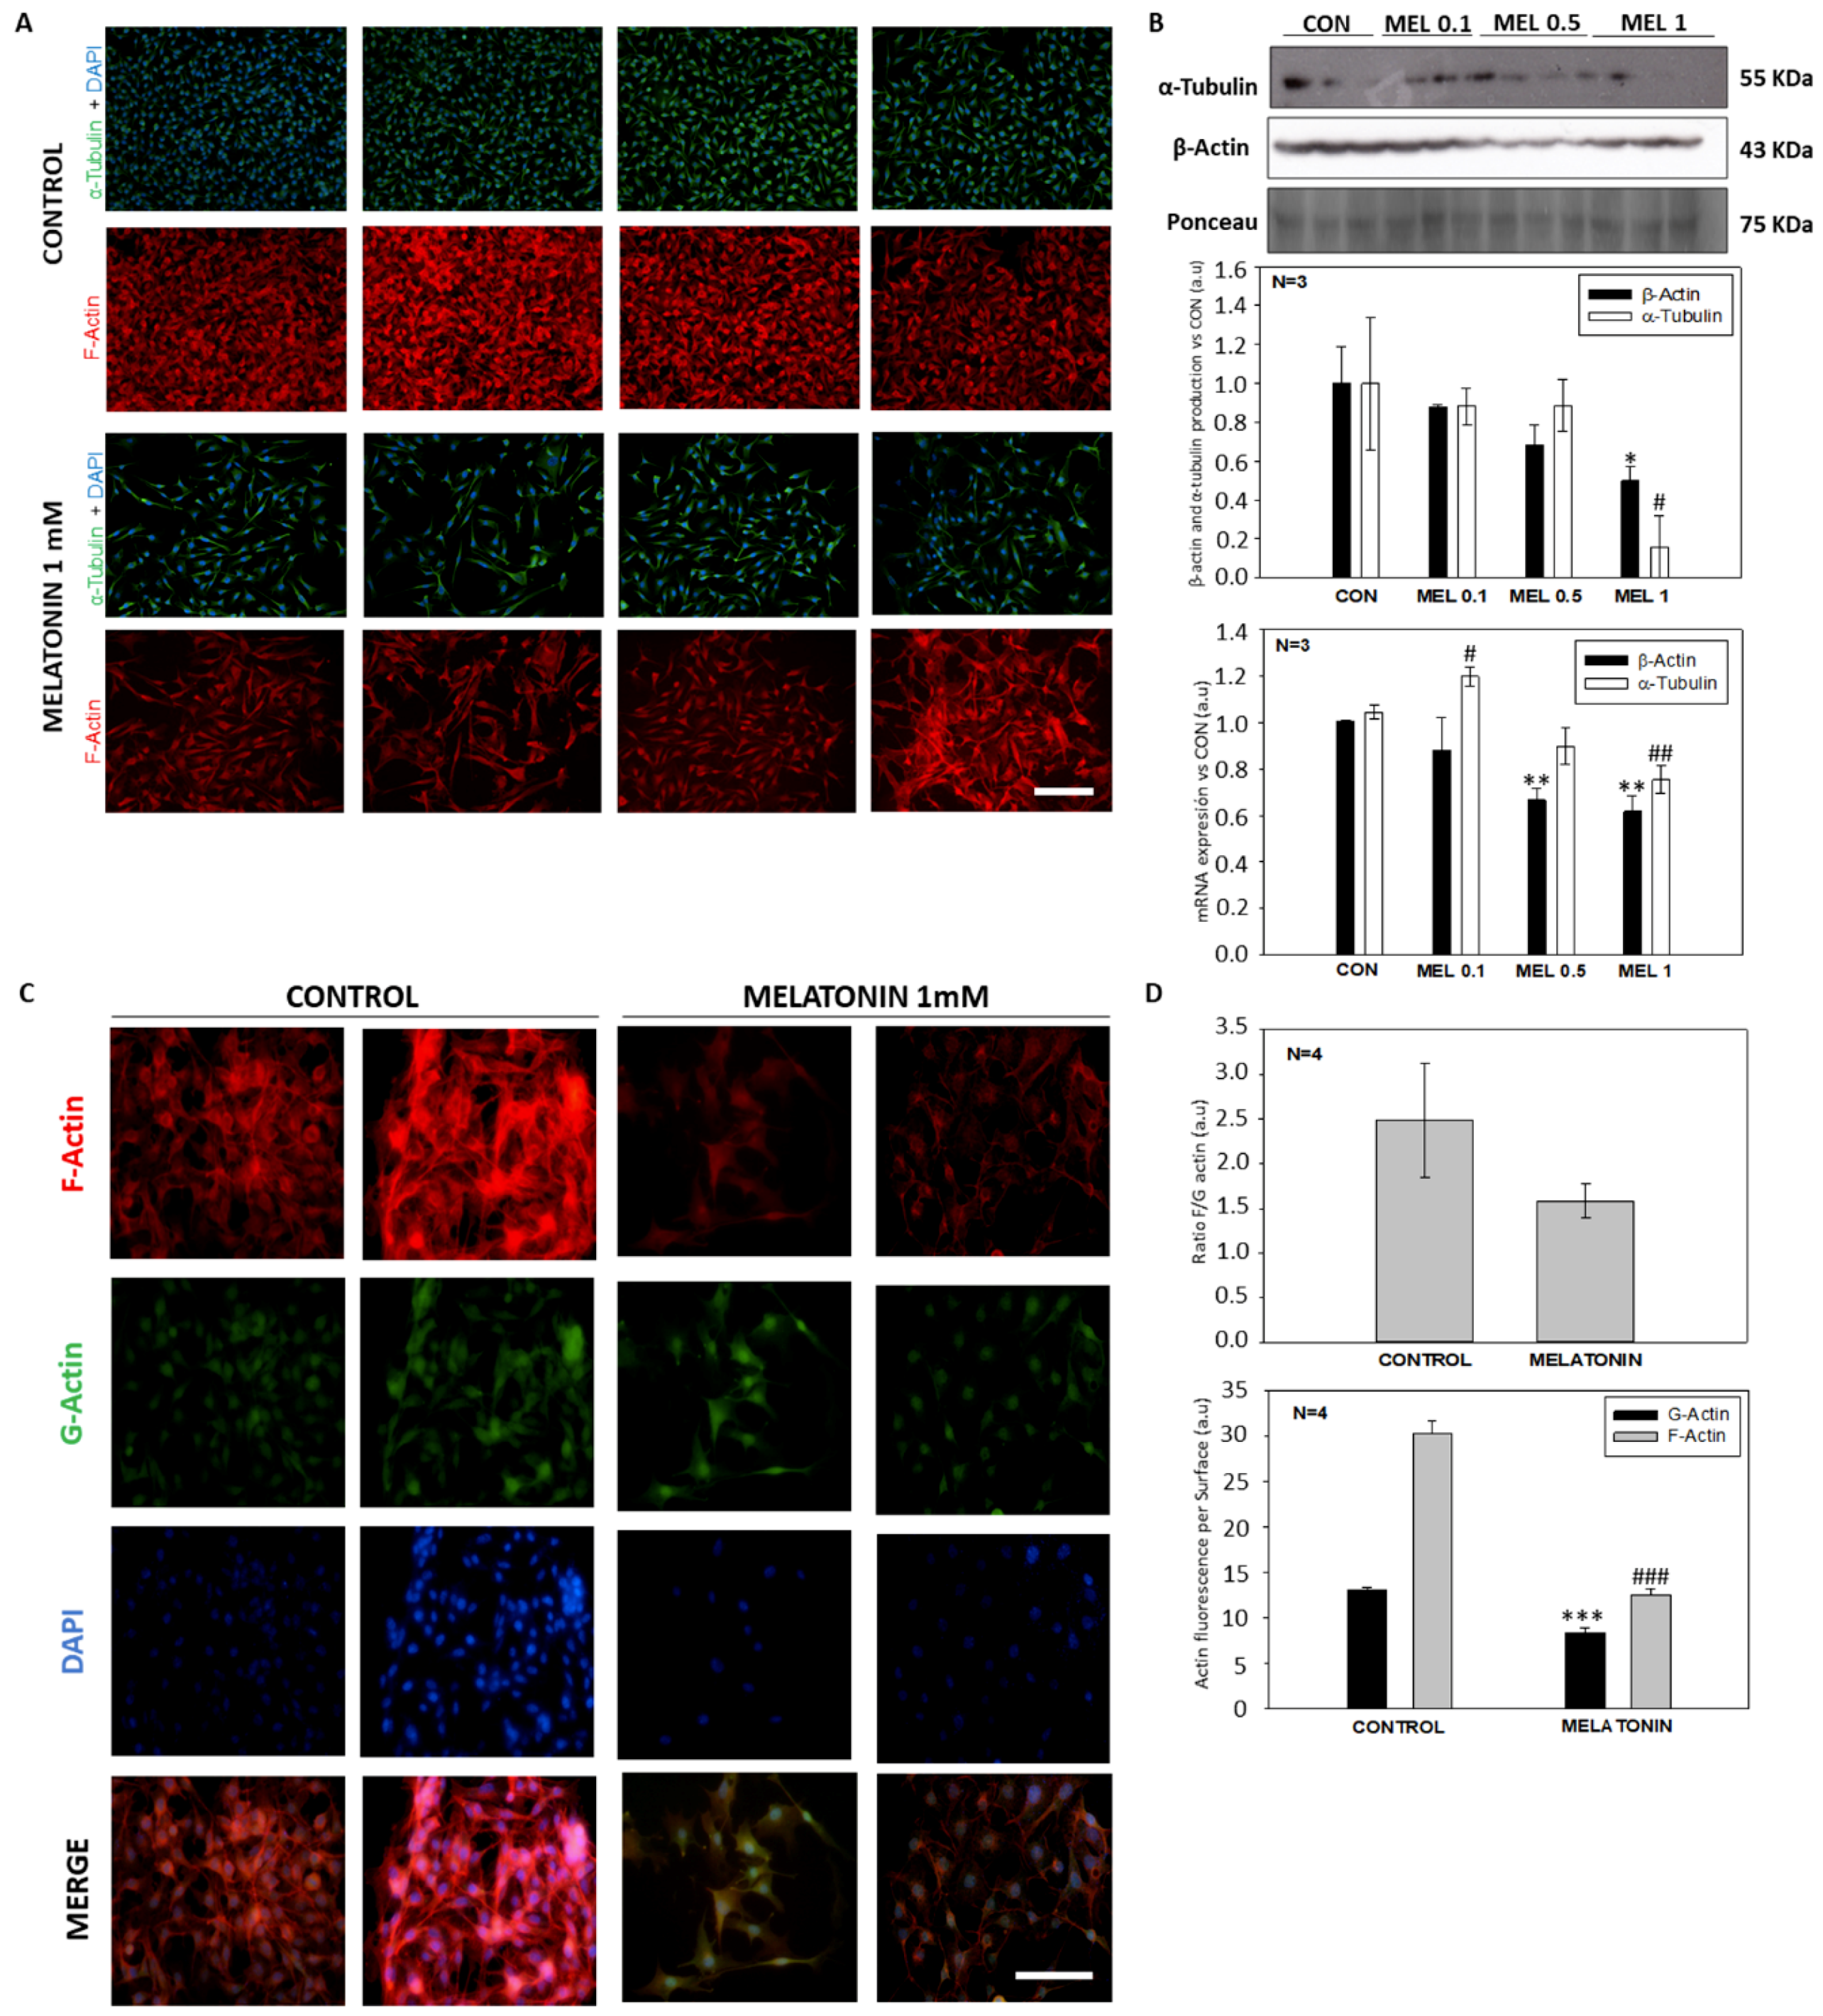
28]. Microscopically, we did not detect any morphological signs of damage as compared to the control group. However, morphologically, a larger, in relation to this section we observed that, although they did not show differences in cell volume, they occupied a greater surface area in the culture plate, thus as they were elongated, acquiring a morphology like fibroblasts. This is due to a reorganization of the cell cytoskeleton mediated by the action of melatonin, which also has different effects on the physiology of the cell altering other processes such as mitosis [
33]. Furthermore, melatonin induces apoptosis in DLD1 ovarian colon cancer and A2780 ovarian cancer cells line after 24 h of treatments [
34]. In human SK-LU-1 lung cancer cells, an increase in melatonin concentration was correlated with the increase in the concentration of apoptotic bodies [
35].
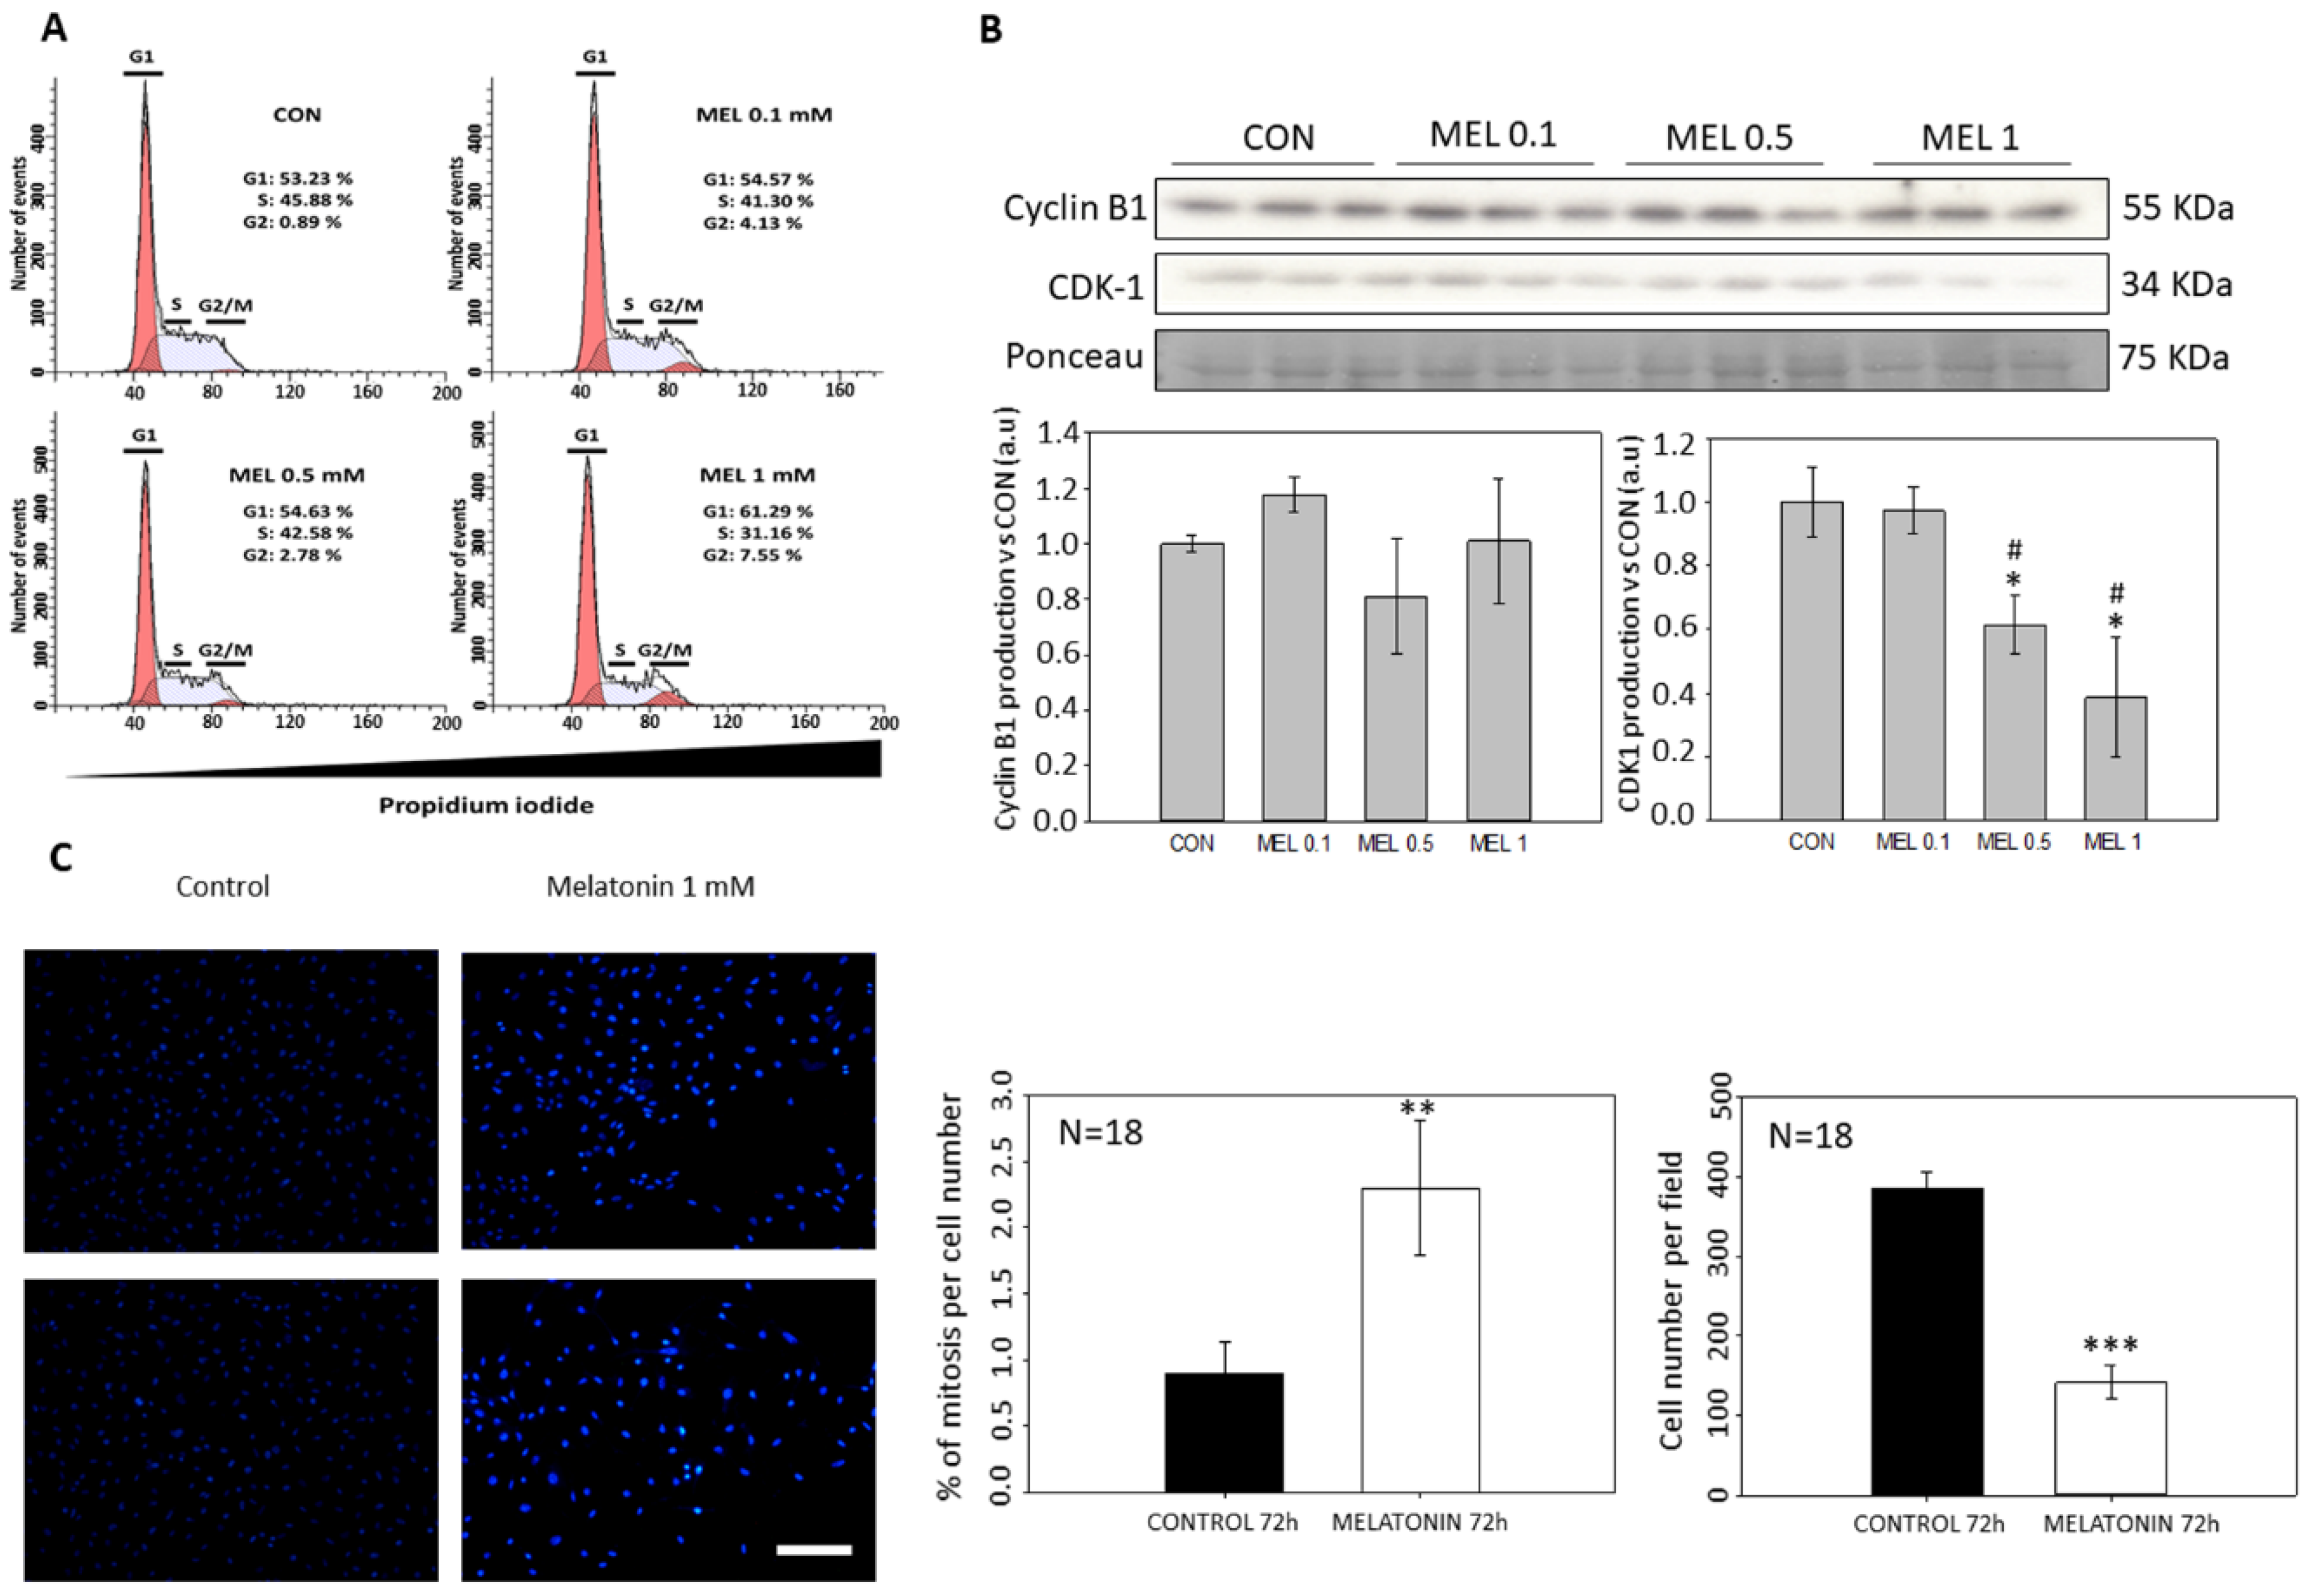
By not observing signs of cytotoxicity in the cells, we studied whether melatonin exerted that antiproliferative effect in vitro due to an arrest at some stage of the cell cycle, since as we have mentioned previously other groups have demonstrated the effect of melatonin as an antiproliferative molecule when blocks the cells in the G0 and G1 phases of the cell cycle [
36,
37]. When analyzing the cell cycle in B16-F10 cells, we observed that the groups treated with melatonin had a greater number of events in G1, as previously published by other groups, as well as in G2/M. When studying proteins involved in the passage of the G2 phase cells to mitosis, we observed how there were alterations in CDK-1 levels, which occurred in smaller amounts in those groups treated with melatonin, which would prevent cells from entering mitosis at the same rate as the control which explains the reduction in cell number increment under melatonin treatment. In addition to this, we observed a greater number of mitoses in the groups treated with melatonin. This phenomenon could be related to the stop in the cell cycle, since the melatonin retaining the cells in G2/M for a longer period would cause this increase in the number of mitosis. On the other hand, and in relation to this phenomenon, we study the state of the cellular cytoskeleton, since as previously described by other groups, melatonin acts as a modulator of cytoskeleton proteins, altering the actin microfilaments to a greater extent, although It also acts at the level of microtubules, which are highly related to the mitotic processes of anaphase, telophase and cytokinesis [
38,
39]. When the levels of these proteins are altered, mitosis can suffer abnormalities that lead to the increment of the growth delay, as in our case.
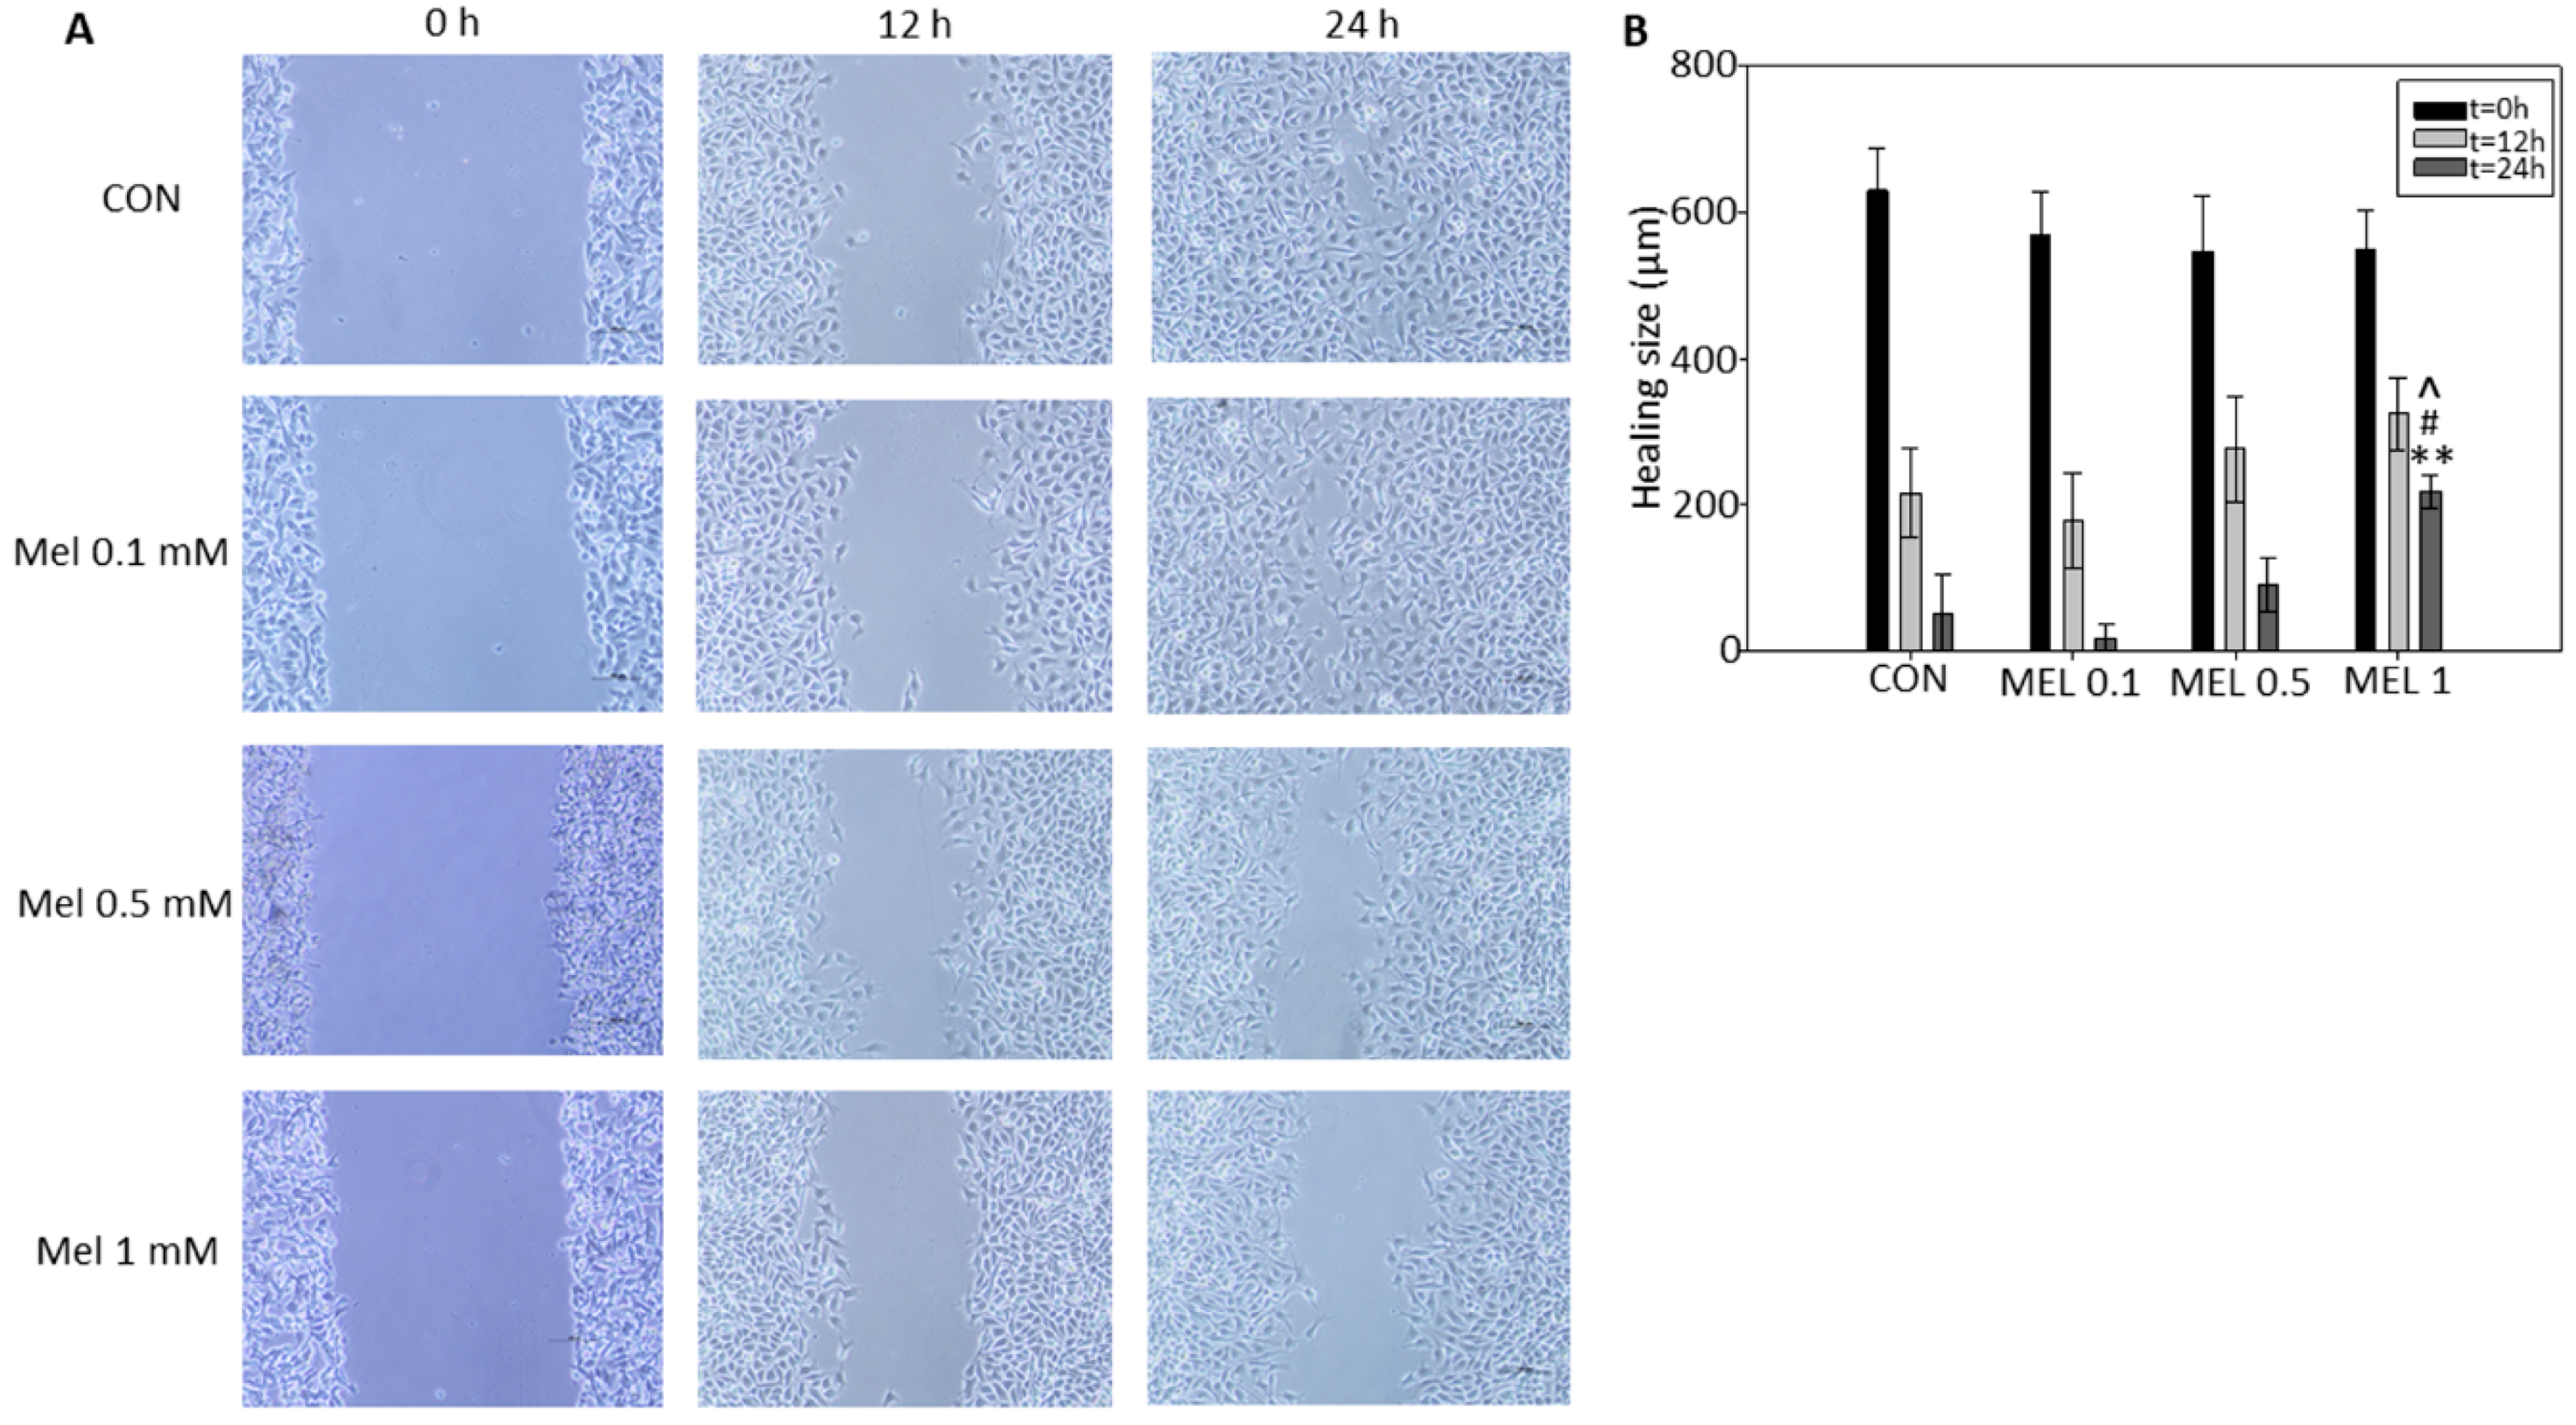
In order to end cell proliferation studies in this model, we finally studied the effect that melatonin has on cell migration phenomena, since it is described both in vitro and in vivo in other models that this indole is a potent antiproliferative, inhibiting the growth and migration of tumor cells. It has been previously described by other research groups that melatonin reduces the migration rate by wound healing test, either by administering it individually or as an adjuvant with other treatments, in different tumor models such as squamous carcinomas of esophagus, gliomas, or melanoma itself, thus coinciding with our results, where we see how melatonin reduces the speed of wound closure in treated cells with respect to control cells [
40,
41].
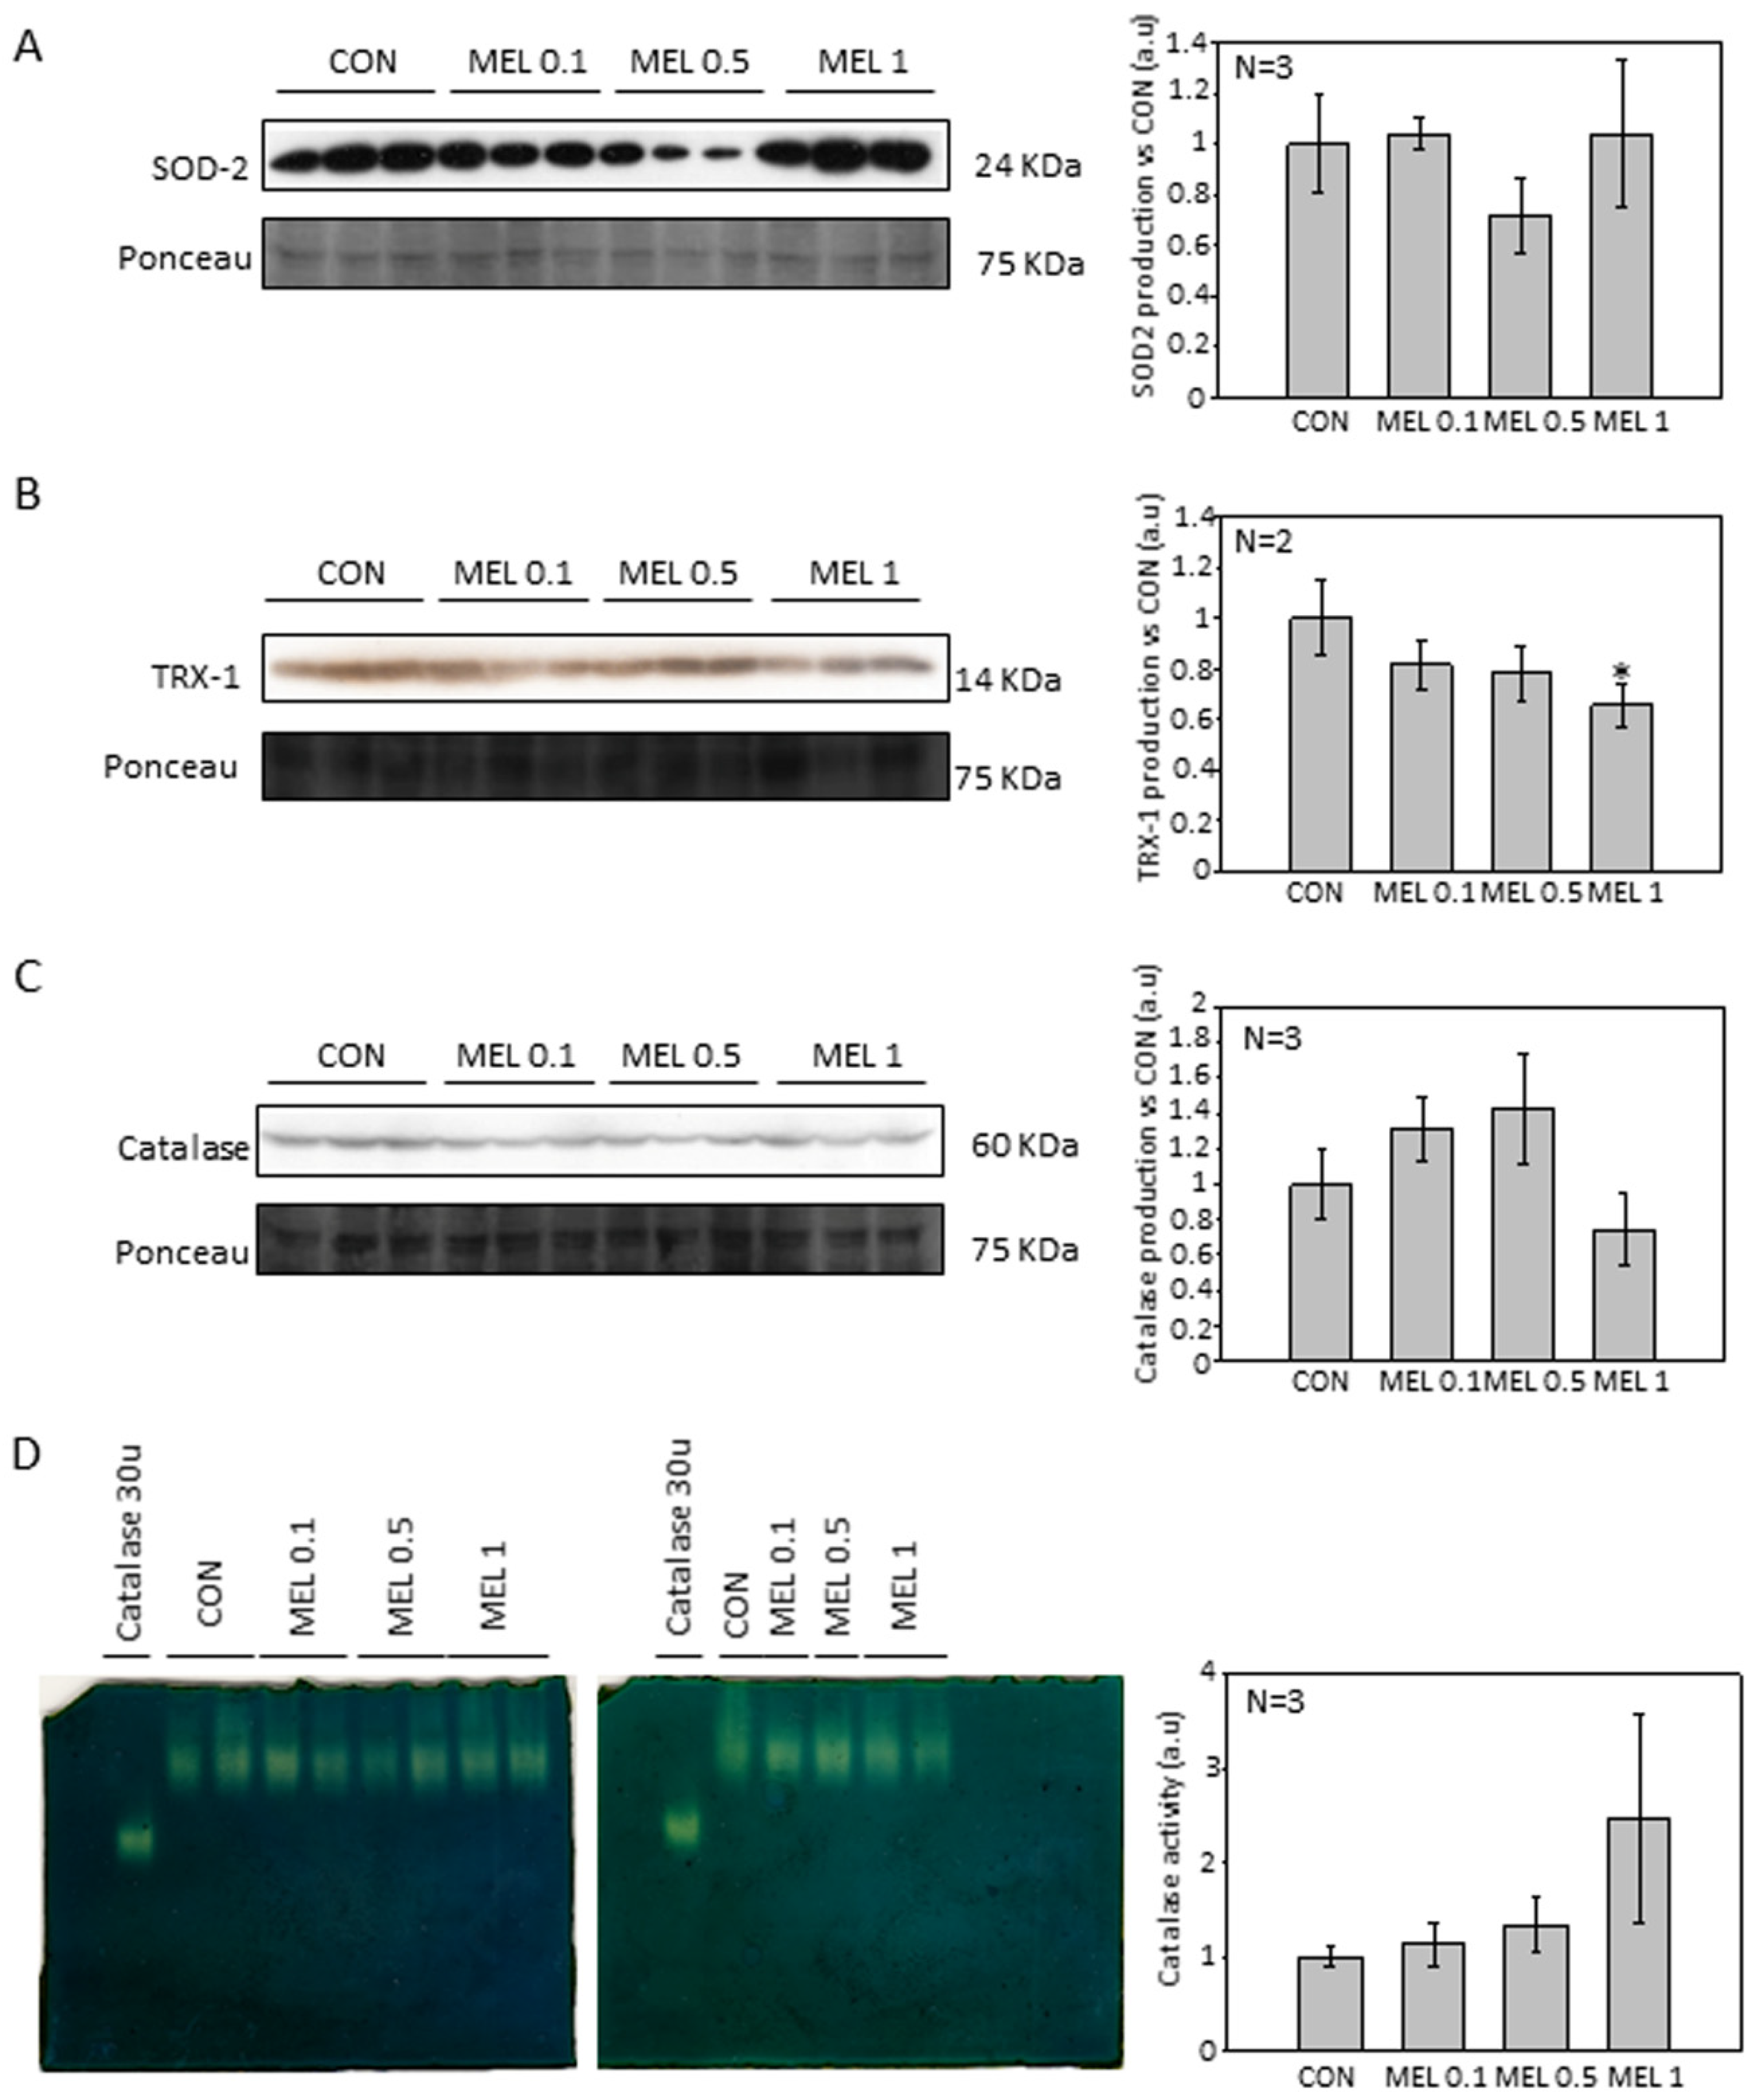
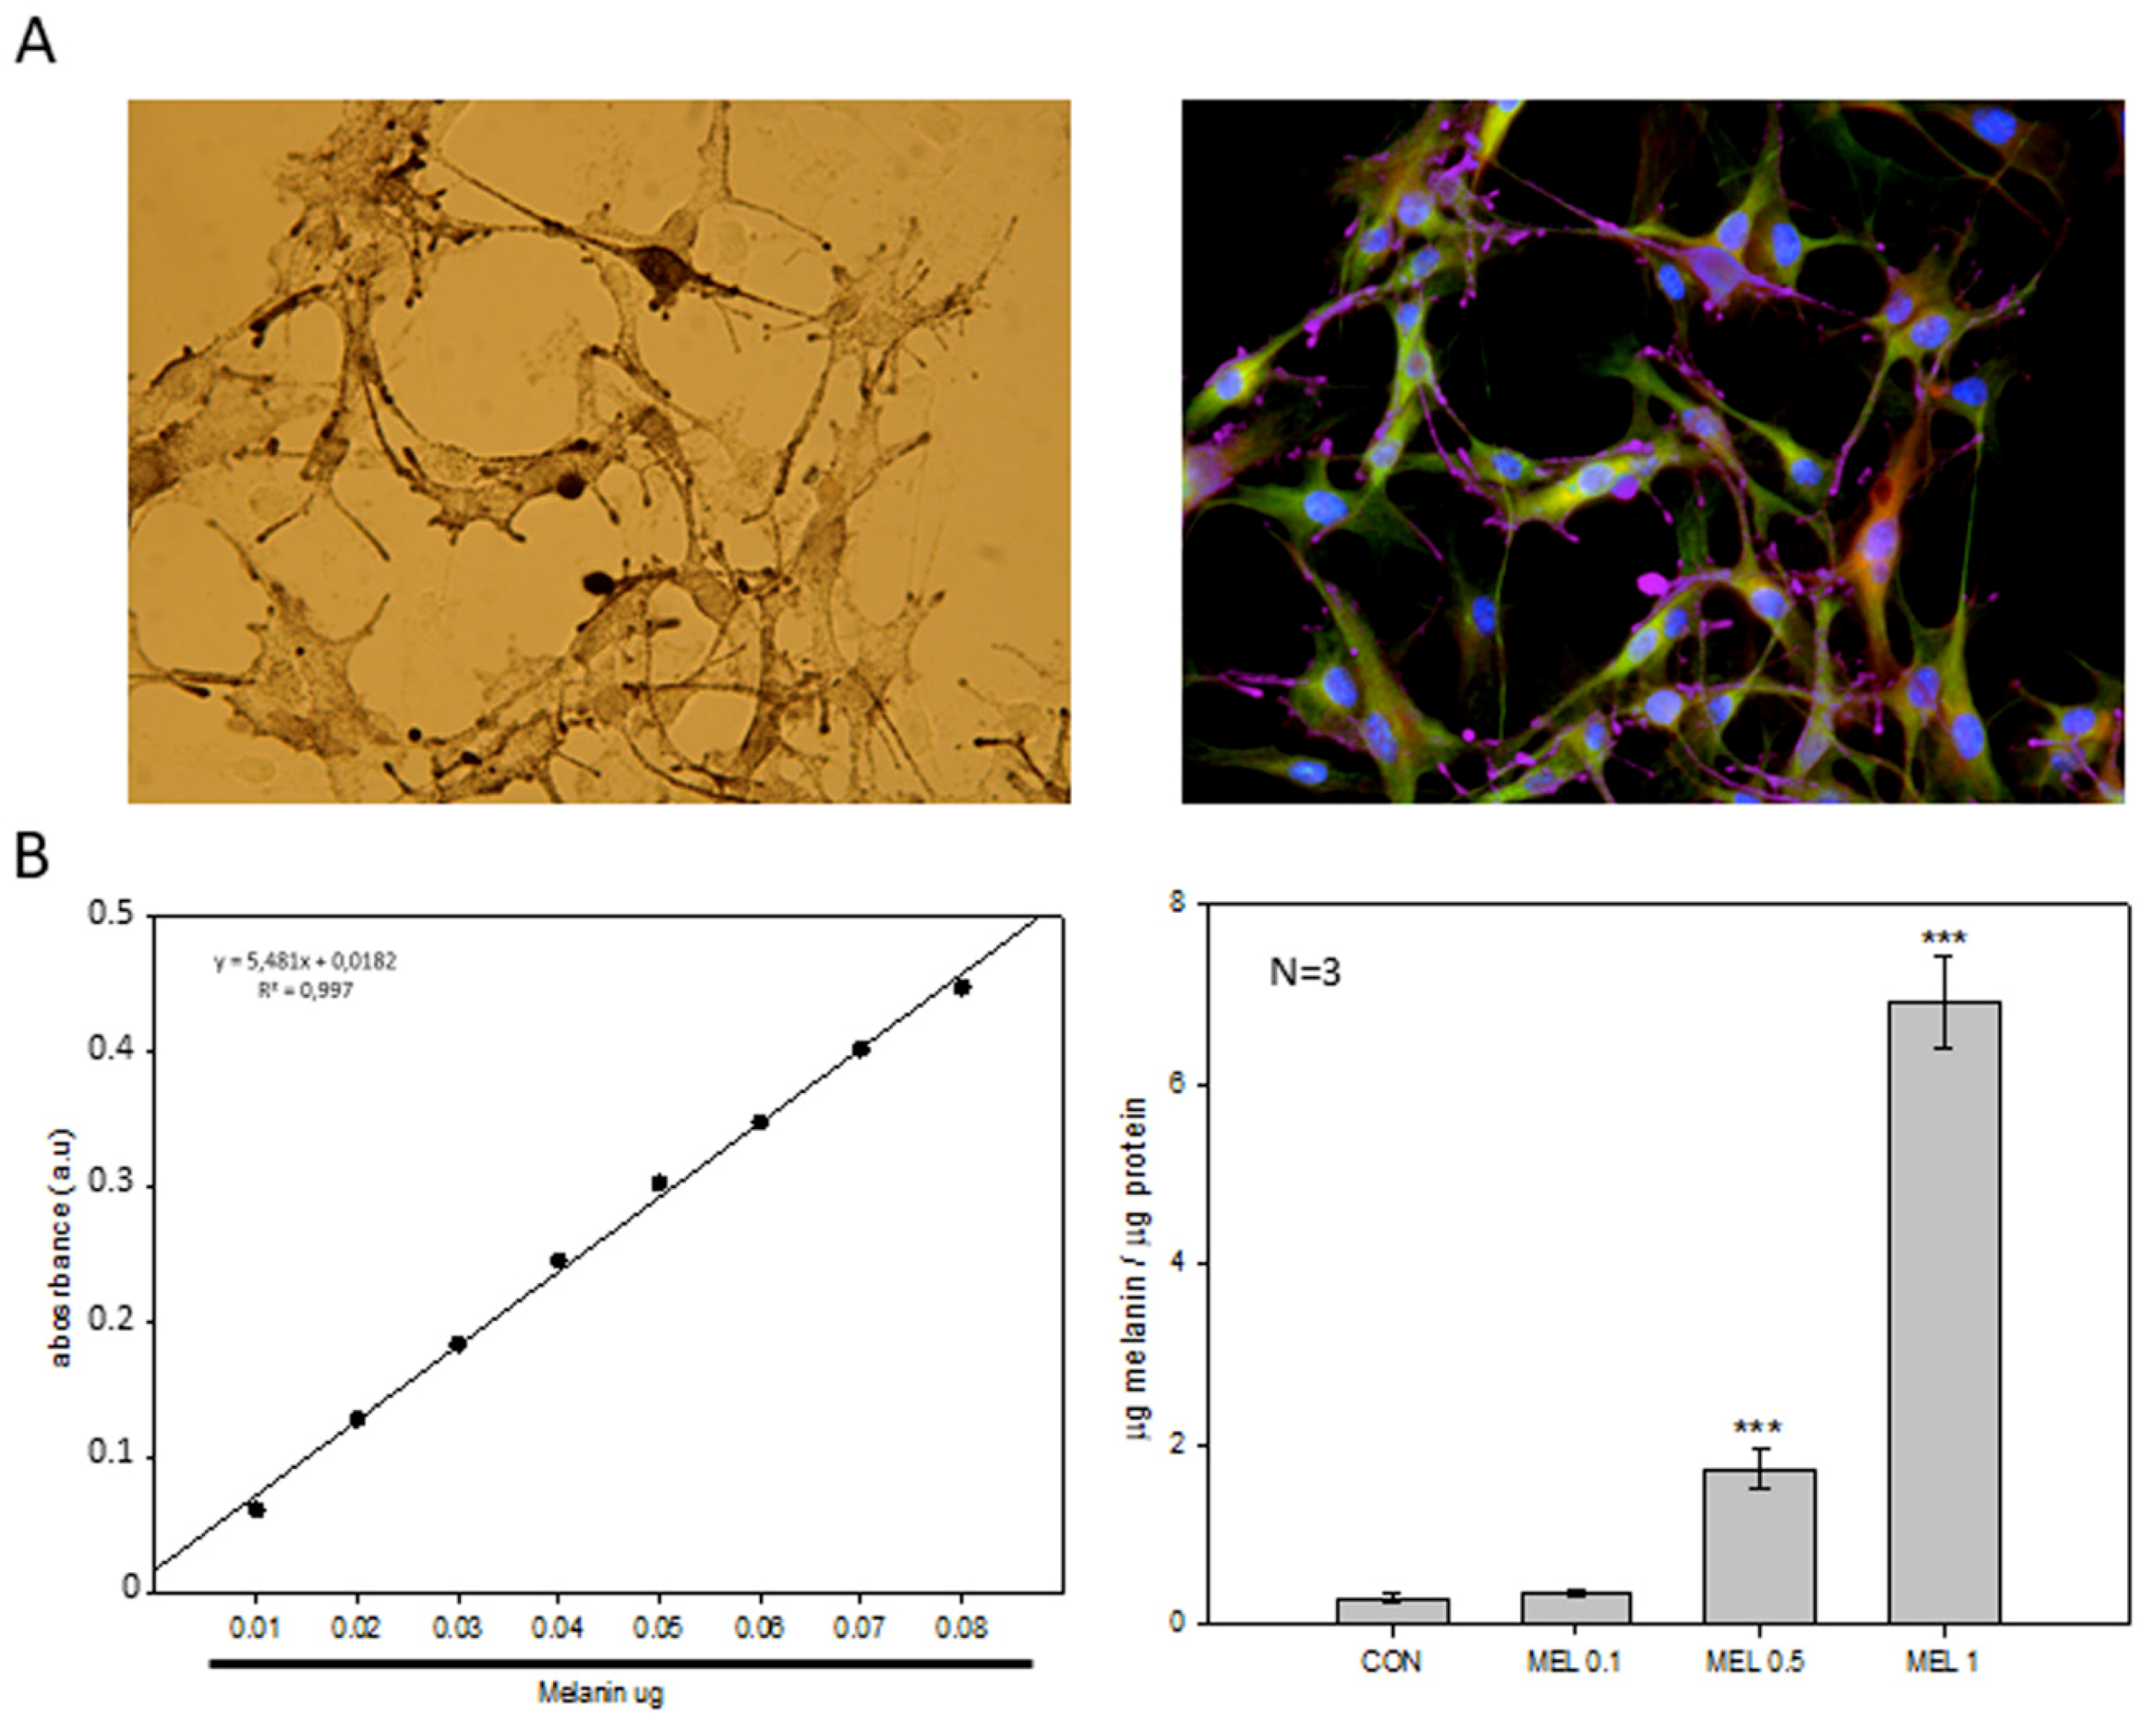
An important feature of melanocytes is their ability to synthesize the melanin intracellular pigment. Melatonin is a molecule capable of causing the aggregation of melanosomes in those cells that present these organelles, and since the B16-F10 cell model is capable of synthesizing this pigment we decided to study the phenomenon, observing how the administration of melatonin to cells caused an increase in the synthesis of the melanin pigment, which was mainly distributed in the cell periphery, near the plasma membrane. As described above, melanin has the main function of protecting the skin from ultraviolet radiation, which can trigger mutagenic phenomena in the DNA which can trigger the appearance of tumorigenic processes [
42]. Since during the synthesis of melanin oxidation reactions are triggered reduction where superoxide anion free radicals (O
2−.) And hydrogen peroxide (H
2O
2) occur, mainly by the key enzyme of the synthesis pathway, tyrosinase, which It transforms the amino acid tyrosine to 3,4-Dihydroxyphenylalanine and later to dopaquinone, and due to the pro-tumorigenic effect that these free radicals present in tumors, we decided to analyze how levels of both production and activity of different antioxidant proteins varied [
42,
43]. In addition, different research groups have studied the levels of antioxidant proteins, mainly involved in the production and purification of O
2−. in this cellular model, observing how melatonin treatment reduced the levels of both SOD2 and catalase [
28]. When analyzing our results, we observed that the levels of the different antioxidant proteins studied were not altered, with the exception of thioredoxin 1 (TRX-1), which significantly decreased their production when cells were treated with melatonin, in relation to catalase, we observed also a decrease in production, but its levels do not reach statistical significance. Therefore, our results agree to some extent with those already published. However, we do not observe large differences in our model.
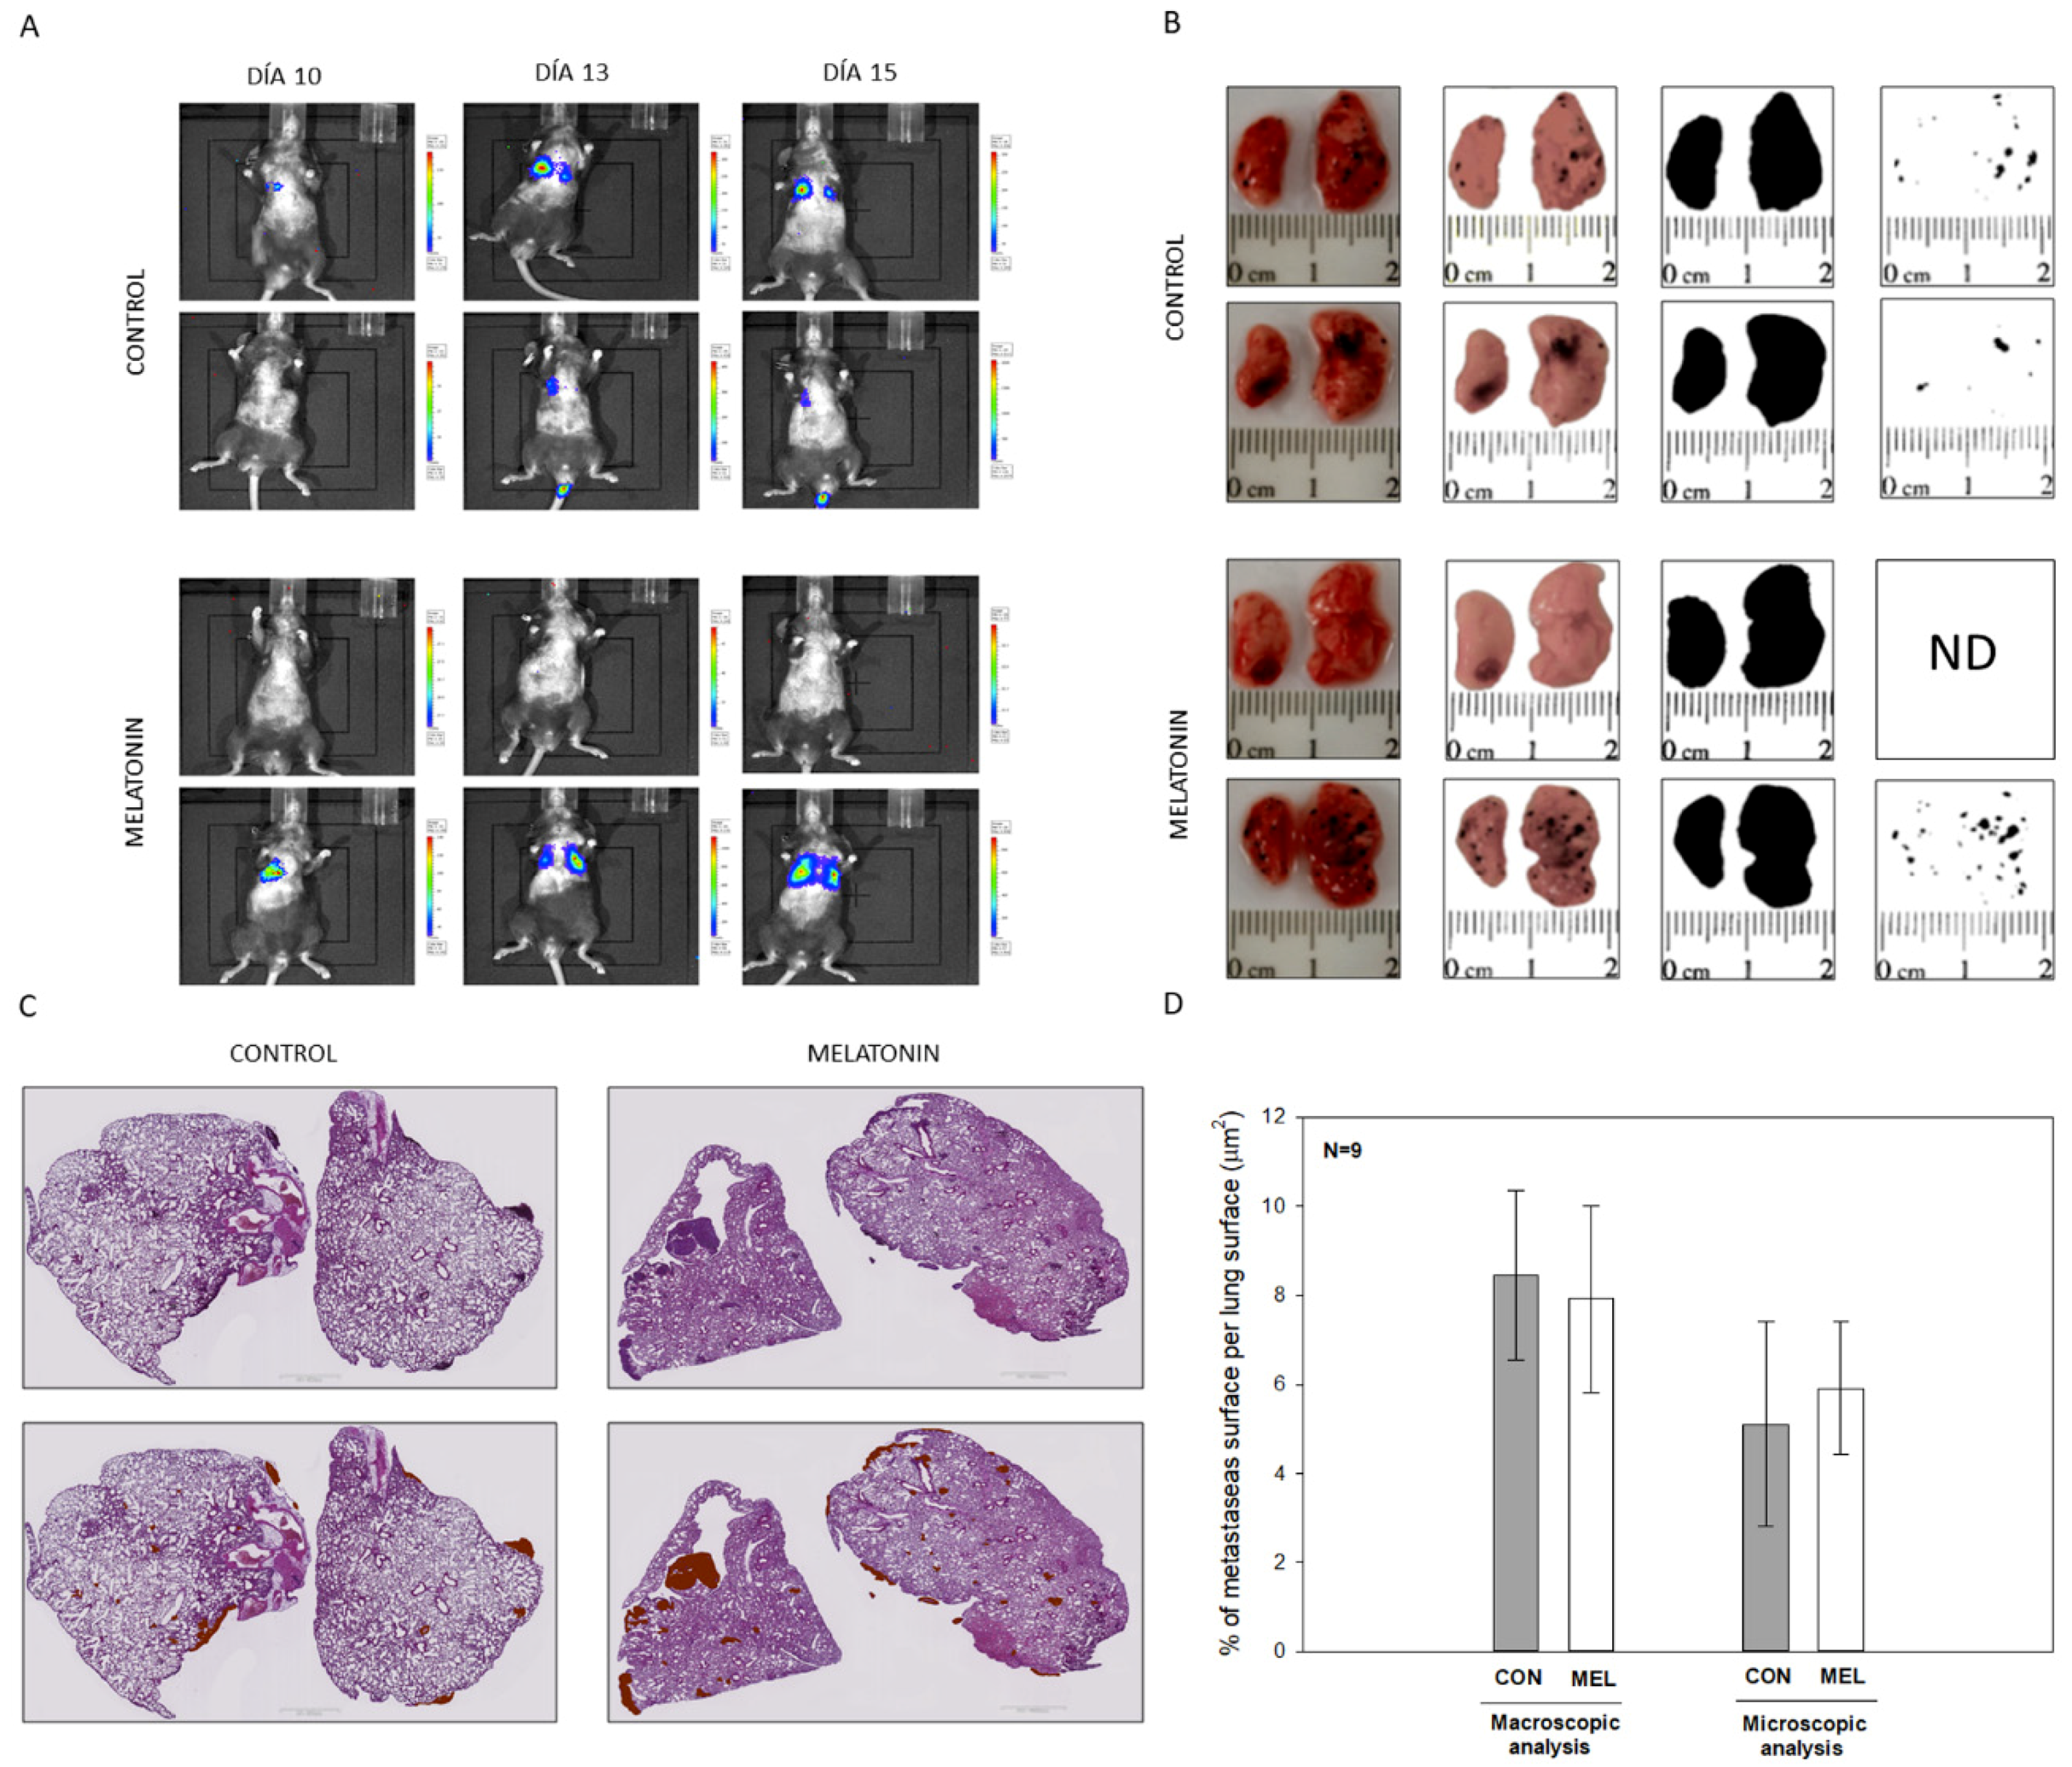
Altogether this result allows us to conclude that melatonin caused a reduction in cell proliferation in the melanoma cell model B16-F10. Then we expand our study towards an in vivo model of lung metastases in order to check if, at the systemic level, melatonin caused a decrease in the ability to migrate and metastasize in B16-F10 cells, which has not been previously described. To do this, we carried out two approaches as we have already described, administrating melatonin IP and using drinking water. In addition, the beneficial effects of the administration of melatonin in experimental mice in relation to other tumor models such as prostate cancer have been previously described by our group and others [
43,
44]. When analyzing our results, we did not observe differences in the number of metastases or at the macroscopic or microscopic level, which makes us think that due to the aggressiveness of these cells during the metastatic process, which already affects both lungs after 15 days of injection of the cells in the tail of the mouse, melatonin is not able to alter the rate of proliferation and migration of the cells. In contrast to in vitro model, where melatonin was directly applied within the culture medium, its availability in the lungs of our in vivo model might be compromised.
4. Materials and Methods
4.1. Cell Culture
Murine melanoma tumor cell line B16-F10 (ATCC
®, CRL-6475™, Manassas, VA, USA,) was employed for the studies. This cell line was originated from the parental line B16 and it is characterized by its ability to form colonies (nodules) in the lung after intravenous injection in in vivo models [
29]. Unless otherwise indicated, all reagents were purchased from Sigma (Sigma-Aldrich Inc., St Louis, MO, USA). Cells were cultured in Dulbecco’s Modified Eagle’s Medium (DMEM) (Sigma) supplemented with 10% fetal bovine serum (FBS) (Sigma), 10mM HEPES, 2mM L-glutamine (Lonza, Basel, Switzerland) and 1% antibiotics and antifungals (amphotericin B, penicillin and streptomycin) (Gibco, Grand Island, NY, USA). Cells were kept under controlled conditions in a CO
2 incubator (New Brunswick ™ Galaxy
®170s, Eppendorf, Germany) at 37 °C and 5% CO
2 atmosphere. Before carrying out each experiment, at least 24 h were expected from the time of seeding to favor the adhesion of the culture to the substrate.
4.2. MTT Cell Viability Assay
Cells were seeded in a 96-well plate at a density of 1500 cells/well in 100 μL of complete culture medium and left attach overnight. After 24 h, melatonin (ranging from 1 μM to 1 mM) was added (Merck, Kenilworth, NJ, USA). The indole was dissolved at 1M stock solution in dimethyl sulfoxide (DMSO) (Sigma) and the corresponding DMSO concentration was added to control cells. After 72 h of incubation, MTT reagent was added at a final concentration of 0.5 mg/mL and allowed to react for 4 h. Then, one volume of lysis buffer solution (20% SDS in 50% dimethylformamide, pH = 4.7) was added and incubated in the dark at 37 °C overnight. The absorbance was measured at a spectrophotometer microplate reader Cary 50 MPR (Varian, Palo Alto, CA, USA) at a wavelength of 570 nm using absorbance at 690 nm as reference wavelength.
4.3. Proliferation and Doubling Time Assay
To estimate both, cell proliferation and the doubling time, i.e., time required to double their number, a duplication test was designed. Cells were seeded in 6-well plates at a density of 12,500 cells/mL. Three replicates of each experimental group were seeded in the presence of 10 μM, 100 μM or 1 mM melatonin. After 72 h, cells were collected by scraping with a rubber policeman and fixed in 500 μL of 70 % ethanol at 4 °C. Cells were then counted using a hemocytometer. The doubling time was calculated based on the following mathematical formula.
4.4. Quantification of Intracellular and Extracellular Melatonin in Cell Culture
To quantify the total content of melatonin present in the culture medium, and the intracellular content, a high-performance liquid chromatography (HPLC) assay was performed. To this aim, cells were seeded at the density of 2.5 × 10
4 cell/mL in 100 mm plates. After 24 h, melatonin was added at a concentration of 1mM. After 48 h, cells and their respective culture medium were collected, and an organic extraction was carried out based on a protocol previously described by our research group [
31]. As a reference, melatonin concentration was calculated using a melatonin calibration curved performed from 0.1 ppm to 10 ppm, as well as an internal standard to check the quality of the extraction.
4.5. Cell Cycle Analysis
For these experiments, cells were seeded in 100 mm diameter plates at a density of 4 × 10⁴ cells/mL and left to reach 75–80% confluence. Melatonin was added at concentrations of 100 μM, 500 μM, and 1 mM, and after 24 h cell cycle was analyzed. For this purpose, cells were harvested by trypsinization and centrifuged at 500× g for 5 min at 4 °C. After removing supernatant, cells were washed twice with ice-cold PBS, then fixed in 500 μL of 70% ethanol and stored at 4 °C until analysis. At the time of analysis, cells were centrifuged for 5 min at 700× g, and cell pellet was resuspended in 500 μL of a staining solution (propidium iodide 100 μg/mL, RNase 100 U/mL, 10 mL PBS with 1 g/L of glucose). Finally, it was incubated at RT for 30 min and the samples were analyzed on a Cytomics FC500 flow cytometer (Beckman Coulter, Indianapolis, IN, USA).
4.6. Wound Healing Assay
To this purpose, cells were seeded in 6-well plates and left to reach confluence. Then, scratches wounds were made by scraping the cell layer across each well using a 100 μL pipette tip. Then after washing with PBS to remove the detached cells, melatonin was added at 100 μM, 500 μM, and 1 mM in fresh complete culture medium. Micrographs of the scratched area were taken at the beginning (t = 0) and at 12 and 24 h, using the 40× magnification objective.
4.7. Extraction and Quantification of Intracellular Melanin
Cells were seeded at concentration of 2.5 × 10
4 cell/mL in 100 mm plates. When cells reached confluency, melatonin was added at the indicated concentrations. After 24 h, cells were collected by scraping in 1 mL of PBS and centrifuged for 5 min at 500×
g. Pellets were resuspended in 500 μL of 1 × PBS and sonicated in an ultrasonic bath. Afterward, samples were centrifuged at 12,000×
g for 20 min at 4 °C and the supernatant was collected in a clean tube for protein precipitation by 10% trichloroacetic acid, and then quantified by the Bradford method (Sigma) [
45].The pellet was dissolved in 1 mL of NaOH 1N and 10% DMSO and heated in a heater at 80 °C for 1 h. After the incubation the absorbance was quantified at 470 nm. The melanin concentration was calculated using a synthetic melanin standard (Sigma) at concentrations from 0.01 to 0.1 mg of melanin.
4.8. SDS-PAGE and Immunoblotting
Cells were seeded in 100 mm plates at 2.5 × 10⁴ cell/mL and left to reach 80% confluency. Then melatonin (ranging from 100 μM to 1 mM) was added. For protein extraction, cells were scraped with a rubber policeman in culture medium and subsequently centrifuged at 500× g for 5 min. After medium removal, RIPA lysis buffer (0.1% sodium dodecyl sulphate (SDS), Igepal C 1%, 0.5% Sodium Deoxycholate, with 150 mM sodium chloride (NaCl) in a 50 mM solution of Tris-HCl at pH 7.4) with freshly added protease inhibitors (2 μg/mL Apoprotein A, 10 μg/mL Leupeptin, 1 μg/mL pepstatin, 200 μM sodium orthovanadate, 1 mM sodium fluoride (NaF), 1 mM phenylmethylsulphonyl fluoride (PMSF) and 1 mM dithiothreitol (DTT) was added. Samples were incubated on ice for 30 min and subsequently centrifuged at 15,000× g for 15 min at 4 °C.
Proteins (50 µg) were resolved in 12% acrylamide/bisacrylamide (Bio-Rad, Hercules, CA, USA) gels with 15-lane combs and 1.5 mm spacer crystals in which 50 μg of protein from each sample was loaded with 4× loading buffer (250 mM Tris-HCl pH 6.8, 40% glycerol, 8% SDS, 0.2% bromophenol blue, 28 μL/mL β-mercaptoethanol). Electrophoresis and transfer were performed in a Miniprotean3 (Bio-Rad, Hercules, CA, USA). Once the electrophoresis was performed, proteins were transferred to PVDF immobilon-P membranes (Millipore, Burlington, MA, USA). Subsequently, membranes were stained with a solution containing 0.1% (w/v) Ponceau in 5% acetic acid (v/v) (Bioquochem, Siero, Asturias, Spain) and blocked for one hour in a 5% solution of non-fat milk powder (BD, Sparks, MD, USA) in TBS-T (Tris-HCl, 20 mM, 137 mM NaCl, and 0.05% Tween-20 pH 7.4). After blocking the membranes were incubated with the primary antibodies at 4 °C overnight using the concentrations indicated in the following table (
Table 1).
4.9. Catalase Activity Native Gel
Cells were seeded in 100 mm plates until they reached 75–80% confluence. Then, melatonin at 0.1 mM, 0.5 mM, or 1 mM was added. After 24 h, cells were harvested by trypsinization, centrifuged for 5 min at 500×
g, resuspended in PBS supplemented with 0.5% IGEPAL C and incubated on ice for 30 min. After centrifuging lysate for 15 min at 15,000×
g, supernatant was transferred to another tube and protein quantification was performed using the Bradford method. After electrophoresis gels were washed in milli-Q water to remove the remaining buffer and incubated for 10 min in 0.003% hydrogen peroxide (Sigma). Hydrogen peroxide was then removed and two staining solutions containing 2% ferric chloride and, 2% potassium ferrocyanide were added until white bands shoring the catalase activity were displayed at in the expected native protein weight (i.e., 233 kD). Reaction was stopped by removing the stain and washing with mili-Q water. Gels were scanned, and band intensity was quantitated by densitometry, using the ImageJ software (version 1.49P, NIH, Bethesda, MD, USA) downloaded from the following link
https://imagej.nih.gov/ij/index.html.
4.10. RNA Isolation and qPCR Analysis
For RNA isolation, cells pellet was homogenized and extracted using Tri-Reagent procedure (Sigma) according to the manufacture protocol, next we quantized the total concentration and analyzed their stability in agarose gel. cDNA was synthetized from 1 µg of RNA extraction using NG dART RT-PCR kit (EURx, Gdansk, Przyrodników, Poland) according to the manufacture protocol. For qPCR analysis, samples of cDNA were run in triplicates using a dilution 1:10 and carried out using SYBER Green Master Mix (Applied Biosystem, Foster city, CA, USA), for this purpose we are using a sequence-specific primers whit the following sequences (
Table 2).
4.11. Immunocytochemistry
Cells were seeded over cell imaging cover glasses (Eppendorf). After the treatments, cells were washed in PBS and fixed in 4% paraformaldehyde in 0.1M phosphate buffer pH: 7.4 for 10 min at room temperature (RT). After fixation, cells were washed thrice in PBS, permeabilized and blocked with a solution containing 0.15% Tween-20 and 0.5% BSA for 30 min at RT. Once blocking solution was removed, and specific monoclonal antibody anti-α-tubulin (1:200) or mycotoxin phalloidin (1:500) was added and incubated overnight at 4 °C in a humid chamber. The next day, cells were washed in PBS and incubated with Goat anti-mouse fluorescent secondary antibody (Alexa Fluor 488, 1:500) for 1 h at RT. After incubation, cells were washed in PBS and the nuclei were stained with 4’, 6-diamino-2-phenylindole (DAPI) at a concentration of 1 μg/mL for 5 min at RT. Finally, the culture chamber was removed, and slides were mounted using Fluoromont G (Dako, Produktionsvej, Glostrup, Denmark). For the estimation of the globular (G): polymerized actin (F) ratio we carried out a protocol based on Deoxyribonuclease I kit (Invitrogen, Carlsbad, CA, USA) in combination with phalloidin staining.
4.12. Quantification of Mitosis Number
To calculate the number of mitosis present in the cell culture after treatment with melatonin, DAPI images from immunocytochemistry were used and the ratio between the number of mitosis respect to the total number of cells was calculated, analyzing a total of 18 fields per experimental group.
4.13. Cell Volume Analysis
To calculate the in situ cell volume in cultured cells, we used a protocol previously developed by our research group, with minor modifications. To this aim, confocal microscopy micrographs of phalloidin staining samples, taken at a final 200× magnifications, were processed using the Imaris image processing software (Bitplane, Oxford instruments, Belfast, UK).
4.14. Animal Models
All the experiments were designed with the approval (07/15/2016) of the ethical committee on animal experimentation of the University of Oviedo (PROAE 32/2016). Likewise, surgical and treatment procedures applied were carried out following the European Directive 2012/63/EU. To carry out the experiments, a cohort of 24, 10 week-old mice (Mus musculus) on a C57BL/6J genetic background were acquired from Charles River (Wilmington, MA, USA). This genetic background was chosen given the inability of these animals to produce melatonin, since they present a truncated form of the enzyme aril-alkylamine-N-Acetyltransferase (AANAT), the key enzyme in the synthesis of indole. All the animals were identified, housed individually and maintained under a 12:12 light dark cycle with food and water provided ad libitum. Lung metastasis from melanoma cells was induced by injection of B16-F10 cells in the tail vein, using a well-reported protocol. In all the experiments, animals were sacrificed 15 days after injection. Blood was collected by cardiac puncture and then part of both lungs were dissected and fixed overnight in a solution containing paraformaldehyde 4% in phosphate buffer 0.1M, pH 7.4. Subsequently, tissues were embedded in paraffin and 5 μm sections were obtained and stained with hematoxylin/eosin. Additionally, metastasis present in the lungs were isolated by microsurgery and frozen in liquid nitrogen to perform molecular biology studies.
4.15. Injection of Cells
When B16-F10 cells were confluent, they were trypsinized following the method described above. Cells were then counted in a hemocytometer and resuspended in DMEM medium without supplements at a final concentration of 106 cells/mL. From this suspension, 2 × 10⁵ cells were injected into the tail vein of each mouse.
4.16. In Vivo Luciferase Imaging
Bioluminescence imaging was performed with an IVIS imaging system (Xenogen Corp, Alameda, CA, USA). After 10 days of cell injection, mice were IP injected with D-Luciferin potassium salt (Perkin Elmer, MA, USA) at 150 mg/Kg body weight, under isoflurane anesthesia (Zoetis, NJ, USA). Luminescence was measured 5 min after the injection, taking anatomical images in Dorsal, Lateral and Ventral position of each animal.
4.17. Macroscopic and Microscopic Quantification of Pulmonary Metastasis
For the quantification of the surface occupied by melanoma metastasis in relation to the pulmonary surface, two macros were designed for the free image J software. These tools allow an automatic analysis of the surface of each of the metastasis, as well as the surface occupied by lung tissue both macroscopically and microscopically.
4.18. Tumor Model with Intraperitoneal Melatonin (IP)
To perform the melanoma tumor model in vivo, animal cohort was divided into two experimental groups. For visualization four animals of both experimental groups received the injection of luciferase-transformed B16-F10 cells, which were kindly provided by Dr. López-Otín. The other group of 20 animals were injected with parental B16-F10 cells. Both groups were equally divided into treatment and control groups. Treated group were administered melatonin daily at a dose of 20 mg/kg body weight by intraperitoneal (IP) injection was performed two hours before the dark phase. Control group was administered a vehicle (10% ethanol).
4.19. Tumor Model with Melatonin in Drinking Water
For the realization of the melanoma tumor model in vivo another cohort of 16 animals C57BL/6J was equally divided into two groups to which B16-F10 cells transformed with luciferin were administered. One of the groups was administered melatonin at a dose of 20 mg/kg of body weight in the drinking water, while the control group was administered vehicle (10% ethanol). The amount of water consumed was recorded every two days and animals were sacrificed 15 days after the injection of the cells.

 ,
, 


