Abstract
Mutations in the EPM2A and EPM2B genes, encoding laforin and malin proteins respectively, are responsible for Lafora disease, a fatal form of progressive myoclonus epilepsy with autosomal recessive inheritance. Neuroimaging studies of patients with Lafora disease have shown different degrees of brain atrophy, decreased glucose brain uptake and alterations on different brain metabolites mainly in the frontal cortex, basal ganglia and cerebellum. Mice deficient for laforin and malin present many features similar to those observed in patients, including cognitive, motor, histological and epileptic hallmarks. We describe the neuroimaging features found in two mouse models of Lafora disease. We found altered volumetric values in the cerebral cortex, hippocampus, basal ganglia and cerebellum using magnetic resonance imaging (MRI). Positron emission tomography (PET) of the cerebral cortex, hippocampus and cerebellum of Epm2a−/− mice revealed abnormal glucose uptake, although no alterations in Epm2b−/− mice were observed. Magnetic resonance spectroscopy (MRS) revealed significant changes in the concentration of several brain metabolites, including N-acetylaspartate (NAA), in agreement with previously described findings in patients. These data may provide new insights into disease mechanisms that may be of value for developing new biomarkers for diagnosis, prevention and treatment of Lafora disease using animal models.
1. Introduction
Lafora disease (OMIM 254780, ORPHA 501) is a progressive myoclonic epilepsy that initiates during adolescence, usually between 10 and 18 years of age, after an apparent normal development. The first symptoms are epileptic seizures and/or cognitive alterations that cause school difficulties. Cognitive decline rapidly produces intellectual and lexical problems. These symptoms progressively worsen and patients develop severe dementia, ataxia, dysarthria, amaurosis and respiratory failure, which usually lead to death within 5 to 10 years of the onset of the disease [1,2]. There are no specific therapies for the disease and patients are only treated with antiseizure medications, although seizures rapidly develop resistance and myoclonus become constant.
The disease presents autosomal recessive inheritance with mutations found in two genes, the Epilepsy Progressive Myoclonus type 2A (EPM2A) gene (OMIM 607566) encoding laforin, a dual-specificity phosphatase [3,4,5] and the Epilepsy Progressive Myoclonus type 2B (EPM2B) gene (OMIM 608072) encoding malin, an E3 ubiquitin ligase [6,7]. Lafora disease is an ultrarare disease with a higher prevalence in regions with noted consanguinity. It is characterized by the presence of a distinctive histological biomarker in the brain and other tissues: the abnormal inclusions of polyglucosans known as Lafora bodies. Lafora bodies are composed of low-branched and hyperphosphorylated glycogen-like molecules and can be identified with periodic-acid-Schiff (PAS)-staining [1,2,8,9,10].
Some studies of brain volumetry by magnetic resonance imaging (MRI) in patients with Lafora disease showed normal values [11,12,13], especially early after diagnosis of the disease [14,15]. However, other studies have reported certain levels of brain atrophy in patients with Lafora disease at different stages of the disease. Diffuse cortical [16,17], cerebellar [18], cerebral [19,20] or both, cerebellar and cerebral [21,22,23] atrophy were observed in certain patients, mainly in more advanced stages of the disease [15]. However, with 2-deoxy-2-[18F]fluoro-D-glucose (FDG)–positron emission tomography (PET), a diffuse decrease in cortical [24] or cerebral [25] glucose metabolism has been reported in several patients, especially in posterior areas, such as the cerebellum [26,27] and occipital lobes [12]. A decrease in glucose metabolism has also been described in extensive areas of the brain in a series of 8 patients, often involving multiple cortical and subcortical regions, such as the thalamus, the temporal, frontal and parietal lobes [28]. Additionally, bilateral glucose hypometabolism in the frontal, parietal and temporal lobes and in the auditory and sensorimotor cortex was reported in a case of a young patient with Lafora disease [29].
In vivo 1H magnetic resonance spectroscopy (1H-MRS) studies in a series of 10 patients with Lafora disease showed altered metabolite concentrations, mainly in the frontal and occipital cortex, cerebellum and basal ganglia [11]. In particular, this study reported a decreased N-acetylaspartate/creatine (NAA/Cr) ratio in the same regions, along with a decreased NAA/choline (NAA/Cho) ratio and an increased Cho/Cr ratio in the frontal cortex. A study of 1[H] MRS in 5 patients [30] corroborated the predominant involvement of the frontal cortex in Lafora disease, with a significant decrease in NAA/Cr and NAA/Cho ratios and an increase of the Cho/Cr ratio in patients compared to controls. Furthermore, a significant reduction in the NAA/Cho ratio in the cerebellum was found in a series of 12 patients with Lafora disease, along with an association between metabolite alterations and some clinical parameters (myoclonus and ataxia) [31]. Recently, an in vivo study of 1[H] MRS study in the thalamus of a Beagle dog showed a decrease in molar concentrations of glutamate + glutamine (Glu+Gln), NAA and mIns + glycine (mIns+Gly) and higher concentrations of total Cho (tCho) and phosphoethanolamine (PE) [23].
Null mouse models of Lafora disease have been generated by gene targeting deletion of either Epm2a or Epm2b genes. Both mouse models, Epm2a−/−, lacking laforin expression [32] and Epm2b−/−, null for malin expression [33], have symptoms similar to those observed in patients with the disease, such as motor alterations, memory deficits, dyskinesia, epilepsy, neurodegenerative processes and Lafora bodies, which have been extensively characterized in previous reports [32,33,34,35]. However, to our knowledge, no data are available on the structural and functional alterations of Lafora disease mouse brain caused by the absence of laforin or malin expression. In this article, we explore for the first time the alterations observed in brain volume, glucose metabolism and brain metabolites through in vivo MRI, FDG-PET and 1H-MRS ex vivo studies, in both Epm2a−/− and Epm2b−/− mouse models of Lafora disease.
2. Results
Manual MRI analysis of regions of interest (ROI) (Figure 1) showed a statistically significant increased volume of the entire brain, cortex, cerebellum and hippocampus in the 6-month-old Epm2a−/− mice compared with control mice (Figure 1A), while 16-month-old Epm2a−/− mice only showed a significant increase in the volume of the cerebellum (Figure 1C). 6-month-old Epm2b−/− mice only showed a significant increase in the entire brain volume (Figure 1B).
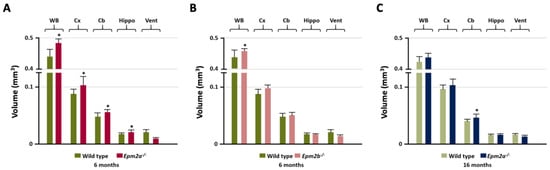
Figure 1.
Manual analysis of the volumetry differences between control and young Epm2a−/− (A) (n = 12), between control and young Epm2b−/− (B) (n = 12) and between control and older Epm2a−/− (C) mice (n = 20) in different ROIs measured on magnetic resonance imaging (MRI). WB: whole brain; Cx: cortex; Cb: cerebellum; Hippo: hippocampus; Vent: ventricles. * p < 0.05.
Voxel-based morphometry (VBM) analysis of the brain of Epm2a−/− and Epm2b−/− mice revealed changes in the volume of grey matter (GM) and white matter (WM) in different regions (Figure 2). Cerebrospinal fluid (CSF) analysis showed decreased volumes in the 3rd dorsal, 4th and lateral ventricles of 6-month-old Epm2a−/− mice compared to controls (Figure 2A, CSF). After family-wise error (FWE) correction, a significant decreased volume of the 4th ventricle of old Epm2a−/− mice (Figure 2C, CSF) was found, with no statistically significant differences in younger mice. An increase in WM and a decrease in GM volumes were observed in the basal ganglia of young Epm2a−/− and Epm2b−/− mice (Figure 2A,B, GM, WM) and in the hippocampus of young Epm2b−/− and older Epm2a−/− mice (Figure 2B,C, GM, WM and Supplementary Figure S1A). In young Epm2a−/− mice, the volume of WM increased significantly after FWE correction in the hippocampus, while no statistically significant changes were observed in the volume of GM (Figure 2A, GM, WM and Supplementary Figure S1A). In the cerebellum, the increased volume of WM was present in Epm2a−/− and Epm2b−/− mice at 6 months of age (Figure 2B, WM and Supplementary Figure S1B), while the volume of GM did not change in either group. In the cerebral cortex, decreased GM and increased WM volumes were observed in the retrosplenial cortex of young Epm2a−/− mice (Figure 2A, GM, WM; Rp-cx and Table 1) and in the sensorimotor cortex of old Epm2a−/− mice (Figure 2C, GM, WM; SM-cx and Table 1). In old Epm2a−/− mice, the GM volume increased significantly after FWE correction in the insular cortex/claustrum (Figure 2C, GM; In-cx /Cl).
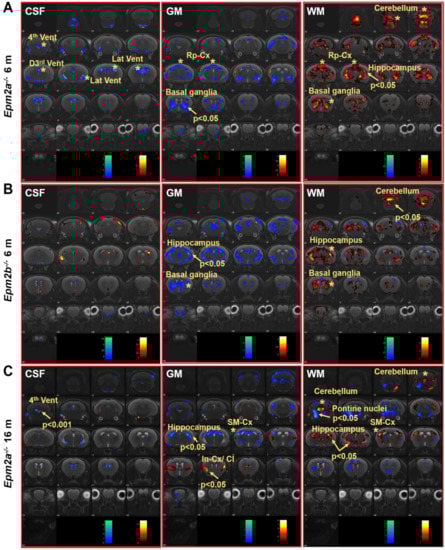
Figure 2.
Voxel-based morphometry (VBM) analysis of MRI in Lafora disease mice. VBM of CSF, GM and WM showed a t-value (p < 0.05, k = 500 voxels) overlaid on the MRI reference, indicating that the volume of the region increased (hot colors) or decreased (cold colors) in Epm2a−/− (A) and Epm2b−/− (B) mice at 6 months of age and in Epm2a−/− mice at 16 months (C), compared to control values. CSF: cerebrospinal fluid; GM: grey matter; WM: white matter. In-cx: insular cortex; Rp-cx: retrosplenial cortex; SM-cx: sensorimotor cortex; D3rd, 4th and Lat Vent: dorsal 3rd, fourth and lateral ventricles. Asterisks indicate significant clusters. Arrows indicate significant clusters that survived the FWE correction.

Table 1.
Summary of volumetric and glucose uptake alterations in Lafora disease mouse models observed by MRI and positron emission tomography (PET) analysis.
Manual ROI analysis of FDG-PET revealed no differences in glucose uptake (Figure 3A,C,E and Table 1). However, statistical parametric mapping (SPM) analysis showed a relative decrease in FDG uptake in the hippocampus and an increase in the retrosplenial and temporal cortex of Epm2a−/− mice at 6 months of age (Figure 3B and Table 1). Furthermore, older Epm2a−/− mice showed increased FDG uptake in the cerebellum and sensorimotor cortex (Figure 3F and Table 1). No significant differences were found in Epm2b−/− mice (Figure 3D and Table 1).
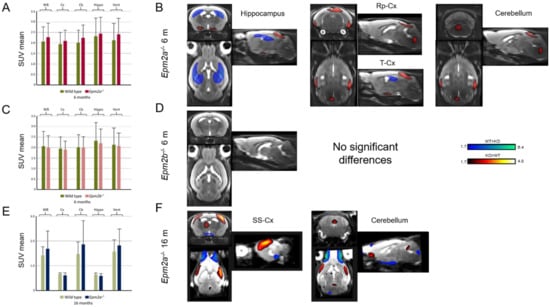
Figure 3.
2-deoxy-2-[18F]fluoro-D-glucose (FDG) uptake in 6-month-old Epm2a−/− (A,B) and Epm2b−/− (C,D) and 16-month old Epm2a−/− (E,F) mice compared to control mice. The bar graphs on the left (A,C,E) show Standard Uptake Value mean (SUVmean) in the PET ROIs. No statistically significant differences were found with ROI analysis. The right panel (B,D,F) shows the statistical parametric mapping (SPM) t-values (p < 0.05, k = 25 voxels) overlaid on the reference MRI indicating an increase (hot colors) or a decrease (cold colors) of FDG uptake. WB: whole brain; Cx: cortex; Cb: cerebellum; Hippo: hippocampus; Vent: ventricles; Rp-cx: retrosplenial cortex; T-cx: temporal cortex; SM-cx: sensorimotor cortex.
Ex vivo proton high resolution magic angle spinning (1H-HRMAS) analysis of Epm2a−/− and Epm2b−/− mice at 6 months showed alterations of brain metabolites in different brain regions (Table 2 and Supplementary Figure S2). The metabolites with the most significant alterations in the entire brain were gamma-aminobutyric acid (GABA), lactate (Lac), myo-Inositol (mIns), N-acetylaspartate (NAA), phosphocreatine (PCr), glutamine + glutamate (Glu+Gln) and mIns + glycine (mIns+Gly) normalized to total tCr (Cr+PCr) and the most affected regions were the cortex, hippocampus, brainstem and cerebellum. Detailed description of the metabolite alterations is provided in Table 2 and in the Supplementary Data. The concentrations of acetate (Ace), alanine (Ala), aspartate (Asp), glycerylphosphorylcholine (GPC), phosphocholine (PCho) and choline + glycerylphosphorylcholine + phosphocholine (Cho+GPC+PCho) normalized to tCr showed mild alterations in specific brain regions of Lafora disease mouse models. NAA was markedly reduced in all brain regions of both mice, with the exception of the cerebral cortex, while Lac levels increased in the frontal regions, mainly in the prefrontal cortex, hippocampus and basal ganglia but also in the non-prefrontal cortex (cortex-) (Table 2 and Supplementary Figure S2). The metabolite concentrations varied very similarly in the Epm2a−/− and Epm2b−/− mice, although with less pronounced changes in the Epm2b−/− model (Table 2 and Supplementary Figure S2).
Table 2.
Regional brain metabolic changes observed ex vivo in the Proton High Resolution Magic Angle Spinning (1H-HRMAS) analysis of Epm2a-/- and Epm2b-/- mice at 6 months of age.
3. Discussion
Patients with Lafora disease present with severe neurological deficiencies and brain abnormalities, such as abnormal brain aggregates, neurodegenerative processes and epilepsy. Neuroimaging studies in patients show different levels of brain atrophy, decreased brain glucose uptake and abnormalities in brain metabolites, predominantly in the frontal cortex, basal ganglia and cerebellum. Mouse models of Lafora disease present several symptoms similar to those observed in patients, although there are no data available on structural and/or functional brain alterations derived from the lack of laforin or malin expression. Detailed analysis of the brain imaging data in these models can help gain a deeper insight into the causes of the disease.
In this work, ROI analysis of MRI studies showed hypertrophy of the cerebral cortex, whole-brain, hippocampus and cerebellum in 6-month-old Epm2a−/− mice. Both Epm2a−/− mice at 6 and 16 months of age showed an increased volume of cerebellum as assessed by the ROI analysis, while in this area the SPM analysis showed an increased volume of WM volume without alterations in the volume of GM. In the globus pallidus and striatum (basal ganglia) of young Epm2a−/− mice the volume of WM also increased but the GM decreased. Alterations in the volumes of WM and GM were also observed in other areas of the brain. Some of these areas showed reduced GM and increased WM volumes, leading to non-significant differences in the total volume reported by ROI analysis, probably because the changes in GM and WM compensated each other. These brain volumetric alterations in the volume of WM and GM may be the basis for some of the neurological effects observed in Lafora disease mouse models, such as cognitive deficits, motor and coordination impairments or hyperexcitability of the neuronal network [32,33,35]. As mentioned above, MRI studies in patients showed the presence of diffuse cerebral, cortical and/or cerebellar atrophy [15,16,17,18,19,20,21,22], findings opposite to those observed in equivalent brain regions of Epm2a−/− mice. This discrepancy could be due to a possible inflammatory mechanism that could arise in response to neuronal loss or other pathological events, leading to some hypertrophy in our mouse models.
Most FDG-PET studies in patients with Lafora disease reported decreased glucose uptake, either diffuse cortical [24] or in the entire brain [25] or localized to posterior areas, such as the occipital cortex [12] and cerebellum [26,27]. Our SPM analysis showed an increased glucose uptake in the cerebellum and the restrosplenial, temporal and sensorimotor cortices of young Epm2a−/− mice, corresponding to the regions showing volumetric alterations with MRI. SPM analysis also showed a reduction in glucose uptake in the hippocampus of Epm2a−/− mice at 6 months, which is also colocalized with alterations in GM and WM volumes.
SPM analysis of PET studies demonstrated regional changes, such as increased glucose uptake in the cerebellum and in the restrosplenial, temporal and sensorimotor cortices of young Epm2a−/− mice. This increase in glucose metabolism could be related to the volumetric alterations observed in these regions by MRI and may suggest the presence of hyperexcitability of neural networks, although this correlation would require further investigation. SPM analysis of PET images also showed reduced glucose uptake in the hippocampus of young Epm2a−/− mice. This glucose hypometabolism could be related to the alterations in GM and WM volumes observed in the hippocampus and may reflect the appearance of cellular damage due to the accumulation of Lafora bodies in this region as disease progresses [32,36,37]. However, no statistically significant changes in glucose metabolism were observed in the hippocampus of Epm2b−/− at 6 months or Epm2a−/− mice at 16 months of age, despite the GM and WM volume abnormalities shown in this region. The Epm2b−/− mice did not show significant differences in brain glucose uptake either. These data on the Epm2b−/− mouse model are consistent with previous reports showing that mutations in the EPM2B gene in patients with Lafora disease have a slightly milder clinical course [38]. The laforin gene is predominantly expressed in the cerebral cortex, hippocampus, basal ganglia and cerebellum and its expression increases until adulthood in other regions of the mouse brain [36]. In our work, abnormalities in the volumetric values and glucose metabolism were observed predominantly in the cerebral cortex, hippocampus and cerebellum, correlating with regions of higher expression of laforin and accumulation of Lafora bodies [32,33,35,39]. When comparing our results with patient data, we observe certain inconsistent findings, since the same regions that presented hypometabolism in the patients instead showed hypermetabolism in our models. These results could be explained by a possible inflammatory mechanism in our mouse models that leads to some hypermetabolism in the same regions where patients show atrophy and hypometabolism.
Ex vivo 1H-HRMAS analysis in Epm2a−/− and Epm2b−/− mouse models revealed abnormal metabolite patterns in all areas analyzed. Metabolite concentrations varied similarly in the Epm2a−/− and Epm2b−/− mice, although less pronounced in the Epm2b−/− mouse model, consistent with the milder phenotype of this mutant. NAA is a marker of neuronal density and viability and its levels decreases with neuronal dysfunction and destruction [40]. mIns is a glial marker that usually increases when astrocyte activation and proliferation occurs. Total Cr is relatively constant and is frequently used as a reference metabolite for in vivo MRS analysis. Summarizing the results of both models, the levels of GABA, Ace, Ala, Lac and mIns increased in different regions, while NAA was significantly reduced in all brain regions in both models of Lafora disease, with the exception of the cerebral cortex. This contrasts with the observed reduction of this metabolite in the frontal cortex of patients [11]. Decreased levels of NAA in the hippocampus may reflect the existence of neurodegenerative processes, in agreement with previous reports showing a reduced number of neurons in this area [32,33]. Although the levels of NAA did not show changes in the cerebral cortex, many other metabolites were altered in this region, with the levels of Ala, GABA, Lac, mIns and mIns+Gly more increased. Elevated lactate levels were also observed in the prefrontal cortex, hippocampus and basal ganglia of both models, suggesting abnormal energetic metabolism and/or hyperexcitability. An increased in the lactate level is observed during hypoxia or in general conditions of energy deficiency. However, the Glu+Gln/tCr ratio decreased in hippocampus, basal ganglia, brainstem and cerebellum, with no changes in frontal cortex, contrary to what occurs in idiopathic generalized epilepsy, where an increase in the glutamate plus glutamine ratio was observed in frontal lobes by in vivo MRS analysis [41]. Elevated levels of lactate and reduced glutamate are observed during situations of decreased global glucose consumption, which could be occurring in the hippocampus, as observed with FDG-PET. Overall, the ex vivo 1H-HRMAS analysis of Epm2a−/− and Epm2b−/− mice showed alterations in regions that coincide with those in which neuropathological studies have demonstrated the presence of Lafora bodies, with a predominant location in cortex, hippocampus, basal ganglia, thalamus, brainstem and cerebellum [32,33,39]. This correlation may indicate that Lafora bodies can produce neurotoxic consequences and lead to neuronal loss and astrocytosis, as has been widely reported [32,33,34,37,39,42].
Although the Epm2a−/− and Epm2b−/− mouse models show similar phenotypic characteristics [39], the Epm2b−/− mice occasionally exhibits some milder neurological abnormalities, such as reduced hypersensitivity to PTZ, less motor coordination impairments and, as we showed above, minor deficiencies in several neuroimaging variables. Furthermore, the analysis of glucose metabolism in the heart, as observed with FDG-PET, shows increased glucose uptake in Epm2a−/− mice [43] and no changes in the Epm2b−/− mouse model [44]. Both models present in older ages milder spontaneous movements and motor coordination alterations similar to those found in younger mice, while the memory decline, the hindlimb clasping and the number of LBs increase with age [39]. The mismatch between age and severity of these neurological anomalies requires further studies, as no data are available from aged patients with the disease.
To the best of our knowledge, this is the first study to evaluate structural and functional brain alterations in mouse models of Lafora disease. In conclusion, our in vivo and ex vivo brain imaging findings reveal that Epm2a−/− mice present hypertrophy, abnormal glucose uptake and altered brain metabolites predominantly in the cerebral cortex, basal ganglia, hippocampus and cerebellum, correlating with regions of higher expression of laforin and accumulation of Lafora bodies. Epm2b−/− mice show brain metabolic changes comparable to those present in Epm2a−/− mice and in some brain regions of patients with Lafora disease, although Epm2b−/− mice shows milder volumetric alterations and normal glucose metabolism. Further neuroimaging studies may define new biomarkers and shed light into the basic mechanisms of the disease and may lead to new avenues for the diagnosis, prevention and treatment of Lafora disease.
4. Materials and Methods
4.1. Animals
Epm2a−/− and Epm2b−/− knock-out mice were generated as previously described [32,33]. We used 12 Epm2a−/−, 12 Epm2b−/− and 12 wild type (wt) mice at 6 months of age to undergo MRI, PET and MRS studies. In addition, 20 Epm2a−/− and 11 wt mice were used for MRI and PET studies at 16 months of age.
Mice were housed in standard size cages, subjected to a 12h light/dark cycle at constant temperature (23 °C) and with ad libitum access to food (standard diet, Safe Scientific Animal Food & Engineering, Augy, France) and water. All experiments were carried out using and sacrificing the minimum number of animals and minimizing their suffering.
The experiments were conducted in accordance with the “Principles of laboratory animal care” (NIH publication No. 86-23, revised 1985), as well as with the European Communities Council Directive (2010/63/EU) and the Ethical Review Board of the IIS-Fundación Jiménez Díaz.
4.2. In Vivo Imaging
For brain MRI and FDG-PET studies, animals were maintained under sevoflurane anesthesia (5% induction and 2% maintenance, in 100% O2). MRI was obtained with a 7 Tesla BioSpec 70/20 scanner (Bruker, Ettlingen, Germany). A T2-weighted axial RARE sequence was acquired with TR = 4600 ms, TE = 65 ms, 10 averages, rare factor = 8 and slice thickness of 0.5 mm (30 slices). The size of the matrix was 192 × 192 pixels with a field of view (FOV) of 20 × 20 mm2. Brain FDG-PET studies were carried out with a SuperArgus small animal PET-CT scanner (SEDECAL, Madrid, Spain). PET images were acquired 45 min after intravenous administration of 17−18 MBq FDG. Data was collected over 30 min and reconstructed using OSEM-2D with 16 subsets and 2 iterations. After PET, computed tomography (CT) images were acquired using an X-ray beam current of 240 µA and a tube voltage of 40 kVp and reconstructed with an FDK algorithm [45].
4.3. Brain Image Analysis
For manual analysis, Multimodality Workstation software (MMWKS) [46] was used to define ROIs of the entire brain, cortex, hippocampus, cerebellum and ventricles by a single MRI expert and then applied to the co-registered PET images to get their mean standard uptake value (SUVmean). Values are given as mean ± standard error of mean (SEM). The differences between the groups were analyzed using the Student’s t-test. The thresholds of statistical significance were * p < 0.05; ** p < 0.01; *** p < 0.001.
Voxel-wise analysis was obtained using the SPM12 package (http://www.fil.ion.ucl.ac.uk/spm/software/spm12) (UCL, London, United Kingdom) using VBM for MRI and SPM for PET. Regarding VBM analysis, a template image was generated using all the original MRI images of the mouse brain, generating WM, GM and CSF tissue masks. Group differences were evaluated using a Student’s t-test design and establishing a significance threshold of p < 0.05 in clusters of at least 500 voxels. To control for multiple comparisons, a FWE correction was performed. The clusters that maintained a significant difference are highlighted with arrows (p < 0.001; p < 0.05) in the figures.
For the SPM analysis, the CT images of each animal were registered on the MRI and the spatial transformations obtained were applied to the PET images. PET images were then normalized to global mean brain activity and compared between groups with a Student´s t-test design with a significance level of p < 0.05 in clusters of at least 25 pixels.
4.4. Ex Vivo 1H-HRMAS MRS Analysis
Animals were sacrificed after in vivo brain imaging. A Muromachi Microwave Applicator, Model TMW-6402C (Toshiba, Tokyo, Japan), was used to sacrifice unanesthetized mice by exposing the head to the microwave beam, with a power setting of 5.5 kW and an exposure time 1.6 s. After sacrifice, brains were removed and regions of interest were dissected: prefrontal cortex (PF-cx), rest of cortex without prefrontal cortex (Cx−), hippocampus (Hippo), hypothalamus (Hyp), thalamus (Thal), brainstem (BS), basal ganglia (BG) and cerebellum (Cb) and frozen in liquid nitrogen. Samples were stored at −80 °C until use.
The ex vivo 1H spectra were obtained with an AVANCE 11.7 Tesla spectrometer (Bruker, Ettlingen, Germany) equipped with a 4 mm triple channel 1H/13C/31P HR-MAS, using a 1H resonance probe with a sample spin rate of 4000 Hz. Samples (10 mg) were introduced into 50 µL zirconia rotor (4 mm outer diameter, OD) with 50 µL D2O and centrifugated at 5.000 Hz at 4 °C to avoid tissue degradation processes. Two types of monodimensional proton spectra were acquire using a water-suppressed spin-echo Carr-Purcell-Meiboom-Gill (CPMG) sequence with TE = 36 ms, TR = 144 ms and 128 scans. Data were collected into 64 k data points using a spectral width of 10 kHz (20 ppm) and a 2 s water relaxation/presaturation delay. All spectra were analyzed using the LC Model software (Oakville, ON L6J, Canada) [47] and a prior knowledge-based spectral fit algorithm.
Only the peak concentrations obtained with a standard deviation lower than 20% were evaluated. Metabolites evaluated are detailed in the Legend of Figure S2 in Supplementary Data. Metabolite values are reported normalized to total creatine concentration (tCs: creatine + phosphocreatine, Cr+PCr). 1H-HRMAS values are given as mean ± standard error of mean (SEM). The differences between the groups were analyzed using one-way Anova (Graph-PadPrism 6.0, San Diego, CA, USA), using statistical significance thresholds of * p < 0.05; ** p < 0.01; *** p < 0.001.
5. Conclusions
Epm2a−/− and Epm2b−/− mouse models of Lafora disease present alterations in the volume of the hippocampus and cerebellum.
Epm2a−/− mice also show volume abnormalities in several areas of the cerebral cortex.
In the Epm2a-/- mouse model, decreased glucose uptake in the hippocampus and increased glucose uptake in the cerebellum and certain cortical areas were observed.
MRS reveals changes in the concentration of brain metabolites predominantly in the cortex, basal ganglia, hippocampus, thalamus, brainstem and cerebellum of both models.
Structural and functional abnormalities in Lafora disease mouse models are predominantly observed in areas of the brain previously described in patients with Lafora disease.
Supplementary Materials
The following are available online at https://www.mdpi.com/1422-0067/21/20/7771/s1, Figure S1: VBM analysis of MRI in hippocampus and cerebellum of Lafora disease mice; Figure S2: Brain metabolite alterations observed ex-vivo by 1H-HRMAS analysis in young Epm2a−/− and Epm2b−/− mice)
Author Contributions
D.F.B.: Investigation, Formal analysis, Resources. L.C.: Methodology, Formal analysis, Writing–Review. G.S.E.: Conceptualization, Investigation, Resources. D.C.: Methodology, Formal analysis, Review. M.B.P.: Software, Formal analysis. M.D.: Supervision, Writing–Review. J.M.S.: Funding acquisition, Writing–Review. M.P.S.: Funding acquisition, Writing–Review & Editing. All authors have read and agreed to the published version of the manuscript.
Funding
This work has been supported by grants from the National Institute of Neurological Disorders and Stroke of the National Institutes of Health (P01NS097197), the Spanish Ministry of Economy (SAF2014-59594-R awarded to José M. Serratosa and Rti2018-095784b-100SAF awarded to José M. Serratosa and Marina P. Sánchez) and the Community of Madrid (S2017/BMD-3867 RENIM-CM) and cofunded with European structural and investment funds. The CNIC is supported by the ISCIII, the Ministerio de Ciencia e Innovación and the Pro CNIC Foundation and is a Severo Ochoa Center of Excellence (SEV-2015-0505). GSE was supported by a fellowship from the Conchita Rábago Foundation.
Acknowledgments
We thank Alexandra de Francisco, Yolanda Sierra and María de la Jara Felipe for their excellent work with animal preparation and imaging protocols and the Animal Facilities Service of the Fundación Instituto de Investigación Sanitaria-Fundación Jiménez Díaz. We also thank Teresa Navarro for her excellent work and help with 1H-HRMAS and ROI MRI and Sebastian Cerdán for helpful comments and critical reading of the manuscript.
Conflicts of Interest
The authors declare no conflict of interest. None of the authors has any conflict of interest to disclose. We confirm that we have read the Journal’s position on issues involved in ethical publication and state that this report is consistent with those guidelines.
Abbreviations
| 1H-HRMAS | Proton High Resolution Magic Angle Spinning |
| Ace | Acetate |
| Ala | Alanine |
| Asp | Aspartate |
| BG | Basal Ganglia |
| BS | Brainstem |
| Cb | Cerebellum |
| Cho+GPC+PCho | Choline + Glycerylphosphorylcholine + Phosphocholine |
| Cx- | Rest of the cortex without prefrontal cortex |
| CSF | Cerebrospinal Fluid |
| CT | Computed Tomography |
| EPM2A | Epilepsy Progressive Myoclonus type 2A |
| EPM2B | Epilepsy Progressive Myoclonus type 2B |
| FDG | 2-[18F] fluoro-D-glucose |
| FEW | Family-Wise-Error |
| GABA | Gamma-aminobutyric acid |
| Glu+Gln | Glutamate + Glutamine |
| GM | Gray Matter |
| GPC | Glycerylphosphorylcholine |
| Hippo | Hippocampus |
| 1H-MRS | 1H magnetic resonance spectroscopy |
| Hyp | Hypothalamus |
| Lac | Lactate |
| mIns | myo-Inositol |
| mIns+Gly | mIns + glycine |
| MRI | Magnetic Resonance Imaging |
| NAA | N-acetylaspartate |
| NAA/Cho | NAA/choline |
| NAA/Cr | NAA /creatine |
| NAA/mIns | NAA/myo-Inositol |
| PAS | Periodic-acid-Schiff |
| PCho | Phosphocholine |
| PCr | Phosphocreatine |
| PE | Phosphoethanolamine |
| PET | Positron-Emission Tomography |
| PF-cx | Prefrontal cortex |
| ROI | Regions Of Interest |
| SD | Standard Deviation |
| SEP | Somatosensory Evoked Potentials |
| SPM | Statistical Parametric Mapping |
| SUVmean | Standard Uptake Value mean |
| tCho | total Cho |
| tCr | total Creatine (Cr+PCr) |
| Thal | Thalamus |
| VBM | Voxel-Based Morphometry |
| WM | White Matter |
References
- Berkovic, S.F.; Andermann, F.; Carpenter, S.; Wolfe, L.S. Progressive myoclonus epilepsies: Specific causes and diagnosis. N. Engl. J. Med. 1986, 315, 296–305. [Google Scholar] [CrossRef] [PubMed]
- Berkovic, S.F.; So, N.K.; Andermann, F. Progressive myoclonus epilepsies: Clinical and neurophysiological diagnosis. J. Clin. Neurophysiol. Off. Publ. Am. Electroencephalogr. Soc. 1991, 8, 261–274. [Google Scholar] [CrossRef]
- Minassian, B.A.; Lee, J.R.; Herbrick, J.A.; Huizenga, J.; Soder, S.; Mungall, A.J.; Dunham, I.; Gardner, R.; Fong, C.Y.; Carpenter, S.; et al. Mutations in a gene encoding a novel protein tyrosine phosphatase cause progressive myoclonus epilepsy. Nat. Genet. 1998, 20, 171–174. [Google Scholar] [CrossRef] [PubMed]
- Serratosa, J.M.; Gomez-Garre, P.; Gallardo, M.E.; Anta, B.; de Bernabe, D.B.; Lindhout, D.; Augustijn, P.B.; Tassinari, C.A.; Malafosse, R.M.; Topcu, M.; et al. A novel protein tyrosine phosphatase gene is mutated in progressive myoclonus epilepsy of the Lafora type (EPM2). Hum. Mol. Genet. 1999, 8, 345–352. [Google Scholar] [CrossRef]
- Ganesh, S.; Agarwala, K.; Ueda, K.; Akagi, T.; Shoda, K.; Usui, T.; Hashikawa, T.; Osada, H.; Delgado-Escueta, A.; Yamakawa, K. Laforin, defective in the progressive myoclonus epilepsy of Lafora type, is a dual-specificity phosphatase associated with polyribosomes. Hum. Mol. Genet. 2000, 9, 2251–2261. [Google Scholar] [CrossRef]
- Chan, E.M.; Young, E.J.; Ianzano, L.; Munteanu, I.; Zhao, X.; Christopoulos, C.C.; Avanzini, G.; Elia, M.; Ackerley, C.A.; Jovic, N.J.; et al. Mutations in NHLRC1 cause progressive myoclonus epilepsy. Nat. Genet. 2003, 35, 125–127. [Google Scholar] [CrossRef]
- Gentry, M.S.; Worby, C.A.; Dixon, J.E. Insights into Lafora disease: Malin is an E3 ubiquitin ligase that ubiquitinates and promotes the degradation of laforin. Proc. Natl. Acad. Sci. USA 2005, 102, 8501–8506. [Google Scholar] [CrossRef]
- Lafora, G. The presence of amyloid bodies in the inner part of ganglion cells; also an article on the study of amyloid substances in the nervous system. Virchows Arch. Pathol. Anat. Physiol. Klin. Med. 1911, 205, 295–303. [Google Scholar] [CrossRef]
- Harriman, D.G.; Millar, J.H.; Stevenson, A.C. Progressive familial myoclonic epilepsy in three families: Its clinical features and pathological basis. Brain 1955, 78, 325–349. [Google Scholar] [CrossRef]
- Carpenter, S.; Karpati, G. Ultrastructural findings in Lafora disease. Ann. Neurol. 1981, 10, 63–64. [Google Scholar] [CrossRef]
- Villanueva, V.; Alvarez-Linera, J.; Gomez-Garre, P.; Gutierrez, J.; Serratosa, J.M. MRI volumetry and proton MR spectroscopy of the brain in Lafora disease. Epilepsia 2006, 47, 788–792. [Google Scholar] [CrossRef] [PubMed]
- Jennesson, M.; Milh, M.; Villeneuve, N.; Guedj, E.; Marie, P.Y.; Vignal, J.P.; Raffo, E.; Vespignani, H.; Mancini, J.; Maillard, L. Posterior glucose hypometabolism in Lafora disease: Early and late FDG-PET assessment. Epilepsia 2010, 51, 708–711. [Google Scholar] [CrossRef] [PubMed]
- Casciato, S.; Gambardella, S.; Mascia, A.; Quarato, P.P.; D’Aniello, A.; Ackurina, Y.; Albano, V.; Fornai, F.; Scala, S.; Di Gennaro, G. Severe and rapidly-progressive Lafora disease associated with NHLRC1 mutation: A case report. Int. J. Neurosci. 2017, 127, 1150–1153. [Google Scholar] [CrossRef] [PubMed]
- Corkill, R.G.; Hardie, R.J. An unusual case of Lafora body disease. Eur. J. Neurol. 1999, 6, 245–247. [Google Scholar] [CrossRef] [PubMed]
- Caballero, P. Progressive myoclonus epilepsies: Description of a case of Lafora disease with autopsy. Neurologia 2013, 28, 584–586. [Google Scholar]
- Fernández-Torre, J.L.; Kaplan, P.W.; Rebollo, M.; Gutiérrez, A.; Hernández-Hernández, M.A.; Vázquez-Higuera, J.L. Ambulatory non-convulsive status epilepticus evolving into a malignant form. Epileptic Disord. 2012, 14, 41–50. [Google Scholar] [CrossRef]
- Potes, T.; Galicchio, S.; Rosso, B.; Besocke, G.; García, M.D.C.; Avalos, J.C. Progressive myoclonic epilepsy secondary to Lafora’s body disease. Medicina 2018, 78, 436–439. [Google Scholar]
- Baykan, B.; Striano, P.; Gianotti, S.; Bebek, N.; Gennaro, E.; Gurses, C.; Zara, F. Late-onset and slow-progressing Lafora disease in four siblings with EPM2B mutation. Epilepsia 2005, 46, 1695–1697. [Google Scholar] [CrossRef]
- Ganesh, S.; Shoda, K.; Amano, K.; Uchiyama, A.; Kumada, S.; Moriyama, N.; Hirose, S.; Yamakawa, K. Mutation screening for Japanese Lafora’s disease patients: Identification of novel sequence variants in the coding and upstream regulatory regions of EPM2A gene. Mol. Cell Probes 2001, 15, 281–289. [Google Scholar] [CrossRef]
- Widdess-Walsh, P.; Prayson, R.A.; Cohen, B.; Lachhwani, D. A 12-year-old girl with seizures and dementia. Brain Pathol. 2007, 464–465, 474. [Google Scholar] [CrossRef]
- Striano, P.; Zara, F.; Turnbull, J.; Girard, J.M.; Ackerley, C.A.; Cervasio, M.; De Rosa, G.; Del Basso-De Caro, M.L.; Striano, S.; Minassian, B.A. Typical progression of myoclonic epilepsy of the Lafora type: A case report. Nat. Clin. Pract. Neurol. 2008, 4, 106–111. [Google Scholar] [CrossRef] [PubMed]
- Striano, P.; Ackerley, C.A.; Cervasio, M.; Girard, J.M.; Turnbull, J.; Del Basso-De Caro, M.L.; Striano, S.; Zara, F.; Minassian, B.A. 22-year-old girl with status epilepticus and progressive neurological symptoms. Brain Pathol. Zur. Switz. 2009, 19, 727–730. [Google Scholar] [CrossRef]
- Alisauskaite, N.; Beckmann, K.; Dennler, M.; Zolch, N. Brain proton magnetic resonance spectroscopy findings in a Beagle dog with genetically confirmed Lafora disease. J. Vet. Intern. Med. 2020. [Google Scholar] [CrossRef] [PubMed]
- Tsuda, H.; Katsumi, Y.; Nakamura, M.; Ikeda, A.; Fukuyama, H.; Kimura, J.; Shibasaki, H. Cerebral blood flow and metabolism in Lafora disease. Rinsho Shinkeigaku 1995, 35, 175–179. [Google Scholar]
- Al Otaibi, S.F.; Minassian, B.A.; Ackerley, C.A.; Logan, W.J.; Weiss, S. Unusual presentation of Lafora’s disease. J. Child. Neurol. 2003, 18, 499–501. [Google Scholar] [CrossRef]
- Kato, Z.; Yasuda, K.; Ishii, K.; Takagi, H.; Mizuno, S.; Shimozawa, N.; Kondo, N. Glucose metabolism evaluated by positron emission tomography in Lafora disease. Pediatr. Int. Off. J. Jpn. Pediatr. Soc. 1999, 41, 689–692. [Google Scholar] [CrossRef]
- Kumada, S.; Kubota, M.; Hayashi, M.; Uchiyama, A.; Kurata, K.; Kagamihara, Y. Fixation-sensitive myoclonus in Lafora disease. Neurology 2006, 66, 1574–1576. [Google Scholar] [CrossRef]
- Muccioli, L.; Farolfi, A.; Pondrelli, F.; d’Orsi, G.; Michelucci, R.; Freri, E.; Canafoglia, L.; Licchetta, L.; Toni, F.; Bonfiglioli, R.; et al. FDG-PET assessment and metabolic patterns in Lafora disease. Eur. J. Nucl. Med. Mol. Imaging 2019. [Google Scholar] [CrossRef] [PubMed]
- Shandal, V.; Veenstra, A.L.; Behen, M.; Sundaram, S.; Chugani, H. Long-term outcome in children with intractable epilepsy showing bilateral diffuse cortical glucose hypometabolism pattern on positron emission tomography. J. Child. Neurol. 2012, 27, 39–45. [Google Scholar] [CrossRef]
- Pichiecchio, A.; Veggiotti, P.; Cardinali, S.; Longaretti, F.; Poloni, G.U.; Uggetti, C. Lafora disease: Spectroscopy study correlated with neuropsychological findings. Eur. J. Paediatr. Neurol. 2008, 12, 342–347. [Google Scholar] [CrossRef] [PubMed]
- Altindag, E.; Kara, B.; Baykan, B.; Terzibasioglu, E.; Sencer, S.; Onat, L.; Sirvanci, M. MR spectroscopy findings in Lafora disease. J. Neuroimaging 2009, 19, 359–365. [Google Scholar] [CrossRef] [PubMed]
- Ganesh, S.; Delgado-Escueta, A.V.; Sakamoto, T.; Avila, M.R.; Machado-Salas, J.; Hoshii, Y.; Akagi, T.; Gomi, H.; Suzuki, T.; Amano, K.; et al. Targeted disruption of the Epm2a gene causes formation of Lafora inclusion bodies, neurodegeneration, ataxia, myoclonus epilepsy and impaired behavioral response in mice. Hum. Mol. Genet. 2002, 11, 1251–1262. [Google Scholar] [CrossRef] [PubMed]
- Criado, O.; Aguado, C.; Gayarre, J.; Duran-Trio, L.; Garcia-Cabrero, A.M.; Vernia, S.; San Millan, B.; Heredia, M.; Roma-Mateo, C.; Mouron, S.; et al. Lafora bodies and neurological defects in malin-deficient mice correlate with impaired autophagy. Hum. Mol. Genet. 2012, 21, 1521–1533. [Google Scholar] [CrossRef] [PubMed]
- Knecht, E.; Criado-García, O.; Aguado, C.; Gayarre, J.; Duran-Trio, L.; Garcia-Cabrero, A.M.; Vernia, S.; San Millán, B.; Heredia, M.; Romá-Mateo, C.; et al. Malin knockout mice support a primary role of autophagy in the pathogenesis of Lafora disease. Autophagy 2012, 8, 701–703. [Google Scholar] [CrossRef][Green Version]
- García-Cabrero, A.M.; Sánchez-Elexpuru, G.; Serratosa, J.M.; Sánchez, M.P. Enhanced sensitivity of laforin- and malin-deficient mice to the convulsant agent pentylenetetrazole. Front. Neurosci. 2014, 8, 291. [Google Scholar] [CrossRef]
- Ganesh, S.; Agarwala, K.L.; Amano, K.; Suzuki, T.; Delgado-Escueta, A.V.; Yamakawa, K. Regional and developmental expression of Epm2a gene and its evolutionary conservation. Biochem. Biophys. Res. Commun. 2001, 283, 1046–1053. [Google Scholar] [CrossRef]
- Berthier, A.; Paya, M.; Garcia-Cabrero, A.M.; Ballester, M.I.; Heredia, M.; Serratosa, J.M.; Sanchez, M.P.; Sanz, P. Pharmacological Interventions to Ameliorate Neuropathological Symptoms in a Mouse Model of Lafora Disease. Mol. Neurobiol. 2016, 53, 1296–1309. [Google Scholar] [CrossRef]
- Gomez-Abad, C.; Gomez-Garre, P.; Gutierrez-Delicado, E.; Saygi, S.; Michelucci, R.; Tassinari, C.A.; Rodriguez de Cordoba, S.; Serratosa, J.M. Lafora disease due to EPM2B mutations: a clinical and genetic study. Neurology 2005, 64, 982–986. [Google Scholar] [CrossRef]
- Garcia-Cabrero, A.M.; Marinas, A.; Guerrero, R.; Rodriguez de Cordoba, S.; Serratosa, J.M.; Sanchez, M.P. Laforin and Malin Deletions in Mice Produce Similar Neurologic Impairments. J. Neuropathol. Exp. Neurol. 2012, 71, 413–421. [Google Scholar] [CrossRef]
- Moffett, J.R.; Ross, B.; Arun, P.; Madhavarao, C.N.; Namboodiri, A.M. N-Acetylaspartate in the CNS: From neurodiagnostics to neurobiology. Prog. Neurobiol. 2007, 81, 89–131. [Google Scholar] [CrossRef]
- Simister, R.J.; McLean, M.A.; Barker, G.J.; Duncan, J.S. Proton MRS reveals frontal lobe metabolite abnormalities in idiopathic generalized epilepsy. Neurology 2003, 61, 897–902. [Google Scholar] [CrossRef] [PubMed]
- Sanchez-Elexpuru, G.; Serratosa, J.M.; Sanchez, M.P. Sodium selenate treatment improves symptoms and seizure susceptibility in a malin-deficient mouse model of Lafora disease. Epilepsia 2017, 58, 467–475. [Google Scholar] [CrossRef] [PubMed]
- Vernia, S.; Heredia, M.; Criado, O.; Rodriguez de Cordoba, S.; Garcia-Roves, P.M.; Cansell, C.; Denis, R.; Luquet, S.; Foufelle, F.; Ferre, P.; et al. Laforin, a dual specificity phosphatase involved in Lafora disease, regulates insulin response and whole-body energy balance in mice. Hum. Mol. Genet. 2011, 20, 2571–2584. [Google Scholar] [CrossRef] [PubMed]
- Villalba-Orero, M.; Sánchez-Elexpuru, G.; López-Olañeta, M.; Campuzano, O.; Bello-Arroyo, E.; García-Pavía, P.; Serratosa, J.M.; Brugada, R.; Sánchez, M.P.; Lara-Pezzi, E. Lafora Disease Is an Inherited Metabolic Cardiomyopathy. J. Am. Coll. Cardiol. 2017, 69, 3007–3009. [Google Scholar] [CrossRef] [PubMed]
- Abella, M.; Vaquero, J.; Sisniega, A.; Pascau, J.; Udias, A.; Garcia, V.; Vidal, I.; Desco, M. Software architecture for multi-bed FDK-based reconstruction in X-ray CT scanners. Comput. Methods Progr. Biomed. 2012, 107, 218–232. [Google Scholar] [CrossRef] [PubMed]
- Pascau, J.; Gispert, J.; Soto-Montenegro, M.; Rodriguez-Ruano, A.; Garcia-Vazquez, V.; Udias, A.; Vaquero, J.; Desco, M. Small-animal PET registration method with intrinsic validation designed for large datasets. In Proceedings of the 2007 IEEE Nuclear Science Symposium Conference Record, Honolulu, HI, USA, 26 October–3 November 2007; Volume 5, pp. 3751–3753. [Google Scholar]
- Provencher, S.W. Automatic quantitation of localized in vivo 1H spectra with LCModel. NMR Biomed. 2001, 14, 260–264. [Google Scholar] [CrossRef] [PubMed]


Publisher’s Note: MDPI stays neutral with regard to jurisdictional claims in published maps and institutional affiliations. |
© 2020 by the authors. Licensee MDPI, Basel, Switzerland. This article is an open access article distributed under the terms and conditions of the Creative Commons Attribution (CC BY) license (http://creativecommons.org/licenses/by/4.0/).