MicroRNA Profiling in Oesophageal Adenocarcinoma Cell Lines and Patient Serum Samples Reveals a Role for miR-451a in Radiation Resistance

 , , ,
, , ,  , and
, and
Abstract
:1. Introduction
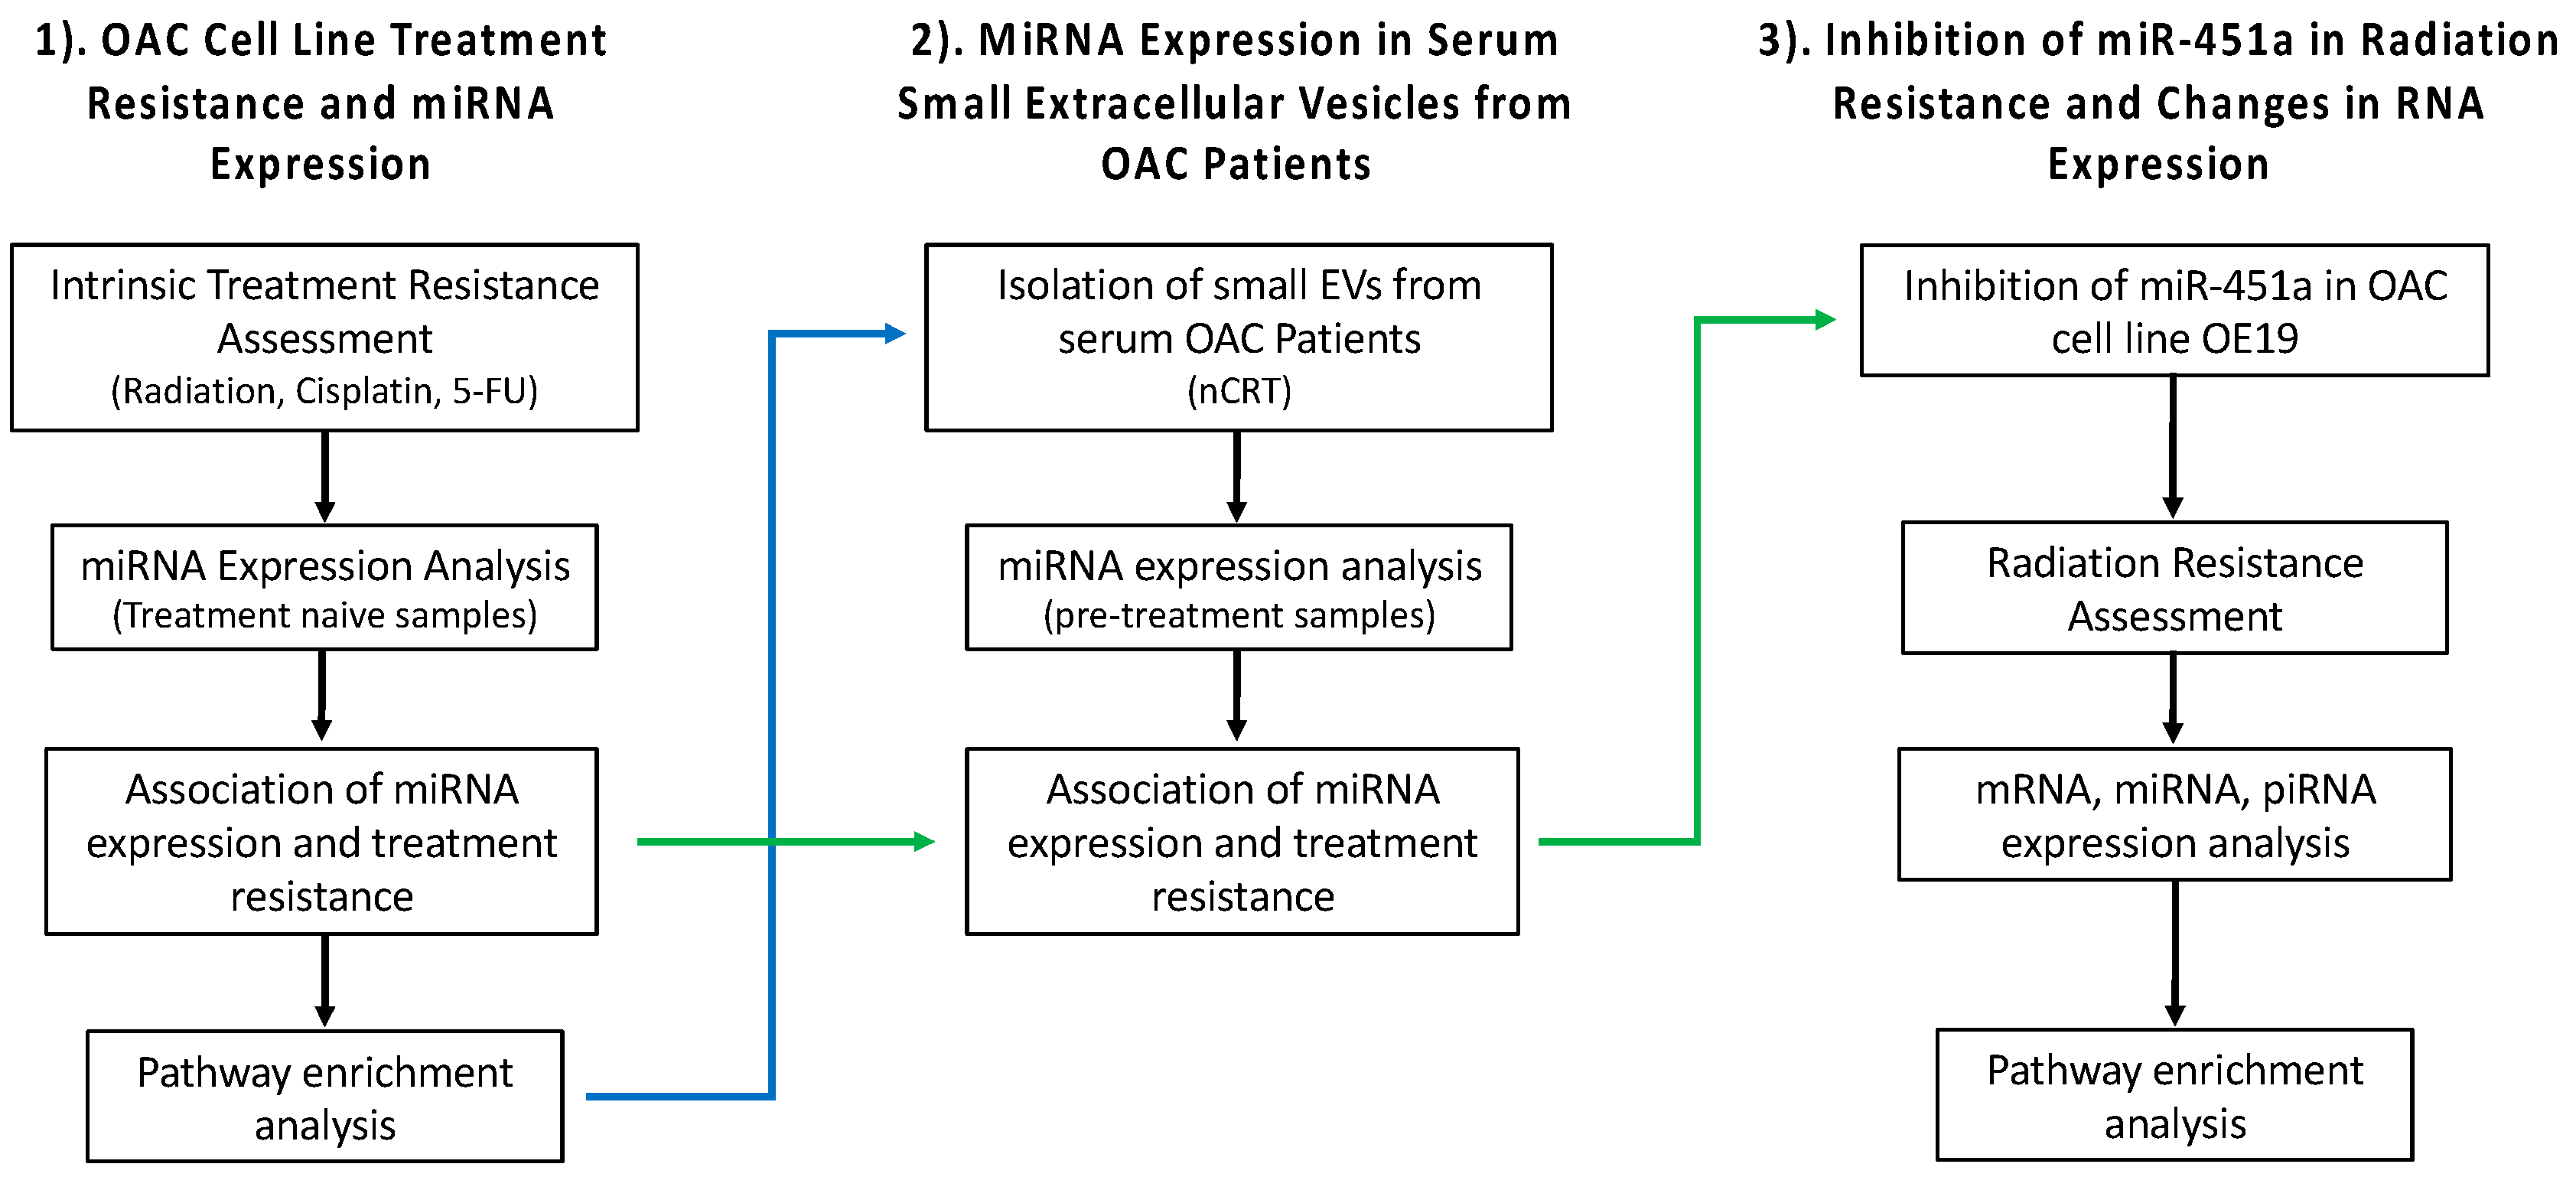
2. Results
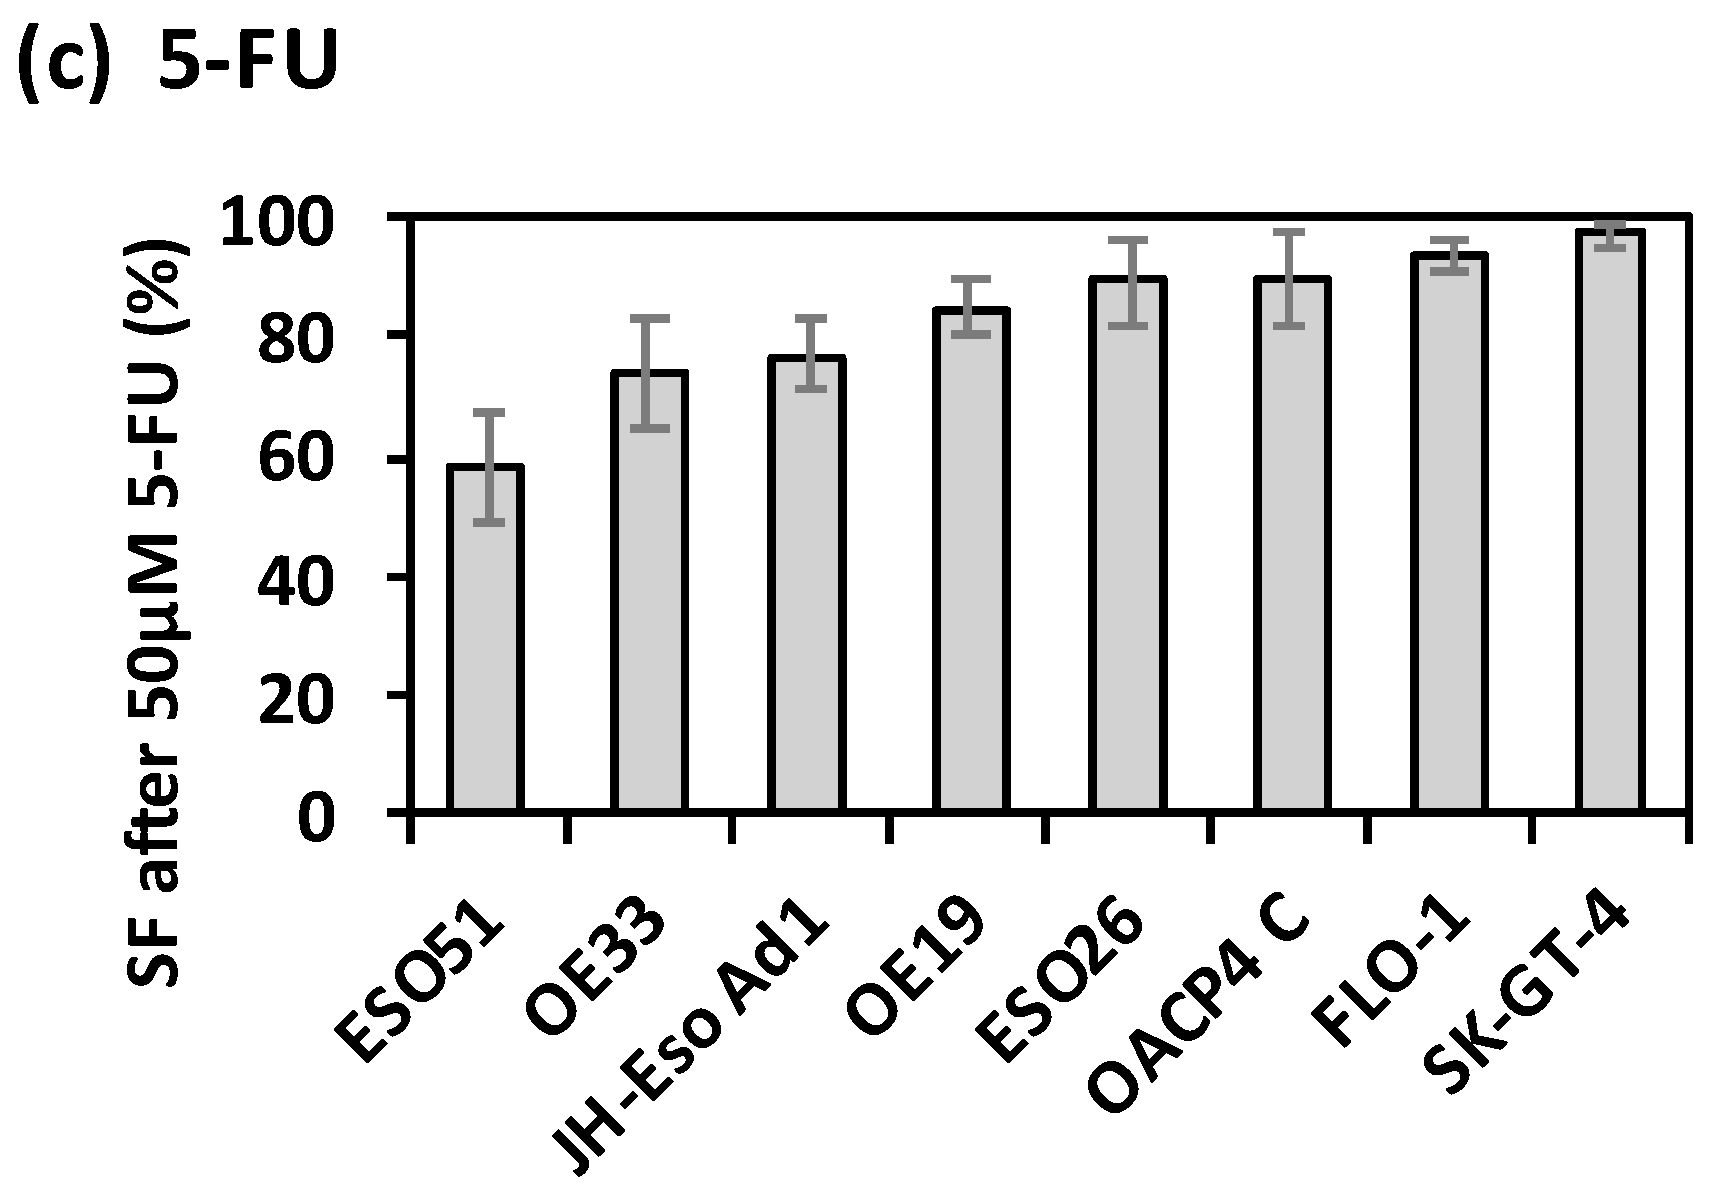
2.1. Intrinsic Therapy Resistance in OAC Cell Lines
2.2. Association of miRNA Expression with Treatment Resistance in OAC Cell Lines
2.3. Association of MiRNA Expression with Treatment Resistance in OAC Cell Lines
2.4. miRNAs Unique to Each Treatment, and miRNAs Common to More Than One Treatment
2.5. Pathway Enrichment Analysis for Validated Targets of MiRNAs Associated with Treatment Resistance (In Silico-Analysis)
2.6. Investigation of Serum Small EV Derived MiRNAs From OAC Patients
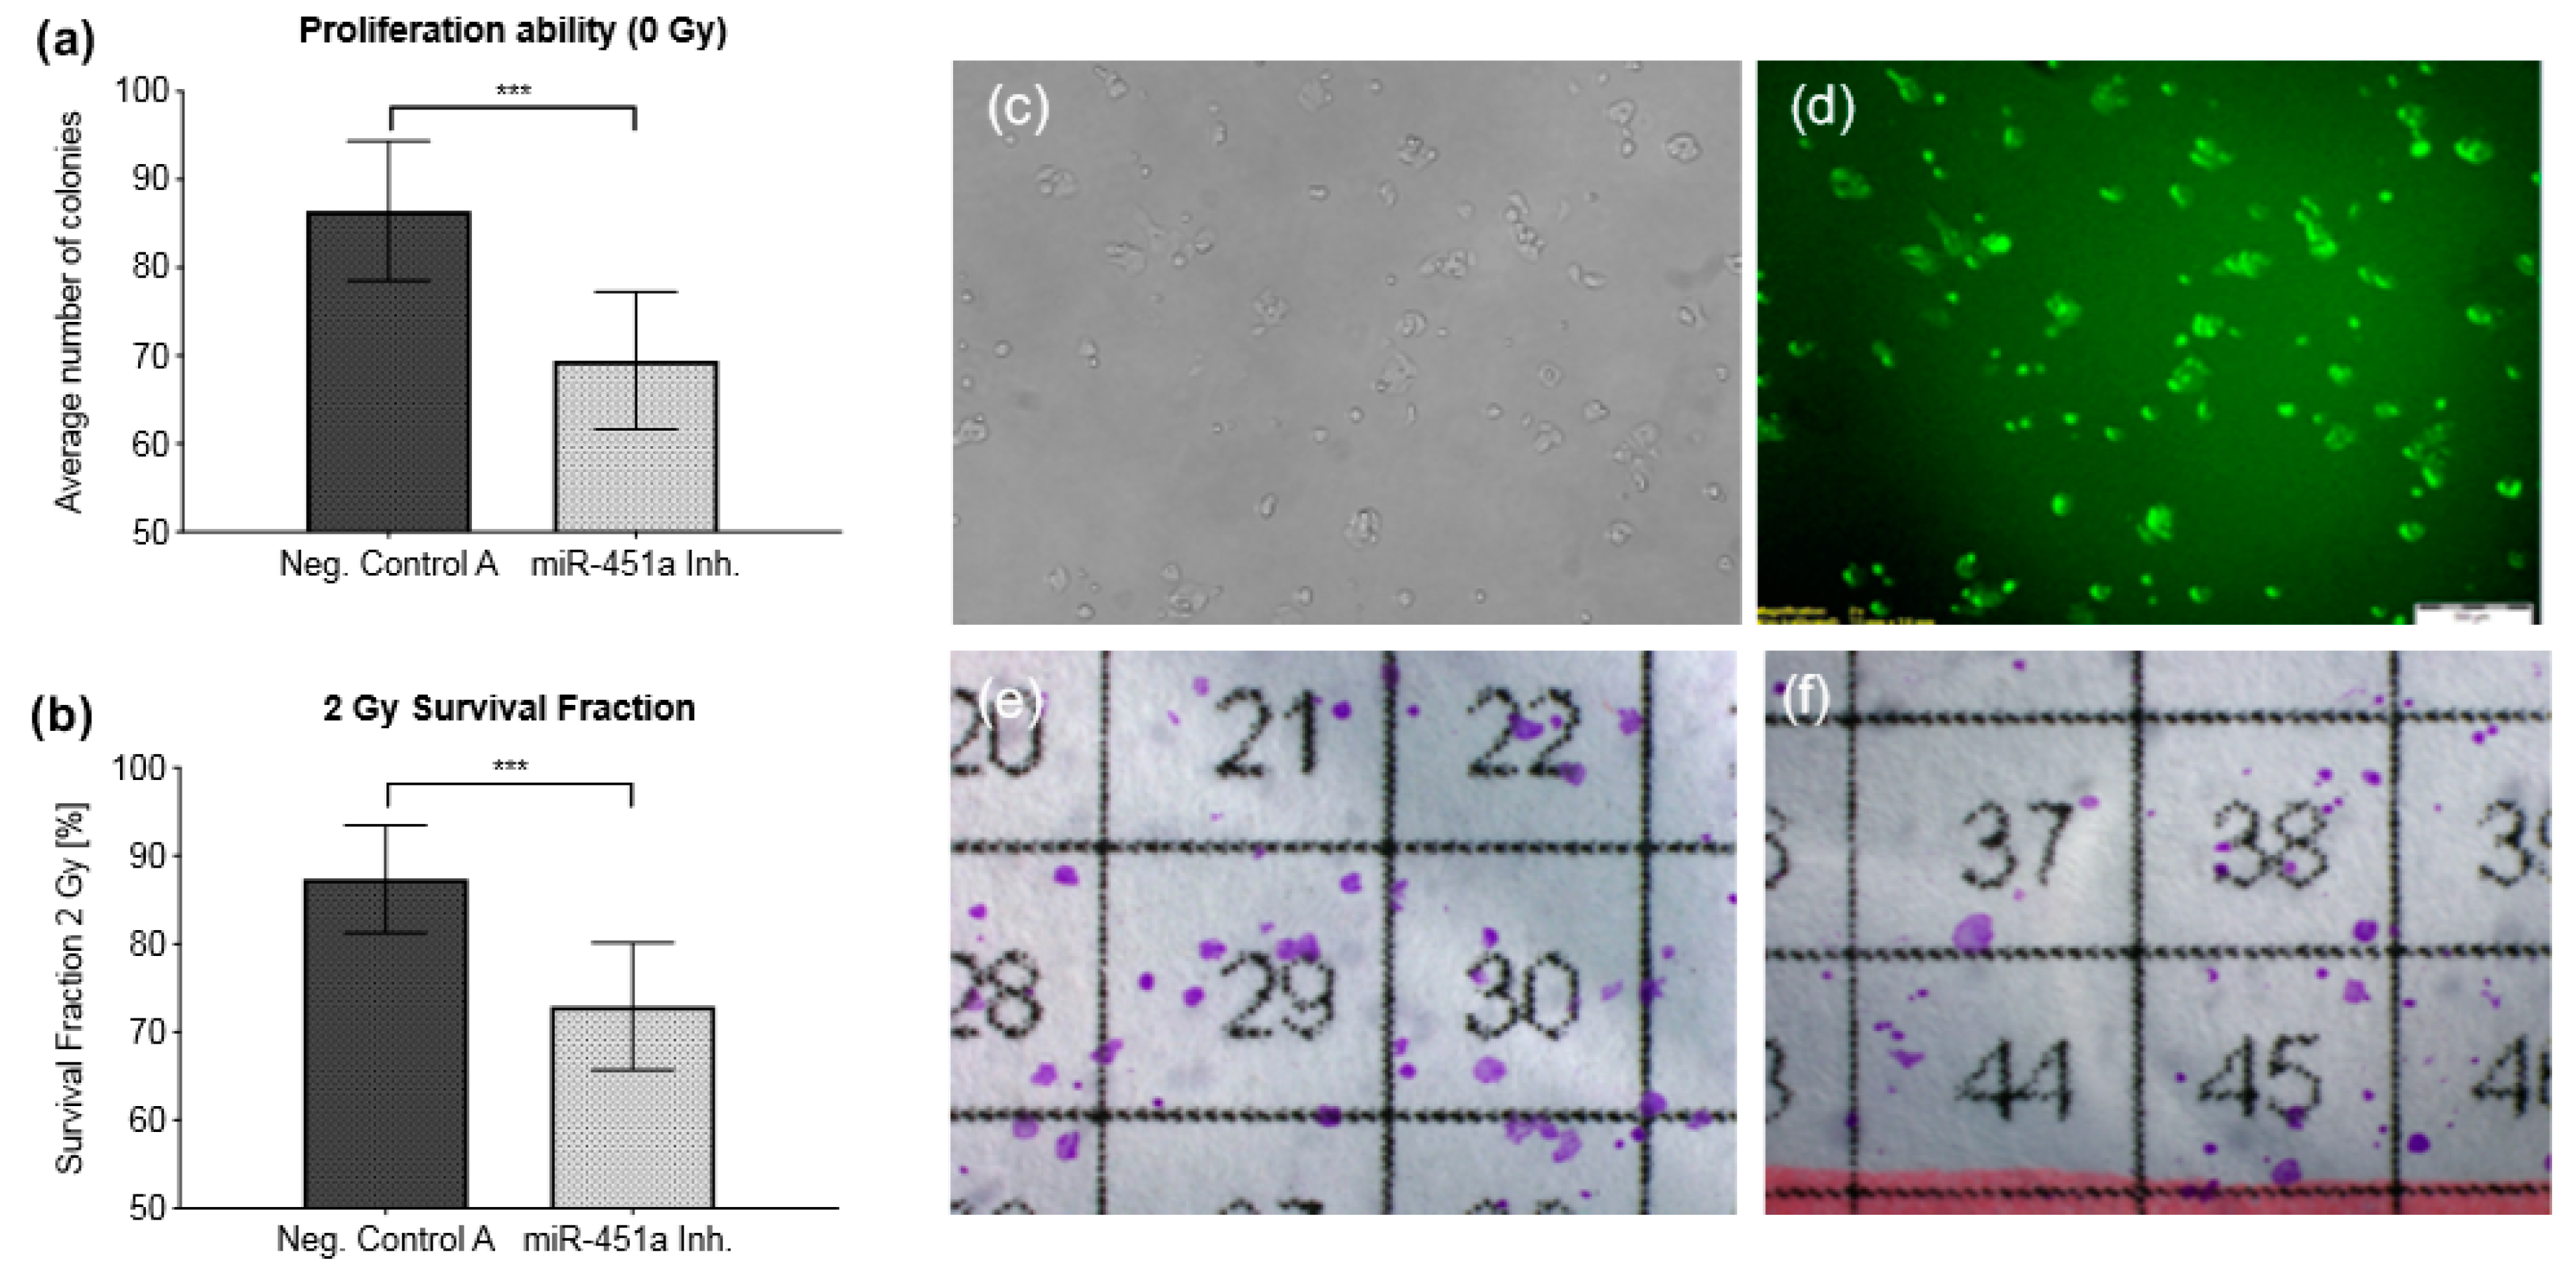
2.7. Inhibition of miR-451a Enhances Radiosensitivity In Vitro
2.8. The Effect of the miR-451a Inhibitor on RNA Expression
2.9. Alterations in mRNA Expression after miR-451a Inhibition
2.10. mRNA Targets of miRNAs and piRNAs after miR-451a Inhibition
3. Discussion
3.1. miRNAs and Radiation Resistance
3.2. miRNAs and Resistance to 5-FU
3.3. miRNAs Associated with Treatment Response to Radiation and Cisplatin
3.4. Let-7d-5p
3.5. Pre-Therapy Serum Small EV miRNAs
3.6. Inhibition of miR-451a in OE19 Cells
3.7. Limitations
4. Conclusions
5. Materials and Methods
5.1. Cell Culture
5.2. Irradiation
5.3. Chemotherapy Treatment.
5.4. Clonogenic Assay
5.5. Soft Agar Clonogenic Assay
5.6. Apoptosis Assay
5.7. Inhibition of miR-451a in OE19
5.8. RNA Isolation from OAC Cell Lines
5.9. TaqMan OpenArray® miRNA Profiling
5.10. Analysis of OpenArray® real-time PCR Assay Data
5.11. Selection of Housekeeping Genes
5.12. Differential Expression Analyses
5.13. Biological Pathway Enrichment Analysis of miRNAs Correlating with the Different Treatment Modalities
5.14. Patient Selection and Tumour Response Classification
5.15. Blood Collection
5.16. Extracellular Vesicle Isolation
5.17. RNA Extraction from Serum Small Extracellular Vesicles
5.18. Qiagen Next Generation Sequencing of miRNA
5.19. miR-451a Inhibition Cell Line Experiments—RNA Sequencing
5.20. miRNA-mRNA and piRNA-mRNA Interactions, and Pathway Analyses
Supplementary Materials
Author Contributions
Funding
Acknowledgments
Conflicts of Interest
Data Availability
Abbreviations
| 5-FU | 5-Fluorouracil |
| AJCC | American Joint Committee on Cancer |
| ALA | Alpha-linolenic acid |
| bp | Base pairs |
| cDNA | Complementary DNA |
| CSS | Charcoal-stripped bovine serum |
| Ct | Cycle threshold |
| DB | Database |
| DE | Differential expression |
| efp | estrogen-responsive finger protein |
| EV | Extracellular vesicle |
| FBS | Foetal bovine serum |
| FDR | False discovery rate |
| g | Gravity |
| GEO | Gene Expression Omnibus |
| GI50 | 50% Cell growth inhibition |
| GSEA | Gene Set Enrichment Analysis |
| Gy | Gray |
| HKG | Housekeeping gene |
| HNRNPC | Heterogeneous nuclear ribonucleoprotein C |
| HVL | Half Value Layer |
| Inh. | Inhibitor |
| INOH | Integrating Network Objects with Hierarchies database |
| IPEMB | Institute of Physics and Engineering in Medicine and Biology |
| KEGG | Kyoto Encyclopedia of Genes and Genomes |
| kVp | Peak kilovoltage |
| LD50 | Lethal Dose 50% |
| LPE | Lysophosphatidylethanolamine |
| mA | Miliampere |
| miRNA | MicroRNA |
| miRTarBase | Database of miRNA-Target interactions |
| mRNA | Messenger RNA |
| mutp53 | Mutated p53 |
| MWU | Mann Whitney U test |
| nCRT | Neoadjuvant chemoradiotherapy |
| NGS | Next generation sequencing |
| OAC | Oesophageal Adenocarcinoma |
| OSCC | Oesophageal squamous cell carcinoma |
| OXPHOS | Oxidative phosphorylation |
| PBS | Phosphate buffered saline |
| PE | Plating efficiency |
| PI | PhosphatidylinositolPropidium iodide |
| PID | Pathway Interaction Database |
| piRNA | PIWI-interacting RNA |
| PPAR | Peroxisome proliferator-activated receptor |
| Pten | Phosphatase and Tensin homolog |
| QC | Quality control |
| qPCR | Quantitative polymerase chain reaction |
| RNA | Ribonucleic acid |
| RP | Ribosomal protein |
| RPMI | Roswell Park Memorial Institute medium |
| RT | Reverse transcription |
| SD | Standard Deviation |
| SF | Survival fraction |
| SSD | Source to skin distance |
| TMM | Trimmed mean of M values |
| TP53 | Tumor protein p53 |
| TRG | Tumor Regression Grade |
| UV | Ultraviolet |
| V-FITC | V-Fluorescein isothiocyanate |
References
- Arnold, M.; Laversanne, M.; Brown, L.M.; Devesa, S.S.; Bray, F. Predicting the future burden of esophageal cancer by histological subtype: International trends in incidence up to 2030. Am. J. Gastroenterol. 2017, 112, 1247–1255. [Google Scholar] [CrossRef]
- Rice, T.W.; Gress, D.M.; Patil, D.T.; Hofstetter, W.L.; Kelsen, D.P.; Blackstone, E.H. Cancer of the esophagus and esophagogastric junction-Major changes in the American Joint Committee on Cancer eighth edition cancer staging manual. CA Cancer J. Clin. 2017, 67, 304–317. [Google Scholar] [CrossRef]
- Sjoquist, K.M.; Burmeister, B.H.; Smithers, B.M.; Zalcberg, J.R.; Simes, R.J.; Barbour, A.; Gebski, V. Australasian Gastro-Intestinal Trials Group. Survival after neoadjuvant chemotherapy or chemoradiotherapy for resectable oesophageal carcinoma: An updated meta-analysis. Lancet Oncol. 2011, 12, 681–692. [Google Scholar] [CrossRef]
- Dittrick, G.W.; Weber, J.M.; Shridhar, R.; Hoffe, S.; Melis, M.; Almhanna, K.; Barthel, J.; McLoughlin, J.; Karl, R.C.; Meredith, K.L. Pathologic nonresponders after neoadjuvant chemoradiation for esophageal cancer demonstrate no survival benefit compared with patients treated with primary esophagectomy. Ann. Surg. Oncol. 2012, 19, 1678–1684. [Google Scholar] [CrossRef]
- Meredith, K.L.; Weber, J.M.; Turaga, K.K.; Siegel, E.M.; McLoughlin, J.; Hoffe, S.; Marcovalerio, M.; Shah, N.; Kelley, S.; Karl, R. Pathologic response after neoadjuvant therapy is the major determinant of survival in patients with esophageal cancer. Ann. Surg. Oncol. 2010, 17, 1159–1167. [Google Scholar] [CrossRef]
- Lynam-Lennon, N.; Maher, S.G.; Maguire, A.; Phelan, J.; Muldoon, C.; Reynolds, J.V.; O’Sullivan, J. Altered mitochondrial function and energy metabolism is associated with a radioresistant phenotype in oesophageal adenocarcinoma. PLoS ONE 2014, 9, e100738. [Google Scholar] [CrossRef]
- Lynam-Lennon, N.; Reynolds, J.V.; Pidgeon, G.P.; Lysaght, J.; Marignol, L.; Maher, S.G. Alterations in DNA repair efficiency are involved in the radioresistance of esophageal adenocarcinoma. Radiat. Res. 2010, 174, 703–711. [Google Scholar] [CrossRef]
- Iorio, M.V.; Croce, C.M. microRNA involvement in human cancer. Carcinogenesis 2012, 33, 1126–1133. [Google Scholar] [CrossRef] [Green Version]
- Lynam-Lennon, N.; Bibby, B.A.; Mongan, A.M.; Marignol, L.; Paxton, C.N.; Geiersbach, K.; Bronner, M.P.; O’Sullivan, J.; Reynolds, J.; Maher, S.G. Low miR-187 expression promotes resistance to chemoradiation therapy in vitro and correlates with treatment failure in patients with esophageal adenocarcinoma. Mol. Med. 2016, 22. [Google Scholar] [CrossRef]
- Lynam-Lennon, N.; Heavey, S.; Sommerville, G.; Bibby, B.A.; Ffrench, B.; Quinn, J.; Gasch, C.; O’Leary, J.J.; Gallagher, M.F.; Reynolds, J.V.; et al. MicroRNA-17 is downregulated in esophageal adenocarcinoma cancer stem-like cells and promotes a radioresistant phenotype. Oncotarget 2017, 8, 11400–11413. [Google Scholar] [CrossRef]
- Lynam-Lennon, N.; Reynolds, J.V.; Marignol, L.; Sheils, O.M.; Pidgeon, G.P.; Maher, S.G. MicroRNA-31 modulates tumour sensitivity to radiation in oesophageal adenocarcinoma. J. Mol. Med. 2012, 90, 1449–1458. [Google Scholar] [CrossRef] [PubMed]
- Matuszcak, C.; Lindner, K.; Eichelmann, A.K.; Hussey, D.J.; Haier, J.; Hummel, R. microRNAs: Key regulators of chemotherapy response and metastatic potential via complex control of target pathways in esophageal adenocarcinoma. Surg. Oncol. 2018, 27, 392–401. [Google Scholar] [CrossRef] [Green Version]
- Hashim, A.; Rizzo, F.; Marchese, G.; Ravo, M.; Tarallo, R.; Nassa, G.; Giurato, G.; Santamaria, G.; Cordella, A.; Cantarella, C.; et al. RNA sequencing identifies specific PIWI-interacting small non-coding RNA expression patterns in breast cancer. Oncotarget 2014, 5, 9901–9910. [Google Scholar] [CrossRef] [Green Version]
- Liu, Y.; Dou, M.; Song, X.; Dong, Y.; Liu, S.; Liu, H.; Tao, J.; Li, W.; Yin, X.; Xu, W. The emerging role of the piRNA/piwi complex in cancer. Mol. Cancer 2019, 18, 123. [Google Scholar] [CrossRef] [Green Version]
- Valadi, H.; Ekstrom, K.; Bossios, A.; Sjostrand, M.; Lee, J.J.; Lotvall, J.O. Exosome-mediated transfer of mRNAs and microRNAs is a novel mechanism of genetic exchange between cells. Nat. Cell. Biol. 2007, 9, 654–659. [Google Scholar] [CrossRef] [Green Version]
- Gallo, A.; Tandon, M.; Alevizos, I.; Illei, G.G. The majority of microRNAs detectable in serum and saliva is concentrated in exosomes. PLoS ONE 2012, 7, e30679. [Google Scholar] [CrossRef] [Green Version]
- Azuma, Y.; Yokobori, T.; Mogi, A.; Yajima, T.; Kosaka, T.; Iijima, M.; Shimizu, K.; Shirabe, K.; Kuwano, H. Cancer exosomal microRNAs from gefitinib-resistant lung cancer cells cause therapeutic resistance in gefitinib-sensitive cells. Surg. Today 2020, 50, 1099–1106. [Google Scholar] [CrossRef]
- Wan, F.Z.; Chen, K.H.; Sun, Y.C.; Chen, X.C.; Liang, R.B.; Chen, L.; Zhu, X.D. Exosomes overexpressing miR-34c inhibit malignant behavior and reverse the radioresistance of nasopharyngeal carcinoma. J. Transl. Med. 2020, 18, 12. [Google Scholar] [CrossRef] [Green Version]
- Yuwen, D.; Ma, Y.; Wang, D.; Gao, J.; Li, X.; Xue, W.; Fan, M.; Xu, Q.; Shen, Y.; Shu, Y. Prognostic role of circulating exosomal miR-425-3p for the response of NSCLC to platinum-based chemotherapy. Cancer Epidemiol. Biomark. Prev. 2019, 28, 163–173. [Google Scholar] [CrossRef] [Green Version]
- Yagi, T.; Iinuma, H.; Hayama, T.; Matsuda, K.; Nozawa, K.; Tsukamoto, M.; Shimada, R.; Akahane, T.; Tsuchiya, T.; Ozawa, T.; et al. Plasma exosomal microRNA-125b as a monitoring biomarker of resistance to mFOLFOX6-based chemotherapy in advanced and recurrent colorectal cancer patients. Mol. Clin. Oncol. 2019, 11, 416–424. [Google Scholar] [CrossRef] [Green Version]
- Hummel, R.; Wang, T.; Watson, D.I.; Michael, M.Z.; van der Hoek, M.; Haier, J.; Hussey, D.J. Chemotherapy-induced modification of microRNA expression in esophageal cancer. Oncol. Rep. 2011, 26, 1011–1017. [Google Scholar] [CrossRef] [PubMed]
- Hummel, R.; Watson, D.I.; Smith, C.; Kist, J.; Michael, M.Z.; Haier, J.; Hussey, D.J. Mir-148a improves response to chemotherapy in sensitive and resistant oesophageal adenocarcinoma and squamous cell carcinoma cells. J. Gastrointest. Surg. Off. J. Soc. Surg. Aliment. Tract. 2011, 15, 429–438. [Google Scholar] [CrossRef] [PubMed]
- Eichelmann, A.K.; Matuszcak, C.; Lindner, K.; Haier, J.; Hussey, D.J.; Hummel, R. Complex role of miR-130a-3p and miR-148a-3p balance on drug resistance and tumor biology in esophageal squamous cell carcinoma. Sci. Rep. 2018, 8, 17553. [Google Scholar] [CrossRef] [PubMed]
- Mueller, A.K.; Lindner, K.; Hummel, R.; Haier, J.; Watson, D.I.; Hussey, D.J. MicroRNAs and their impact on radiotherapy for cancer. Radiat. Res. 2016, 185, 668–677. [Google Scholar] [CrossRef] [PubMed] [Green Version]
- Chiam, K.; Mayne, G.C.; Watson, D.I.; Woodman, R.J.; Bright, T.F.; Michael, M.Z.; Karapetis, C.S.; Irvine, T.; Phillips, W.A.; Hummel, R.; et al. Identification of microRNA biomarkers of response to neoadjuvant chemoradiotherapy in esophageal adenocarcinoma using next generation sequencing. Ann. Surg. Oncol. 2018, 25, 2731–2738. [Google Scholar] [CrossRef]
- Shao, C.; Yang, F.; Miao, S.; Liu, W.; Wang, C.; Shu, Y.; Shen, H. Role of hypoxia-induced exosomes in tumor biology. Mol. Cancer 2018, 17, 120. [Google Scholar] [CrossRef]
- Ingenito, F.; Roscigno, G.; Affinito, A.; Nuzzo, S.; Scognamiglio, I.; Quintavalle, C.; Condorelli, G. The role of Exo-miRNAs in cancer: A focus on therapeutic and diagnostic applications. Int. J. Mol. Sci. 2019, 20, 4687. [Google Scholar] [CrossRef] [Green Version]
- Chiam, K.; Mayne, G.C.; Wang, T.; Watson, D.I.; Irvine, T.S.; Bright, T.; Smith, L.T.; Ball, I.A.; Bowen, J.M.; Keefe, D.M.; et al. Serum outperforms plasma in small extracellular vesicle microRNA biomarker studies of adenocarcinoma of the esophagus. World J. Gastroenterol. 2020, 26, 2570–2583. [Google Scholar] [CrossRef]
- Münch, S.; Pigorsch, S.U.; Feith, M.; Slotta-Huspenina, J.; Weichert, W.; Friess, H.; Combs, S.E.; Habermehl, D. Comparison of neoadjuvant chemoradiation with carboplatin/paclitaxel or cisplatin/5-fluoruracil in patients with squamous cell carcinoma of the esophagus. Radiat. Oncol. 2017, 12, 182. [Google Scholar] [CrossRef] [Green Version]
- Chiam, K.; Wang, T.; Watson, D.I.; Mayne, G.C.; Irvine, T.S.; Bright, T.; Smith, L.; White, I.A.; Bowen, J.M.; Keefe, D.; et al. Circulating serum exosomal miRNAs as potential biomarkers for esophageal adenocarcinoma. J. Gastrointest. Surg. Off. J. Soc. Surg. Aliment. Tract. 2015, 19, 1208–1215. [Google Scholar] [CrossRef] [Green Version]
- Haley, B.; Paunesku, T.; Protic, M.; Woloschak, G.E. Response of heterogeneous ribonuclear proteins (hnRNP) to ionising radiation and their involvement in DNA damage repair. Int. J. Radiat. Biol. 2009, 85, 643–655. [Google Scholar] [CrossRef] [Green Version]
- Chaudhry, M.A.; Sachdeva, H.; Omaruddin, R.A. Radiation-induced micro-RNA modulation in glioblastoma cells differing in DNA-repair pathways. DNA Cell Biol. 2010, 29, 553–561. [Google Scholar] [CrossRef]
- Son, J.C.; Jeong, H.O.; Park, D.; No, S.G.; Lee, E.K.; Lee, J.; Chung, H.Y. miR-10a and miR-204 as a potential prognostic indicator in low-grade gliomas. Cancer Inform. 2017, 16. [Google Scholar] [CrossRef] [Green Version]
- Skinner, H.D.; Lee, J.H.; Bhutani, M.S.; Weston, B.; Hofstetter, W.; Komaki, R.; Shiozaki, H.; Wadhwa, R.; Sudo, K.; Elimova, E.; et al. A validated miRNA profile predicts response to therapy in esophageal adenocarcinoma. Cancer 2014, 120, 3635–3641. [Google Scholar] [CrossRef]
- Zhang, C.; Kang, C.; Wang, P.; Cao, Y.; Lv, Z.; Yu, S.; Wang, G.; Zhang, A.; Jia, Z.; Han, L.; et al. MicroRNA-221 and -222 regulate radiation sensitivity by targeting the PTEN pathway. Int. J. Radiat. Oncol. Biol. Phys. 2011, 80, 240–248. [Google Scholar] [CrossRef]
- Zhang, L.; He, L.; Zhang, H.; Chen, Y. Knockdown of MiR-20a enhances sensitivity of colorectal cancer cells to cisplatin by increasing ASK1 expression. Cell. Physiol. Biochem. Int. J. Exp. Cell. Physiol. Biochem. Pharmcol. 2018, 47, 1432–1441. [Google Scholar] [CrossRef]
- Li, B.; Wang, W.; Li, Z.; Chen, Z.; Zhi, X.; Xu, J.; Li, Q.; Wang, L.; Huang, X.; Wang, L.; et al. MicroRNA-148a-3p enhances cisplatin cytotoxicity in gastric cancer through mitochondrial fission induction and cyto-protective autophagy suppression. Cancer Lett. 2017, 410, 212–227. [Google Scholar] [CrossRef]
- Jeong, S.H.; Wu, H.G.; Park, W.Y. LIN28B confers radio-resistance through the posttranscriptional control of KRAS. Exp. Mol. Med. 2009, 41, 912–918. [Google Scholar] [CrossRef]
- Zhang, X.; Huang, L.; Zhao, Y.; Tan, W. Downregulation of miR-130a contributes to cisplatin resistance in ovarian cancer cells by targeting X-linked inhibitor of apoptosis (XIAP) directly. Acta Biochim. Biophys. Sin. 2013, 45, 995–1001. [Google Scholar] [CrossRef] [Green Version]
- De Both, N.J.; Wijnhoven, B.P.; Sleddens, H.F.; Tilanus, H.W.; Dinjens, W.N. Establishment of cell lines from adenocarcinomas of the esophagus and gastric cardia growing in vivo and in vitro. Virchows Arch. Int. J. Pathol. 2001, 438, 451–456. [Google Scholar] [CrossRef] [Green Version]
- Lindner, K.; Eichelmann, A.K.; Matuszcak, C.; Hussey, D.J.; Haier, J.; Hummel, R. Complex epigenetic regulation of chemotherapy resistance and biohlogy in esophageal squamous cell carcinoma via MicroRNAs. Int. J. Mol. Sci. 2018, 19, 499. [Google Scholar] [CrossRef] [PubMed] [Green Version]
- Luo, Z.; Zhang, M.; Cui, R.; Tili, E.; Kim, T.; Lee, T.J.; Peng, Y.; Croce, C. A negative feedback regulatory loop between miR-138 and TP53 is mediated by USP10. Oncotarget 2019, 10, 6288–6296. [Google Scholar] [CrossRef] [PubMed]
- Dulak, A.M.; Stojanov, P.; Peng, S.; Lawrence, M.S.; Fox, C.; Stewart, C.; Bandla, S.; Imamura, Y.; Schumacher, S.E.; Shefler, E.; et al. Exome and whole-genome sequencing of esophageal adenocarcinoma identifies recurrent driver events and mutational complexity. Nat. Genet. 2013, 45, 478–486. [Google Scholar] [CrossRef]
- Boonstra, J.J.; van Marion, R.; Beer, D.G.; Lin, L.; Chaves, P.; Ribeiro, C.; Pereira, A.D.; Roque, L.; Darnton, S.J.; Altorki, N.K.; et al. Verification and unmasking of widely used human esophageal adenocarcinoma cell lines. J. Natl. Cancer Inst. 2010, 102, 271–274. [Google Scholar] [CrossRef]
- Molinari, C.; Salvi, S.; Foca, F.; Teodorani, N.; Saragoni, L.; Puccetti, M.; Passardi, A.; Tamberi, S.; Avanzolini, A.; Lucci, E.; et al. miR-17-92a-1 cluster host gene (MIR17HG) evaluation and response to neoadjuvant chemoradiotherapy in rectal cancer. Oncotargets Ther. 2016, 9, 2735–2742. [Google Scholar]
- Fan, B.; Shen, C.; Wu, M.; Zhao, J.; Guo, Q.; Luo, Y. miR-17-92 cluster is connected with disease progression and oxaliplatin/capecitabine chemotherapy efficacy in advanced gastric cancer patients: A preliminary study. Medicine 2018, 97, e12007. [Google Scholar] [CrossRef]
- Hotchi, M.; Shimada, M.; Kurita, N.; Iwata, T.; Sato, H.; Morimoto, S.; Yoshikawa, K.; Higashijima, J.; Miyatani, T. microRNA expression is able to predict response to chemoradiotherapy in rectal cancer. Mol. Clin. Oncol. 2013, 1, 137–142. [Google Scholar] [CrossRef] [Green Version]
- Kral, J.; Korenkova, V.; Novosadova, V.; Langerova, L.; Schneiderova, M.; Liska, V.; Levy, M.; Veskrnova, V.; Spicak, J.; Opattova, A.; et al. Expression profile of miR-17/92 cluster is predictive of treatment response in rectal cancer. Carcinogenesis 2018, 39, 1359–1367. [Google Scholar] [CrossRef]
- Xu, X.L.; Jiang, Y.H.; Feng, J.G.; Su, D.; Chen, P.C.; Mao, W.M. MicroRNA-17, microRNA-18a, and microRNA-19a are prognostic indicators in esophageal squamous cell carcinoma. Ann. Thorac. Surg. 2014, 97, 1037–1045. [Google Scholar] [CrossRef]
- Boyerinas, B.; Park, S.M.; Hau, A.; Murmann, A.E.; Peter, M.E. The role of let-7 in cell differentiation and cancer. Endocr. Relat. Cancer 2010, 17, 19–36. [Google Scholar] [CrossRef]
- Chen, Y.N.; Ren, C.C.; Yang, L.; Nai, M.M.; Xu, Y.M.; Zhang, F.; Liu, Y. MicroRNA let7d5p rescues ovarian cancer cell apoptosis and restores chemosensitivity by regulating the p53 signaling pathway via HMGA1. Int. J. Oncol. 2019, 54, 1771–1784. [Google Scholar]
- Chang, C.J.; Hsu, C.C.; Chang, C.H.; Tsai, L.L.; Chang, Y.C.; Lu, S.W.; Yu, C.H.; Huang, H.S.; Wang, J.J.; Tsai, C.H.; et al. Let-7d functions as novel regulator of epithelial-mesenchymal transition and chemoresistant property in oral cancer. Oncol. Rep. 2011, 26, 1003–1010. [Google Scholar]
- Lamperska, K.M.; Kolenda, T.; Teresiak, A.; Kowalik, A.; Kruszyna-Mochalska, M.; Jackowiak, W.; Blizniak, R.; Przybyla, W.; Kapalczynska, M.; Kozlowski, P. Different levels of let-7d expression modulate response of FaDu cells to irradiation and chemotherapeutics. PLoS ONE 2017, 12, e0180265. [Google Scholar] [CrossRef]
- Due, S.L.; Watson, D.I.; Bastian, I.; Ding, G.Q.; Sukocheva, O.A.; Astill, D.S.; Vat, L.; Hussey, D.J. Tamoxifen enhances the cytotoxicity of conventional chemotherapy in esophageal adenocarcinoma cells. Surg. Oncol. 2016, 25, 269–277. [Google Scholar] [CrossRef]
- Zaal, E.A.; Berkers, C.R. The influence of metabolism on drug response in cancer. Front. Oncol. 2018, 8, 500. [Google Scholar] [CrossRef]
- Troschel, F.M.; Bohly, N.; Borrmann, K.; Braun, T.; Schwickert, A.; Kiesel, L.; Eich, H.T.; Gotte, M.; Greve, B. miR-142-3p attenuates breast cancer stem cell characteristics and decreases radioresistance in vitro. Tumor Biol. 2018, 40. [Google Scholar] [CrossRef] [Green Version]
- Liu, X.; Cai, H.; Sheng, W.; Huang, H.; Long, Z.; Wang, Y. microRNAs expression profile related with response to preoperative radiochemotherapy in patients with locally advanced gastric cancer. BMC Cancer 2018, 18, 1048. [Google Scholar] [CrossRef] [PubMed]
- Nakagawa, Y.; Kuranaga, Y.; Tahara, T.; Yamashita, H.; Shibata, T.; Nagasaka, M.; Funasaka, K.; Ohmiya, N.; Akao, Y. Induced miR-31 by 5-fluorouracil exposure contributes to the resistance in colorectal tumors. Cancer Sci. 2019, 110, 2540–2548. [Google Scholar] [CrossRef] [PubMed]
- Yang, C.; Pan, Y.; Deng, S.P. Downregulation of lncRNA CCAT1 enhances 5-fluorouracil sensitivity in human colon cancer cells. BMC Mol. Cell. Biol. 2019, 20, 9. [Google Scholar] [CrossRef] [PubMed]
- Ren, T.J.; Liu, C.; Hou, J.F.; Shan, F.X. CircDDX17 reduces 5-fluorouracil resistance and hinders tumorigenesis in colorectal cancer by regulating miR-31-5p/KANK1 axis. Eur. Rev. Med. Pharm. Sci. 2020, 24, 1743–1754. [Google Scholar]
- Khordadmehr, M.; Jigari-Asl, F.; Ezzati, H.; Shahbazi, R.; Sadreddini, S.; Safaei, S.; Baradaran, B. A comprehensive review on miR-451: A promising cancer biomarker with therapeutic potential. J. Cell Physiol. 2019, 234, 21716–21731. [Google Scholar] [CrossRef] [PubMed]
- Bai, H.; Wu, S. miR-451a: A Novel Biomarker and Potential Therapeutic Target for Cancer. OncoTargets Ther. 2019, 12, 11069–11082. [Google Scholar] [CrossRef] [PubMed] [Green Version]
- Khazaei, S.; Nouraee, N.; Moradi, A.; Mowla, S.J. A novel signaling role for miR-451 in esophageal tumor microenvironment and its contribution to tumor progression. Clin. Transl. Oncol. 2017, 19, 633–640. [Google Scholar] [CrossRef] [PubMed]
- Liu, J.S.; Du, J.; Cheng, X.; Zhang, X.Z.; Li, Y.; Chen, X.L. Exosomal miR-451 from human umbilical cord mesenchymal stem cells attenuates burn-induced acute lung injury. J. Chin. Med. Assoc. 2019, 82, 895–901. [Google Scholar] [CrossRef]
- Peng, Q.; Shen, Y.; Lin, K.; Zou, L.; Shen, Y.; Zhu, Y. Identification of microRNA-92a and the related combination biomarkers as promising substrates in predicting risk, recurrence and poor survival of colorectal cancer. J. Cancer 2019, 10, 3154–3171. [Google Scholar] [CrossRef] [PubMed] [Green Version]
- Kowalski-Chauvel, A.; Modesto, A.; Gouaze-Andersson, V.; Baricault, L.; Gilhodes, J.; Delmas, C.; Lemarie, A.; Toulas, C.; Cohen-Jonathan-Moyal, E.; Seva, C. Alpha-6 integrin promotes radioresistance of glioblastoma by modulating DNA damage response and the transcription factor Zeb1. Cell Death Dis. 2018, 9, 872. [Google Scholar] [CrossRef] [PubMed]
- Hehlgans, S.; Haase, M.; Cordes, N. Signalling via integrins: Implications for cell survival and anticancer strategies. Biochim. Biophys. Acta 2007, 1775, 163–180. [Google Scholar] [CrossRef] [PubMed]
- Hu, T.; Zhou, R.; Zhao, Y.; Wu, G. Integrin alpha6/Akt/Erk signaling is essential for human breast cancer resistance to radiotherapy. Sci. Rep. 2016, 6, 33376. [Google Scholar] [CrossRef] [PubMed]
- Zhan, N.; Li, B.; Xu, X.; Xu, J.; Hu, S. Inhibition of FASN expression enhances radiosensitivity in human non-small cell lung cancer. Oncol. Lett. 2018, 15, 4578–4584. [Google Scholar] [CrossRef] [PubMed] [Green Version]
- Yang, Y.; Liu, H.; Li, Z.; Zhao, Z.; Yip-Schneider, M.; Fan, Q.; Schmidt, C.M.; Chiorean, E.G.; Xie, J.; Cheng, L.; et al. Role of fatty acid synthase in gemcitabine and radiation resistance of pancreatic cancers. Int. J. Biochem. Mol. Biol. 2011, 2, 89–98. [Google Scholar]
- Kawaguchi, T.; Kato, S.; Otsuka, K.; Watanabe, G.; Kumabe, T.; Tominaga, T.; Yoshimoto, T.; Ishioka, C. The relationship among p53 oligomer formation, structure and transcriptional activity using a comprehensive missense mutation library. Oncogene 2005, 24, 6976–6981. [Google Scholar] [CrossRef] [PubMed] [Green Version]
- Shen, Y.; Liu, S.; Fan, J.; Jin, Y.; Tian, B.; Zheng, X.; Fu, H. Nuclear retention of the lncRNA SNHG1 by doxorubicin attenuates hnRNPC-p53 protein interactions. EMBO Rep. 2017, 18, 536–548. [Google Scholar] [CrossRef] [PubMed] [Green Version]
- Walerych, D.; Napoli, M.; Collavin, L.; Del Sal, G. The rebel angel: Mutant p53 as the driving oncogene in breast cancer. Carcinogenesis 2012, 33, 2007–2017. [Google Scholar] [CrossRef] [PubMed] [Green Version]
- Amin, M.B.; Edge, S.; Greene, F.; Byrd, D.R.; Brookland, R.K.; Washington, M.K.; Gershenwald, J.E.; Compton, C.C.; Hess, K.R.; Sullivan, D.C.; et al. AJCC Cancer Staging Manual, 8th ed.; Springer International Publishing: New York, NY, USA, 2017. [Google Scholar]
- Xu, X.; Xiong, X.; Sun, Y. The role of ribosomal proteins in the regulation of cell proliferation, tumorigenesis, and genomic integrity. Sci. China Life Sci. 2016, 59, 656–672. [Google Scholar] [CrossRef]
- Wang, A.; Xu, S.; Zhang, X.; He, J.; Yan, D.; Yang, Z.; Xiao, S. Ribosomal protein RPL41 induces rapid degradation of ATF4, a transcription factor critical for tumour cell survival in stress. J. Pathol. 2011, 225, 285–292. [Google Scholar] [CrossRef] [PubMed]
- Lee, J.H.; Kim, J.M.; Kim, M.S.; Lee, Y.T.; Marshak, D.R.; Bae, Y.S. The highly basic ribosomal protein L41 interacts with the beta subunit of protein kinase CKII and stimulates phosphorylation of DNA topoisomerase IIalpha by CKII. Biochem. Biophys. Res. Commun. 1997, 238, 462–467. [Google Scholar] [CrossRef] [PubMed]
- Terry, S.Y.; Riches, A.C.; Bryant, P.E. Suppression of topoisomerase IIalpha expression and function in human cells decreases chromosomal radiosensitivity. Mutat. Res. 2009, 663, 40–45. [Google Scholar] [CrossRef]
- Yoshida, G.J. Metabolic reprogramming: The emerging concept and associated therapeutic strategies. J. Exp. Clin. Cancer Res. CR 2015, 34, 111. [Google Scholar] [CrossRef] [Green Version]
- Richardson, R.B.; Harper, M.E. Mitochondrial stress controls the radiosensitivity of the oxygen effect: Implications for radiotherapy. Oncotarget 2016, 7, 21469–21483. [Google Scholar] [CrossRef] [Green Version]
- Pavlova, N.N.; Thompson, C.B. The Emerging Hallmarks of Cancer Metabolism. Cell Metab. 2016, 23, 27–47. [Google Scholar] [CrossRef] [Green Version]
- Tang, L.; Wei, F.; Wu, Y.; He, Y.; Shi, L.; Xiong, F.; Gong, Z.; Guo, C.; Li, X.; Deng, H.; et al. Role of metabolism in cancer cell radioresistance and radiosensitization methods. J. Exp. Clin. Cancer Res. 2018, 37, 87. [Google Scholar] [CrossRef]
- Cruz-Gregorio, A.; Martinez-Ramirez, I.; Pedraza-Chaverri, J.; Lizano, M. Reprogramming of energy metabolism in response to radiotherapy in head and neck squamous cell carcinoma. Cancers 2019, 11, 182. [Google Scholar] [CrossRef] [Green Version]
- Cheng, C.; Geng, F.; Cheng, X.; Guo, D. Lipid metabolism reprogramming and its potential targets in cancer. Cancer Commun. 2018, 38, 27. [Google Scholar] [CrossRef]
- Munir, R.; Lisec, J.; Swinnen, J.V.; Zaidi, N. Lipid metabolism in cancer cells under metabolic stress. Br. J. Cancer 2019, 120, 1090–1098. [Google Scholar] [CrossRef]
- Buckley, A.M.; Dunne, M.R.; Lynam-Lennon, N.; Kennedy, S.A.; Cannon, A.; Reynolds, A.L.; Maher, S.G.; Reynolds, J.V.; Kennedy, B.N.; O’Sullivan, J. Pyrazinib (P3), [(E)-2-(2-Pyrazin-2-yl-vinyl)-phenol], a small molecule pyrazine compound enhances radiosensitivity in oesophageal adenocarcinoma. Cancer Lett. 2019, 447, 115–129. [Google Scholar] [CrossRef]
- Godlewski, J.; Nowicki, M.O.; Bronisz, A.; Nuovo, G.; Palatini, J.; De Lay, M.; Van Brocklyn, J.; Ostrowski, M.C.; Chiocca, E.A.; Lawler, S.E. MicroRNA-451 regulates LKB1/AMPK signaling and allows adaptation to metabolic stress in glioma cells. Mol. Cell 2010, 37, 620–632. [Google Scholar] [CrossRef] [Green Version]
- Tian, Y.; Nan, Y.; Han, L.; Zhang, A.; Wang, G.; Jia, Z.; Hao, J.; Pu, P.; Zhong, Y.; Kang, C. MicroRNA miR-451 downregulates the PI3K/AKT pathway through CAB39 in human glioma. Int. J. Oncol. 2012, 40, 1105–1112. [Google Scholar]
- Wanigasooriya, K.; Tyler, R.; Barros-Silva, J.D.; Sinha, Y.; Ismail, T.; Beggs, A.D. Radiosensitising Cancer Using Phosphatidylinositol-3-Kinase (PI3K), Protein Kinase B (AKT) or Mammalian Target of Rapamycin (mTOR) Inhibitors. Cancers (Basel) 2020, 12, 1278. [Google Scholar] [CrossRef]
- Siomi, M.C.; Sato, K.; Pezic, D.; Aravin, A.A. PIWI-interacting small RNAs: The vanguard of genome defence. Nat. Rev. Mol. Cell Biol. 2011, 12, 246–258. [Google Scholar] [CrossRef]
- Martinez, V.D.; Vucic, E.A.; Thu, K.L.; Hubaux, R.; Enfield, K.S.; Pikor, L.A.; Becker-Santos, D.D.; Brown, C.J.; Lam, S.; Lam, W.L. Unique somatic and malignant expression patterns implicate PIWI-interacting RNAs in cancer-type specific biology. Sci. Rep. 2015, 5, 10423. [Google Scholar] [CrossRef]
- Martinez, V.D.; Firmino, N.S.; Marshall, E.A.; Ng, K.W.; Wadsworth, B.J.; Anderson, C.; Lam, W.L.; Bennewith, K.L. Non-coding RNAs predict recurrence-free survival of patients with hypoxic tumours. Sci. Rep. 2018, 8, 152. [Google Scholar] [CrossRef]
- Aukett, R.J.; Burns, J.E.; Greener, A.G.; Harrison, R.M.; Moretti, C.; Nahum, A.E.; Rosser, K.E. Addendum to the IPEMB code of practice for the determination of absorbed dose for x-rays below 300 kV generating potential (0.035 mm Al-4 mm Cu HVL). Phys. Med. Biol. 2005, 50, 2739–2748. [Google Scholar] [CrossRef] [PubMed]
- Aukett, R.J.; Thomas, D.W.; Seaby, A.W.; Gittins, J.T. Performance characteristics of the Pantak DXT-300 kilovoltage X-ray treatment machine. Br. J. Radiol. 1996, 69, 726–734. [Google Scholar] [CrossRef] [PubMed]
- Liu, D.S.; Read, M.; Cullinane, C.; Azar, W.J.; Fennell, C.M.; Montgomery, K.G.; Haupt, S.; Haupt, Y.; Wiman, K.G.; Duong, C.P.; et al. APR-246 potently inhibits tumour growth and overcomes chemoresistance in preclinical models of oesophageal adenocarcinoma. Gut 2015, 64, 1506–1516. [Google Scholar] [CrossRef] [PubMed]
- Bianchi, F.; Nicassio, F.; Marzi, M.; Belloni, E.; Dall’olio, V.; Bernard, L.; Pelosi, G.; Maisonneuve, P.; Veronesi, G.; Di Fiore, P.P. A serum circulating miRNA diagnostic test to identify asymptomatic high-risk individuals with early stage lung cancer. EMBO Mol. Med. 2011, 3, 495–503. [Google Scholar] [CrossRef]
- Storey, J.D. A direct approach to false discovery rates. J. R. Stat. Soc. Ser. B (Stat. Methodol.) 2002, 64, 479–498. [Google Scholar] [CrossRef] [Green Version]
- Chou, C.H.; Shrestha, S.; Yang, C.D.; Chang, N.W.; Lin, Y.L.; Liao, K.W.; Huang, W.C.; Sun, T.H.; Tu, S.J.; Lee, W.H.; et al. miRTarBase update 2018: A resource for experimentally validated microRNA-target interactions. Nucleic Acids Res. 2018, 46, 296–302. [Google Scholar] [CrossRef]
- Huang, H.Y.; Lin, Y.C.; Li, J.; Huang, K.Y.; Shrestha, S.; Hong, H.C.; Tang, Y.; Chen, Y.G.; Jin, C.N.; Yu, Y.; et al. miRTarBase 2020: Updates to the experimentally validated microRNA-target interaction database. Nucleic Acids Res. 2020, 48, 148–154. [Google Scholar] [CrossRef] [Green Version]
- Breuer, K.; Foroushani, A.K.; Laird, M.R.; Chen, C.; Sribnaia, A.; Lo, R.; Winsor, G.L.; Hancock, R.E.; Brinkman, F.S.; Lynn, D.J. InnateDB: Systems biology of innate immunity and beyond--recent updates and continuing curation. Nucleic Acids Res. 2013, 41, 1228–1233. [Google Scholar] [CrossRef]
- Kim, S.H.; Chang, H.J.; Kim, D.Y.; Park, J.W.; Baek, J.Y.; Kim, S.Y.; Park, S.C.; Oh, J.H.; Yu, A.; Nam, B.H. What Is the Ideal Tumor Regression Grading System in Rectal Cancer Patients after Preoperative Chemoradiotherapy? Cancer Res. Treat. Off. J. Korean Cancer Assoc. 2016, 48, 998–1009. [Google Scholar] [CrossRef] [Green Version]
- Langer, R.; Becker, K. Tumor regression grading of gastrointestinal cancers after neoadjuvant therapy. Virchows Arch. Int. J. Pathol. 2018, 472, 175–186. [Google Scholar] [CrossRef] [PubMed]
- Théry, C.; Witwer, K.W.; Aikawa, E.; Alcaraz, M.J.; Anderson, J.D.; Andriantsitohaina, R.; Antoniou, A.; Arab, T.; Archer, F.; Atkin-Smith, G.K.; et al. Minimal information for studies of extracellular vesicles 2018 (MISEV2018): A position statement of the International Society for Extracellular Vesicles and update of the MISEV2014 guidelines. J. Extracell. Vesicles 2018, 7, 1535750. [Google Scholar] [CrossRef] [PubMed] [Green Version]
- Andrews, S. FastQC: A Quality Control Tool for High Throughput Sequence Data. 2012. Available online: http://www.bioinformatics.babraham.ac.uk/projects/fastqc (accessed on 24 November 2020).
- Martin, M. Cutadapt removes adapter sequences from high-throughput sequencing reads. EMBnet J. 2011, 17, 3. [Google Scholar] [CrossRef]
- Langmead, B.; Trapnell, C.; Pop, M.; Salzberg, S.L. Ultrafast and memory-efficient alignment of short DNA sequences to the human genome. Genome Biol. 2009, 10, 25. [Google Scholar] [CrossRef] [PubMed] [Green Version]
- Dobin, A.; Davis, C.A.; Schlesinger, F.; Drenkow, J.; Zaleski, C.; Jha, S.; Batut, P.; Chaisson, M.; Gingeras, T.R. STAR: Ultrafast universal RNA-seq aligner. Bioinformatics 2012, 29, 15–21. [Google Scholar] [CrossRef]
- Risso, D.; Schwartz, K.; Sherlock, G.; Dudoit, S. GC-content normalization for RNA-Seq data. BMC Bioinform. 2011, 12, 480. [Google Scholar] [CrossRef] [Green Version]
- Love, M.I.; Huber, W.; Anders, S. Moderated estimation of fold change and dispersion for RNA-seq data with DESeq2. Genome Biol. 2014, 15, 550. [Google Scholar] [CrossRef] [Green Version]


| Radiation Cell Lines miRNAs (FDR = 17%) | Differential Expression (Sensitive/Resistant) | t-Test p-Value | Spearman Correlation Coefficient | Spearman Correlation p-Value |
|---|---|---|---|---|
| hsa-miR-17-5p | 0.244 | 0.0001 | 0.933 | 0.0000 |
| hsa-miR-16-5p | 0.313 | 0.0003 | 0.848 | 0.0003 |
| hsa-miR-106a-5p | 0.227 | 0.0004 | 0.933 | 0.0000 |
| hsa-miR-532-5p | 0.673 | 0.0013 | 0.580 | 0.0441 |
| hsa-let-7g-5p | 0.573 | 0.0014 | 0.891 | 0.0000 |
| hsa-miR-194-5p | 0.008 | 0.0019 | 0.523 | 0.0762 |
| hsa-miR-451a | 0.003 | 0.0023 | 0.757 | 0.0033 |
| hsa-miR-744-5p | 0.534 | 0.0039 | 0.763 | 0.0028 |
| hsa-miR-92a-3p | 0.203 | 0.0039 | 0.905 | 0.0000 |
| hsa-miR-18a-5p | 0.286 | 0.0049 | 0.905 | 0.0000 |
| hsa-miR-20a-5p | 0.265 | 0.0066 | 0.891 | 0.0000 |
| hsa-miR-574-3p | 0.616 | 0.0096 | 0.565 | 0.0510 |
| hsa-miR-30d-5p | 0.387 | 0.0133 | 0.721 | 0.0065 |
| hsa-miR-30a-5p | 0.412 | 0.0163 | 0.848 | 0.0003 |
| hsa-miR-27a-3p | 2.335 | 0.0173 | −0.466 | 0.1213 |
| hsa-miR-660-5p | 0.506 | 0.0187 | 0.594 | 0.0379 |
| hsa-miR-19b-3p | 0.362 | 0.0210 | 0.848 | 0.0003 |
| hsa-miR-15b-5p | 0.534 | 0.0306 | 0.608 | 0.0323 |
| hsa-miR-20b-5p | 0.340 | 0.0314 | 0.693 | 0.0103 |
| hsa-miR-142-3p | 0.005 | 0.0334 | 0.762 | 0.0029 |
| hsa-let-7d-5p | 0.543 | 0.0379 | 0.786 | 0.0029 |
| hsa-miR-532-3p | 0.531 | 0.0388 | 0.396 | 0.1980 |
| hsa-miR-320a-3p | 0.618 | 0.0419 | 0.622 | 0.0273 |
| hsa-miR-125a-5p | 0.164 | 0.0426 | 0.650 | 0.0191 |
| Cisplatin Cell Lines miRNAs (FDR = 13%) | Differential Expression (Sensitive/Resistant) | t-Test p-Value | Spearman Correlation Coefficient | Spearman Correlation p-Value |
|---|---|---|---|---|
| hsa-miR-18a-5p | 0.27 | 0.0001 | 0.876 | 0.0000 |
| hsa-miR-17-5p | 0.30 | 0.0001 | 0.894 | 0.0000 |
| hsa-miR-145-5p | 0.00 | 0.0002 | 0.791 | 0.0005 |
| hsa-miR-92a-3p | 0.20 | 0.0003 | 0.894 | 0.0000 |
| hsa-miR-106a-5p | 0.29 | 0.0004 | 0.867 | 0.0000 |
| hsa-miR-181a-5p | 0.13 | 0.0009 | 0.550 | 0.0388 |
| hsa-miR-942-5p | 0.47 | 0.0009 | −0.447 | 0.1054 |
| hsa-miR-20a-5p | 0.23 | 0.0012 | 0.925 | 0.0000 |
| hsa-miR-20b-5p | 0.27 | 0.0015 | 0.872 | 0.0000 |
| hsa-miR-99b-5p | 0.15 | 0.0029 | 0.773 | 0.0008 |
| hsa-miR-16-5p | 0.31 | 0.0050 | 0.831 | 0.0001 |
| hsa-miR-19b-3p | 0.24 | 0.0058 | 0.863 | 0.0000 |
| hsa-miR-320a-3p | 1.81 | 0.0059 | 0.456 | 0.0977 |
| hsa-let-7d-5p | 0.61 | 0.0064 | 0.541 | 0.0428 |
| hsa-miR-195-5p | 0.43 | 0.0088 | 0.814 | 0.0003 |
| hsa-let-7e-5p | 0.24 | 0.0106 | 0.545 | 0.0408 |
| hsa-miR-944 | 0.01 | 0.0115 | −0.340 | 0.2314 |
| hsa-miR-744-5p | 0.64 | 0.0159 | 0.697 | 0.0046 |
| hsa-miR-19a-3p | 0.24 | 0.0161 | 0.599 | 0.0213 |
| hsa-miR-142-5p | 0.49 | 0.0203 | 0.720 | 0.0030 |
| hsa-miR-122-5p | 0.49 | 0.0203 | 0.612 | 0.0178 |
| hsa-miR-125a-5p | 0.14 | 0.0205 | 0.688 | 0.0054 |
| hsa-miR-335-5p | 0.27 | 0.0297 | 0.773 | 0.0008 |
| hsa-miR-130b-3p | 1.75 | 0.0395 | 0.308 | 0.2803 |
| hsa-miR-146b-5p | 2.54 | 0.0403 | −0.755 | 0.0013 |
| hsa-miR-190a-5p | 0.27 | 0.0458 | 0.675 | 0.0068 |
| 5-FU Cell Lines miRNAs (FDR = 19%) | Differential Expression (Sensitive/Resistant) | t-Test p-Value | Spearman Correlation Coefficient | Spearman Correlation p-Value |
|---|---|---|---|---|
| hsa-miR-130a-3p | 0.06 | 0.000 | 0.709 | 0.0037 |
| hsa-miR-31-5p | 1311 | 0.001 | −0.868 | 0.0000 |
| hsa-miR-126-3p | 0.24 | 0.001 | 0.673 | 0.0070 |
| hsa-miR-1274B | 0.45 | 0.004 | −0.514 | 0.0569 |
| hsa-miR-328-3p | 0.28 | 0.007 | 0.620 | 0.0160 |
| hsa-let-7d-5p | 0.61 | 0.009 | 0.558 | 0.0353 |
| hsa-miR-23a-5p | 0.25 | 0.011 | 0.753 | 0.0014 |
| hsa-miR-766-3p | 0.46 | 0.012 | 0.549 | 0.0390 |
| hsa-miR-203a-3p | 24.3 | 0.013 | −0.638 | 0.0124 |
| hsa-miR-138-5p | 0.0002 | 0.015 | 0.789 | 0.0006 |
| hsa-miR-152-3p | 0.10 | 0.019 | 0.851 | 0.0001 |
| hsa-miR-28-5p | 2.11 | 0.024 | −0.735 | 0.0021 |
| hsa-miR-30a-5p | 0.52 | 0.027 | −0.408 | 0.1444 |
| hsa-miR-660-5p | 1.68 | 0.030 | −0.620 | 0.0160 |
| hsa-miR-93-5p | 0.43 | 0.034 | −0.434 | 0.1172 |
| hsa-miR-126-5p | 3.15 | 0.034 | 0.399 | 0.1543 |
| hsa-miR-142-3p | 0.00 | 0.038 | −0.416 | 0.1349 |
| hsa-miR-206 | 0.10 | 0.046 | −0.523 | 0.0520 |
| Treatment | Radiation Unique | Cisplatin Unique | 5-FU Unique | Radiation and Cisplatin | Radiation, Cisplatin and 5-FU | |
|---|---|---|---|---|---|---|
| Direction | Increased | Increased | Increased | Decreased | Increased | Increased |
| miRNA | let-7g-5p | miR-195-5p | miR-152-3p | miR-31-5p | miR-17-5p | let-7d-5p |
| miR-451a | miR-145-5p | miR-138-5p | miR-28-5p | miR-20a-5p | ||
| miR-30d-5p | miR-99b-5p | miR-23a-5p | miR-203a-3p | miR-92a-3p | ||
| miR-660-5p | miR-142-5p | miR-130a-3p | miR-660-5p | miR-18a-5p | ||
| miR-532-5p | miR-122-5p | miR-126-3p | miR-20b-5p | |||
| miR-30a-3p | miR-19a-3p | miR-328-3p | miR-106a-5p | |||
| miR-142-3p | miR-181a-5p | miR-766-3p | miR-19b-3p | |||
| miR-190a-5p | miR-16-5p | |||||
| miR-744-5p | ||||||
| miR-125a-5p | ||||||
| Cell Lines Radiation Differential Expression | Cell Lines Radiation p-Value | Cell lines Radiation Increased or Decreased in Poor Responders | OAC Serums Differential Expression | OAC Serums MWU-Test p-Value | OAC Serums Increased or Decreased in Poor Responders | |
|---|---|---|---|---|---|---|
| hsa-miR-17-5p | 0.244 | 0.0001 | increased | 0.75 | 0.360 | decreased |
| hsa-miR-16-5p | 0.313 | 0.0003 | increased | 1.72 | 0.007 | increased |
| hsa-miR-106a-5p | 0.227 | 0.0004 | increased | Infinite | 0.215 | increased |
| hsa-miR-532-5p | 0.673 | 0.0013 | increased | 1.12 | 0.913 | increased |
| hsa-let-7g-5p | 0.573 | 0.0014 | increased | 0.91 | 0.585 | decreased |
| hsa-miR-194-5p | 0.008 | 0.0019 | increased | 1.52 | 0.046 | increased |
| hsa-miR-451a | 0.003 | 0.0023 | increased | 2.05 | 0.020 | increased |
| hsa-miR-744-5p | 0.534 | 0.0039 | increased | 0.85 | 0.443 | decreased |
| hsa-miR-92a-3p | 0.203 | 0.0039 | increased | 1.46 | 0.020 | increased |
| hsa-miR-18a-5p | 0.286 | 0.0049 | increased | Infinite | 0.111 | increased |
| hsa-miR-20a-5p | 0.265 | 0.0066 | increased | 1.24 | 0.443 | increased |
| hsa-miR-574-3p | 0.616 | 0.0096 | increased | 0.71 | 0.110 | decreased |
| hsa-miR-30d-5p | 0.387 | 0.0133 | increased | 1.16 | 0.197 | increased |
| hsa-miR-30a-5p | 0.412 | 0.0163 | increased | 1.31 | 0.585 | increased |
| hsa-miR-27a-3p | 2.335 | 0.0173 | decreased | 1.10 | 0.799 | increased |
| hsa-miR-660-5p | 0.506 | 0.0187 | increased | 1.54 | 0.110 | increased |
| hsa-miR-19b-3p | 0.362 | 0.0210 | increased | 1.26 | 0.046 | increased |
| hsa-miR-15b-5p | 0.534 | 0.0306 | increased | 1.68 | 0.002 | increased |
| hsa-miR-20b-5p | 0.340 | 0.0314 | increased | 1.98 | 0.006 | increased |
| hsa-miR-142-3p | 0.005 | 0.0334 | increased | 0.71 | 0.010 | decreased |
| hsa-let-7d-5p | 0.407 | 0.0379 | increased | 1.27 | 0.172 | increased |
| hsa-miR-532-3p | 0.531 | 0.0388 | increased | 2.27 | 0.010 | increased |
| hsa-miR-320a-3p | 0.618 | 0.0419 | Increased | * excluded | ||
| hsa-miR-125a-5p | 0.164 | 0.0426 | increased | 1.22 | 0.743 | increased |
| hsa-miR-375-3p | 0.006 | 0.0537 | increased | * excluded | ||
| hsa-miR-301a-3p | 0.395 | 0.0555 | increased | * excluded | ||
| hsa-miR-766-3p | 2.502 | 0.0571 | decreased | * excluded | ||
| hsa-miR-146b-5p | 1.598 | 0.0584 | decreased | 0.79 | 0.287 | decreased |
| hsa-miR-146a-5p | 9.365 | 0.0742 | decreased | 0.92 | 0.535 | decreased |
| hsa-let-7e-5p | 0.453 | 0.0754 | increased | 0.78 | 0.172 | decreased |
| hsa-miR-324-3p | 0.473 | 0.0804 | increased | 2.62 | 0.247 | increased |
| hsa-miR-148a-3p | 0.034 | 0.0923 | increased | 0.98 | 0.971 | decreased |
| hsa-miR-335-5p | 0.417 | 0.0978 | increased | 0.67 | 0.031 | decreased |
| Cell lines Cisplatin Differential Expression | Cell Lines Cisplatin p-Value | Cell lines Cisplatin Increased or Decreased in Poor Responders | OAC Serums Differential Expression | OAC Serums MWU-Test p-Value | OAC Serums Increased or Decreased in Poor Responders | |
|---|---|---|---|---|---|---|
| hsa-miR-18a-5p | 0.270 | 0.0001 | increased | Infinite | 0.111 | increased |
| hsa-miR-17-5p | 0.300 | 0.0001 | increased | 0.75 | 0.360 | decreased |
| hsa-miR-145-5p | 0.000 | 0.0002 | increased | 1.02 | 0.636 | increased |
| hsa-miR-92a-3p | 0.200 | 0.0003 | increased | 1.46 | 0.020 | increased |
| hsa-miR-106a-5p | 0.286 | 0.0004 | increased | Infinite | 0.215 | increased |
| hsa-miR-181a-5p | 0.128 | 0.0009 | increased | 1.30 | 0.255 | increased |
| hsa-miR-942-5p | 2.107 | 0.0009 | decreased | 1.50 | 0.443 | increased |
| hsa-miR-20a-5p | 0.232 | 0.0012 | increased | 1.24 | 0.443 | increased |
| hsa-miR-20b-5p | 0.274 | 0.0015 | increased | 1.98 | 0.006 | increased |
| hsa-miR-99b-5p | 0.151 | 0.0029 | increased | 1.04 | 0.913 | increased |
| hsa-miR-16-5p | 0.313 | 0.0050 | increased | 1.72 | 0.007 | increased |
| hsa-miR-19b-3p | 0.236 | 0.0058 | increased | 1.26 | 0.046 | increased |
| hsa-miR-320a-3p | 0.551 | 0.0059 | increased | * excluded | ||
| hsa-let-7d-5p | 0.612 | 0.0064 | increased | 1.27 | 0.172 | increased |
| hsa-miR-195-5p | 0.432 | 0.0088 | increased | 1.10 | 0.535 | increased |
| hsa-let-7e-5p | 0.238 | 0.0106 | increased | 0.78 | 0.172 | decreased |
| hsa-miR-944 | 83.541 | 0.0115 | decreased | * excluded | ||
| hsa-miR-744-5p | 0.640 | 0.0159 | increased | 0.85 | 0.443 | decreased |
| hsa-miR-19a-3p | 0.240 | 0.0161 | increased | 0.98 | 0.689 | decreased |
| hsa-miR-142-5p | 0.488 | 0.0203 | increased | 1.15 | 0.535 | increased |
| hsa-miR-122-5p | 0.488 | 0.0203 | decreased | 0.85 | 0.535 | decreased |
| hsa-miR-125a-5p | 0.141 | 0.0205 | increased | 1.22 | 0.743 | increased |
| hsa-miR-335-5p | 0.272 | 0.0297 | increased | 0.67 | 0.031 | decreased |
| hsa-miR-130b-3p | 0.570 | 0.0395 | increased | 1.27 | 0.287 | increased |
| hsa-miR-146b-5p | 2.538 | 0.0403 | decreased | 0.79 | 0.287 | decreased |
| hsa-miR-190a-5p | 0.272 | 0.0458 | increased | 0.47 | 0.000 | decreased |
| hsa-miR-126-3p | 0.577 | 0.065 | increased | 1.10 | 0.856 | increased |
| hsa-miR-15b-5p | 0.654 | 0.067 | increased | 1.68 | 0.002 | increased |
| hsa-miR-374a-5p | 0.516 | 0.086 | increased | 1.28 | 0.680 | increased |
Publisher’s Note: MDPI stays neutral with regard to jurisdictional claims in published maps and institutional affiliations. |
© 2020 by the authors. Licensee MDPI, Basel, Switzerland. This article is an open access article distributed under the terms and conditions of the Creative Commons Attribution (CC BY) license (http://creativecommons.org/licenses/by/4.0/).
Share and Cite
Butz, F.; Eichelmann, A.-K.; Mayne, G.C.; Wang, T.; Bastian, I.; Chiam, K.; Marri, S.; Sykes, P.J.; Wijnhoven, B.P.; Toxopeus, E.; et al. MicroRNA Profiling in Oesophageal Adenocarcinoma Cell Lines and Patient Serum Samples Reveals a Role for miR-451a in Radiation Resistance. Int. J. Mol. Sci. 2020, 21, 8898. https://doi.org/10.3390/ijms21238898
Butz F, Eichelmann A-K, Mayne GC, Wang T, Bastian I, Chiam K, Marri S, Sykes PJ, Wijnhoven BP, Toxopeus E, et al. MicroRNA Profiling in Oesophageal Adenocarcinoma Cell Lines and Patient Serum Samples Reveals a Role for miR-451a in Radiation Resistance. International Journal of Molecular Sciences. 2020; 21(23):8898. https://doi.org/10.3390/ijms21238898
Chicago/Turabian StyleButz, Frederike, Ann-Kathrin Eichelmann, George C. Mayne, Tingting Wang, Isabell Bastian, Karen Chiam, Shashikanth Marri, Pamela J. Sykes, Bas P. Wijnhoven, Eelke Toxopeus, and et al. 2020. "MicroRNA Profiling in Oesophageal Adenocarcinoma Cell Lines and Patient Serum Samples Reveals a Role for miR-451a in Radiation Resistance" International Journal of Molecular Sciences 21, no. 23: 8898. https://doi.org/10.3390/ijms21238898