Androgen Deprivation Induces Transcriptional Reprogramming in Prostate Cancer Cells to Develop Stem Cell-Like Characteristics


 ,
,
Abstract
:1. Introduction
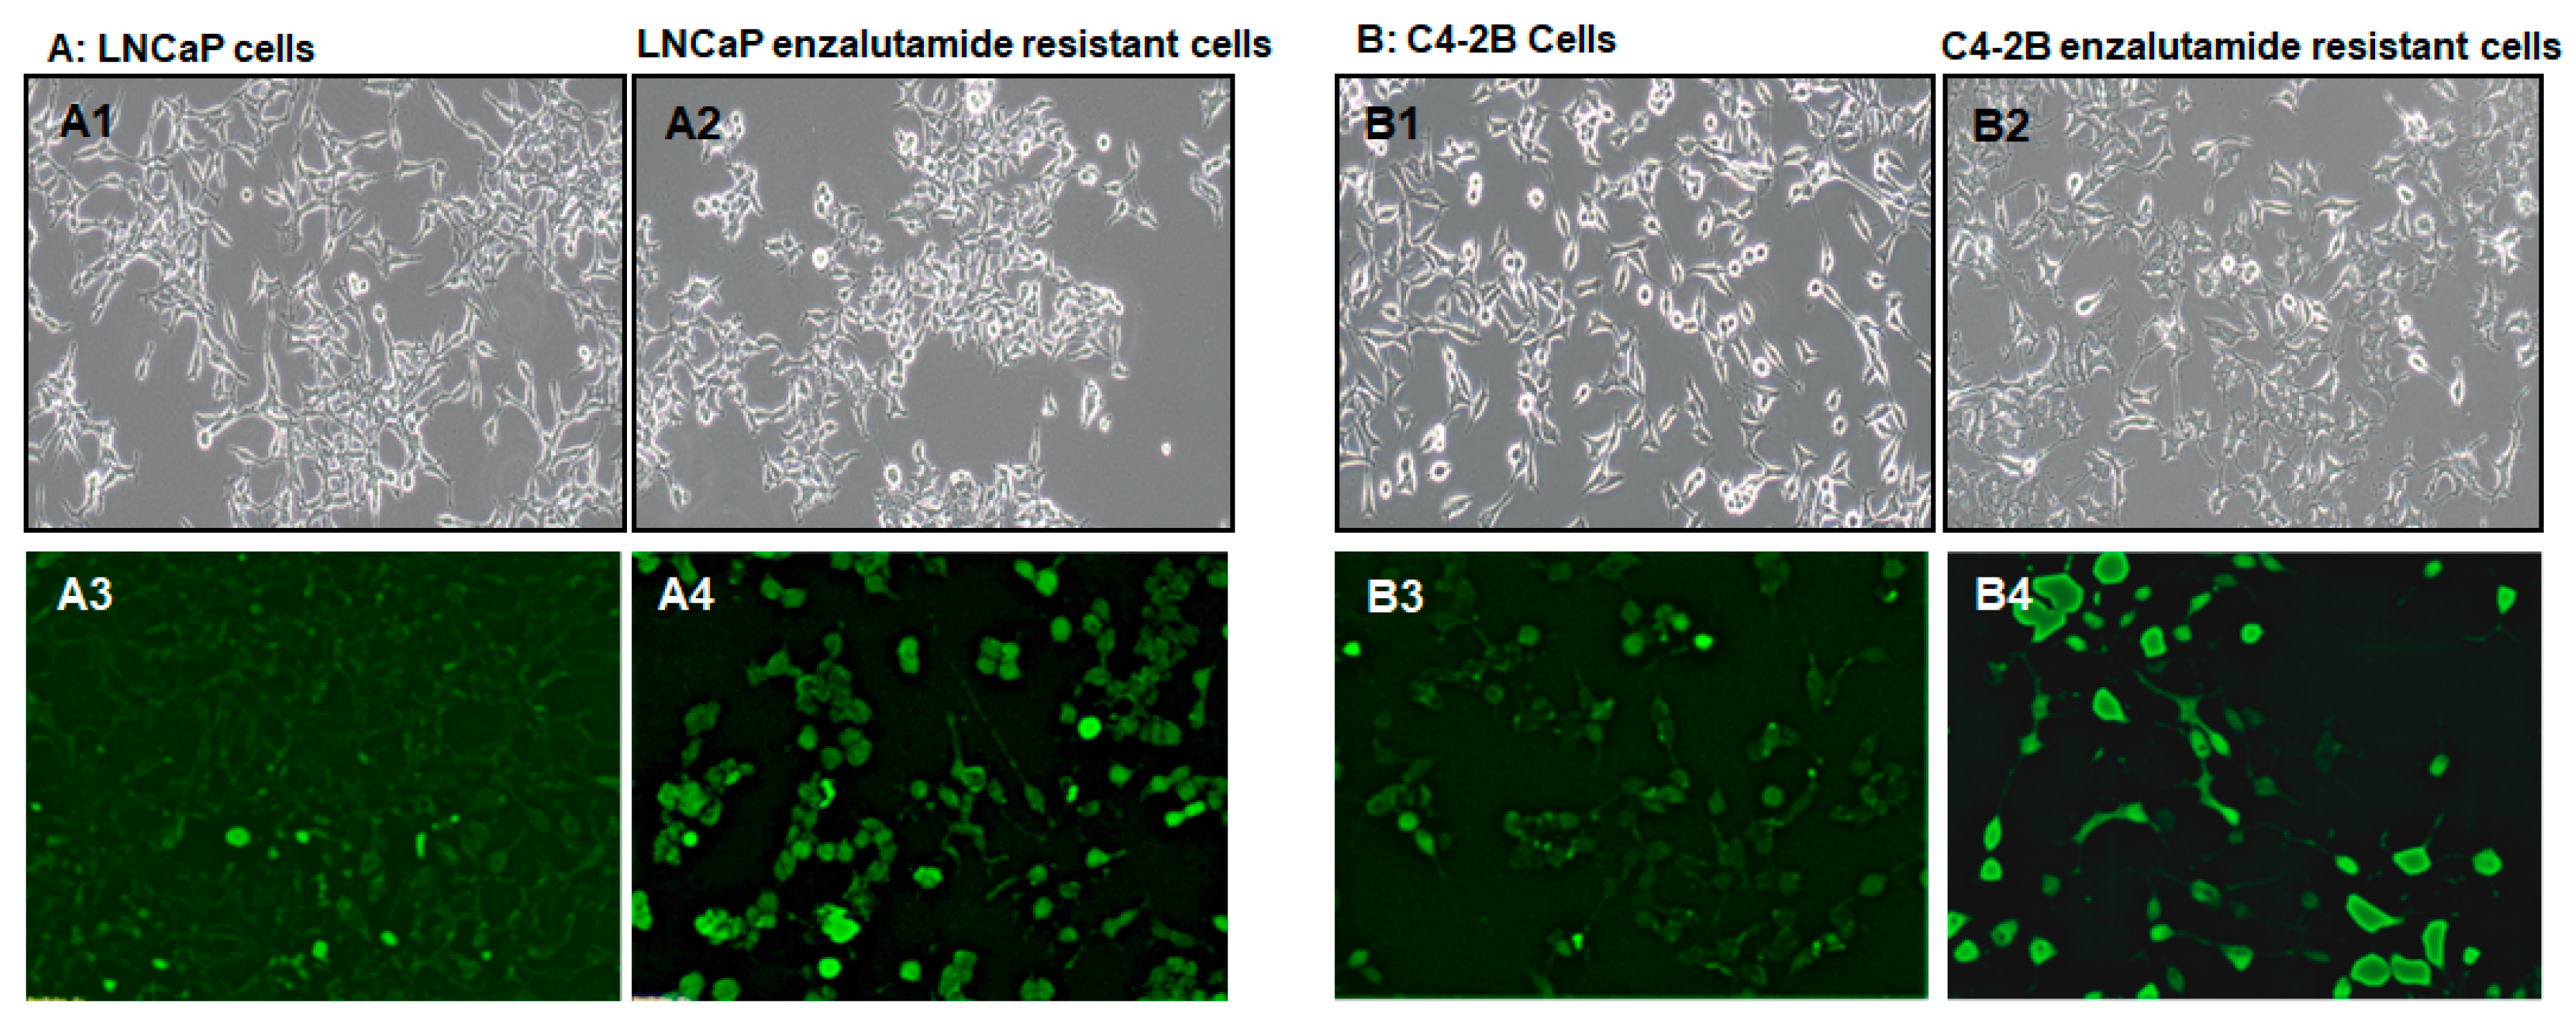
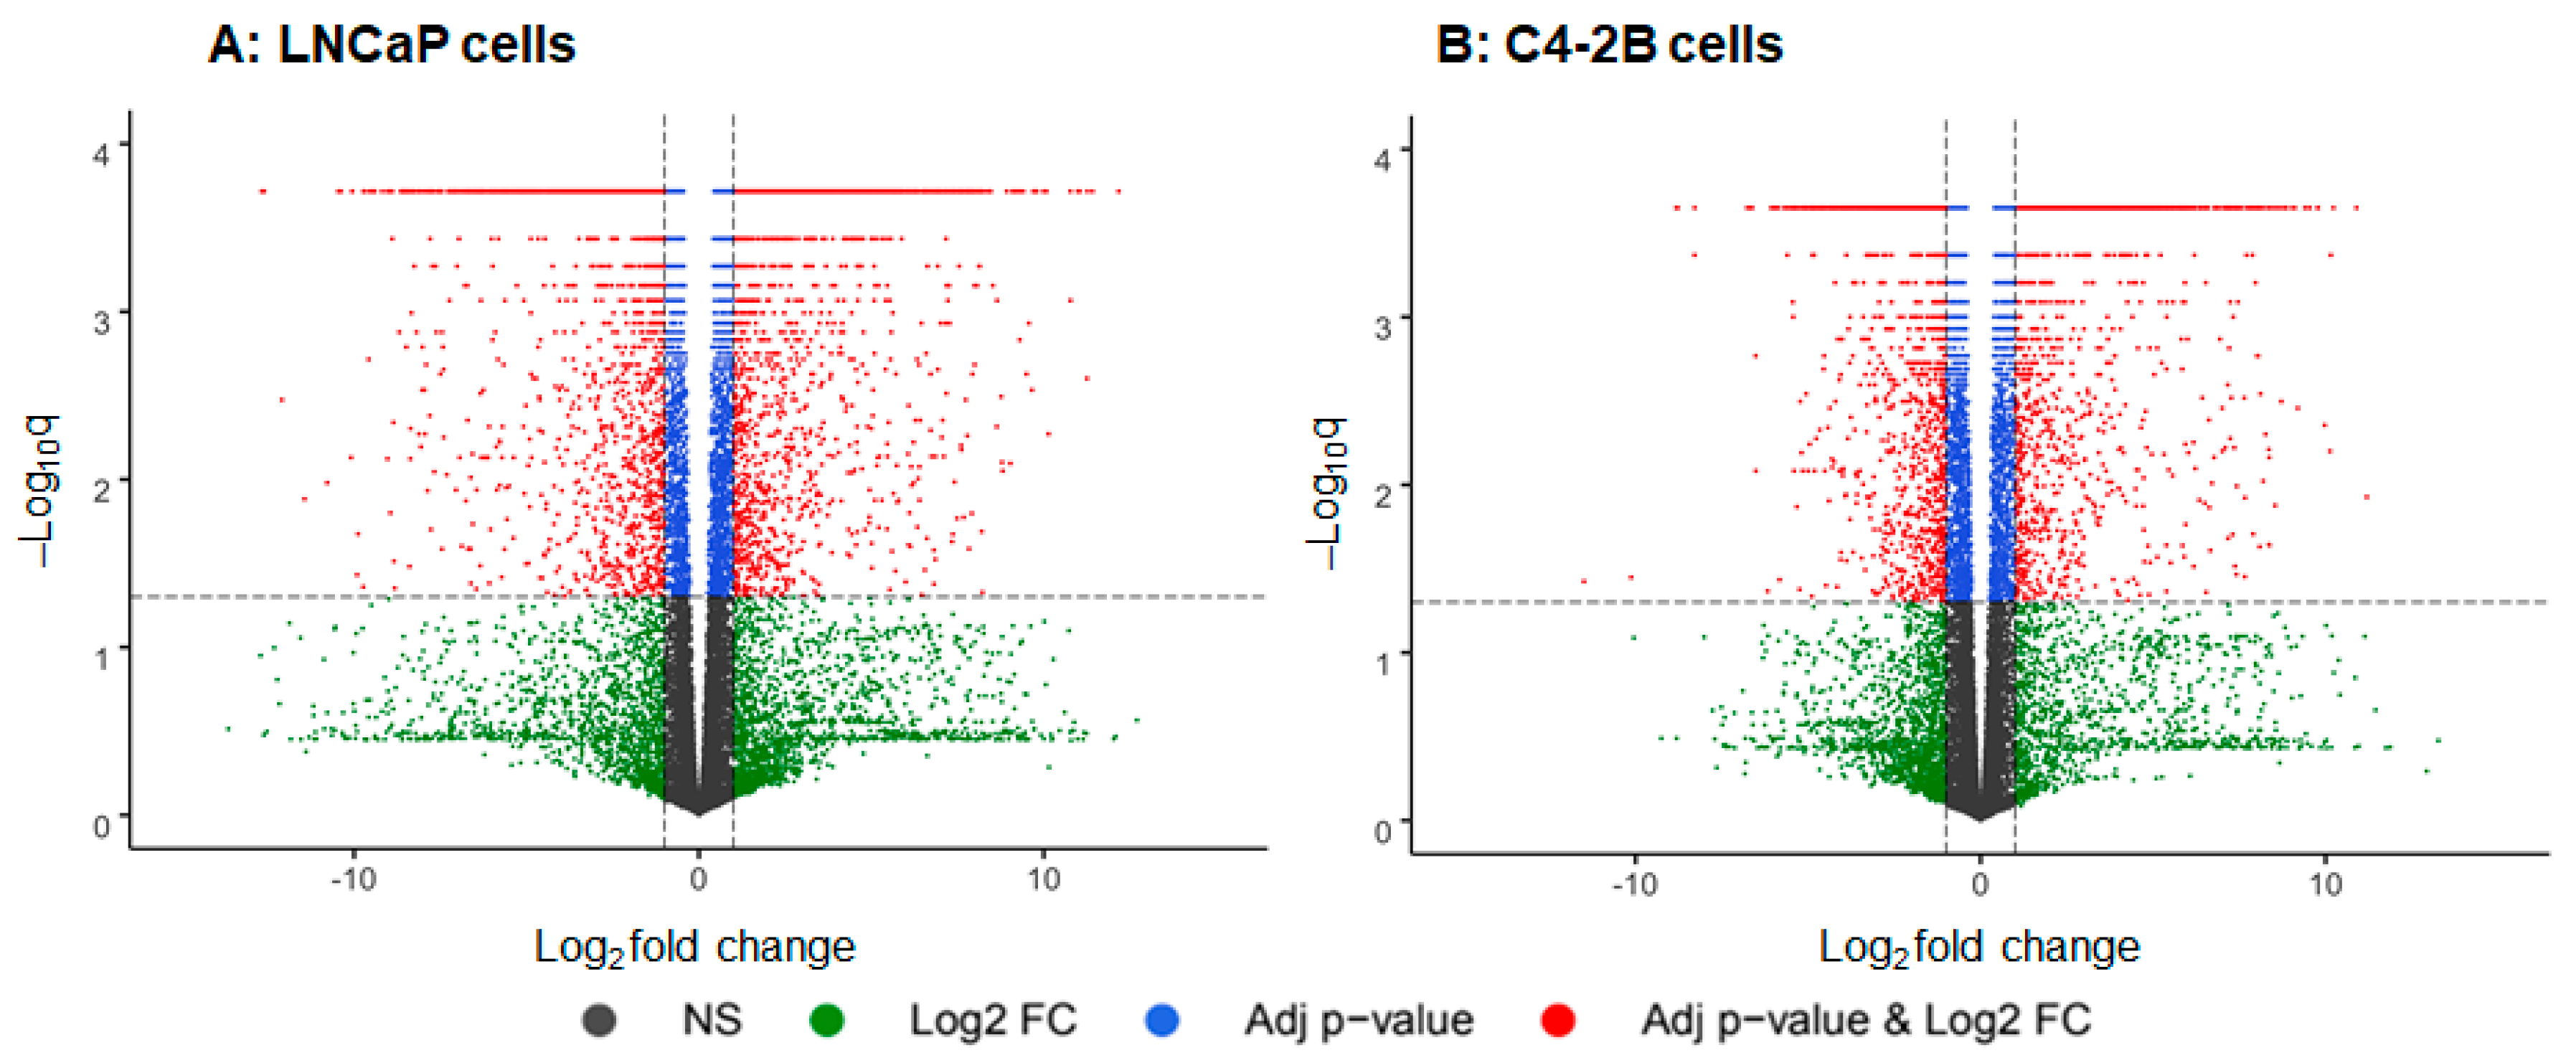
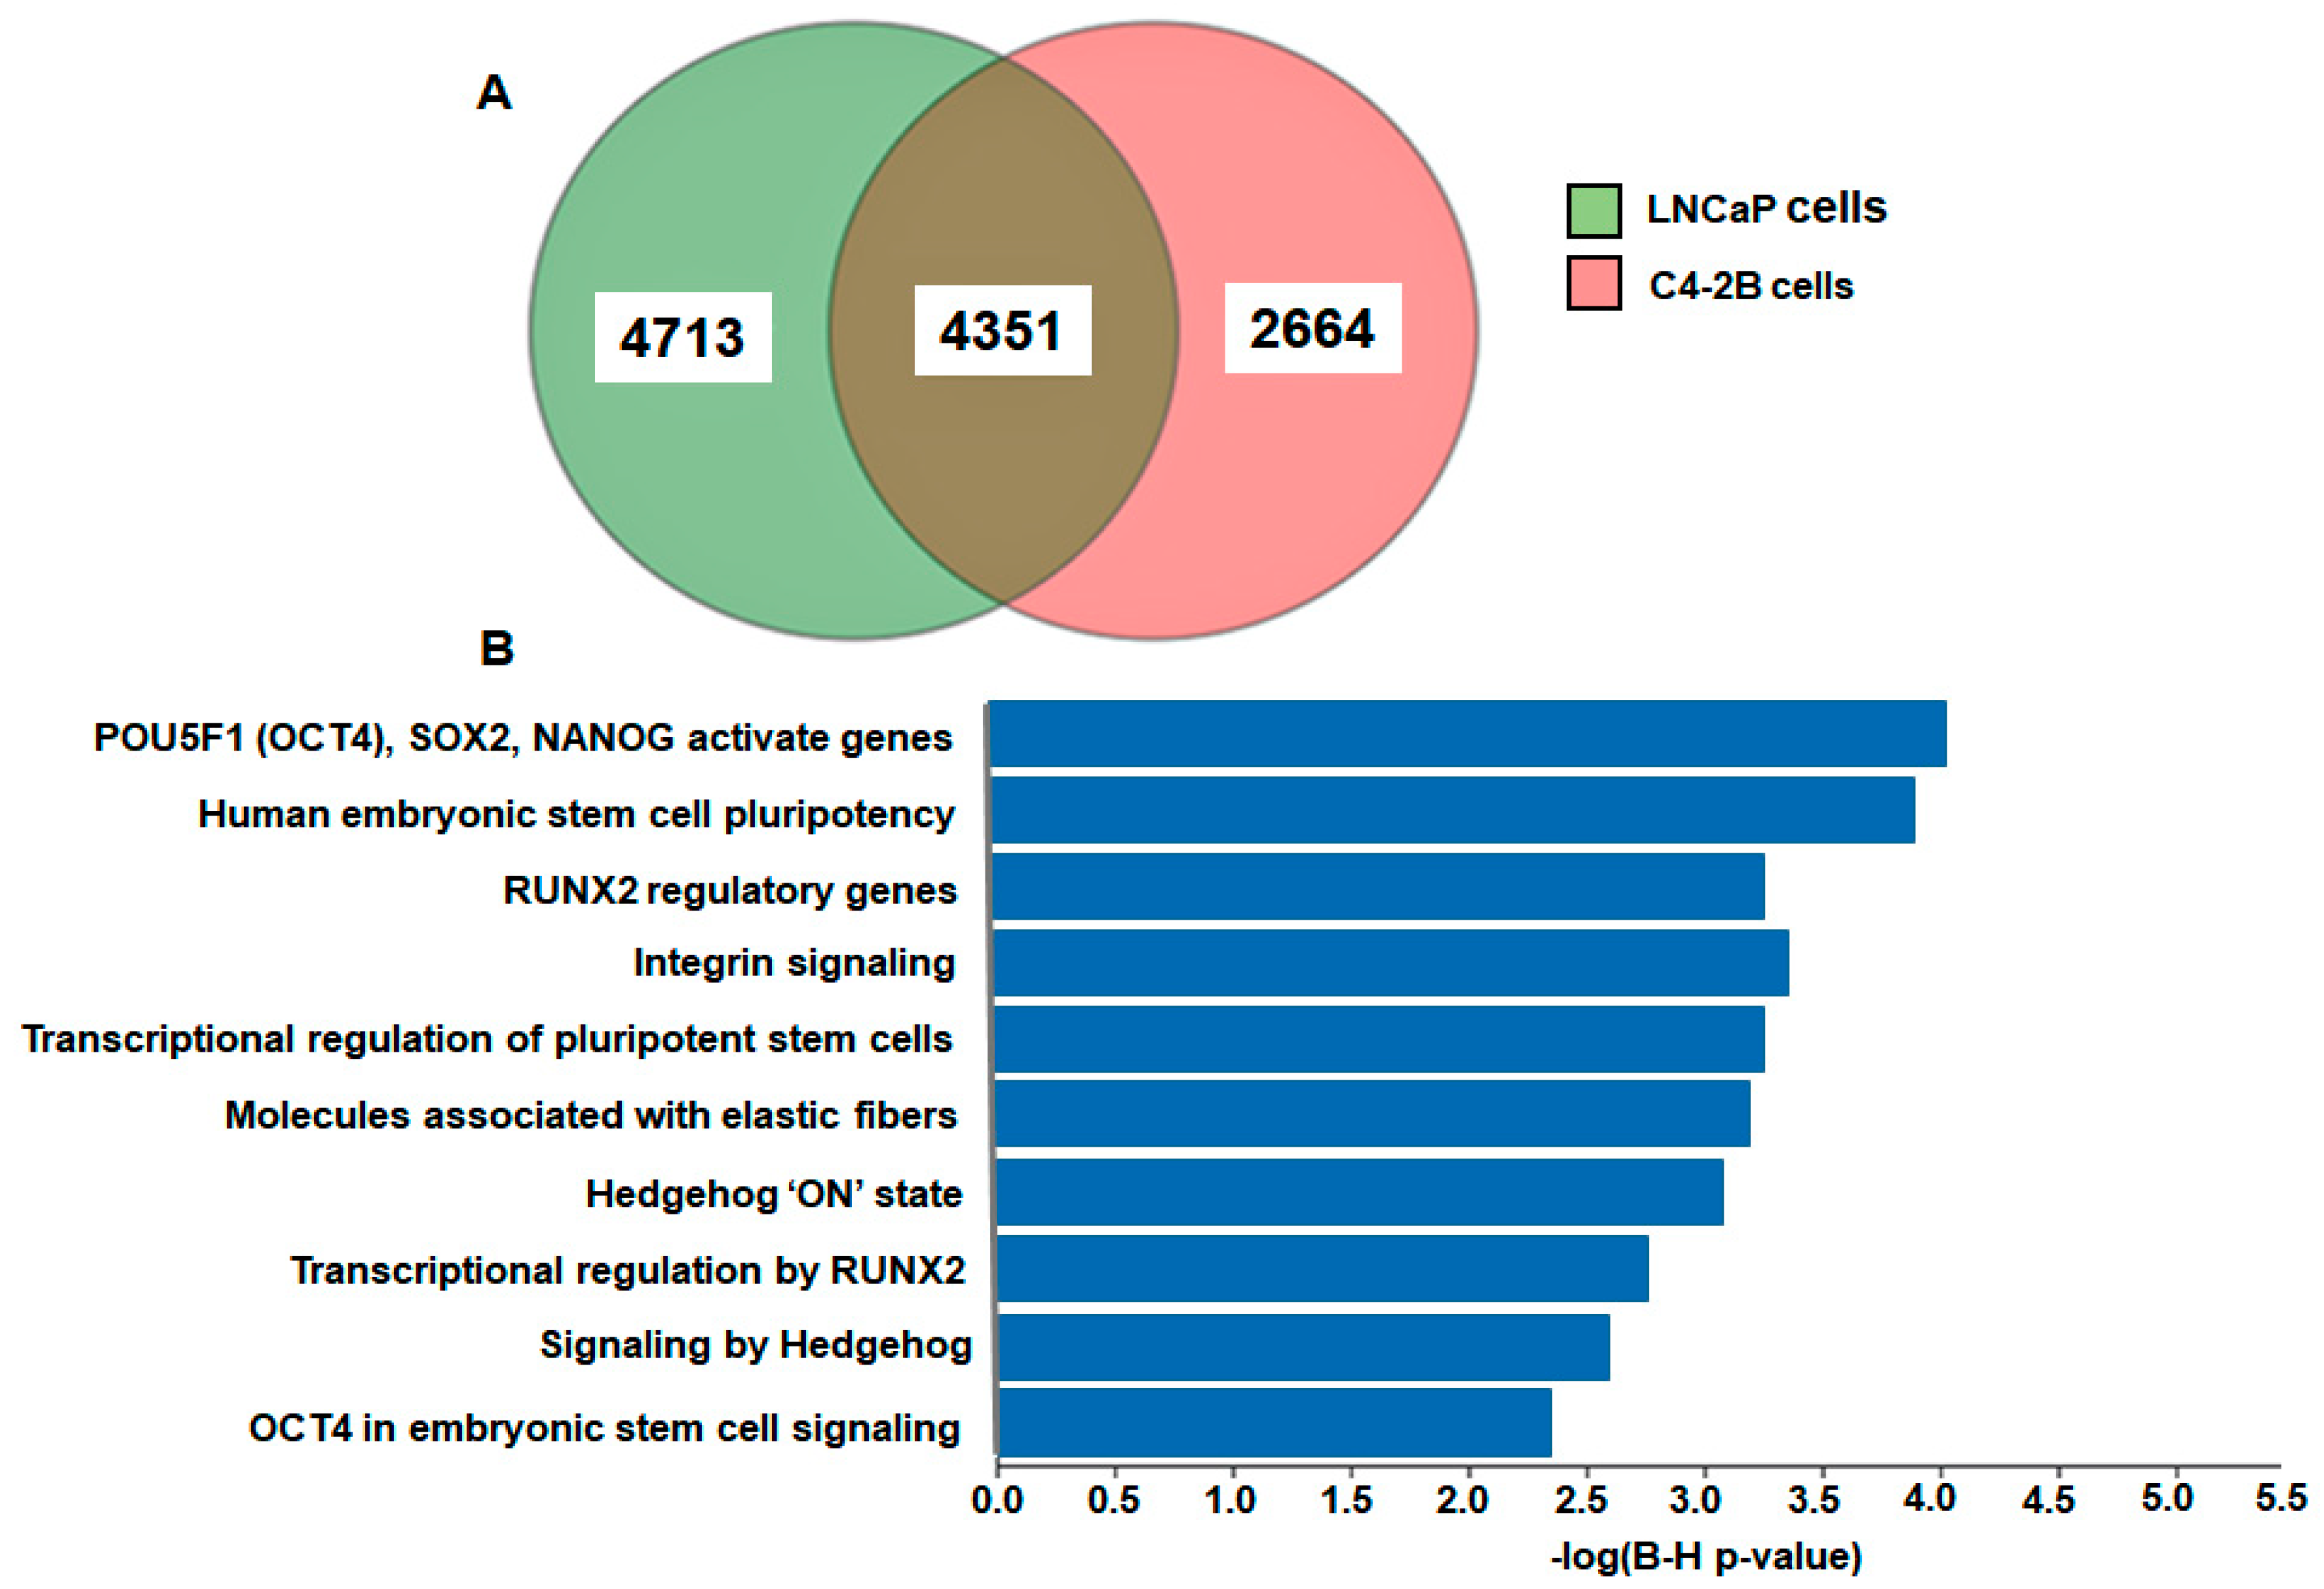
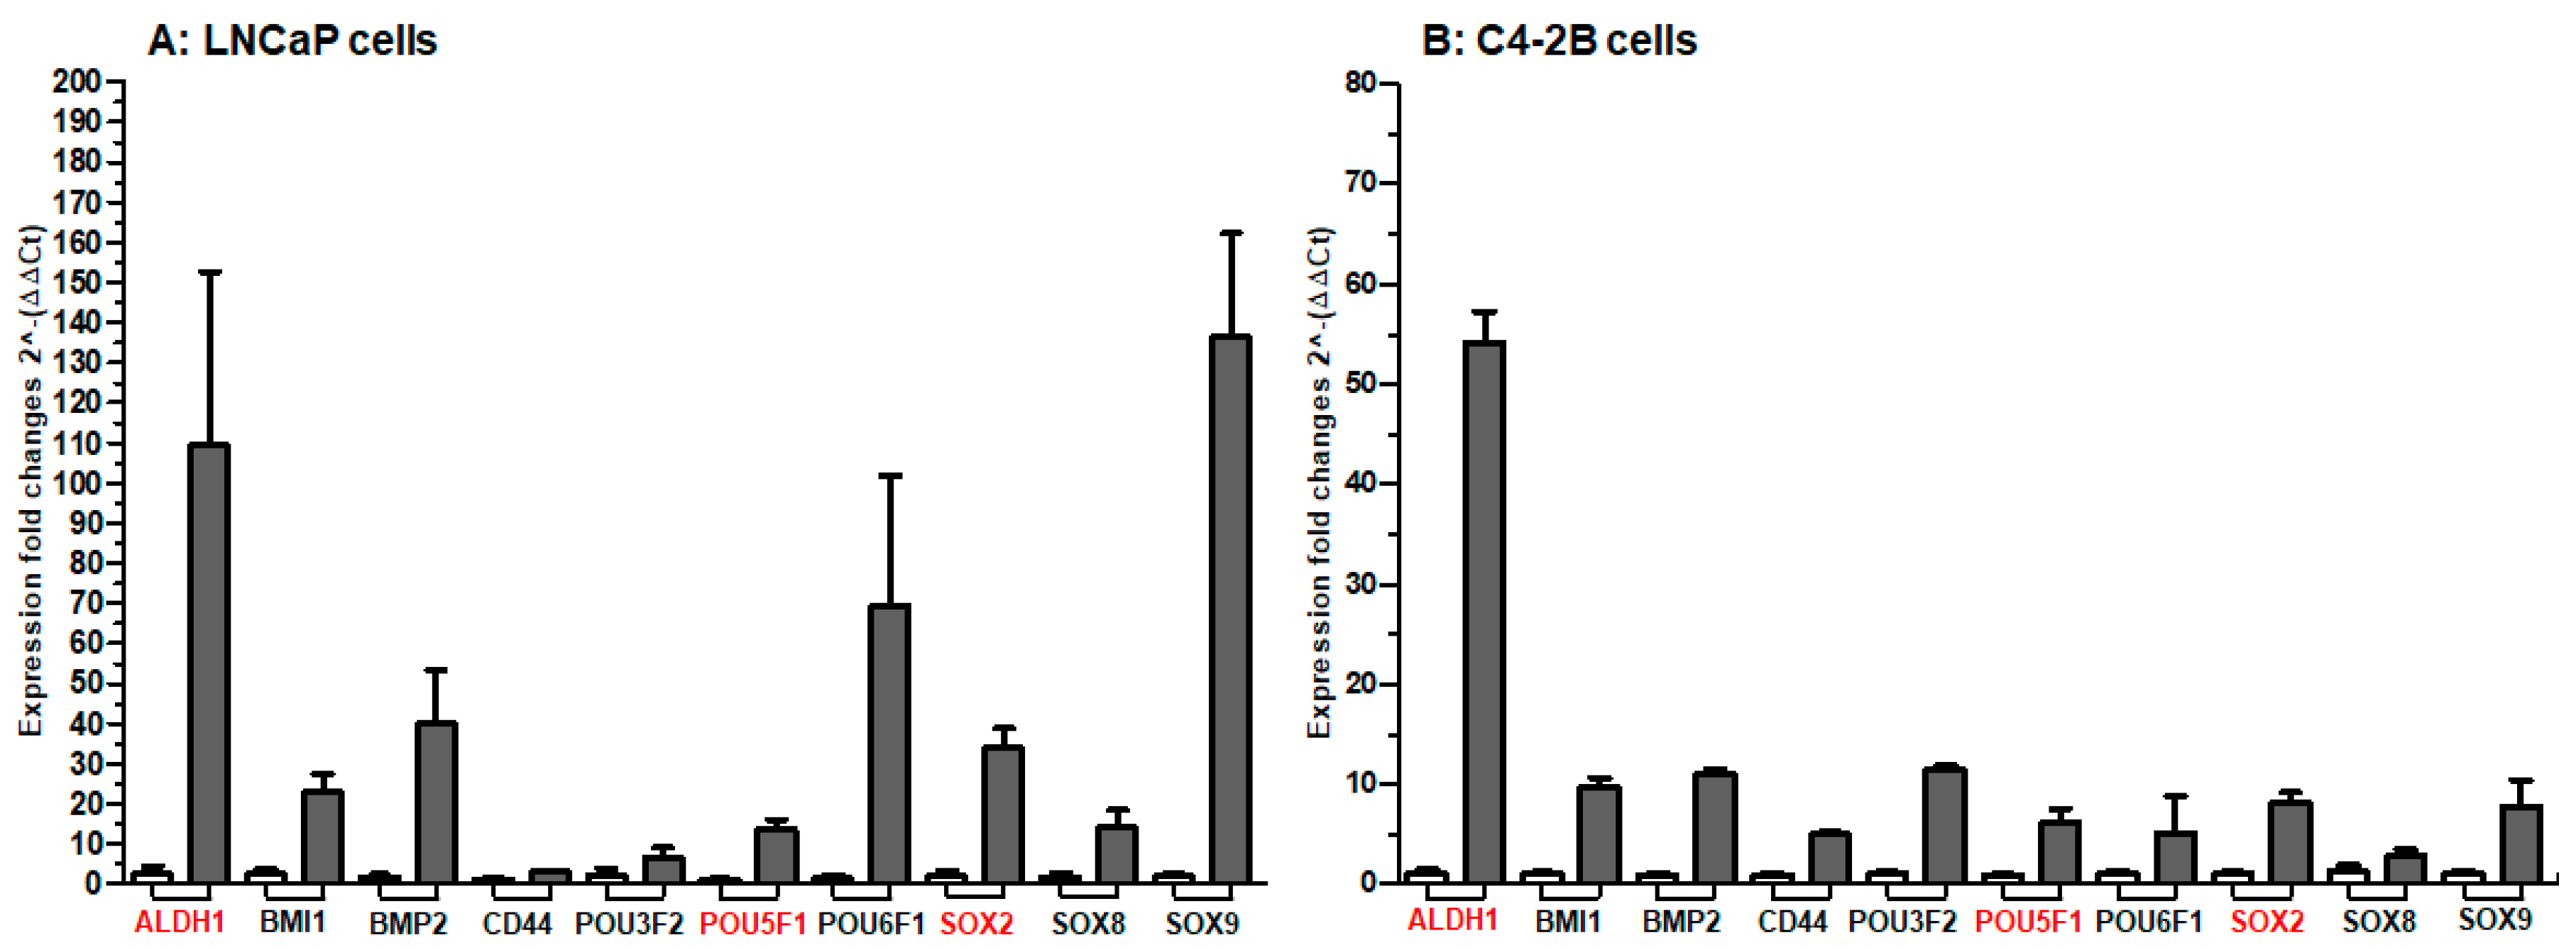
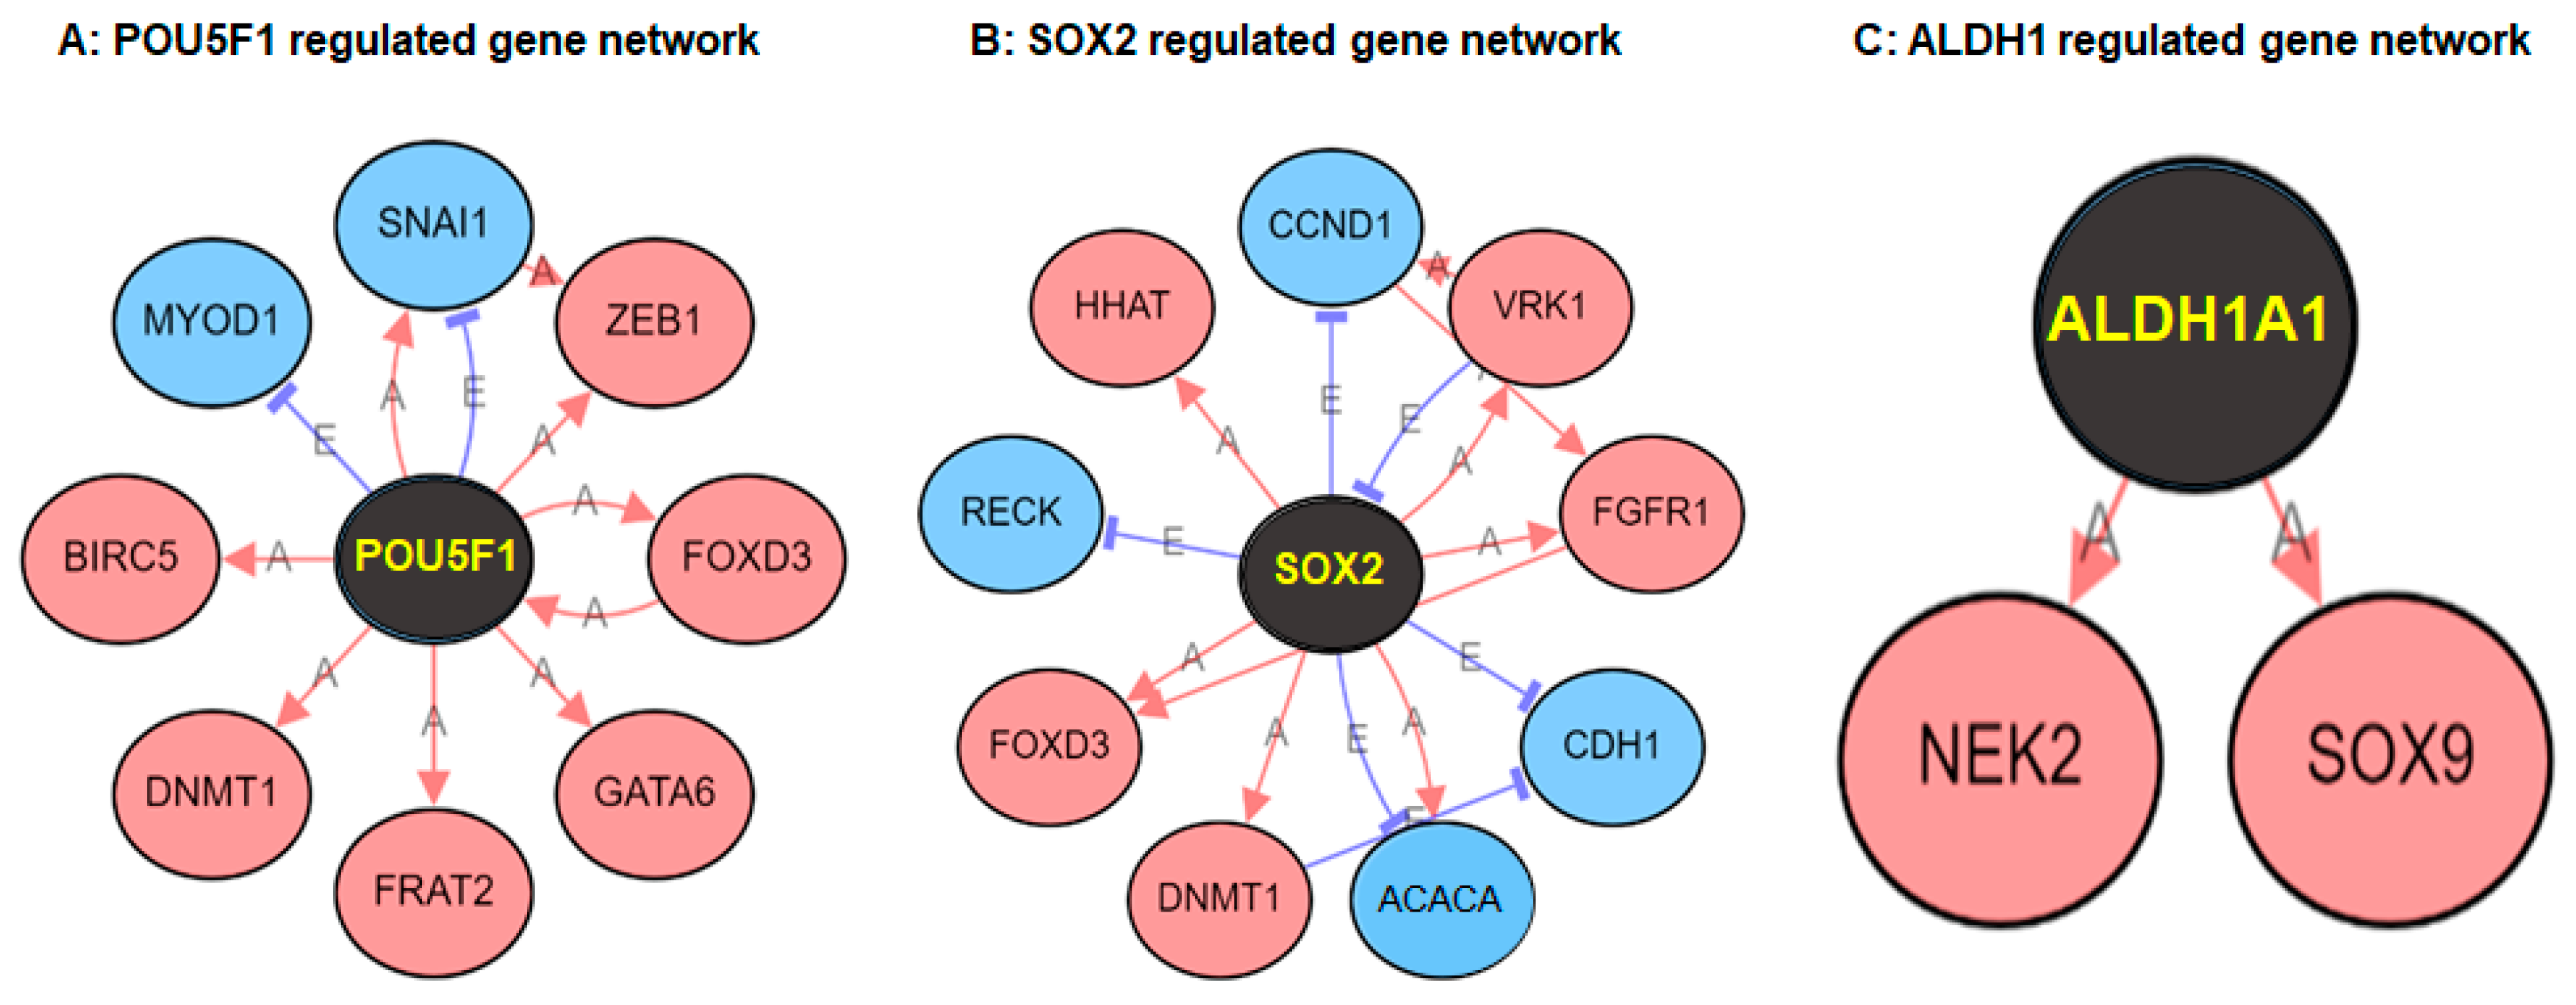
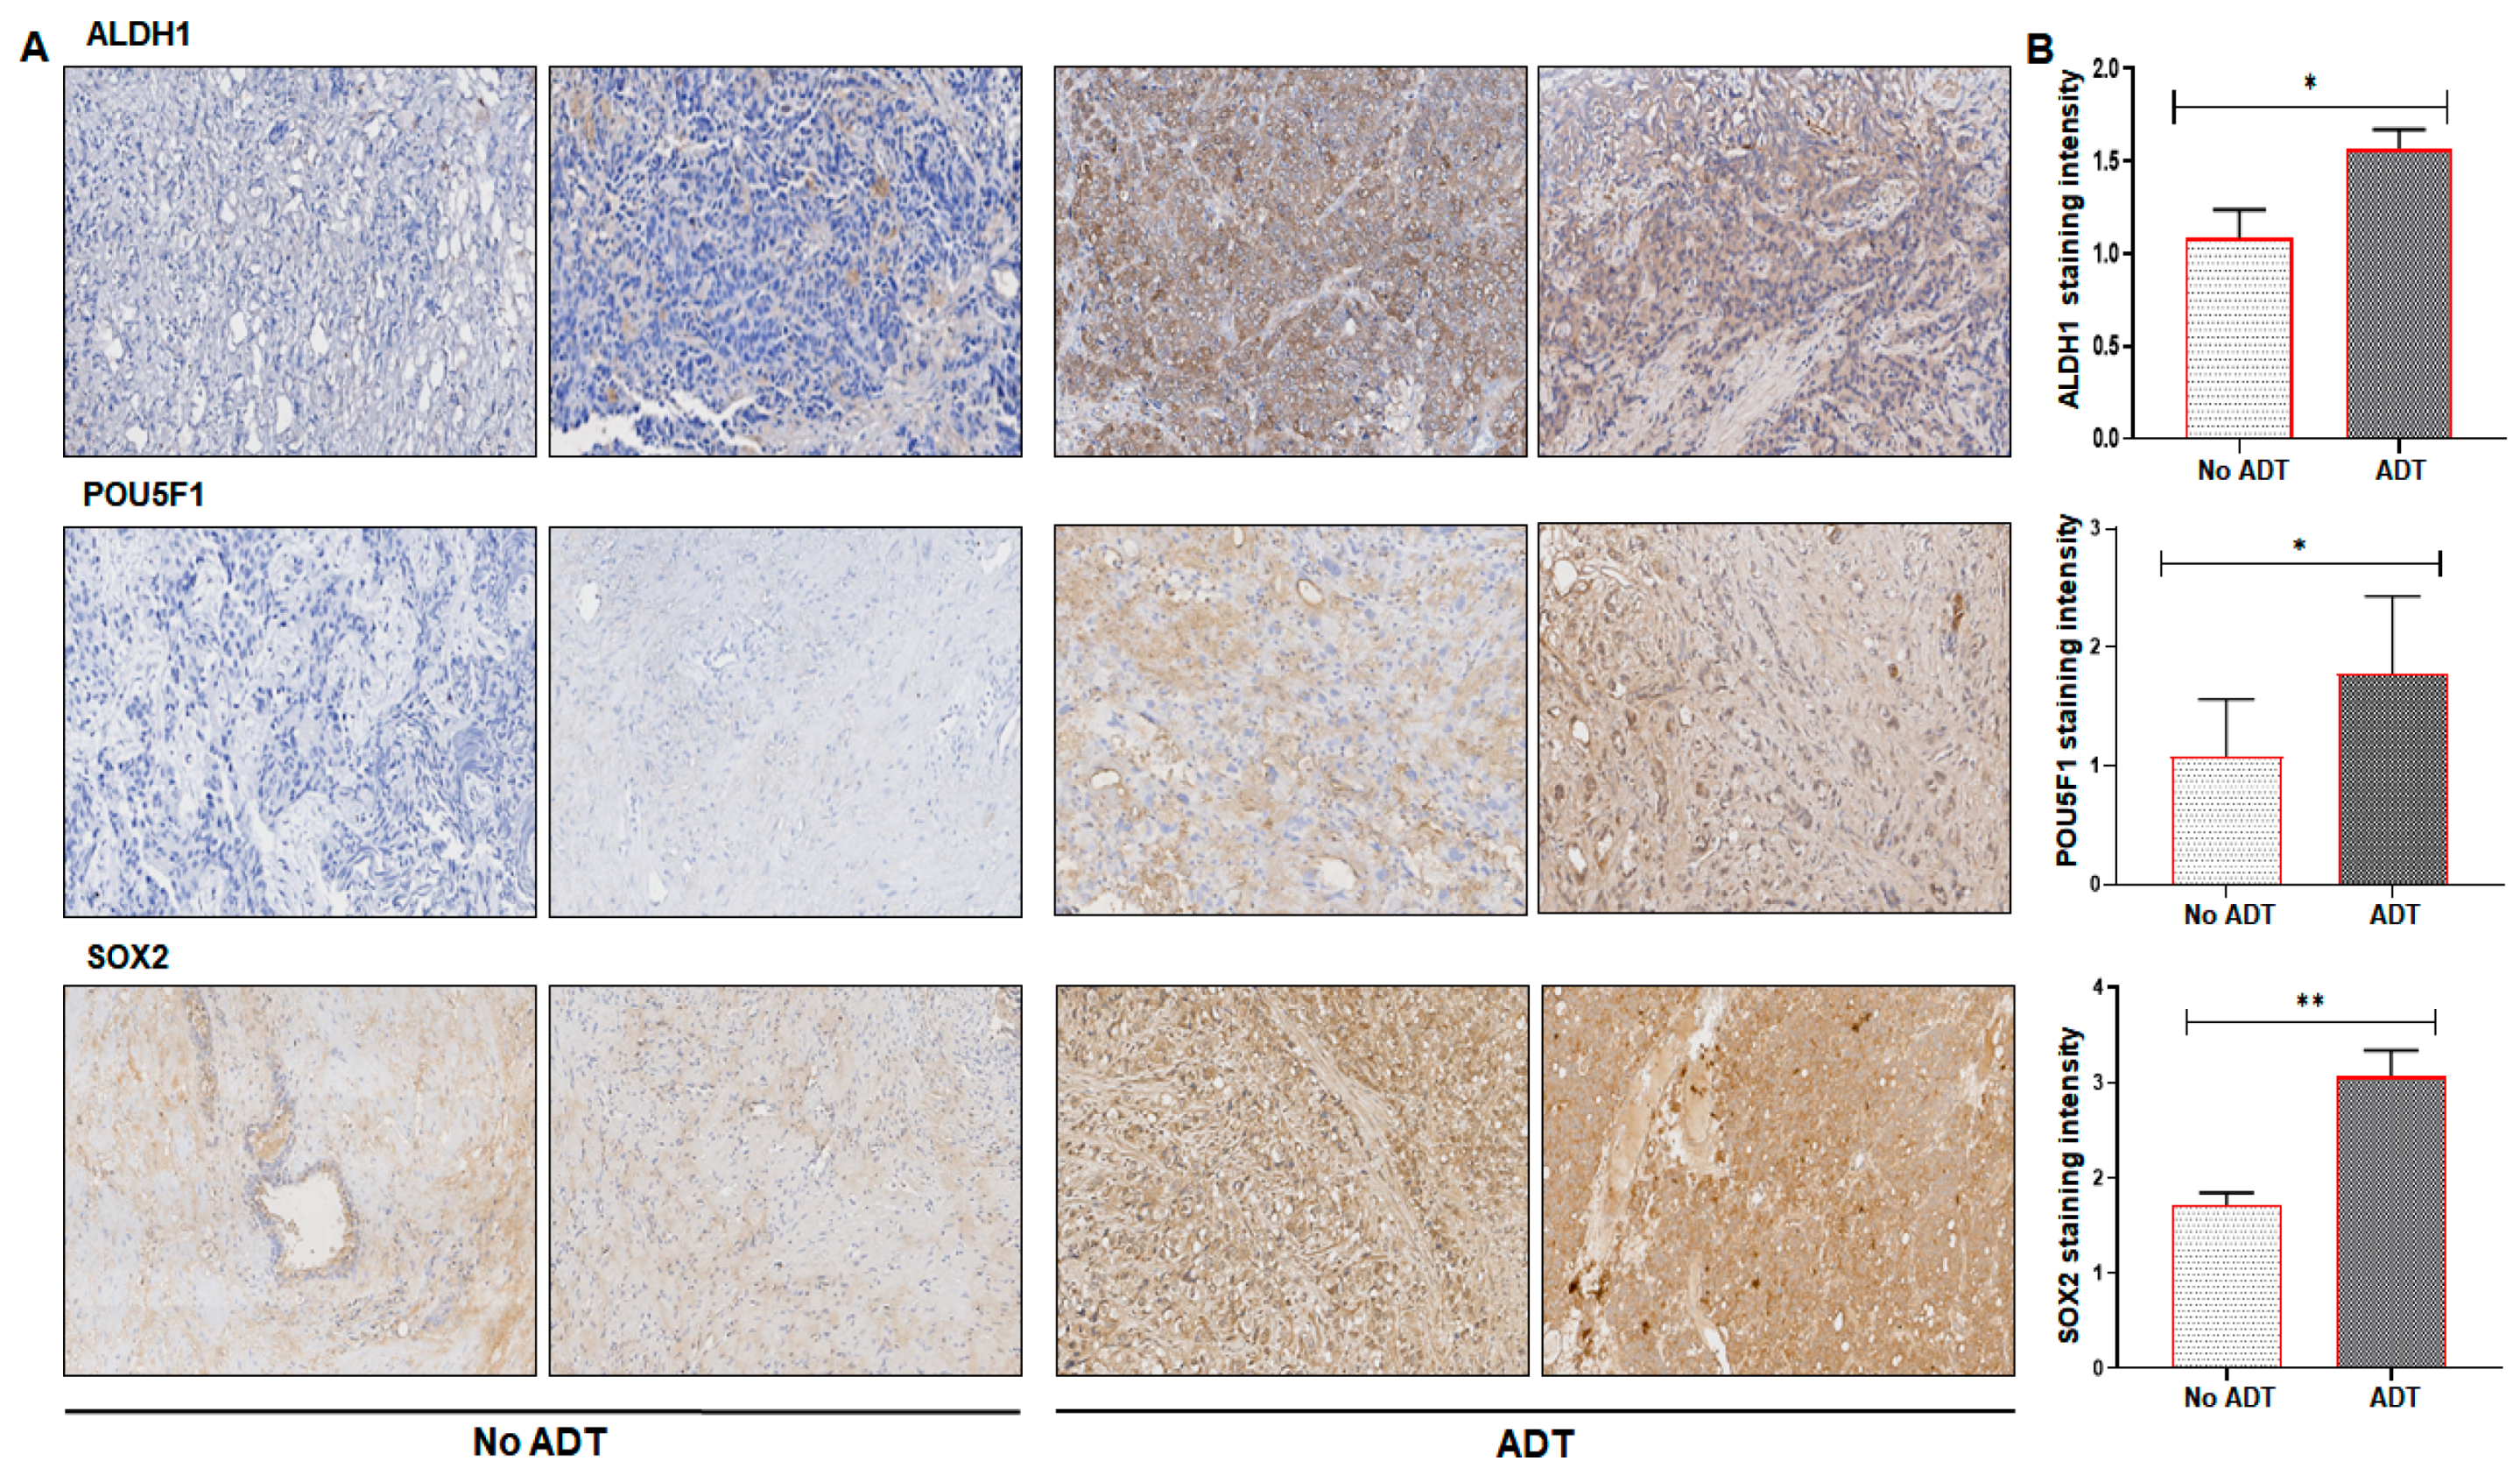
2. Results
3. Discussion
4. Materials and Methods
4.1. Chemicals and Reagents
4.2. Cell Culture
4.3. Alkaline Phosphatase Staining
4.4. Library Preparation and Next Generation Sequencing (NGS)
4.5. NGS Data Analysis and Visualization
4.6. Pathway and Gene Set Enrichment Analysis
4.7. Quantitative Real-Time PCR
4.8. Western Blotting
4.9. Clinical ADT and Non-ADT Prostate Tissue Specimens
4.10. Immunohistochemistry
4.11. Statistical Analysis
5. Conclusions
Supplementary Materials
Author Contributions
Funding
Acknowledgments
Conflicts of Interest
Abbreviations
| ADT | Androgen deprivation therapy |
| ALDH | Aldehyde dehydrogenase |
| BIRC5 | Baculoviral IAP Repeat Containing 5 |
| BMI1 | Polycomb complex protein |
| BMP2 | Bone Morphogenetic Protein 2 |
| CCND1 | Cyclin D1 |
| CDH1 | Chromodomain Helicase DNA Binding Protein 1 |
| CSCs | Cancer stem cells |
| DEGs | Differentially expressed genes |
| DNMT1 | DNA methyltransferase 1 |
| FGFR | Fibroblast Growth Factor Receptor |
| FOXD3 | Forkhead Box D3 |
| FRAT2 | FRAT regulator of WNT signaling pathway 2 |
| GATA6 | GATA Binding Protein 6 |
| HHAT | Hedgehog acyltransferase |
| LNCaP | Lymph node carcinoma of the prostate |
| MYOD1 | Myogenic Differentiation 1 |
| NEK2 | NIMA Related Kinase 2 |
| OCT4 | Octamer-binding transcription factor 4 |
| RECK | Reversion inducing cysteine rich protein with kazal motifs |
| RUNX2 | Runt-related transcription factor 2 |
| SNAI | Snail Family Transcriptional Repressor |
| VRK1 | VRK Serine/Threonine Kinase 1 |
| ZEB1 | Zinc Finger E-Box Binding Homeobox 1 |
References
- Magnan, S.; Zarychanski, R.; Pilote, L.; Bernier, L.; Shemilt, M.; Vigneault, E.; Fradet, V.; Turgeon, A.F. Intermittent vs Continuous Androgen Deprivation Therapy for Prostate Cancer: A Systematic Review and Meta-analysis. JAMA Oncol. 2015, 1, 1261–1269. [Google Scholar] [CrossRef] [PubMed] [Green Version]
- Klotz, L.; Toren, P. Androgen deprivation therapy in advanced prostate cancer: Is intermittent therapy the new standard of care? Curr. Oncol. 2012, 19, S13–S21. [Google Scholar] [CrossRef] [PubMed] [Green Version]
- Attard, G.; Borre, M.; Gurney, H.; Loriot, Y.; Andresen-Daniil, C.; Kalleda, R.; Pham, T.; Taplin, M.E. Abiraterone Alone or in Combination with Enzalutamide in Metastatic Castration-Resistant Prostate Cancer With Rising Prostate-Specific Antigen During Enzalutamide Treatment. J. Clin. Oncol. 2018, 36, 2639–2646. [Google Scholar] [CrossRef] [PubMed]
- Chopra, A.; Georgieva, M.; Lopes, G.; Yeo, C.M.; Haaland, B. Abiraterone or Enzalutamide in Advanced Castration-Resistant Prostate Cancer: An Indirect Comparison. Prostate 2017, 77, 639–646. [Google Scholar] [CrossRef]
- Becker, D.J.; Iyengar, A.D.; Punekar, S.R.; Ng, J.; Zaman, A.; Loeb, S.; Becker, K.D.; Makarov, D. Treatment of Metastatic Castration-resistant Prostate Cancer With Abiraterone and Enzalutamide Despite PSA Progression. Anticancer Res. 2019, 39, 2467–2473. [Google Scholar] [CrossRef]
- Matsubara, N.; Yamada, Y.; Tabata, K.I.; Satoh, T.; Kamiya, N.; Suzuki, H.; Kawahara, T.; Uemura, H.; Yano, A.; Kawakami, S.; et al. Abiraterone Followed by Enzalutamide Versus Enzalutamide Followed by Abiraterone in Chemotherapy-naive Patients With Metastatic Castration-resistant Prostate Cancer. Clin. Genitourin. Cancer 2018, 16, 142–148. [Google Scholar] [CrossRef]
- Patil, T.; Bernard, B. Complications of Androgen Deprivation Therapy in Men With Prostate Cancer. Oncology 2018, 32, 470–474. [Google Scholar]
- Pal, S.K.; Patel, J.; He, M.; Foulk, B.; Kraft, K.; Smirnov, D.A.; Twardowski, P.; Kortylewski, M.; Bhargava, V.; Jones, J.O. Identification of mechanisms of resistance to treatment with abiraterone acetate or enzalutamide in patients with castration-resistant prostate cancer (CRPC). Cancer 2018, 124, 1216–1224. [Google Scholar] [CrossRef]
- Ayob, A.Z.; Ramasamy, T.S. Cancer stem cells as key drivers of tumour progression. J. Biomed. Sci. 2018, 25, 20. [Google Scholar] [CrossRef]
- Woodward, W.A.; Hill, R.P. Cancer Stem Cells. Recent Results Cancer Res. 2016, 198, 25–44. [Google Scholar] [CrossRef]
- Friedmann-Morvinski, D.; Verma, I.M. Dedifferentiation and reprogramming: Origins of cancer stem cells. EMBO Rep. 2014, 15, 244–253. [Google Scholar] [CrossRef] [PubMed] [Green Version]
- Kasper, S. Exploring the origins of the normal prostate and prostate cancer stem cell. Stem Cell Rev. 2008, 4, 193–201. [Google Scholar] [CrossRef]
- Ojo, D.; Lin, X.; Wong, N.; Gu, Y.; Tang, D. Prostate Cancer Stem-like Cells Contribute to the Development of Castration-Resistant Prostate Cancer. Cancers 2015, 7, 2290–2308. [Google Scholar] [CrossRef] [PubMed]
- Li, Q.; Deng, Q.; Chao, H.P.; Liu, X.; Lu, Y.; Lin, K.; Liu, B.; Tang, G.W.; Zhang, D.; Tracz, A.; et al. Linking prostate cancer cell AR heterogeneity to distinct castration and enzalutamide responses. Nat. Commun. 2018, 9, 3600. [Google Scholar] [CrossRef] [Green Version]
- Kanwal, R.; Shukla, S.; Walker, E.; Gupta, S. Acquisition of tumorigenic potential and therapeutic resistance in CD133+ subpopulation of prostate cancer cells exhibiting stem-cell like characteristics. Cancer Lett. 2018, 430, 25–33. [Google Scholar] [CrossRef] [PubMed]
- Shen, Y.A.; Pan, S.C.; Chu, I.; Lai, R.Y.; Wei, Y.H. Targeting cancer stem cells from a metabolic perspective. Exp. Biol. Med. 2020, 245, 465–476. [Google Scholar] [CrossRef] [PubMed] [Green Version]
- Abad, E.; García-Mayea, Y.; Mir, C.; Sebastian, D.; Zorzano, A.; Potesil, D.; Zdrahal, Z.; Lyakhovich, A.; Lleonart, M.E. Common Metabolic Pathways Implicated in Resistance to Chemotherapy Point to a Key Mitochondrial Role in Breast Cancer. Mol. Cell. Proteom. 2019, 18, 231–244. [Google Scholar] [CrossRef] [Green Version]
- van Schaijik, B.; Davis, P.F.; Wickremesekera, A.C.; Tan, S.T.; Itinteang, T. Subcellular localisation of the stem cell markers OCT4, SOX2, NANOG, KLF4 and c-MYC in cancer: A review. J. Clin. Pathol. 2018, 71, 88–91. [Google Scholar] [CrossRef]
- Sánchez, B.G.; Bort, A.; Vara-Ciruelos, D.; Díaz-Laviada, I. Androgen Deprivation Induces Reprogramming of Prostate Cancer Cells to Stem-Like Cells. Cells 2020, 9, 1441. [Google Scholar] [CrossRef]
- Singh, U.; Quintanilla, R.H.; Grecian, S.; Gee, K.R.; Rao, M.S.; Lakshmipathy, U. Novel live alkaline phosphatase substrate for identification of pluripotent stem cells. Stem Cell Rev. Rep. 2012, 8, 1021–1029. [Google Scholar] [CrossRef] [Green Version]
- Lu, H.E.; Tsai, M.S.; Yang, Y.C.; Yuan, C.C.; Wang, T.H.; Lin, X.Z.; Tseng, C.P.; Hwang, S.M. Selection of alkaline phosphatase-positive induced pluripotent stem cells from human amniotic fluid-derived cells by feeder-free system. Exp. Cell Res. 2011, 317, 1895–1903. [Google Scholar] [CrossRef] [PubMed]
- Vêncio, E.F.; Nelson, A.M.; Cavanaugh, C.; Ware, C.B.; Milller, D.G.; Garcia, J.C.; Vêncio, R.Z.; Loprieno, M.A.; Liu, A.Y. Reprogramming of prostate cancer-associated stromal cells to embryonic stem-like. Prostate 2012, 72, 1453–1463. [Google Scholar] [CrossRef] [PubMed]
- Zhang, Y.; Chen, B.; Xu, P.; Liu, C.; Huang, P. Reprogramming Prostate Cancer Cells into Induced Pluripotent Stem Cells: A Promising Model of Prostate Cancer Stem Cell Research. Cell. Reprogram. 2020, 22, 262–268. [Google Scholar] [CrossRef] [PubMed]
- Armstrong, A.J.; Szmulewitz, R.Z.; Petrylak, D.P.; Holzbeierlein, J.; Villers, A.; Azad, A.; Alcaraz, A.; Alekseev, B.; Iguchi, T.; Shore, N.D.; et al. ARCHES: A Randomized, Phase III Study of Androgen Deprivation Therapy With Enzalutamide or Placebo in Men With Metastatic Hormone-Sensitive Prostate Cancer. J. Clin. Oncol. 2019, 37, 2974–2986. [Google Scholar] [CrossRef]
- Davis, I.D.; Martin, A.J.; Stockler, M.R.; Begbie, S.; Chi, K.N.; Chowdhury, S.; Coskinas, X.; Frydenberg, M.; Hague, W.E.; Horvath, L.G.; et al. Enzalutamide with Standard First-Line Therapy in Metastatic Prostate Cancer. N. Engl. J. Med. 2019, 381, 121–131. [Google Scholar] [CrossRef]
- Fizazi, K.; Scher, H.I.; Miller, K.; Basch, E.; Sternberg, C.N.; Cella, D.; Forer, D.; Hirmand, M.; de Bono, J.S. Effect of enzalutamide on time to first skeletal-related event, pain, and quality of life in men with castration-resistant prostate cancer: Results from the randomised, phase 3 AFFIRM trial. Lancet Oncol. 2014, 15, 1147–1156. [Google Scholar] [CrossRef]
- Annala, M.; Vandekerkhove, G.; Khalaf, D.; Taavitsainen, S.; Beja, K.; Warner, E.W.; Sunderland, K.; Kollmannsberger, C.; Eigl, B.J.; Finch, D.; et al. Circulating Tumor DNA Genomics Correlate with Resistance to Abiraterone and Enzalutamide in Prostate Cancer. Cancer Discov. 2018, 8, 444–457. [Google Scholar] [CrossRef] [Green Version]
- Kregel, S.; Kiriluk, K.J.; Rosen, A.M.; Cai, Y.; Reyes, E.E.; Otto, K.B.; Tom, W.; Paner, G.P.; Szmulewitz, R.Z.; Vander Griend, D.J. Sox2 is an androgen receptor-repressed gene that promotes castration-resistant prostate cancer. PLoS ONE 2013, 8, e53701. [Google Scholar] [CrossRef] [Green Version]
- Lunardi, A.; Ala, U.; Epping, M.T.; Salmena, L.; Clohessy, J.G.; Webster, K.A.; Wang, G.; Mazzucchelli, R.; Bianconi, M.; Stack, E.C.; et al. A co-clinical approach identifies mechanisms and potential therapies for androgen deprivation resistance in prostate cancer. Nat. Genet. 2013, 45, 747–755. [Google Scholar] [CrossRef]
- Gu, G.; Yuan, J.; Wills, M.; Kasper, S. Prostate cancer cells with stem cell characteristics reconstitute the original human tumor in vivo. Cancer Res. 2007, 67, 4807–4815. [Google Scholar] [CrossRef] [Green Version]
- Mathieu, J.; Zhang, Z.; Zhou, W.; Wang, A.J.; Heddleston, J.M.; Pinna, C.M.; Hubaud, A.; Stadler, B.; Choi, M.; Bar, M.; et al. HIF induces human embryonic stem cell markers in cancer cells. Cancer Res. 2011, 71, 4640–4652. [Google Scholar] [CrossRef] [PubMed] [Green Version]
- Federer-Gsponer, J.R.; Müller, D.C.; Zellweger, T.; Eggimann, M.; Marston, K.; Ruiz, C.; Seifert, H.H.; Rentsch, C.A.; Bubendorf, L.; Le Magnen, C. Patterns of stemness-associated markers in the development of castration-resistant prostate cancer. Prostate 2020, 80, 1108–1117. [Google Scholar] [CrossRef] [PubMed]
- Li, H.; Sun, Y.; Zhan, M. Exploring pathways from gene co-expression to network dynamics. Methods Mol. Biol. 2009, 541, 249–267. [Google Scholar] [CrossRef] [PubMed] [Green Version]
- Strunz, S.; Wolkenhauer, O.; de la Fuente, A. Network-Assisted Disease Classification and Biomarker Discovery. Methods Mol. Biol. 2016, 1386, 353–374. [Google Scholar] [CrossRef] [PubMed]
- Chang, Y.T.; Lin, T.P.; Campbell, M.; Pan, C.C.; Lee, S.H.; Lee, H.C.; Yang, M.H.; Kung, H.J.; Chang, P.C. REST is a crucial regulator for acquiring EMT-like and stemness phenotypes in hormone-refractory prostate cancer. Sci. Rep. 2017, 7, 42795. [Google Scholar] [CrossRef] [Green Version]
- Zhang, L.; Jiao, M.; Li, L.; Wu, D.; Wu, K.; Li, X.; Zhu, G.; Dang, Q.; Wang, X.; Hsieh, J.T.; et al. Tumorspheres derived from prostate cancer cells possess chemoresistant and cancer stem cell properties. J. Cancer Res. Clin. Oncol. 2012, 138, 675–686. [Google Scholar] [CrossRef]
- Toropainen, S.; Niskanen, E.A.; Malinen, M.; Sutinen, P.; Kaikkonen, M.U.; Palvimo, J.J. Global analysis of transcription in castration-resistant prostate cancer cells uncovers active enhancers and direct androgen receptor targets. Sci. Rep. 2016, 6, 33510. [Google Scholar] [CrossRef]
- Rajan, P.; Sudbery, I.M.; Villasevil, M.E.; Mui, E.; Fleming, J.; Davis, M.; Ahmad, I.; Edwards, J.; Sansom, O.J.; Sims, D.; et al. Next-generation sequencing of advanced prostate cancer treated with androgen-deprivation therapy. Eur. Urol. 2014, 66, 32–39. [Google Scholar] [CrossRef] [Green Version]
- Ginestier, C.; Hur, M.H.; Charafe-Jauffret, E.; Monville, F.; Dutcher, J.; Brown, M.; Jacquemier, J.; Viens, P.; Kleer, C.G.; Liu, S.; et al. ALDH1 is a marker of normal and malignant human mammary stem cells and a predictor of poor clinical outcome. Cell Stem Cell 2007, 1, 555–567. [Google Scholar] [CrossRef] [Green Version]
- Tomita, H.; Tanaka, K.; Tanaka, T.; Hara, A. Aldehyde dehydrogenase 1A1 in stem cells and cancer. Oncotarget 2016, 7, 11018–11032. [Google Scholar] [CrossRef] [Green Version]
- Brennan, S.K.; Meade, B.; Wang, Q.; Merchant, A.A.; Kowalski, J.; Matsui, W. Mantle cell lymphoma activation enhances bortezomib sensitivity. Blood 2010, 116, 4185–4191. [Google Scholar] [CrossRef] [PubMed]
- Landen, C.N., Jr.; Goodman, B.; Katre, A.A.; Steg, A.D.; Nick, A.M.; Stone, R.L.; Miller, L.D.; Mejia, P.V.; Jennings, N.B.; Gershenson, D.M.; et al. Targeting aldehyde dehydrogenase cancer stem cells in ovarian cancer. Mol. Cancer Ther. 2010, 9, 3186–3199. [Google Scholar] [CrossRef] [PubMed] [Green Version]
- Kulsum, S.; Sudheendra, H.V.; Pandian, R.; Ravindra, D.R.; Siddappa, G.; Nisheena, R.; Chevour, P.; Ramachandran, B.; Sagar, M.; Jayaprakash, A.; et al. Cancer stem cell mediated acquired chemoresistance in head and neck cancer can be abrogated by aldehyde dehydrogenase 1 A1 inhibition. Mol. Carcinog. 2017, 56, 694–711. [Google Scholar] [CrossRef] [PubMed]
- Ayub, T.H.; Keyver-Paik, M.D.; Debald, M.; Rostamzadeh, B.; Thiesler, T.; Schröder, L.; Barchet, W.; Abramian, A.; Kaiser, C.; Kristiansen, G.; et al. Accumulation of ALDH1-positive cells after neoadjuvant chemotherapy predicts treatment resistance and prognosticates poor outcome in ovarian cancer. Oncotarget 2015, 6, 16437–16448. [Google Scholar] [CrossRef]
- Nishida, S.; Hirohashi, Y.; Torigoe, T.; Kitamura, H.; Takahashi, A.; Masumori, N.; Tsukamoto, T.; Sato, N. Gene expression profiles of prostate cancer stem cells isolated by aldehyde dehydrogenase activity assay. J. Urol. 2012, 188, 294–299. [Google Scholar] [CrossRef]
- Vaddi, P.K.; Stamnes, M.A.; Cao, H.; Chen, S. Elimination of SOX2/OCT4-Associated Prostate Cancer Stem Cells Blocks Tumor Development and Enhances Therapeutic Response. Cancers 2019, 11, 1331. [Google Scholar] [CrossRef] [Green Version]
- Rodriguez, D.; Ramkairsingh, M.; Lin, X.; Kapoor, A.; Major, P.; Tang, D. The Central Contributions of Breast Cancer Stem Cells in Developing Resistance to Endocrine Therapy in Estrogen Receptor (ER)-Positive Breast Cancer. Cancers 2019, 11, 1028. [Google Scholar] [CrossRef] [Green Version]
- Chen, Q.; Qiu, C.; Huang, Y.; Jiang, L.; Huang, Q.; Guo, L.; Liu, T. Human amniotic epithelial cell feeder layers maintain iPS cell pluripotency by inhibiting endogenous DNA methyltransferase 1. Exp. Ther. Med. 2013, 6, 1145–1154. [Google Scholar] [CrossRef]
- Schmidt, C.S.; Bultmann, S.; Meilinger, D.; Zacher, B.; Tresch, A.; Maier, K.C.; Peter, C.; Martin, D.E.; Leonhardt, H.; Spada, F. Global DNA hypomethylation prevents consolidation of differentiation programs and allows reversion to the embryonic stem cell state. PLoS ONE 2012, 7, e52629. [Google Scholar] [CrossRef] [Green Version]
- Tsai, C.C.; Su, P.F.; Huang, Y.F.; Yew, T.L.; Hung, S.C. Oct4 and Nanog directly regulate Dnmt1 to maintain self-renewal and undifferentiated state in mesenchymal stem cells. Mol. Cell 2012, 47, 169–182. [Google Scholar] [CrossRef] [Green Version]
- Yang, J.; Gao, C.; Chai, L.; Ma, Y. A novel SALL4/OCT4 transcriptional feedback network for pluripotency of embryonic stem cells. PLoS ONE 2010, 5, e10766. [Google Scholar] [CrossRef] [PubMed] [Green Version]
- Zuo, J.; Guo, Y.; Peng, X.; Tang, Y.; Zhang, X.; He, P.; Li, S.; Wa, Q.; Li, J.; Huang, S.; et al. Inhibitory action of pristimerin on hypoxia-mediated metastasis involves stem cell characteristics and EMT in PC-3 prostate cancer cells. Oncol. Rep. 2015, 33, 1388–1394. [Google Scholar] [CrossRef] [PubMed] [Green Version]
- Cao, L.; Li, C.; Shen, S.; Yan, Y.; Ji, W.; Wang, J.; Qian, H.; Jiang, X.; Li, Z.; Wu, M.; et al. OCT4 increases BIRC5 and CCND1 expression and promotes cancer progression in hepatocellular carcinoma. BMC Cancer 2013, 13, 82. [Google Scholar] [CrossRef] [PubMed] [Green Version]
- Du, L.; Sun, W.; Zhang, H.; Chen, D. BDE-209 inhibits pluripotent genes expression and induces apoptosis in human embryonic stem cells. J. Appl. Toxicol. 2016, 36, 659–668. [Google Scholar] [CrossRef]
- Wuebben, E.L.; Rizzino, A. The dark side of SOX2: Cancer—A comprehensive overview. Oncotarget 2017, 8, 44917–44943. [Google Scholar] [CrossRef] [Green Version]
- Chaudhary, S.; Islam, Z.; Mishra, V.; Rawat, S.; Ashraf, G.M.; Kolatkar, P.R. Sox2: A Regulatory Factor in Tumorigenesis and Metastasis. Curr. Protein Pept. Sci. 2019, 20, 495–504. [Google Scholar] [CrossRef]
- Schaefer, T.; Lengerke, C. SOX2 protein biochemistry in stemness, reprogramming, and cancer: The PI3K/AKT/SOX2 axis and beyond. Oncogene 2020, 39, 278–292. [Google Scholar] [CrossRef] [Green Version]
- Tuerff, D.; Sissung, T.; Figg, W.D. Cellular identity crisis: Antiandrogen resistance by lineage plasticity. Cancer Biol. Ther. 2017, 18, 841–842. [Google Scholar] [CrossRef]
- Handle, F.; Erb, H.H.; Luef, B.; Hoefer, J.; Dietrich, D.; Parson, W.; Kristiansen, G.; Santer, F.R.; Culig, Z. SOCS3 Modulates the Response to Enzalutamide and Is Regulated by Androgen Receptor Signaling and CpG Methylation in Prostate Cancer Cells. Mol. Cancer Res. 2016, 14, 574–585. [Google Scholar] [CrossRef] [Green Version]
- Ku, S.Y.; Rosario, S.; Wang, Y.; Mu, P.; Seshadri, M.; Goodrich, Z.W.; Goodrich, M.M.; Labbé, D.P.; Gomez, E.C.; Wang, J.; et al. Rb1 and Trp53 cooperate to suppress prostate cancer lineage plasticity, metastasis, and antiandrogen resistance. Science 2017, 355, 78–83. [Google Scholar] [CrossRef] [Green Version]
- Mu, P.; Zhang, Z.; Benelli, M.; Karthaus, W.R.; Hoover, E.; Chen, C.C.; Wongvipat, J.; Ku, S.Y.; Gao, D.; Cao, Z.; et al. SOX2 promotes lineage plasticity and antiandrogen resistance in TP53- and RB1-deficient prostate cancer. Science 2017, 355, 84–88. [Google Scholar] [CrossRef] [PubMed] [Green Version]
- Verma, S.; Shukla, S.; Pandey, M.; MacLennan, G.T.; Gupta, S. Differentially Expressed Genes and Molecular Pathways in an Autochthonous Mouse Prostate Cancer Model. Front Genet. 2019, 10, 235. [Google Scholar] [CrossRef] [PubMed]


| Gene | Forward Primer (5′ to 3′) | Reverse Primer (5′ to 3′) |
|---|---|---|
| ALDH1 | GTCAAACCAGCAGAGCAAAC | GGCCCATAACCAGGAACAATA |
| BMI1 | ATCAGTCACCAGAGAGATGGA | GGGCTAGGCAAACAAGAAGA |
| BMP2 | CAGCTGTAAGAGACACCCTTTG | GCATTCTCCGTGGCAGTAAA |
| CD44 | GCAGGTATGGGTTCATAGAAGG | GGTGTTGGATGTGAGGATGT |
| POU3F2 | CTGGAGAGCCATTTCCTCAAA | AAACCAAACTCTCACCACCTC |
| POU5F1 | GGAGGAAGCTGACAACAATGA | CTCTCACTCGGTTCTCGATACT |
| POU6F1 | CTCCACAGCACCACTCAATA | GGTTACAGTGAGGCGAGATT |
| SOX2 | CGTTCATCGACGAGGCTAAG | CTTCTTCATGAGCGTCTTGGT |
| SOX8 | GTGTCGCAGGTGCTCAA | TTCATGGGCCGCTTCAC |
| SOX9 | TCTGGAGACTTCTGAACGAGAG | CGCGGCTGGTACTTGTAATC |
Publisher’s Note: MDPI stays neutral with regard to jurisdictional claims in published maps and institutional affiliations. |
© 2020 by the authors. Licensee MDPI, Basel, Switzerland. This article is an open access article distributed under the terms and conditions of the Creative Commons Attribution (CC BY) license (http://creativecommons.org/licenses/by/4.0/).
Share and Cite
Verma, S.; Shankar, E.; Kalayci, F.N.C.; Mukunda, A.; Alassfar, M.; Singh, V.; Chan, E.R.; MacLennan, G.T.; Gupta, S. Androgen Deprivation Induces Transcriptional Reprogramming in Prostate Cancer Cells to Develop Stem Cell-Like Characteristics. Int. J. Mol. Sci. 2020, 21, 9568. https://doi.org/10.3390/ijms21249568
Verma S, Shankar E, Kalayci FNC, Mukunda A, Alassfar M, Singh V, Chan ER, MacLennan GT, Gupta S. Androgen Deprivation Induces Transcriptional Reprogramming in Prostate Cancer Cells to Develop Stem Cell-Like Characteristics. International Journal of Molecular Sciences. 2020; 21(24):9568. https://doi.org/10.3390/ijms21249568
Chicago/Turabian StyleVerma, Shiv, Eswar Shankar, F. Naz Cemre Kalayci, Amrita Mukunda, Malek Alassfar, Vaibhav Singh, E. Ricky Chan, Gregory T. MacLennan, and Sanjay Gupta. 2020. "Androgen Deprivation Induces Transcriptional Reprogramming in Prostate Cancer Cells to Develop Stem Cell-Like Characteristics" International Journal of Molecular Sciences 21, no. 24: 9568. https://doi.org/10.3390/ijms21249568