Abstract
Accumulated evidence suggests that binding kinetic properties—especially dissociation rate constant or drug-target residence time—are crucial factors affecting drug potency. However, quantitative prediction of kinetic properties has always been a challenging task in drug discovery. In this study, the VolSurf method was successfully applied to quantitatively predict the koff values of the small ligands of heat shock protein 90α (HSP90α), adenosine receptor (AR) and p38 mitogen-activated protein kinase (p38 MAPK). The results showed that few VolSurf descriptors can efficiently capture the key ligand surface properties related to dissociation rate; the resulting models demonstrated to be extremely simple, robust and predictive in comparison with available prediction methods. Therefore, it can be concluded that the VolSurf-based prediction method can be widely applied in the ligand-receptor binding kinetics and de novo drug design researches.
1. Introduction
Although thermodynamic properties (e.g., IC50, EC50 and equilibrium dissociation constant (kd)) have been regarded as key indicators of drug potency, mounting evidence suggests that thermodynamic properties may not be the only measures of drug potency. Recently, it has become increasingly apparent that kinetic properties—especially dissociation rate constant (koff) or drug-target residence time (τ)—are more important for drug potency and are gradually being used in real-world lead optimization and drug design [1,2,3,4,5]. At present, kinetic properties are mainly determined by laboratory techniques, such as capillary electrophoresis, [6] affinity chromatography [7] and surface plasmon resonance methods [8,9], etc. However, there are still many technical difficulties need to be addressed, e.g., more time consumed, high cost and large measurement errors, which limit drug R&D to a large degree.
With the development of computational chemistry, molecular simulation techniques have been successfully applied to predict the binding kinetic properties of small molecules. One of the most common methods is molecular dynamics. By using τ-random acceleration molecular dynamics (τRAMD), Kokh et al. [10] proposed a protocol to predict the residence time of 70 inhibitors of human heat shock protein 90α (HSP90α). A strong correlation (R2 = 0.66) was observed between the predicted and measured residence time in 59 samples after removing 11 samples. After further removing four outliers, the R2 value of the linear regression of the remaining 55 compounds was 0.86 with a mean absolute percentage error (MAPE) of 0.36. In additions, the prediction method was further tested by 94 HSP90 inhibitors. The results showed that the predicted R2 of the 80 inhibitors was 0.75 with MAPE of 0.39 [11].
To investigate the quantitative structure-kinetics relationships (QSKRs) of 66 HSP90 inhibitors and 33 HIV-1 protease inhibitors, Ganotra et al. [12] proposed the “COMBINE” strategy that established PLS models by using 30 Lennard-Jones (LJ) and 12 coulombic residue-ligand interaction energies derived from the energy-minimized structures of drug-protein complexes. The results showed that R2, Q2 and R2val are 0.80, 0.69 and 0.86 for HSP90 inhibitors. By integrating coarse-grained normal mode analysis with multi-target machine learning, Chiu et al. [13] proved that the residue normal mode directionality displacement of receptor-ligand interactions can not only recapitulate the results from all-atom molecular dynamics simulations but also predict protein ligand binding/unbinding kinetics accurately.
Huang et al. [14] extracted ligand–receptor interaction energy fingerprints from the steered MD trajectories of 37 HIV-1 protease inhibitors, which were further used for estimating the ligand dissociation rate constants by partial least squares (PLS) regression successfully. By employing position-restrained molecular dynamics simulations, Zhang et al. [15] decomposed the protein-ligand interaction fingerprints alone the ligand-unbinding pathway and constructed PLS models to predict koff value of 20 p38 mitogen-activated protein kinase (p38 MAPK) Type II inhibitors. The result showed that the R2, Q2 and R2val of the optimal model with three descriptors are 0.72, 0.66 and 0.563, respectively.
Although MD simulations can provide a feasible way for predicting the receptor-ligand binding kinetics, its practical effectiveness is limited by the substantial computational resources required, underdeveloped MD force fields and relatively lower prediction accuracies. Thus, traditional ligand-based prediction method is still a first choice for predicting ligand binding kinetics, especially for lead compound optimization and virtual screening researches.
Recently, Qu et al. [16] employed a 3D grid-based VolSurf method to predict association rate constant (kon), dissociation rate constant and equilibrium dissociation constant (kd) values of 37 HIV-1 protease inhibitors with satisfactory results. The results showed that the kinetic properties of 37 HIV-1 protease inhibitors are closely related to the nine VolSurf descriptors derived from water (OH2) and hydrophobic (DRY) probes. In this study, we further examine the applicability and reliability of the VolSurf method by predicting the ligand dissociation rate constants of adenosine receptor (AR), HSP90 and p38 MAPK. The results showed that all of the three biologic systems achieved satisfied prediction performances. In general, the VolSurf method is easily implemented and can offer a practical and promising way for predicting ligand kinetic properties.
2. Results and Discussions
2.1. Heat Shock Protein 90α
HSP90 is a highly conserved molecular chaperone, which is involved in many different cellular pathways (e.g., the signal transductions of hormone and growth factor receptors) and maintains proteostasis involved in signal transduction, cell cycle control or transcriptional regulation [17,18]. Accumulated evidences suggested that Hsp90 is highly expressed in most of tumor cells in a high-affinity conformation [19]. Thus, HSP90 have been suggested as important therapeutic targets of cancer. In this study, 52 inhibitors of HSP90 with different molecular skeletons were derived from Schuetz’s research (Table S2) [20]. Herein, the 52 inhibitors were randomly divided into 35 training samples and 17 validation samples.
Based on the variable subsets derived from stepwise multiple regression (SMR), PLS modeling was performed. From Table 1, it can be observed that all of the nine PLS models achieved good prediction performances. In the consideration of model complexity and interpretability, the PLS model with only two descriptors (V-OH2 and D8-DRY) was chosen as the optimal PLS model, of which the R2, Q2 and R2val are 0.726, 0.688 and 0.718, respectively. The optimal PLS model suggests that the dissociation rate of HSP90 inhibitors are closely related to the molecular volume and hydrophobic properties.

Table 1.
The partial least squares (PLS) modeling results of the dissociation rate constants of the Hsp90 inhibitors.
Figure 1a,b show the predicted vs. observed−log(koff) values of 35 training and 17 validation samples of Hsp90 inhibitors. It can be seen all the samples are distributed along the regression lines through the origin very well. It should be noted that, although the −log(koff) values differ by three orders of magnitude, all of the validation samples are predicted accurately. Figure 1c shows the first two principal component scores of the 35 training samples. It can be observed that, in first two principle component spaces, the experimental −log(koff) values increased gradually along the direction from the 3rd to 1st quadrants. From the loading scatter plot of the optimal PLS model (Figure 1d), it can be seen that, in the first principal component, V-OH2 variable makes positive contributions to −log(koff), while D8-DRY negative contributions.
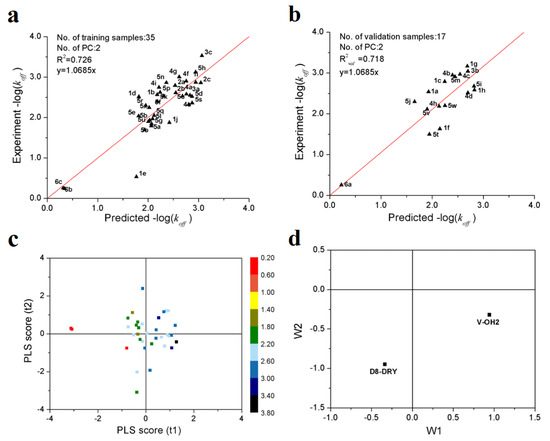
Figure 1.
PLS modeling results of the dissociation rate constants of 52 Hsp90 inhibitors. (a) scatter plot of experimental vs. predicted −log(koff) of 35 training samples; (b) scatter plot of experimental vs. predicted −log(koff) of 17 validation samples; (c) first two principle component scores. The color legend represents the range of −log(koff) values; (d) loading plot of the first two principal components.
Taken sample 1i (1b) and 5h (5×) for example, each pair of samples are similar in structures, but with different dissociation rate constants. By comparison, 1i and 5h have lower dissociation rate constants than 1b and 5×, respectively (Table S2). It can be observed that the molecular volume of 1i and 5h are higher than that of 1b and 5× respectively, while the hydrophobic regions (−1.6 kcal/mol level) of 1i and 5h are relatively lower (Figure 2). That is to say, relatively larger molecular volume contributes to lower dissociation rate or longer residence time, while larger hydrophobic regions may benefit from higher dissociation rate or shorter residence time. It should be noticed that the strong correlation between the koff values and the molecular sizes of HSP90 inhibitors has been detailed in earlier research [21].
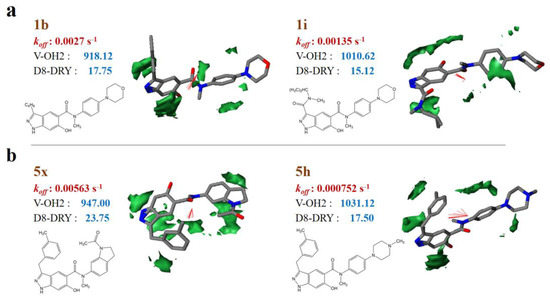
Figure 2.
VolSurf properties of representative samples with different molecular skeletons. (a) 1b and 1i; (b) 5× and 5h. The hydrophobic regions at −1.6 kcal/mol energy level; red vectors represent the integy moments joining the center of mass of the molecule to the barycenter of the hydrophobic regions.
To validate the robustness of the optimal PLS model, 1000-times repeated PLS modeling and 500-times Y-random permutation test were performed. Figure 3a shows the frequency distribution of R2 and R2val in 1000-times repeated PLS modeling based on the randomly selected training and validation samples. The means of R2 and R2val are 0.70 ± 0.15 and 0.67 ± 0.09, respectively. Besides, 500-times Y-random permutation test was also performed. From Figure 3b, it can be clearly observed that the R2 and Q2 drop sharply along with the decreased correlation coefficients between the original and permuted Y, which indicates a high-quality PLS model. To further test the predictive power of the optimal PLS model, 49 non-redundant HSP inhibitors (Table S3) were collected from Kokh’s research [10] as an independent test dataset. Although the R2val value was decreased in some degree, the performance is still acceptable for the independent test samples with different molecular skeletons (Table 2 and Figure 3c).
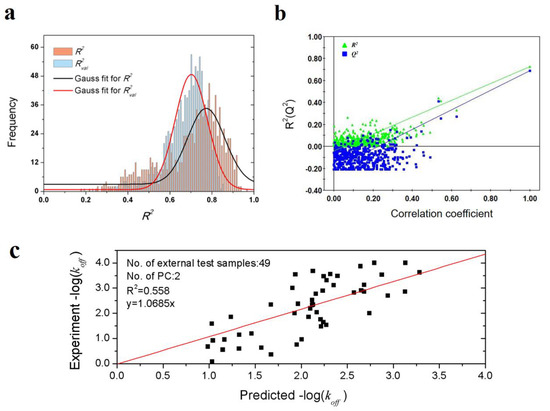
Figure 3.
Results of PLS model validation. (a) R2 and R2val distributions of 1000-times repeated PLS modeling; (b) 500-times Y random permutation test; (c) scatter plot of experimental vs. predicted −log(koff) of 49 independent test samples.
Table 2.
Performance comparison among VolSurf, τ-random acceleration molecular dynamics (τRAMD) and COMBINE models.
Table 2 shows the performance comparison among the available prediction models. Although the τRAMD and “COMBINE” models achieved satisfied prediction results, both of the models depend heavily on the energy-minimized structures of the ligand-receptor complexes and the results of which are hardly to be reproduced, which limits their real-life applications in a large degree.
2.2. Adenosine Receptor
ARs belongs to a class of G protein-coupled receptors (GPCR) and is responsible for regulating the physiological actions of adenosine [22]. Four AR subtypes have been found in humans, namely A1, A2A, A2B and A3 [23]. Recent researches proposed that the agonists of A1AR contribute to the cardioprotection and immune regulation, while the antagonists can be used for asthma treatments. Herein, after removing the 7 molecules with fast dissociation rates (−log(koff) < 0.1), 27 A1AR agonists and 12 antagonists were derived from recent literatures [24,25,26,27,28] and used for constructing the prediction model of dissociation rate constant (Table S4). Herein, 26 molecules are randomly selected as training samples and remaining 13 as validation samples.
As shown in Table 3, a total of 7 VolSurf descriptors were obtained from SMR feature selection. In consideration of the balanced performances on training and validation datasets, the PLS model with 2 descriptors was chosen as the optimal model, of which the R2, Q2 and R2val are 0.688, 0.631 and 0.627, respectively. The robustness and predictive power of the PLS model were further validated by 1000-times repeated PLS modeling and 500-times Y-random permutation test with excellent results obtained. The means of R2 and R2val for 1000-repeated PLS modeling are 0.66 ± 0.14 and 0.61 ± 0.10, respectively (Figure 4). The variables involved in the optimal PLS model are POL and W5-N3+, which indicates that the dissociation rate of A1AR ligands are closely related to molecular polarizability and hydrophilic interactions at −3.0 kcal/mol energy level.
Table 3.
PLS modeling results of the dissociation rate constants of 39 A1AR agonists/antagonists.
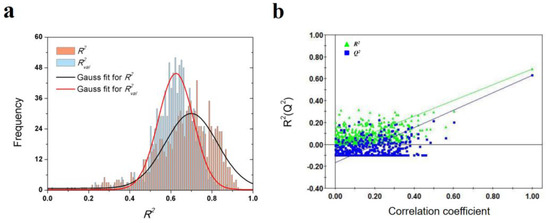
Figure 4.
Results of PLS model validations. (a) frequency distribution of R2 and R2val in 1000-times repeated PLS modeling; (b) 500-times Y random permutation test.
From Figure 5a,b, it is obvious that all the training/validation samples are distributed along the regression lines very well; that the first principal component scores are closely correlated with the observed −log(koff) values (Figure 5c). From the loading plot of POL and W5−N3+ variables (Figure 5d), it can be deduced that higher molecular polarizability and stronger hydrophilic interactions contribute to longer residence time.
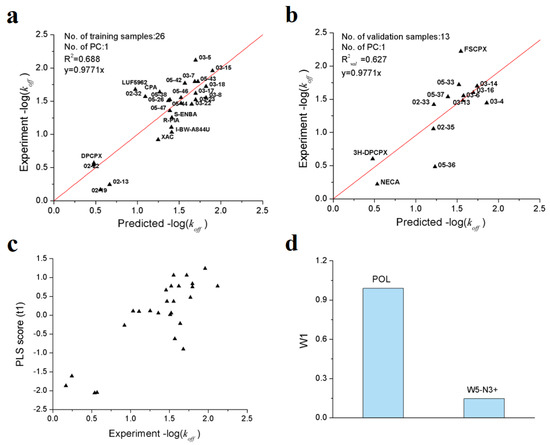
Figure 5.
Optimal PLS model of the dissociation rate constants of 39 A1AR agonists/antagonists. (a) scatter plot of experimental vs. predicted −log(koff) of the 26 training samples; (b) scatter plot of experimental vs. predicted −log(koff) of the 13 validation samples; (c) first principle component scores of the 26 training samples; (d) weights of independent variables in the first principle component.
2.3. p38 Mitogen-Activated Protein Kinase
As the key regulators of inflammatory cytokine expression, p38 MAPK plays an important role in a wide variety of essential physiological processes [29] and is closely associated with human diseases, such as asthma, autoimmunity and cancer, etc. [30,31]. Herein, 28 inhibitors of p38 MAPK (Table S5) with determined dissociation rate constants were collected from recent literatures [32,33,34,35], of which 18 were randomly chosen as training samples and 10 as validation samples.
After variable selection and PLS modeling, an optimal PLS model with two variables was obtained, of which R2, Q2 and R2val for koff are 0.821, 0.818 and 0.821, respectively (Table 4). As showed in Table 5, it can be seen that the prediction performances of the VolSurf model is superior to that of the models based on position-restrained MD [15] and biased MD simulations [36]. Furthermore, the results of 1000-repeated PLS modeling and 500-times Y-random permutations test demonstrates that the high-quality PLS model is not caused by accident (Figure 6). The means of R2 and R2val for 1000-repeated PLS modeling are 0.80 ± 0.10 and 0.75 ± 0.10, respectively.
Table 4.
PLS modeling results of the dissociation rate constants of p38 mitogen-activated protein kinase (p38 MAPK) inhibitors.
Table 5.
Performance comparison among VolSurf, position-restrained and biased MD models.
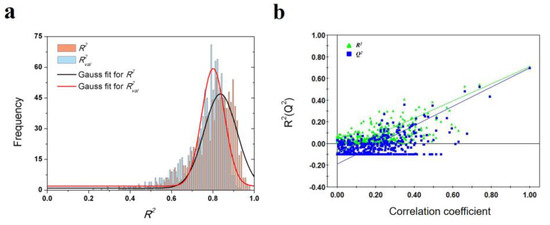
Figure 6.
Validations of the optimal PLS model: (a) frequency distribution of R2 and R2val in 1000-times repeated PLS modeling; (b) 500-times Y random permutation test.
From Figure 7a,b, it can be inferred that the PLS model with two variables can accurately estimate the −log(koff) values which span about 5 orders of magnitude. The two descriptors (V-OH2 and BV21-OH2) selected imply that the dissociation rate of p38 MAPK inhibitors is mainly determined by molecular volume and the hydrophilic interactions at energy levels of −1.0 and −3.0 kcal/mol. From the PLS score plot (Figure 7c), it can be observed that the first principal component scores are significantly correlated with the observed −log(koff) values.
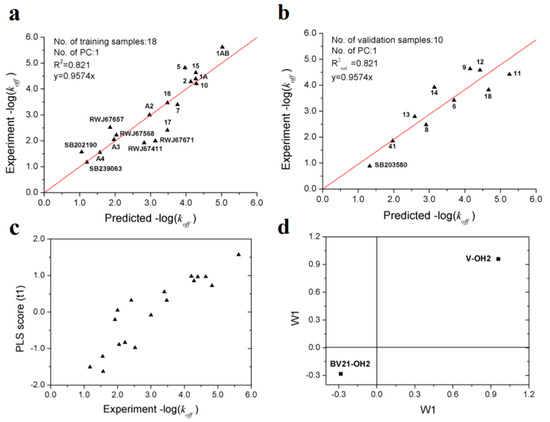
Figure 7.
Optimal PLS model of the dissociation rate constants of 28 p38 MAPK inhibitors. (a) scatter plot of experimental vs. predicted −log(koff) of the 18 training samples; (b) scatter plot of experimental vs. predicted −log(koff) of the 10 validation samples; (c) first principle component scores of the 18 training samples. (d) weights of the two variables in the first principle component.
From the loading plot, it can be deduced that larger molecular volume contributes to longer residence time, while stronger hydrophilic interactions contribute to faster dissociation (Figure 7d). The result proposed in this study is consistent with previous researches, which suggested that type I kinases inhibitors bind to the ATP binding site and usually smaller and faster, while compounds of type II are generally large since occupy additional transient sub-pocket [36,37].
3. Methods
3.1. VolSurf
VolSurf [38,39] is a grid-based structural description method, which aims to calculate molecular properties from 3D molecular fields of interaction energies and compress most of the relevant information into few quantitative descriptors. As shown in Figure 8, VolSurf first divides molecular space into 3D lattice points. Subsequently, the interaction energies of the molecules with specific probes in each lattice point are calculated to acquire the interaction volume and surface information, which can quantitatively characterize the potential steric, electrostatic, H-bonding, hydrophobic, etc. interactions between the ligand and receptor [40].
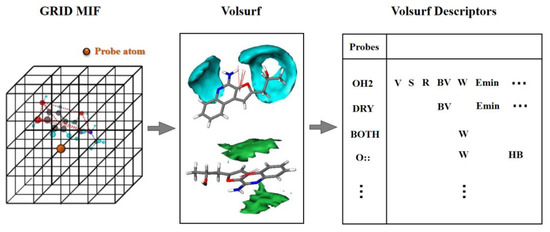
Figure 8.
The procedure of VolSurf description: (1) dividing the molecular space into 3D lattice points; (2) calculating the interaction energies of molecules by specific probes in each lattice point; (3) quantitating the interaction volume and surface information. MIF: molecular interaction fields.
VolSurf can build a unique framework related to specific molecular properties by using 9 probes, i.e., water probe (HO2), hydrophobic probe (DRY), carbonyl oxygen atom (O), amphipathic probe (BOTH), carboxy oxygen atom (O::), amide NH group (N1), sp2 N with one long pair (N:=), sp3 cationic NH3 group probe (N3+) and anionic phenolate oxygen atom (O-). In the last decade, VolSurf has been successfully used for predicting pharmacokinetics properties, i.e., absorption, distribution, metabolism and excretion properties [16,41,42].
Before VolSurf calculation, each molecule was first charged by MMFF94 method and then optimized by MMFF94 force field with conjugate gradient minimizer (Sybyl 8.1). The maximum iteration steps, energy gradient and long-distance cutoff were set to 5000 times, 0.05 kcal/mol·Å and 8 Å, respectively. A total of 166 VolSurf descriptors were generated by all 9 probes. In order to remove redundant variables, SMR was used for VolSurf feature selection, of which the entry and removal probabilities were set to 0.05 and 0.1. Then, the candidate variable subsets were employed for PLS modeling.
3.2. Partial Least Squares Regression
Partial least squares, developed by Herman O. A. Wold and Svante Wold [43], is a projection space-based statistical method that combines principal component analysis (PCA) [44] and multiple linear regression (MLR) and today widely used in the fields of chemometrics bioinformatics, sensometrics and neuroscience. In PLS, both the X and the Y variables are bilinearly decomposed and projected into a new principal component space (Equations (1) and (2)).
where, T and P are the score and loading matrices of X; U and C are score and weight matrices of Y. E and G are the residual matrices. The aim of PLS is to find a linear relationship between X and Y, so that the scores of X matrix are good predictors of Y (Equation (3)),
where F is the residual matrix of Y. For more details, please refer to references [45,46]. In this paper, the target variable (koff) was negative logarithm transformed before PLS modeling. Herein, the RMSE (Equation (4)) and MAPE (Equation (5)) were used for model validation, of which the ŷi and yi represented the predicted and experimental −log(koff) values, respectively.
X = TPT + E
Y = UCT + G
Y = TCT + F
4. Conclusions
As we know, the 3D-grid-based VolSurf method has been specifically proposed to quantitatively predict pharmacokinetic properties, e.g., membrane permeation, transport and biotransformation, etc. However, in a recent research, we found that it can be also used for predicting the pharmacodynamics properties such as dissociation rate constants (koff), which are also closely related to the molecular surface properties. In this study, we carried out in-depth studies by using the VolSurf method for predicting the ligand dissociation rate of heat shock protein 90α, A1AR and p38 mitogen-activated protein kinase. From the PLS modeling results, it can be concluded that few VolSurf descriptors can extract efficiently key molecular surface properties related to the dissociation rate, and the resulting PLS models are proved be robust and predictive. Although the MD-based and “COMBINE” strategies achieved equivalent or even better prediction performances, both of the strategies depend heavily on the energy-minimized structures of the ligand-receptor complexes and the results of which are hardly to be reproduced. By contrast, the VolSurf-based method requires only the information of chemical ligands and can provide fast and accurate predictions on the kinetic properties, which is extremely useful in virtual screening researches. However, due to the complexity in the ligand dissociation process, there are still a lot of questions that remain further researches.
Supplementary Materials
The following are available online at https://www.mdpi.com/1422-0067/21/7/2456/s1, Table S1: The definitions of the involved VolSurf variables, Table S2: The koff values of 52 HSP inhibitors, Table S3: The koff values of 49 non-redundant HSP inhibitors, Table S4: The koff values of 46 A1AR ligands, Table S5: The koff values of 28 p38 MAPK inhibitors.
Author Contributions
Formal analysis, S.H. and L.C.; Funding acquisition, H.M. and X.P.; Methodology, D.Z. and T.S.; Resources, D.Z., Z.K., Y.H. and L.X.; Writing—original draft, S.H.; Writing—review & editing, H.M. and X.P. All authors have read and agreed to the published version of the manuscript.
Funding
The authors acknowledge the support of the Fundamental Research Funds for the Central Universities (Project No.106112017CDJQJ238816), the Collaborative Fund of Science and Technology Agency of Luzhou Government and Southwest Medical University (Project No.2016LZXNYD-J19) and the Graduate Scientific Research and Innovation Foundation of Chongqing (Project No. CYB19042).
Conflicts of Interest
The authors declare no conflict of interest.
References
- De Benedetti, P.G.; Fanelli, F. Computational modeling approaches to quantitative structure-binding kinetics relationships in drug discovery. Drug Discov. Today 2018, 23, 1396–1406. [Google Scholar] [CrossRef] [PubMed]
- Copeland, R.A. Drug-target interaction kinetics: Underutilized in drug optimization? Future Med. Chem. 2016, 8, 2173–2175. [Google Scholar] [CrossRef] [PubMed]
- Schoop, A.; Dey, F. On-rate based optimization of structure-kinetic relationship--surfing the kinetic map. Drug Discov. Today Technol 2015, 17, 9–15. [Google Scholar] [CrossRef] [PubMed]
- Copeland, R.A.; Pompliano, D.L.; Meek, T.D. Drug-target residence time and its implications for lead optimization. Nat. Rev. Drug Discov. 2006, 5, 730–739. [Google Scholar] [CrossRef] [PubMed]
- Tummino, P.J.; Copeland, R.A. Residence time of receptor-ligand complexes and its effect on biological function. Biochemistry 2008, 47, 5481–5492. [Google Scholar] [CrossRef] [PubMed]
- Couffinhoarau, A.C.; Aubertin, A.M.; Boustta, M.; Schmidt, S.; Fehrentz, J.A.; Martinez, J.; Vert, M. Peptide−Poly(l-lysine citramide) Conjugates and their In Vitro Anti-HIV Behavior. Biomacromolecules 2009, 10, 865–876. [Google Scholar] [CrossRef]
- Delille, C.A.; Pruett, S.T.; Marconi, V.C.; Lennox, J.L.; Armstrong, W.S.; Arrendale, R.F.; Sheth, A.N.; Easley, K.A.; Acosta, E.P.; Vunnava, A.; et al. Effect of protein binding on unbound atazanavir and darunavir cerebrospinal fluid concentrations. J. Clin. Pharmacol. 2014, 54, 1063–1071. [Google Scholar] [CrossRef]
- Esseghaier, C.; Ng, A.; Zourob, M. A novel and rapid assay for HIV-1 protease detection using magnetic bead mediation. Biosens. Bioelectron. 2013, 41, 335–341. [Google Scholar] [CrossRef]
- Ershov, P.V.; Gnedenko, O.V.; Mol’nar, A.A.; Lisitsa, A.V.; Ivanov, A.S.; Archakov, A.I. Thermodynamic analysis of dimerization inhibitors binding to HIV protease monomers. Biomed. Khim 2012, 58, 43–49. [Google Scholar] [CrossRef]
- Kokh, D.B.; Amaral, M.; Bomke, J.; Grädler, U.; Musil, D.; Buchstaller, H.-P.; Dreyer, M.K.; Frech, M.; Lowinski, M.; Vallee, F.; et al. Estimation of Drug-Target Residence Times by τ-Random Acceleration Molecular Dynamics Simulations. J. Chem. Theory Comput. 2018, 14, 3859–3869. [Google Scholar] [CrossRef]
- Kokh, D.B.; Kaufmann, T.; Kister, B.; Wade, R.C. Machine Learning Analysis of τRAMD Trajectories to Decipher Molecular Determinants of Drug-Target Residence Times. Front. Mol. Biosci. 2019, 6, 36. [Google Scholar] [CrossRef] [PubMed]
- Ganotra, G.K.; Wade, R.C. Prediction of Drug-Target Binding Kinetics by Comparative Binding Energy Analysis. ACS Med. Chem. Lett. 2018, 9, 1134–1139. [Google Scholar] [CrossRef] [PubMed]
- Chiu, S.H.; Xie, L. Toward High-Throughput Predictive Modeling of Protein Binding/Unbinding Kinetics. J. Chem. Inf. Model. 2016, 56, 1164–1174. [Google Scholar] [CrossRef] [PubMed]
- Huang, S.H.; Zhang, D.; Mei, H.; Kevin, M.; Qu, S.J.; Pan, X.C.; Lu, L.C. SMD-Based Interaction-Energy Fingerprints Can Predict Accurately the Dissociation Rate Constants of HIV-1 Protease Inhibitors. J. Chem. Inf. Model. 2019, 59, 159–169. [Google Scholar] [CrossRef] [PubMed]
- Zhang, D.; Huang, S.; Mei, H.; Chen, L.; Kevin, M.; Shi, T. Protein–ligand interaction fingerprints for accurate prediction of dissociation rates of p38 MAPK Type II inhibitors. Integr. Biol. 2019, 11, 53–60. [Google Scholar] [CrossRef] [PubMed]
- Qu, S.J.; Huang, S.H.; Pang, X.C.; Yang, L.; Mei, H. Constructing Interconsistent, Reasonable, and Predictive Models for Both the Kinetic and Thermodynamic Properties of HIV-1 Protease Inhibitors. J. Chem. Inf. Model. 2016, 56, 2061–2068. [Google Scholar] [CrossRef] [PubMed]
- Pratt, W.B. The hsp90-based chaperone system: Involvement in signal transduction from a variety of hormone and growth factor receptors. Proc. Soc. Exp. Biol. Med. 1998, 217, 420–434. [Google Scholar] [CrossRef] [PubMed]
- Pearl, L.H.; Prodromou, C. Structure and in vivo function of Hsp90. Curr. Opin. Struct. Biol. 2000, 10, 46–51. [Google Scholar] [CrossRef]
- Kamal, A.; Thao, L.; Sensintaffar, J.; Zhang, L.; Boehm, M.F.; Fritz, L.C.; Burrows, F.J. A high-affinity conformation of Hsp90 confers tumour selectivity on Hsp90 inhibitors. Nature 2003, 425, 407–410. [Google Scholar] [CrossRef]
- Schuetz, D.A.; Richter, L.; Arnaral, M.; Grandits, M.; Gradler, U.; Musil, D.; Buchstaller, H.P.; Eggenweiler, H.M.; Frech, M.; Ecker, G.F. Ligand Desolvation Steers On-Rate and Impacts Drug Residence Time of Heat Shock Protein 90 (Hsp90) Inhibitors. J. Med. Chem. 2018, 61, 4397–4411. [Google Scholar] [CrossRef]
- Amaral, M.; Kokh, D.B.; Bomke, J.; Wegener, A.; Buchstaller, H.P.; Eggenweiler, H.M.; Matias, P.; Sirrenberg, C.; Wade, R.C.; Frech, M. Protein conformational flexibility modulates kinetics and thermodynamics of drug binding. Nat. Commun. 2017, 8, 2276. [Google Scholar] [CrossRef] [PubMed]
- Sheth, S.; Brito, R.; Mukherjea, D.; Rybak, L.P.; Ramkumar, V. Adenosine Receptors: Expression, Function and Regulation. Int. J. Mol. Sci. 2014, 15, 2024–2052. [Google Scholar] [CrossRef] [PubMed]
- Fredholm, B.B.; IJzerman, A.P.; Jacobson, K.A.; Linden, J.; Muller, C.E. International Union of Basic and Clinical Pharmacology. LXXXI. Nomenclature and Classification of Adenosine Receptors-An Update. Pharmacol. Rev. 2011, 63, 1–34. [Google Scholar] [CrossRef] [PubMed]
- Guo, D.; van Dorp, E.J.H.; Mulder-Krieger, T.; van Veldhoven, J.P.D.; Brussee, J.; IJzerman, A.P.; Heitman, L.H. Dual-Point Competition Association Assay: A Fast and High-Throughput Kinetic Screening Method for Assessing Ligand-Receptor Binding Kinetics. J Biomol. Screen 2013, 18, 309–320. [Google Scholar] [CrossRef]
- Louvel, J.; Guo, D.; Agliardi, M.; Mocking, T.A.M.; Kars, R.; Pham, T.P.; Xia, L.Z.; de Vries, H.; Brussee, J.; Heitman, L.H.; et al. Agonists for the Adenosine A(1) Receptor with Tunable Residence Time. A Case for Nonribose 4-Amino-6-aryl-5-cyano-2-thiopyrimidines. J. Med. Chem. 2014, 57, 3213–3222. [Google Scholar] [CrossRef]
- Louvel, J.; Guo, D.; Soethoudt, M.; Mocking, T.A.M.; Lenselink, E.B.; Mulder-Krieger, T.; Heitman, L.H.; Ijzerman, A.P. Structure-kinetics relationships of Capadenoson derivatives as adenosine A(1) receptor agonists. Eur. J. Med. Chem. 2015, 101, 681–691. [Google Scholar] [CrossRef]
- Xia, L.Z.; de Vries, H.; IJzerman, A.P.; Heitman, L.H. Scintillation proximity assay (SPA) as a new approach to determine a ligand’s kinetic profile. A case in point for the adenosine A(1) receptor. Purinerg Signal 2016, 12, 115–126. [Google Scholar] [CrossRef]
- Guo, D.; Heitman, L.H.; IJzerman, A.P. Kinetic Aspects of the Interaction between Ligand and G Protein-Coupled Receptor: The Case of the Adenosine Receptors. Chem. Rev. 2017, 117, 38–66. [Google Scholar] [CrossRef]
- Cuenda, A.; Rousseau, S. P38 MAP-Kinases pathway regulation, function and role in human diseases. Bba Mol. Cell Res. 2007, 1773, 1358–1375. [Google Scholar] [CrossRef]
- Thalhamer, T.; McGrath, M.A.; Harnett, M.M. MAPKs and their relevance to arthritis and inflammation. Rheumatology 2008, 47, 409–414. [Google Scholar] [CrossRef]
- Olson, J.M.; Hallahan, A.R. p38 MAP kinase: A convergence point in cancer therapy. Trends Mol. Med. 2004, 10, 125–129. [Google Scholar] [CrossRef] [PubMed]
- Thurmond, R.L.; Wadsworth, S.A.; Schafer, P.H.; Zivin, R.A.; Siekierka, J.J. Kinetics of small molecule inhibitor binding to p38 kinase. Eur. J. Biochem. 2001, 268, 5747–5754. [Google Scholar] [CrossRef] [PubMed]
- Regan, J.; Pargellis, C.A.; Cirillo, P.F.; Gilmore, T.; Hickey, E.R.; Peet, G.W.; Proto, A.; Swinamer, A.; Moss, N. The kinetics of binding to p38MAP kinase by analogues of BIRB 796. Bioorg. Med. Chem. Lett. 2003, 13, 3101–3104. [Google Scholar] [CrossRef]
- Millan, D.S.; Bunnage, M.E.; Burrows, J.L.; Butcher, K.J.; Dodd, P.G.; Evans, T.J.; Fairman, D.A.; Hughes, S.J.; Kilty, I.C.; Lemaitre, A.; et al. Design and Synthesis of Inhaled p38 Inhibitors for the Treatment of Chronic Obstructive Pulmonary Disease. J. Med. Chem. 2011, 54, 7797–7814. [Google Scholar] [CrossRef]
- Redhead, M.; Satchell, R.; Morkunaite, V.; Swift, D.; Petrauskas, V.; Golding, E.; Onions, S.; Matulis, D.; Unitt, J. A combinatorial biophysical approach; FTSA and SPR for identifying small molecule ligands and PAINs. Anal. Biochem. 2015, 479, 63–73. [Google Scholar] [CrossRef]
- Braka, A.; Garnier, N.; Bonnet, P.; Aci-Sèche, S. Residence Time Prediction of Type 1 and 2 Kinase Inhibitors from Unbinding Simulations. J. Chem. Inf. Model. 2020, 60, 342–348. [Google Scholar] [CrossRef]
- You, W.; Chang, C.-e.A. Role of Molecular Interactions and Protein Rearrangement in the Dissociation Kinetics of p38α MAP Kinase Type-I/II/III Inhibitors. J. Chem. Inf. Model. 2018, 58, 968–981. [Google Scholar] [CrossRef]
- Cruciani, C.; Crivori, P.; Carrupt, P.A.; Testa, B. Molecular fields in quantitative structure-permeation relationships: The VolSurf approach. J. Mol. Struct. Theochem. 2000, 503, 17–30. [Google Scholar] [CrossRef]
- Cruciani, G.; Pastor, M.; Guba, W. VolSurf: A new tool for the pharmacokinetic optimization of lead compounds. Eur. J. Pharm. Sci. 2000, 11, S29–S39. [Google Scholar] [CrossRef]
- Zamora, I.; Oprea, T.; Cruciani, G.; Pastor, M.; Ungell, A.L. Surface descriptors for protein-ligand affinity prediction. J. Med. Chem. 2003, 46, 25–33. [Google Scholar] [CrossRef]
- Tintori, C.; Magnani, M.; Schenone, S.; Botta, M. Docking, 3D-QSAR studies and in silico ADME prediction on c-Src tyrosine kinase inhibitors. Eur. J. Med. Chem. 2009, 44, 990–1000. [Google Scholar] [CrossRef] [PubMed]
- Ermondi, G.; Caron, G.; Pintos, I.G.; Gerbaldo, M.; Perez, M.; Perez, D.I.; Gandara, Z.; Martinez, A.; Gomez, G.; Fall, Y. An application of two MIFs-based tools (Volsurf plus and Pentacle) to binary QSAR: The case of a palinurin-related data set of non-ATP competitive Glycogen Synthase Kinase 3 beta (GSK-3 beta) inhibitors. Eur. J. Med. Chem. 2011, 46, 860–869. [Google Scholar] [CrossRef] [PubMed]
- Wold, S. Cross-Validatory Estimation of the Number of Components in Factor and Principal Components Models. Technometrics 1978, 20, 397–405. [Google Scholar] [CrossRef]
- Pearson, K. On lines and planes of closest fit to systems of points in space. Philos Mag. 1901, 2, 559–572. [Google Scholar] [CrossRef]
- Geladi, P.; Kowalski, B.R. Partial Least-Squares Regression: A Tutorial. Anal. Chim. Acta 1986, 185, 1–17. [Google Scholar] [CrossRef]
- Wold, S.; Sjostrom, M.; Eriksson, L. PLS-regression: A basic tool of chemometrics. Chemom. Intell. Lab. 2001, 58, 109–130. [Google Scholar] [CrossRef]


© 2020 by the authors. Licensee MDPI, Basel, Switzerland. This article is an open access article distributed under the terms and conditions of the Creative Commons Attribution (CC BY) license (http://creativecommons.org/licenses/by/4.0/).