Abstract
Alzheimer’s disease (AD) is a progressive neurodegenerative disease. Herbal medicine may provide efficacious treatments for its prevention and/or cure. This study investigated whether a 70% ethanol extract of Tetragonia tetragonioides Kuntze (TTK; New Zealand spinach) improved the memory deficit by reducing hippocampal amyloid-β deposition and modulating the gut microbiota in rats with amyloid-β(25–35) infused into the hippocampus (AD rats) in an AD animal model. The AD rats had cellulose (AD-CON) or TTK (300 mg/kg bw; AD-TTK) in their high-fat diets for seven weeks. Rats with amyloid-β(35–25) infused into the hippocampus fed an AD-Con diet did not have memory loss (Normal-Con). AD-TTK protected against amyloid-β deposition compared to AD-Con, but it was higher than Normal-Con. AD-TTK protected against short-term and special memory loss measured by passive avoidance, Y maze, and water maze, compared to AD-Con. Compared to the Normal-Con, AD-Con attenuated hippocampal pCREB → pAkt → pGSK-3β, which was prevented in the AD-TTK group. Brain-derived neurotrophic factor (BDNF) and ciliary neurotrophic factor (CNTF) mRNA expression decreased in the AD-CON group, and their expression was prevented in the AD-TTK group. Hippocampal TNF-α and IL-1β mRNA expressions were higher in the AD-Con group than in the Normal-Con, and AD-TTK groups protected against the increase in their expression. The AD-CON group showed an increase in insulin resistance compared to the Normal-Con group and the AD-TTK group showed improvement. AD-Con separated the gut microbiome community compared to the Normal-Con group and AD-TTK overlapped with the normal-Con. The AD-Con group had more Clostridiales, Erysipelotrichales, and Desulfovibrionales than the AD-TKK and Normal-Con group but fewer Lactobacilales and Bacteroidales. In conclusion, the 70% ethanol extract of TTK enhanced the memory function and potentiated hippocampal insulin signaling, reduced insulin resistance, and improved gut microbiota in amyloid-β-infused rats.
1. Introduction
Alzheimer’s disease (AD) is characterized by neurodegeneration manifesting as progressive memory decline and cognitive dysfunction []. AD is involved in the fibrilization of amyloid-β and tau in the brain, especially the hippocampus. Recently, α-synuclein was reported to contribute to their fibrilization []. Increased brain insulin resistance, neuroinflammation, and oxidative stress are involved in neurodegeneration. Brain insulin resistance impairs the carbohydrate and fat metabolism to activate GSK-3β by attenuating the phosphorylation of Akt (PKB, protein kinase B) and glycogen-synthase kinase (GSK)-3β []. An increase in brain insulin resistance promotes the phosphorylation of Tau to elevate amyloid-3b accumulation []. This process is promoted by neuroinflammation and oxidative stress. Microglia activation releases inflammatory cytokines, including tumor necrosis factor (TNF)-α and interleukin (IL)-1β, which initiate neurodegeneration to cause the progression of Alzheimer’s disease []. In addition to neuroinflammation, increased oxidative stress is involved in amyloid-β accumulation [], which is induced by hypoxia, ischemia, and insulin resistance. Neurodegeneration in Alzheimer’s disease is associated with increased insulin resistance, inflammation, and oxidative stress in the brain []. Therefore, their reduction can be a target for the treatment of Alzheimer’s disease.
The gut–liver–brain axis is involved in insulin resistance and inflammation in the brain []. The impairment of the liver–brain and gut–brain axis promotes brain insulin resistance and neuroinflammation []. The dysbiosis of gut microbiota is associated with systemic proinflammation that potentiates neuroinflammation, brain edema, and, ultimately, neuronal dysfunction [,]. The proportion of E. coli increases in AD patients and in a transgenic human amyloid precursor protein/presenilin 1 (APP/PS1) mouse model of AD, whereas that of Lactobacillus decreases []. The high ratio of Acidobacteria and Bifidobacterium reduces AD progression significantly in AD mice []. The increased production of butyrate by Clostridium butyricum in the gut reduces the proinflammatory cytokines to have protective activity against liver and brain damage []. The changes in the gut microbiome increase butyrate production and decrease proinflammatory cytokines, which helps impede AD development and progression []. Gut microbes also enable the production of most neurotransmitters in the human brain []. Dietary fibers and glycated polyphenols influence the composition of the gut microbiota by metabolizing the varieties of glycans to use for energy to increase the gut microbiota. Polyphenol aglycans are also metabolized by fecal bacteria to modulate the bioavailability. Thus, herbal extracts can enhance the gut–liver–brain axis to protect against memory loss.
Tetragonia tetragonioides Kuntze, also called New Zealand spinach, reduces inflammation and improves the gastrointestinal function [,]. It contains phospholipids, vitamin A, vitamin B complex, and pectic polysaccharides. A previous study from our research team showed that a 70% ethanol extract of Tetragonia tetragonioides grown in Jeju Island contains 5.88 mg total polyphenol, 4.34 mg total flavonoids, and 0.32 µg caffeic acid per g extract []. Its pectic polysaccharides are composed of homogalacturonan (64.4%) and rhamnogalacturonan I (5.8%), with side chains of arabinan (8.1%), galactan (2.2%), and type II arabinogalactan (7.1%) []. Pectin promotes the growth of Bacteroides. Guar gum intake for six weeks increased the serum butyrate concentrations when a high-fat diet decreased them []. Different dietary fibers may modulate gut microbiota differently to produce different short-chain fatty acids. Tetragonia tetragonioides Kuntze consumption may improve insulin resistance by changing the gut microbiota. Here, it was hypothesized that Tetragonia tetragonioides Kuntze intake improves the memory deficit by reducing amyloid-β deposition in the hippocampus, and it modulated the gut microbiota in an Alzheimer’s disease animal model. The hypothesis was examined in rats infused with amyloid-β (32–42) in the hippocampus.
2. Results
2.1. TTK Extracts in Neural Cell Survival in Vitro
The cell viability in nerve growth factor (NGF)-treated PC12 cells was examined after administering amyloid-β(25–35) and mRNA expression of neuronal trophic factors. The cell viability was lowered in the AD-control with administering amyloid-β(25–35) than the normal-control with administering amyloid-β(35–25) in NGF-treated PC12 cells (Figure 1A). The high dose of 70% ethanol TTK extract (TTK-E) and water TTK extract (TTK-W) elevated cell viability compared to the AD-control, but a high dosage of TTK-E increased the cell viability the most (Figure 1A).

Figure 1.
Cell survival and expression of brain growth factors in the nerve growth factor-administered PC12 cells. The cells had treatments with 70% ethanol Tetragonia tetragonioides or its water extract with 10 and 50 μg/mL dosages, and after 1 h, cell death was induced by 10 μM amyloid-β(25–35). After 24 h treatment, 3-(4,5-dimethylthiazol-2-yl)-2,5-diphenyltetrazolium bromide (MTT) assay and mRNA expression were measured. Amyloid-β(25–35) was administered without Tetragonia tetragonioides Kuntze (TTK) extract (AD-Con), ethanol extract (TTK-E), or water extract (TTK-W), and 10 μM amyloid-β(35–25) was administered without TTK extract (Normal-Con). (A) Cell survival determined by MTT assay. (B) Brain-derived neurotrophic factor (BDNF) mRNA expression. (C) Ciliary neurotrophic factor (CNTF) mRNA expression. (D) Tau mRNA expression. The units for mRNA expression were fold-changes of mRNA expression from the control. Each value represents the mean ± SD (n = 3). # Significantly different among the groups in one-way ANOVA at p < 0.05, ## p < 0.01, and ### p < 0.001. * Significantly different from AD-Con at p < 0.05, ** p < 0.01, and *** p < 0.001 in the Tukey test. † Significantly different from the Normal-Con at p < 0.05 and †† at p < 0.01 in the Tukey test.
The mRNA expression of BDNF and ciliary neurotrophic factor (CNTF) in PC12 cells was lower in the AD-Con group than the Normal-Con group, and the high dosage of TTK-E and TTK-W prevented the decrease in BDNF and CNTF by amyloid-β(25–35) (Figure 1B,C). TTK-E produced higher mRNA expression of BDNF and CNTF than TTK-W. A high dosage of TTK-E exhibited a similar mRNA expression of CNTF as the Normal-Con group (Figure 1B,C). Furthermore, mRNA expression of Tau, the enhancer of amyloid-β aggregation, was higher in the AD-Con than the Normal-Con (Figure 1D). TTK decreased Tau mRNA expression, and TTK-E lowered it more than TTK-W (Figure 1D).
2.2. Bodyweight and Serum Glucose and Insulin Concentrations
Rats had amyloid-β(25–35) infusion into the intra-CA1 to induce AD, and they were fed a high-fat diet with TTK (AD-TTK) or dextrin (AD-Con), whereas rats with amyloid-β(35–25) infusion were fed the same as AD-Con. The experimental design was presented in Figure 2. The final body weight and weight gain during the experimental period were similar in all groups (Table 1). No significant differences in food intake were observed among the three groups. The fasting serum glucose and insulin concentrations were similar among the groups (Table 1).
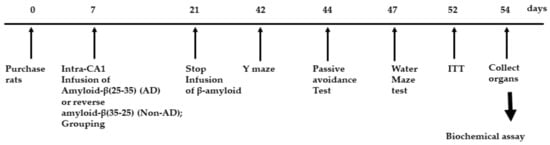
Figure 2.
Experimental design. Groups included were 1) AD-Con fed 45% fat diet with 0.5% dextrin in Alzheimer’s disease (AD) rats having the intra-CA1 infusion of amyloid-β(25–35), 2) AD-TTK fed 45% fat diet with 0.5% water extract of Tetragonia tetragonioides (TTK) in AD rats, and 3) Normal-Con fed 45% fat diet with 0.5% dextrin in non-AD rats having the intra-CA1 infusion of amyloid-β(35–25).

Table 1.
Body weight and glucose metabolism at the end of experimental periods.
2.3. Memory Impairment
Short-term memory impairment was determined by passive avoidance, and the Y and water maze tests (Figure 3). In the passive avoidance test, rats in the AD-Con group had higher latency at the 2nd trial than those in the other groups (Figure 3A). In the 3rd trial, the latency was delayed in the ascending order of AD-Con, AD-TTK, and Normal-Con groups. A higher latency indicated better short-term memory. During the Y maze test, the percentage of a right turn in the total turns was lower in the AD-Con, AD-TTK, and Normal-Con groups, indicating that the AD-TTK group improved impaired short-term memory in AD rats (Figure 3B). In the water maze, the rats experienced to find the platform at zone 5 in two sequential days and on the 5th day, the rats tried to find zone 5 where the platform existed (Figure 3C). The duration to stay in zone 5 to find the platform was lower in the AD-Con group than the Normal-Con group, and the AD-TTK group showed a middle value of AD-Con and Normal-Con with no significant difference. However, the frequencies to visit zone 5 were lower in the AD-TTK group than the AD-Con group and those in the AD-TTK were similar to the Normal-Con (Figure 3C). The latency time to the first visit to zone 5 was shorter in the AD-TTK group than the AD-Con group. The latency time in the AD-TTK group was similar to that in the Normal-Con group.
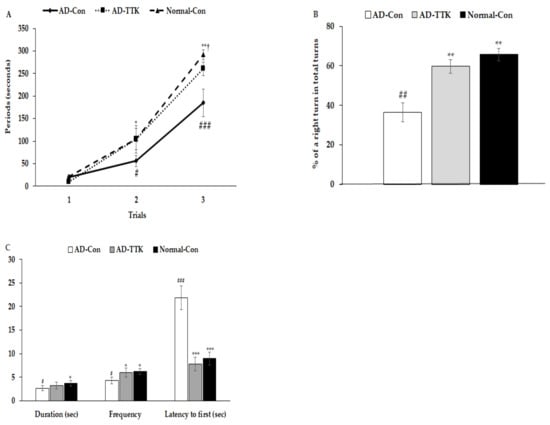
Figure 3.
Memory deficit of rats with an amyloid-β infusion. (A) Latency time to enter the dark-room in passive avoidance test. (B) The percentage of the right turn in total turns. (C) Frequencies to visit the zone where the platform was located, duration to stay in the zone, and the latency to visit the zone at first. AD and Non-AD rats infused amyloid-β(25–35) into the CA1 regions and amyloid-β(35–25) into the CA1 regions, respectively. AD-Con fed 45% fat diet with 0.5% dextrin in AD rats infused intra-CA1 infusion of amyloid-β(25–35), AD-TTK fed 45% fat diet with 0.5% water extract of Tetragonia tetragonioides (TTK) in AD rats, and Normal-Con fed 45% fat diet with 0.5% dextrin in non-AD rats infused intra-CA1 infusion of amyloid-β(35–25). # Significantly different among the groups in one-way ANOVA at p < 0.05, ## p < 0.01, and ### p < 0.001. * Significantly different from AD-Con at p < 0.05, ** p < 0.01, and *** p < 0.001 in the Tukey test. † Significantly different from the Normal-Con at p < 0.05 in the Tukey test.
2.4. Amyloid-β Accumulation in the Hippocampus
Amyloid-β deposition in the hippocampus of the AD-TTK was much lower than in that of AD-Con, but there was no deposition in the Normal-Con (Figure 4A). BDNF and CNTF expressions play a crucial role in the survival of brain cells. BDNF mRNA expression was much lower in the AD-Con than the Normal-Con, and the expression increased in the AD-TKK group but not as much as the normal control (Figure 4B). CNTF mRNA expression had a similar pattern of BDNF. Tau mRNA expression was lower in the AD-TTK group than in the AD-Con group, but the protection of Tau mRNA expression by AD-TTK did not reach the Normal-Con (Figure 4C). The hippocampal mRNA expression of TNF-α and IL-1β involved in neuroinflammation was lower in the AD-TTK group than the AD-Con, and their expression in the AD-TTK was similar to the Normal-Con group (Figure 4C). These results suggested that TTK reduced the expression of neuroinflammatory cytokines and elevated the neurotrophic factors to protect against neuronal cell death, which leads to memory deficits.
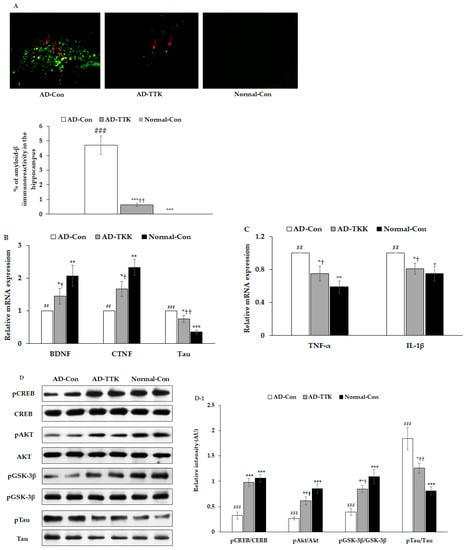
Figure 4.
Amyloid-β deposition, expression of brain growth factor and neuroinflammation and insulin signaling in the hippocampus. (A) Amyloid-β accumulation in the hippocampus by immunohistochemistry staining with amyloid-β antibody (X200). Green fluorescent dots indicated the amyloid-β staining. (B) Hippocampal mRNA expression of BDNF, CNTF, and Tau. (C) Hippocampal mRNA expression of TNF-α and IL-1β. (D,D-1) Hippocampal insulin signaling and its intensity measured by an image analyzer. AD-Con fed 45% fat diet with 0.5% dextrin in AD rats infused intra-CA1 infusion of amyloid-β(25–35), AD-TTK fed 45% fat diet with 0.5% water extract of Tetragonia tetragonioides (TTK) in AD rats, and Normal-Con fed 45% fat diet with 0.5% dextrin in non-AD rats infused intra-CA1 infusion of amyloid-β(35–25). Each bar represents Means ± SD (n = 4). # Significantly different among the groups in one-way ANOVA at p < 0.05, ## p < 0.01 and ### p < 0.001. * Significantly different from AD-Con at p < 0.05, ** p < 0.01, and *** p < 0.001 in the Tukey test. † Significantly different from the Normal-Con at p < 0.05 and ††p < 0.01 in the Tukey test.
The amyloid-β deposition has an association with the attenuation of hippocampal insulin signaling, which stimulates tau phosphorylation. In the present study, the AD-Con group showed reduced phosphorylated cAMP responding element-binding protein (pCREB), pAkt, and pGSK-3β phosphorylation in the hippocampus, and AD-TTK inhibited their reduction (Figure 4D,D-1). According to the changes in hippocampal insulin signaling, AD-TTK suppressed tau phosphorylation in the hippocampus, which increased in the AD-Con group (Figure 4D,D-1). The Tau protein content was decreased in the AD-TTK-treated group compared to the AD-Con group (Figure 4D,D-1).
2.5. Insulin Resistance
After 6 h of food deprivation, the serum glucose concentrations were higher in the AD-Con group than the Normal-Con group, and AD-TKK exhibited similar serum glucose concentrations. After an intraperitoneal injection of 1 IU/kg bw insulin, they were markedly lower until 45 min, and they decreased slowly from 45 min in all groups (Figure 5A). The AD-TTK group had lower serum glucose concentrations than the AD-Con group but higher than the Normal-Con group. The area under the curve (AUC) of the 1st and 2nd parts after the insulin injection was much higher in the AD-Con group than the Normal-Con group. AD-TKK had was significantly lower in AD-Con in the 1st part but not in the 2nd part (Figure 5B). These results indicated that systemic insulin resistance increased in the AD-Con group, and the AD-TTK group showed an increase in systemic insulin resistance, which might be associated with brain insulin resistance.

Figure 5.
Systemic insulin resistance measured by intraperitoneal insulin tolerance test. After 6 h of food deprivation, serum glucose levels were measured at an assigned time after intraperitoneally insulin injection. (A) Changes of serum glucose concentrations. (B) The area under the curve (AUC) of glucose calculated in the first (0–30 min) and second phases (30–90 min). AD-Con fed 45% fat diet with 0.5% dextrin in AD rats infused intra-CA1 infusion of amyloid-β(25–35), AD-TTK fed 45% fat diet with 0.5% water extract of Tetragonia tetragonioides (TTK) in AD rats, and Normal-Con fed 45% fat diet with 0.5% dextrin in non-AD rats infused intra-CA1 infusion of amyloid-β(35–25). Each dot and bar represent Mean ± SD (n = 10). # Significantly different among the groups in one-way ANOVA at p < 0.05 and ## p < 0.01. * Significantly different from AD-Con at p < 0.05 and ** p < 0.01 in the Tukey test. † Significantly different from the Normal-Con at p < 0.05 in the Tukey test.
2.6. Gut Microbiome
Principal coordinate analysis (PCoA) showed the clustering of the gut bacterial community (Figure 6A). The bacterial clustering of the AD-Con and Normal-Con groups showed significant separation, and that of the AD-TTK and AD-Con groups were also separated in PcoA analysis (Figure 6A). On the other hand, the bacterial clustering of the AD-TTK and Normal-Con groups overlapped. The fecal bacterial communities were significantly different among the groups according to an analysis of the molecular variance (AMOVA; p < 0.01; Figure 6B). The bacterial distribution increased Erysipelotrichales, Clostridiales, Desulfovibrionales, and Enterobacteriales in the AD-CON compared to the Normal-Con, and AD-TTK protected against their increase in AD-CON (Figure 6C). The percentage of Bacteroidales and Lactobacillales decreased in the AD-Con compare to the Normal-Con, and the decrease was prevented by AD-TKK (Figure 6D).
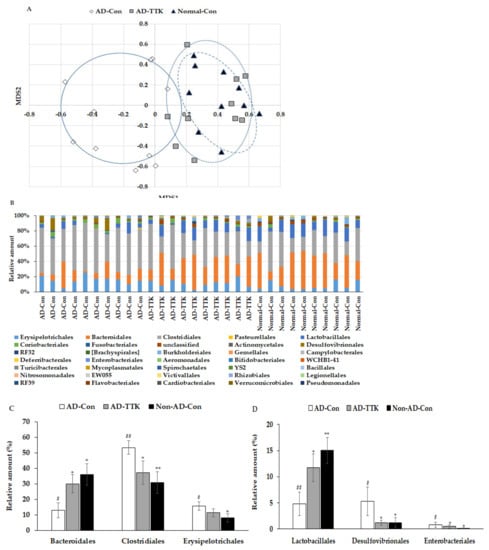
Figure 6.
Profiles of gut microbiomes. At the end of the experiment, feces were collected from the cecum, and the bacterial DNA was analyzed using the next generation sequencing method. (A) Principal coordinate analysis (PCoA) of fecal bacteria. (B) Relative amount (%) of fecal bacteria in the [order] level. (C) Relative amount (%) of Bacteriodales, Clostridales, and Erysipelotrichales in the cecum. (D) Relative amount (%) of Lactobacillales, Desulfovibrionales, and Enterobacteriales in the cecum. AD-Con fed 45% fat diet with 0.5% dextrin in AD rats infused intra-CA1 infusion of amyloid-β(25–35), AD-TTK fed 45% fat diet with 0.5% water extract of Tetragonia tetragonioides (TTK) in AD rats, and Normal-Con fed 45% fat diet with 0.5% dextrin in non-AD rats infused intra-CA1 infusion of amyloid-β(35–25). Each value represents the mean ± SD of five mice in each group. # Significantly different among the groups in one-way ANOVA at p < 0.05 and ## p < 0.01. * Significantly different from AD-Con at p < 0.05, ** p < 0.01, and *** p < 0.001 in the Tukey test. † Significantly different from the Normal-Con at p < 0.05 in the Tukey test.
3. Discussion
The prevalence of AD is increasing as life expectancy is expanding. When AD is progressing, it is difficult to reverse the progression. AD needs to be prevented by regularly consuming foods. New Zealand spinach grows in the sandy shorelines and bluffs in Australia and New Zealand, and it is also found in Jeju Island. It is an edible vegetable that is high in vitamin K, vitamin B6 and C, and manganese. The plant contains phenolic compounds, including mainly flavonol glycosides and lignan amides [,,]. In our previous studies, TTK was found rich in polyphenol (5.88 ± 0.32 mg/g) and flavonoids (4.34 ± 0.23 mg/g), and 6-methoxy-kaempferol-3-O-β-d-glucosyl(1‴ → 2″)-β-d-glucopyranosyl-(6″″-(E)-caffeoyl)-7-O-β-d-glucopyranoside (0.53 ± 0.003 mg/g), 6-methoxy-flavonols (2–53 mg/g), and caffeic acid (0.32 ± 0.01) were detected as index compounds [,,]. TTK was reported to prevent obesity and hyperuricemia in obese mice induced by a high-fat diet [], improve the energy and glucose metabolism in estrogen-deficient rats [], and increase the anti-inflammatory activity []. Moreover, it has antidepressant activity with increasing serotonin concentrations by decreasing the serotonin reuptake activity []. These results suggest that TTK might improve the memory deficit induced by neuroinflammation and insulin resistance. This study showed that TTK enhanced memory function with potentiated hippocampal insulin signaling, reduced insulin resistance, and improved gut microbiota in amyloid-β infused rats in an AD animal model.
The etiology of AD remains unclear, even though the neurodegenerative diseases, including AD, are the major causes of dementia. Amyloid-β (Aβ) is circulated in the interstitial fluid, and its reduced perivascular clearance and increased aggregation accelerate amyloid-β deposition in the brain []. The amyloid-β accumulation is involved in tau protein leading to AD onset and propagation []. Tau is spread into the AD brain by trans-synaptic transfer between neurons. Extracellular tau protein triggers neurodegeneration by tangling with amyloid-β in the brain and serves as a biomarker for AD []. APOE4 is associated with an increased risk for AD by tau-mediated neurodegeneration and is also associated with reduced efficiency in many brain homeostatic pathways, including lipid transport, neuronal synaptic integrity and plasticity, and glucose metabolism []. Phosphorylated tau stimulates the fibrillation of amyloid-β and tau in the brain, and the phosphorylation of tau was reported to be suppressed by potentiating insulin signaling []. TTK was reported to reduce oxidative stress and inflammation and attenuate insulin resistance by potentiating insulin signaling in an insulin-resistant animal model []. The present study showed that TTK improved insulin signaling in the hippocampus and reduced neuroinflammation. Besides hippocampal insulin signaling, amyloid-β deposition to exacerbate memory dysfunction is also associated with synaptic plasticity, post-synaptic degeneration [], and microglial activation [], and in a future study, synaptophysin, PSD95, and Iba-1expression in the hippocampus will be considered to be studied.
Brain insulin resistance reduces the level of glucose utilization in the brain, contributing to the AD etiology, and it also increases serum glucose concentration because the brain is the main organ using glucose []. As a result, brain insulin resistance is connected to systemic insulin resistance and, possibly, vice versa. AD and type 2 diabetes are interrelated with each other []. Moreover, mitochondrial dysfunction is associated with AD, which may be associated with the energy metabolism related to AD etiology. Therefore, metabolic changes in the systemic and central nervous system (CNS) causing insulin resistance may influence the initiation and progression of AD. The connection between systemic and CNS alterations has a relationship with the brain pathology of AD []. Inflammation is involved in obesity, type 2 diabetes, and non-alcoholic liver disease by producing proinflammatory cytokines from adipocytes [,]. Because these metabolic disruptions are observed in AD, systemic and CNS inflammation is linked to AD. In the present study, AD-Con rats showed increased systemic insulin resistance, as measured by IPITT compared to normal-Con, and AD-TKK improved systemic insulin tolerance. Similar patterns were observed in brain insulin resistance measured by hippocampal insulin signaling. AD-TTK enhanced systemic and brain insulin resistance. Therefore, TTK potentiated insulin action by improving insulin signaling and attenuating inflammation.
The change in neuroinflammation in AD is associated with the brain–gut microbiome axis []. Increased acetic acid production from an altered gut microbiome exacerbates insulin resistance by activating the parasympathetic nervous system to promote glucose-stimulated insulin secretion and ghrelin secretion in obese rats []. High fat and sugar diets influence the gut microbiota composition, resulting in an imbalanced gut microbial population. The improvement of the gut microbiome by bioactive compounds can protect against AD by normalizing the gut–brain axis []. The present study showed that AD rats infused with amyloid–b into the hippocampus had a high-fat diet that exacerbated insulin resistance and AD. The AD-Con group showed an increase in Proteobacteria, including Desulfovibrionales and Enterobacteriales, which are harmful bacteria in the gut, whereas the AD-TKK group showed a decrease. AD-Con also increased Erysipelotrichales and Clostridiales and decreased Bacteroidales, and their alterations were protected by AD-TKK. Lactobacillus paracasei intake decreases the sum of six Clostridiales and increases Bacteroidales []. Furthermore, the probiotics supplementation in healthy participants with an initially low butyrate level showed a 329% increment in butyrate []. These results suggest that probiotics modulate gut microbiota composition and butyrate production. TTK intake also modulated the composition of the gut microbiome as similar to Lactobacillus paracasei intake. The changes in intestinal microbiota were similar to the present study. Therefore, a high-fat diet altered the gut microbiota to impair the brain–gut-microbiota–brain axis that exacerbates neuroinflammation and impairs hippocampal insulin signaling to accelerate AD. The gut microbiome can be modulated by the nutrient availability of dietary fiber and phytochemicals as well as by disease states.
In conclusion, a 70% ethanol extract of TTK enhanced the memory function with potentiated hippocampal insulin signaling, reduced insulin resistance, and improved the gut microbiota in amyloid-β infused rats. The TTK might modulate the memory deficit by altering neuroinflammation and hippocampal insulin signaling through the gut-microbiome–brain axis.
4. Materials and Methods
4.1. Extraction and Lyophilization
Tetragonia tetragonioides Kuntze grown in Jeju Island was extracted with 70% ethanol (TTK-E) or water (TTK-W) by shaking for 24 h at 25 °C, centrifuged at 8000× g for 30 min, and its supernatants were collected. Supernatants were lyophilized in a freeze-drier (Il Shin, Dongdochun-Si, Korea).
4.2. PC12 Cells
The PC12 cell line derived from the rat adrenal medulla was obtained from the American Type Culture Collection (Manassas, VA, USA) and maintained in culture medium (DMEM supplemented with 5% FBS, 5% HS, and 1% P/S) at 37 °C in a 7.5% CO2 incubator. The culture medium was changed to DMEM containing 1% FBS, 1% HS, and 1% P/S. The lyophilized extracts were dissolved in 10% DMSO in media to make 10 and 50 µg/mL. PC12 cells were incubated with 50 ng/mL NGF and 10 μM amyloid-β (25–35) plus 10 or 50 µg/mL of TTK-E or TTK-W or 10% DMSO (AD-Con and Normal-Con) for 48 h. An 3-(4,5-dimethylthiazol-2-yl)-2,5-diphenyltetrazolium bromide (MTT) assay was conducted by colorimetry. The mRNA expression levels of BDNF, CNTF, and Tau were measured by real-time PCR, as described below.
4.3. Animals and Diets
Thirty male Sprague Dawley rats, weighing 209 ± 13 g, were housed individually in stainless steel cages in a controlled environment (23 °C and a 12 h light/dark cycle). All experimental procedures were performed according to the guidelines and with the approval of the Animal Care and Use Review Committee at Hoseo University (HSIACUC-17-070, October 26, 2017), Korea.
Male Sprague Dawley rats were anesthetized with an intraperitoneal injection of a ketamine and xylazine mixture (100 mg and 10 mg/kg body weight, respectively) and placed in a stereotaxic device. A stainless steel cannula was implanted to stereotaxically connect an osmotic pump to the cannula implanted into the bilateral CA1 subregion using the following coordinates: lateral, −3.3 mm from the bregma; posterior, 2.0 mm from the midline; ventral, −2.5 mm from dura []. The amyloid-β(25–35) for AD and amyloid-β(35–25) for Non-AD were dissolved in sterile saline and infused into the cannula secured in the bilateral CA1 subregions of the hippocampus using an osmotic pump (Alzet Osmotic Pump Company, Cupertino, CA, USA) at a rate of 3.6 nmol/day for 14 days. The amyloid-β(35–25) has the reverse sequence of amyloid-β(25–35), does not accumulate in the brain, and is not detected by immunohistochemistry (Non-AD).
Rats infused with amyloid-β(25–35) into the CA1 regions were assigned randomly to two different groups of 10 animals, each fed a high-fat diet to induce insulin resistance and supplemented with either 0.5% dextrin (AD-Con) or 0.5% of TTK-E extract (AD-TTK). Rats infused with amyloid-β(35–25) had high-fat diets containing 0.5% dextrin as normal control (Normal-Con). All rats consumed water and corresponding diets based on the AIN-93 diet [] for 47 days ad libitum. All diets consisted of approximately 38 energy percent (En%) carbohydrates, 20 En% protein, and 42 En% fats. The major carbohydrate, protein, and fat sources were starch plus sugar, casein (milk protein), and lard (CJ Co., Seoul, Korea). The serum glucose levels, food intakes, and body weights were measured weekly after overnight feed-deprivation.
4.4. Y maze and Passive Avoidance Test
The rats were tested for short-term memory deficits using Y maze on day 40 and a passive avoidance test on day 42. Rats had a Y maze test consisting of a horizontal Y shape maze with 3 arms of 50.5 cm in length, 20 cm in width, and 20 cm in height. Each rat was located in one arm and monitored for the movement in the Y maze for 8 min. A rat consecutively entered into all three arms and it was defined as the right alteration []. The percentage of the spontaneous alternation was calculated for the number of the right alternation among the total number of arm entries.
Passive avoidance apparatus consisting of a two-compartment dark/light shuttle box []. In the acquisition trial, immediately after a rat had entered the dark chamber, electroshocks (75 V, 0.2 mA, 50 Hz) were delivered for 5 s. Five seconds later, the rat was removed from the dark chamber and returned to its home cage. After 24 h, the retention latency time was measured in the same way as in the acquisition trial, but an electric foot shock was not delivered, and the latency time was recorded to a maximum of 600 s. Short latencies indicated a memory deficit, compared to significantly longer latencies.
4.5. Water Maze Test
The spatial memory function was assessed using a Morris water maze test, as described previously [], on day 47. The Morris water maze tests hippocampal-dependent learning, including the acquisition of spatial memory, long-term memory, and long-term spatial memory.
4.6. Insulin Tolerance Test
At 52 days of amyloid-β infusion, an intraperitoneal insulin tolerance test was performed after 6 h food deprivation. Insulin (0.75 U/kg body weight) was intraperitoneally injected and serum glucose levels were measured by a Glucose Analyzer II (Beckman, Palo Alto, CA) every 15 min for 90 mins.
Two days after the intraperitoneal insulin tolerance test, fasting blood was collected by cardiac puncture, and the serum was collected by centrifugation at 1000× g for 20 min. After heart puncture, human insulin (5U/kg body weight) was injected through the inferior vena cava. Serum and tissue samples were stored at −70 °C for biochemical analysis. Serum insulin concentrations were measured by Ultrasensitive rat insulin ELISA kit (Crystal Chem, Elk Grove Village, IL, USA).
4.7. Brain Immunohistochemistry
Five overnight-fasted rats randomly selected from each group were anesthetized with intraperitoneal injections of a mixture of ketamine and xylazine. The brain was dissected immediately, perfused with saline and a 4% paraformaldehyde solution (pH 7.2) sequentially, and postfixed with the same fixative overnight at room temperature.
Cryoprotected brain frozen tissues were sectioned serially on a cryostat (Leica, Wetzlar, Germany) into 30 μm coronal sections. Amyloid-β accumulation in the hippocampus was determined by immunohistochemistry using the amyloid-β antibody (Cell Signaling Technology, Danvers, MA, USA) []. Amyloid-β in the hippocampus bound with its antibody and showed a fluorescent color that was quantified with an image analyzer. The amyloid-β deposition was calculated as the % of the area covered with amyloid-β-immunoreactivity in the hippocampus.
4.8. Expression of mRNA in the Hippocampus
Hippocampus samples from five rats of each group and PC12 cells were collected, and tRNA was isolated using a TRIzol reagent (Life Technologies, Rockville, MD, USA). The cDNA was synthesized from 1 μg of total RNA extracted from individual rats using a superscript III reverse transcriptase kit (Life Science Technology). Equal amounts of cDNA and primers for specific genes were mixed with SYBR Green mix (Bio-Rad, Richmond, CA, USA) in duplicate and amplified using a real-time PCR instrument (Bio-Rad), as described previously. BDNF, CNTF, Tau, TNF-α, and IL-1β gene primers were used, as described previously [,]. β-actin was used as a reference gene. The cycle of threshold (CT) for each sample was determined. The gene expression levels in unknown samples were quantified using the comparative CT method (ΔΔCt method) []. The results are presented as 2−ΔΔCt.
4.9. Immunoblot Analysis
The hippocampus samples were lysed in 20 mM Tris buffer (pH 7.4) containing 2 mM EDTA, 137 mM NaCl, 1% NP40, 10% glycerol, and 12 mM α-glycerol phosphate and protease inhibitors. After 30 min on ice, the lysates were centrifuged for 10 min at 11,300× g at 4 °C. After measuring the protein contents in the lysates using a Bio-Rad protein assay kit, lysates with equal amounts of protein were immunoprecipitated with specific antibodies before separation by SDS-PAGE as previously described []. The antibodies used for immunoblot analysis were cAMP responding element-binding protein (CREB), phosphorylated CREBser133, Akt, phosphorylated AktSer473, GSK-3β, phosphorylated GSK-3βser9, tau, phosphorylated tauser396, and β-actin (Cell Signaling Technology). The intensity of protein expression was determined using Imagequant TL (Amersham Biosciences, Little Chalfont, England).
4.10. Next-Generation Sequencing Gut Microbiome
The fecal microbiome community was examined from the cecum by analyzing metagenome sequencing using next-generation sequencing procedures []. The bacterial DNA was extracted from the feces of each rat using a Power Water DNA Isolation Kit (Qiagen, Valencia, CA, USA) according to the manufacturer’s instructions. The DNA was amplified with 16S amplicon primers by PCR, and each library was prepared using the PCR products according to the GS FLX plus library prep guide. The emPCR, which corresponds to clonal amplification of the purified library, was carried out using the GS-FLX plus emPCR Kit (454 Life Sciences, Branford, CT, USA). Libraries were immobilized onto DNA capture beads. The library-beads were added to the amplification mix and oil, and the mixture was shaken vigorously on a Tissue Lyser II (Qiagen) to produce “micro-reactors” containing both an amplification mix and a single bead. The emulsion was dispensed into a 96-well plate, and the PCR amplification program was run with 16S universal primers in the FastStart High Fidelity PCR System (Roche, Basel, Switzerland) according to the manufacturer’s recommendations. The sequencing of bacterial DNA in the feces was measured using an Illumina MiSeq standard operating procedure by a Genome Sequencer FLX plus (454 Life Sciences) in Macrogen Ltd. (Seoul, Korea).
4.11. Bacterial Sequence Processing
The 16S amplicon sequences were processed using Mothur v.1.36. The Miseq SOP followed to identify the taxonomy and counts of the bacteria in each fecal sample. The sequences were aligned using Silva reference alignment v.12350. In a pre-clustering step, the sequences with 99% identity were merged. The chimeric sequences were detected and discarded by UCHIME. All sequences were assigned with taxonomic classifications using Greengenes 13_8_99, and the sequences classified as mitochondria, Eukaryota, or unknown were removed. The operational taxonomic units (OTUs) delimited at 98% identity, which were classified taxonomically by consensus using Greengenes 13_8_99, were selected. A relaxed neighbor-joining tree with one representative sequence per OTU was obtained with Clearcut after calculating the uncorrected pairwise distances between aligned reads. The relative number of bacteria was calculated in the taxonomic assignments [order] level of each sample. PCoA results in gut bacteria were visualized using the R package.
4.12. Statistical Analysis
All results were expressed as the mean ± SD. Statistical analyses were performed using SAS version 7 (SAS Institute, Cary, NC, USA). All variables exhibited a normal distribution in univariate analysis. One-way ANOVA was used to determine the animal group effects separately for each time point and each treatment. If one-way ANOVA showed significant differences among the groups, the significant differences were determined using a Tukey’s test.
Author Contributions
D.S.K. conducted the animal study and biochemical assays. J.A.R. extracted the Tetragonia tetragonioides and analyzed their components and some biochemical assays. B.-S.K. and S.P. designed the project and participated in drafting and reviewing the manuscript. All authors reviewed the manuscript and they read and approved the final manuscript.
Funding
This study was funded by a grant from the National Research Foundation of Korea (NRF) funded by the Ministry of Science and ICT (NRF-2019R1A2C1007203) and National Research Council of Science & Technology (NST) grant by the Korea government (MSIT) (No. CAP-16-07-KIOM).
Conflicts of Interest
The authors declare no conflicts of interest.
Abbreviations
| AD | Alzheimer’s disease |
| TTK | Tetragonia tetragonioides Kuntze |
| TNF-α | tumor necrosis factor-α |
| IL | interleukin |
| APP/PS1 | human amyloid precursor protein/presenilin 1 |
| TTK-E | 70% ethanol TTK extract |
| TTK-W | water TTK extract |
| BDNF | brain-derived neurotrophic factor |
| CNTF | ciliary neurotrophic factor |
| CREB | cAMP responding element-binding protein |
| PKB or Akt | protein kinase B |
| AD-TTK | 0.5% of TTK-E extract |
| AD-Con | 0.5% dextrin in a high-fat diet |
| NGF | nerve growth factor |
| En% | energy percent |
| CT | a cycle of threshold |
| PcoA | principal coordinate analysis |
References
- Xin, S.H.; Tan, L.; Cao, X.; Yu, J.T.; Tan, L. Clearance of Amyloid Beta and Tau in Alzheimer’s Disease: From Mechanisms to Therapy. Neurotox. Res. 2018, 34, 733–748. [Google Scholar] [CrossRef] [PubMed]
- Wong, Y.C.; Krainc, D. alpha-synuclein toxicity in neurodegeneration: Mechanism and therapeutic strategies. Nat. Med. 2017, 23, 1–13. [Google Scholar] [CrossRef] [PubMed]
- De Felice, F.G.; Lourenco, M.V.; Ferreira, S.T. How does brain insulin resistance develop in Alzheimer’s disease? Alzheimers Dement. 2014, 10, S26–S32. [Google Scholar] [CrossRef] [PubMed]
- Fang, E.F.; Hou, Y.; Palikaras, K.; Adriaanse, B.A.; Kerr, J.S.; Yang, B.; Lautrup, S.; Hasan-Olive, M.M.; Caponio, D.; Dan, X.; et al. Mitophagy inhibits amyloid-beta and tau pathology and reverses cognitive deficits in models of Alzheimer’s disease. Nat. Neurosci. 2019, 22, 401–412. [Google Scholar] [CrossRef]
- Paudel, Y.N.; Angelopoulou, E.; Piperi, C.; Othman, I.; Aamir, K.; Shaikh, M.F. Impact of HMGB1, RAGE, and TLR4 in Alzheimer’s Disease (AD): From Risk Factors to Therapeutic Targeting. Cells 2020, 9, 383. [Google Scholar] [CrossRef]
- Bisht, K.; Sharma, K.; Tremblay, M.E. Chronic stress as a risk factor for Alzheimer’s disease: Roles of microglia-mediated synaptic remodeling, inflammation, and oxidative stress. Neurobiol. Stress 2018, 9, 9–21. [Google Scholar] [CrossRef]
- Lu, J.; Guo, P.; Liu, X.; Zhang, Y.; Guo, X.; Gao, X.; Chen, Y. Herbal Formula Fo Shou San Attenuates Alzheimer’s Disease-Related Pathologies via the Gut-Liver-Brain Axis in the APP/PS1 Mouse Model of Alzheimer’s Disease. Evid. Based Complement. Altern. Med. 2019, 2019, 8302950. [Google Scholar] [CrossRef]
- Liu, R.; Kang, J.D.; Sartor, R.B.; Sikaroodi, M.; Fagan, A.; Gavis, E.A.; Zhou, H.; Hylemon, P.B.; Herzog, J.W.; Li, X.; et al. Neuroinflammation in Murine Cirrhosis Is Dependent on the Gut Microbiome and Is Attenuated by Fecal Transplant. Hepatology 2020, 71. [Google Scholar] [CrossRef]
- Winnick, J.J.; Kraft, G.; Gregory, J.M.; Edgerton, D.S.; Williams, P.; Hajizadeh, I.A.; Kamal, M.Z.; Smith, M.; Farmer, B.; Scott, M.; et al. Hepatic glycogen can regulate hypoglycemic counterregulation via a liver-brain axis. J. Clin. Investig. 2016, 126, 2236–2248. [Google Scholar] [CrossRef]
- Cerovic, M.; Forloni, G.; Balducci, C. Neuroinflammation and the Gut Microbiota: Possible Alternative Therapeutic Targets to Counteract Alzheimer’s Disease? Front. Aging Neurosci. 2019, 11, 284. [Google Scholar] [CrossRef]
- Liu, J.; Sun, J.; Wang, F.; Yu, X.; Ling, Z.; Li, H.; Zhang, H.; Jin, J.; Chen, W.; Pang, M.; et al. Neuroprotective Effects of Clostridium butyricum against Vascular Dementia in Mice via Metabolic Butyrate. BioMed Res. Int. 2015, 2015, 412946. [Google Scholar] [CrossRef] [PubMed]
- Choi, H.S.; Cho, J.-Y.; Jin, M.R.; Lee, Y.G.; Kim, S.-J.; Ham, K.-S.; Moon, J.-H. Phenolics, acyl galactopyranosyl glycerol, and lignan amides from Tetragonia tetragonioides (Pall.) Kuntze. Food Sci. Biotechnol. 2016, 25, 1275–1281. [Google Scholar] [CrossRef] [PubMed]
- Ryuk, J.A.; Ko, B.S.; Lee, H.W.; Kim, D.S.; Kang, S.; Lee, Y.H.; Park, S. Tetragonia tetragonioides (Pall.) Kuntze protects estrogen-deficient rats against disturbances of energy and glucose metabolism and decreases proinflammatory cytokines. Exp. Biol. Med. (Maywood) 2017, 242, 593–605. [Google Scholar] [CrossRef] [PubMed]
- Centanni, M.; Carnachan, S.M.; Bell, T.J.; Daines, A.M.; Hinkley, S.F.R.; Tannock, G.W.; Sims, I.M. Utilization of Complex Pectic Polysaccharides from New Zealand Plants (Tetragonia tetragonioides and Corynocarpus laevigatus) by Gut Bacteroides Species. J. Agric. Food Chem. 2019, 67, 7755–7764. [Google Scholar] [CrossRef]
- Jakobsdottir, G.; Xu, J.; Molin, G.; Ahrne, S.; Nyman, M. High-fat diet reduces the formation of butyrate, but increases succinate, inflammation, liver fat, and cholesterol in rats, while dietary fibre counteracts these effects. PLoS ONE 2013, 8, e80476. [Google Scholar] [CrossRef]
- Choi, H.S.; Cho, J.-Y.; Kim, S.-J.; Ham, K.-S.; Moon, J.-H. New lignan tyramide, phenolics, megastigmanes, and their glucosides from aerial parts of New Zealand spinach, Tetragonia tetragonoides. Food Sci. Biotechnol. 2019, 21. [Google Scholar] [CrossRef]
- Lee, Y.-G.; Lee, H.; Ryuk, J.A.; Hwang, J.T.; Kim, H.-G.; Lee, D.-S.; Kim, Y.-J.; Yang, D.-C.; Ko, B.S.; Baek, N.-I. 6-Methoxyflavonols from the aerial parts of Tetragonia tetragonoides (Pall.) Kuntze and their anti-inflammatory activity. Bioorg. Chem. 2019, 88, 102922. [Google Scholar] [CrossRef]
- Pyun, B.J.; Yang, H.; Sohn, E.; Yu, S.Y.; Lee, D.; Jung, D.H.; Ko, B.S.; Lee, H.W. Tetragonia tetragonioides (Pall.) Kuntze Regulates Androgen Production in a Letrozole-Induced Polycystic Ovary Syndrome Model. Molecules 2018, 23, 1173. [Google Scholar] [CrossRef]
- Lee, Y.S.; Kim, S.H.; Yuk, H.J.; Lee, G.J.; Kim, D.S. Tetragonia tetragonoides (Pall.) Kuntze (New Zealand Spinach) Prevents Obesity and Hyperuricemia in High-Fat Diet-Induced Obese Mice. Nutrients 2018, 10, 1087. [Google Scholar] [CrossRef]
- Yang, H.; Kim, H.J.; Hong, E.J.; Pyun, B.J.; Ko, B.S.; Lee, H.W. Antidepressant Effect of Tetragonia tetragonoides (Pall.) Kuntze Extract on Serotonin Turnover. Evid. Based Complement. Altern. Med. 2019, 2019, 7312842. [Google Scholar] [CrossRef]
- Greenberg, S.M.; Bacskai, B.J.; Hernandez-Guillamon, M.; Pruzin, J.; Sperling, R.; van Veluw, S.J. Cerebral amyloid angiopathy and Alzheimer disease—One peptide, two pathways. Nat. Rev. Neurol. 2020, 16, 30–42. [Google Scholar] [CrossRef] [PubMed]
- Takeda, S. Progression of Alzheimer’s disease, tau propagation, and its modifiable risk factors. Neurosci. Res. 2019, 141, 36–42. [Google Scholar] [CrossRef]
- Yamazaki, Y.; Zhao, N.; Caulfield, T.R.; Liu, C.C.; Bu, G. Apolipoprotein E and Alzheimer disease: Pathobiology and targeting strategies. Nat. Rev. Neurol. 2019, 15, 501–518. [Google Scholar] [CrossRef] [PubMed]
- Shao, C.Y.; Mirra, S.S.; Sait, H.B.; Sacktor, T.C.; Sigurdsson, E.M. Postsynaptic degeneration as revealed by PSD-95 reduction occurs after advanced Abeta and tau pathology in transgenic mouse models of Alzheimer’s disease. Acta Neuropathol. 2011, 122, 285–292. [Google Scholar] [CrossRef] [PubMed]
- Hemonnot, A.-L.; Hua, J.; Ulmann, L.; Hirbec, H. Microglia in Alzheimer Disease: Well-Known Targets and New Opportunities. Front. Aging Neurosci. 2019, 11, 233. [Google Scholar] [CrossRef]
- Van der Velpen, V.; Teav, T.; Gallart-Ayala, H.; Mehl, F.; Konz, I.; Clark, C.; Oikonomidi, A.; Peyratout, G.; Henry, H.; Delorenzi, M.; et al. Systemic and central nervous system metabolic alterations in Alzheimer’s disease. Alzheimer’s Res. Ther. 2019, 11, 93. [Google Scholar] [CrossRef]
- Zatterale, F.; Longo, M.; Naderi, J.; Raciti, G.A.; Desiderio, A.; Miele, C.; Beguinot, F. Chronic Adipose Tissue Inflammation Linking Obesity to Insulin Resistance and Type 2 Diabetes. Front. Physiol. 2019, 10, 1607. [Google Scholar] [CrossRef]
- Ni, Y.; Ni, L.; Zhuge, F.; Xu, L.; Fu, Z.; Ota, T. Adipose Tissue Macrophage Phenotypes and Characteristics: The Key to Insulin Resistance in Obesity and Metabolic Disorders. Obesity 2020, 28, 225–234. [Google Scholar] [CrossRef]
- Solas, M.; Milagro, F.I.; Ramirez, M.J.; Martinez, J.A. Inflammation and gut-brain axis link obesity to cognitive dysfunction: Plausible pharmacological interventions. Curr. Opin. Pharmacol. 2017, 37, 87–92. [Google Scholar] [CrossRef]
- Perry, R.J.; Peng, L.; Barry, N.A.; Cline, G.W.; Zhang, D.; Cardone, R.L.; Petersen, K.F.; Kibbey, R.G.; Goodman, A.L.; Shulman, G.I. Acetate mediates a microbiome-brain-beta-cell axis to promote metabolic syndrome. Nature 2016, 534, 213–217. [Google Scholar] [CrossRef]
- Ferrario, C.; Taverniti, V.; Milani, C.; Fiore, W.; Laureati, M.; De Noni, I.; Stuknyte, M.; Chouaia, B.; Riso, P.; Guglielmetti, S. Modulation of Fecal Clostridiales Bacteria and Butyrate by Probiotic Intervention with Lactobacillus paracasei DG Varies among Healthy Adults. J. Nutr. 2014, 144, 1787–1796. [Google Scholar] [CrossRef]
- Ko, B.-S.; Ryuk, J.A.; Hwang, J.T.; Zhang, T.; Wu, X.; Park, S. Ojayeonjonghwan, an oriental medicine composed of five seeds, protects against vasomotor and neurological disorders in estrogen-deficient rats. Exp. Biol. Med. 2019, 244, 193–206. [Google Scholar] [CrossRef] [PubMed]
- Park, S.; Kim, D.S.; Kang, S.; Kim, H.J. The combination of luteolin and l-theanine improved Alzheimer’s disease-like symptoms by potentiating hippocampal insulin signaling and decreasing neuroinflammation and norepinephrine degradation in amyloid-beta-infused rats. Nutr. Res. 2018, 60, 116–131. [Google Scholar] [CrossRef] [PubMed]
- Moon, N.R.; Kang, S.; Park, S. Consumption of ellagic acid and dihydromyricetin synergistically protects against UV-B induced photoaging, possibly by activating both TGF-beta1 and wnt signaling pathways. J. Photochem. Photobiol. B 2018, 178, 92–100. [Google Scholar] [CrossRef] [PubMed]
- Park, S.; Kim, D.S.; Kang, E.S.; Kim, D.B.; Kang, S. Low dose brain estrogen prevents menopausal syndrome while maintaining the diversity of the gut microbiomes in estrogen-deficient rats. Am. J. Physiol. Endocrinol. Metab. 2018, 315, E99–E109. [Google Scholar] [CrossRef]
© 2020 by the authors. Licensee MDPI, Basel, Switzerland. This article is an open access article distributed under the terms and conditions of the Creative Commons Attribution (CC BY) license (http://creativecommons.org/licenses/by/4.0/).