4.1. Plant Material
Plants of
Ranunculus kuepferi were collected from 81 localities throughout the whole distribution range in the Alps during field trips in 2013/14 and transferred to the Botanical Garden of the University of Goettingen as previously described [
45,
57]. Herbarium specimens have been deposited in the collections of the Herbarium of the University of Goettingen (GOET). Leaves of 1074 individuals were collected directly in the field and dried in silica gel, to preserve methylation patterns of the conditions of the natural sites, and to prevent the influence of digging out and transfer of plants. Ploidy levels of individuals were identified via flow cytometry with silica gel dried leaf material, while reproduction modes from seeds collected in the wild were determined using flow cytometric seed screening (FCSS; [
86,
87]) on five seeds per individual from 551 plants which provided enough seed material [
45]. Methods of FCSS are given in
Supplementary Methods S1 and results in
Supplementary Table S4. Since we wanted to study methylation patterns under natural conditions over a large distribution area in the Alps, we relied on a comprehensive sampling of silica gel-dried leaf material collected in the field; reproductive structures could not be sampled for epigenetic analysis because flowers/fruiting heads were needed for FCSS analysis (see above).
Ranunculus kuepferi has a relatively big genome size (1C = 4.4 pg DNA; [
58]), and no reference genome is available. Many of the silica gel-dried samples did not provide sufficient quality and quantity of DNA extracts for bisulfite sequencing protocols. Hence, we preferred methylation-sensitive AFLPs (MSAP) as a well-established, robust method for getting an overview of a representative set of samples for non-model organisms without a reference genome [
13,
67] over a more functionally orientated bisulfite-based sequencing approach [
22,
88]. We categorized individuals according to cytotype (2x, 4x) and reproduction mode (obligate sexual, mixed, obligate apomicts) according to [
45]. “Obligate” means that a plant produced exclusively sexual (S) or apomictic seeds (A), while “mixed” is defined that a plant produced both sexual and apomictic seeds (see Reference [
45] for developmental pathways and terminology). We further defined four combined groups: obligate sexual diploids (2xS), facultative apomictic diploids (2xM), obligate apomictic tetraploids (4xA) and facultative sexual tetraploids (4xM). From these 551 plants, we chose 48 individuals of each group for MSAP analysis except for the 2xM group, as only six diploid individuals exhibited apomictic seed production. The sampling aimed at covering the whole distribution area but was random with respect to the mode of reproduction. From these 150 individuals, 27 (18%; 7 diploids, 20 tetraploids) were excluded from further steps because of the low quality of MSAP electropherograms, resulting in a final dataset of 41 diploid, sexual (2xS), 6 diploid, mixed (2xM), 45 tetraploid, mixed (4xM) and 31 tetraploid, apomictic (4xA) scored samples. The samples belong to 48 populations out of the whole Alps, with 1–6 individuals per population. A list of the 123 individuals used for MSAP analyses with population/sample ID, provenances, and ploidy level/mode of reproduction is given in
Supplementary Table S4.
4.2. Methylation-Sensitive Amplified Fragment-Length Polymorphisms
We extracted DNA with the QIAGEN DNeasy Plant Mini Kit (QIAGEN, Hilden, Germany) using a slightly modified protocol (see details in
Supplementary Methods S2). Detection of epigenetic patterns was accomplished by conducting methylation-sensitive amplified fragment-length polymorphisms (MSAP). We followed the protocol of [
18] with some minor modifications (see below).
We performed digestion and ligation of DNA subsequently as two independent reactions on each sample using different restriction enzyme combinations: (i) HpaII (New England Biolabs, Ipswich, MA, USA) as a frequent cutter and EcoRI (New England Biolabs, Ipswich, MA, USA) as a rare cutter, (ii) MspI (New England Biolabs, Ipswich, MA, USA) and EcoRI. Both combinations (containing per sample: 3.38 µL ddH
2O, 1.15 µL NEB CutSmart Buffer, 1.15 µL NEB MspI or HpaII respectively, 0.07 µL NEB EcoRI-HF) were run in parallel under same conditions each with 5.75 µL of the same DNA isolate. HpaII and MspI are isoschizomeres with the same recognition sequence (5′-CCGG-3′). Both enzymes cut a nonmethylated restriction site, and MspI cuts also if only the internal cytosine is either holo- or hemimethylated [
89]. Cleaving of HpaII is entirely blocked if either one or both cytosines are holomethylated, whereas hemimethylation on either or both cytosines only impairs restriction [
89], which can be overcome with high fidelity enzymes, optimal digestion conditions and a prolonged incubation time. Digestion was performed at 37 °C in a T100 Thermocycler (Bio-Rad Laboratories Inc., Hercules, CA, USA) for 1 h.
Following digestion, adapters (Eurofins Scientific, Brussels, Belgium; see
Supplementary Table S5) were ligated adding 11.5 µL reaction mix (containing per sample: 3.1 µL ddH
2O, 2.3 µL NEB T4 Ligase Buffer, 2.8 µL 0.5M NaCl, 1.15 µL NEB MspI or HpaII respectively, each 0.9 µL EcoRI and MspI/HpaII adapter mix, 0.35 µL NEB T4 Ligase) and incubated for another hour at 37 °C and subsequently overnight at 16 °C. Products were analyzed on a 1.5% agarose gel and diluted 10-fold prior to preselective amplification.
The first step reduction of fragments with preselective primers (Eurofins Scientific, Brussels, Belgium; see
Supplementary Table S5) was performed with a slightly modified master mix (containing per sample: 6.3 µL ddH
2O, 1.5 µL NEB OneTaq Buffer, 1.5 µL MgCl
2, 0.3 µL dNTP mix 25µM each, 0.7µL primer mix, 0.2 µL NEB OneTaq) adding 4.5 µL of diluted R/L product on a T100 Thermocycler (120s 94 °C; 20x 10s 94 °C, 30s 62 °C, 120s 72 °C; 30 min 60 °C; ∞ 4 °C). Products were checked on a 1.5% agarose gel and diluted 10-fold prior to selective amplification.
We used three selective HpaII/EcoRI primer combinations, each with three selective nucleotides for HpaII and two for EcoRI, adapted from previous AFLP studies on
R. kuepferi [
59]: HpaII+TCG/EcoRI+AC, HpaII+TGA/EcoRI+AC, HpaII+ATA/EcoRI+AC (Eurofins Scientific, Brussels, Belgium; see
Supporting information Table S5). Three separate PCRs were conducted in parallel with the same master mix (containing per sample: 6.6 µL ddH
2O, 1.5 µL NEB OneTaq Buffer, 1.5 µL MgCl
2, 1.0 µL dNTP mix 25 µM each, 0.6 µL EcoRI primer, 0.6µL selective primer, 0.2µL NEB OneTaq) adding 3 µL of preselective amplification product on T100 Thermocyclers (120s 94 °C; 9x 10s 94 °C, 30s 67 °C–1 °C per cycle, 120s 72 °C; 23x 10s 94 °C, 30s 62 °C, 120s 72 °C; 30 min 60 °C; ∞ 4 °C). Products were kept cool at 4 °C overnight and diluted 20-fold prior to fragment analysis.
Fragment analyses were performed on an ABI Prism 3730 capillary sequencer (Applied Biosystems, Waltham, MA, USA) using GeneScan ROX 500 (Thermo Fisher Scientific, Waltham, MA, USA) as an internal size standard. Fragment quality was first checked visually with GeneMarker 2.7.4 software (SoftGenetics LLC., State College, PA, USA). As AFLP methods are prone to false positive fragment peaks, and also because of potential bias of silica-gel dried materials, we produced duplicates of every sample from restriction to selective PCR, to ensure 100% reproducibility of the resulting electropherograms (see also subsection “statistical data evaluation”).
Analysis and interpretation of methylation patterns among samples and groups are based on present/absent profiles of fragments. To overcome the subjectivity of manual scoring [
90], transformation of fragments between 100 and 600 bp to dominant binary matrices was conducted automatically using Peakscanner 2.0 software (Applied Biosystems, Waltham, MA, USA) for basic peak detection. The R package RawGeno 2.0-2 (Available online:
http://sourceforge.net/projects/rawgeno) [
90] was used for fragment identification as well as filtering of technical artifacts and non-reproducible fragments. To find optimal parameter combinations we ran a script implemented in RawGeno incrementally increasing stepwise every parameter and calculating relevant actuating factors on analysis quality (final parameter settings, reproducibility and error rates are given in
Supplementary Table S6). Raw fragment recognition data from RawGeno were imported into the MSAP_calc.r script that distinguishes HpaII and MspI profiles, and filters for susceptible loci as described in Reference [
89]. Based on the differing sensitivity of the restriction enzyme isochizomers to methylation of their target sequence, four conditions can be distinguished: (i) no methylation (both HpaII and MspI cut), (ii) holo- or hemimethylation of internal cytosine (C
MeCGG or C
HMeCGG, respectively, only MspI cuts), (iii) hemimethylation of external cytosine (
HMeCCGG, only HpaII cuts), iv) either holomethylation of both internal and external cytosine or a mutation (both HpaII and MspI do not cut). To transform fragment patterns into a 0/1 matrix for further analyses, we chose the Mixed Scoring 2 approach [
89]. For this purpose, each locus was divided into three epiloci (nonmethylated, internally C
MeCGG/C
HMeCGG-methylated, externally
HMeCCGG-methylated): (i) nonmethylated was scored as “100” (ii) internally-methylated as “010”, and (iii) externally-methylated as “001”. Condition (iv) was scored as “000”, as it represents an ambiguous methylation or mutation status, which is not distinguishable [
89]. Only conditions (i) to (iii) were used for further statistical analysis. The restriction enzyme isochizomer reactions and their respective scoring were analyzed independently, and only afterward data were combined. One cannot infer changes from one type of epiloci to the other [
91], but for reporting patterns of methylations in non-model organisms this method is well established [
13].
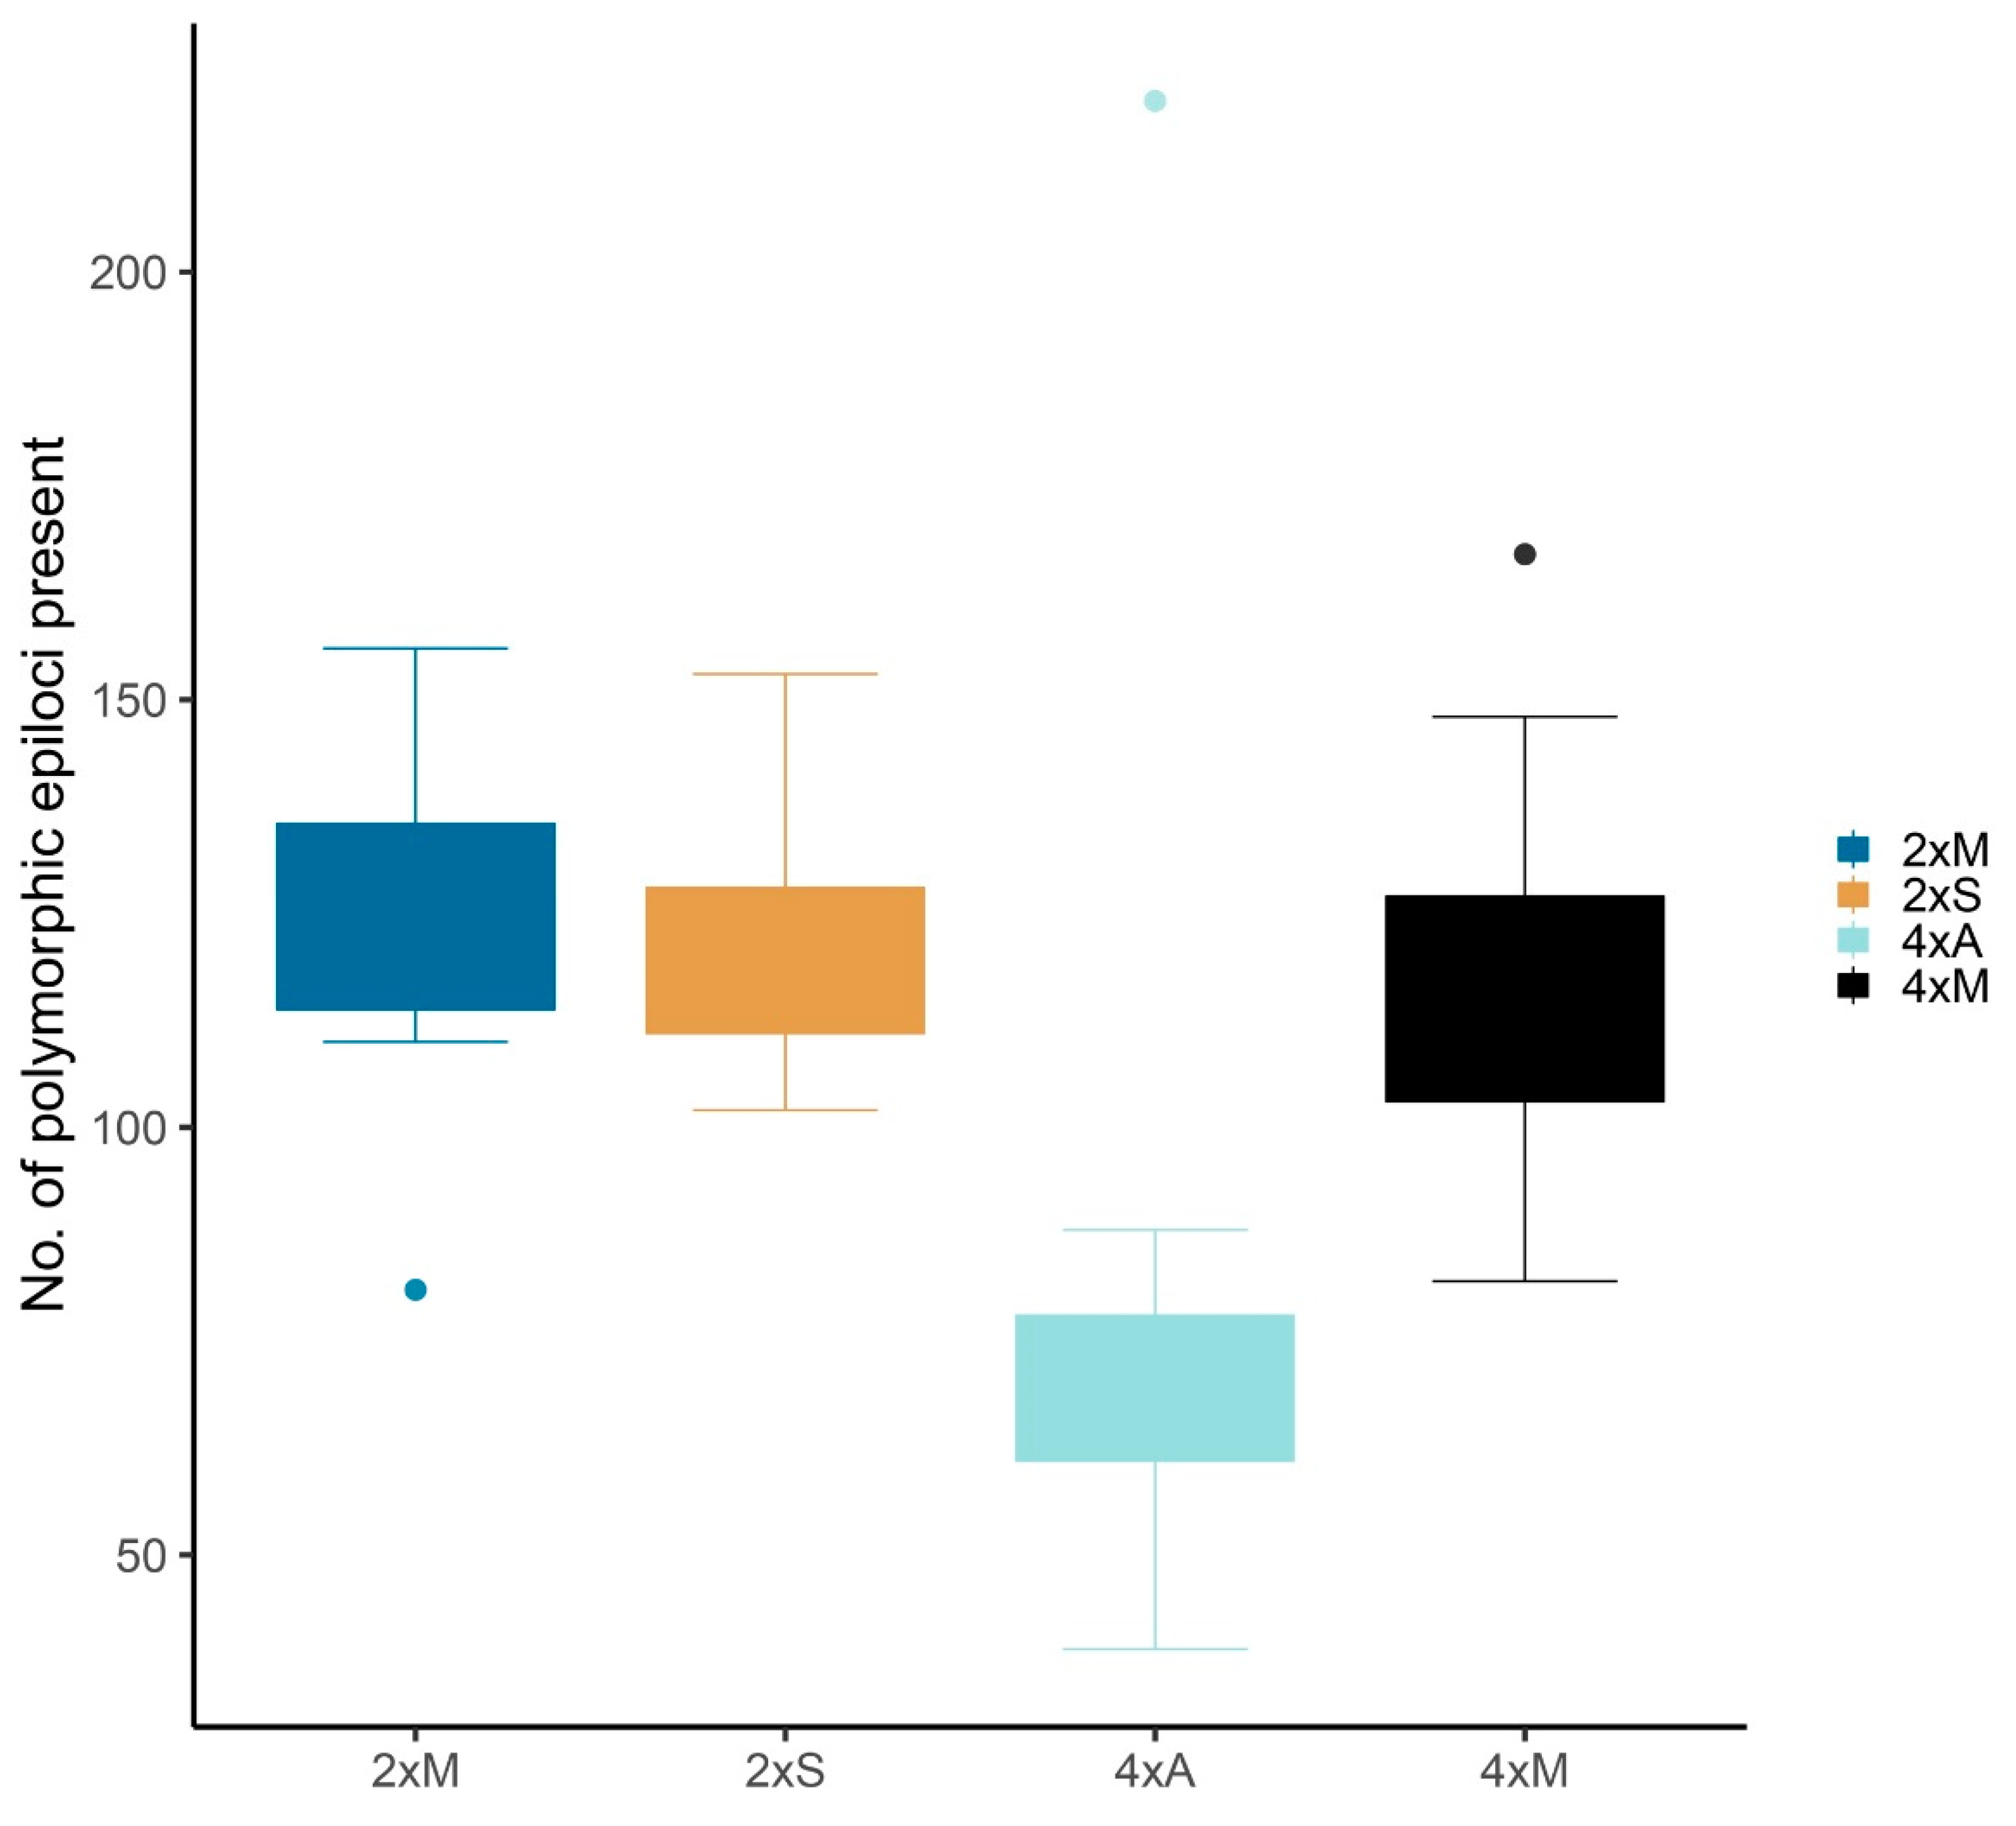
4.3. Statistical Data Evaluation
Statistical analyses were performed in R version 3.4.2 (Available online:
https://cran.r-project.org/bin/windows/base/old/3.4.2/) (R Foundation for Statistical Computing, Vienna, Austria) on the basis of the presence/absence matrix (
Supplementary Table S7) for 1088 epiloci (see above). We tested separately for the factors ploidy (2x/4x) and mode of reproduction (sexual, mixed, apomictic) by calculating AMOVAs and one-factorial ANOVAs on the presence/absence matrix. For combined groups, descriptive parameters were adopted from RawGeno in R 2.15.3 and further explored in Rcmdr 2.4-4 (Available online:
http://socserv.socsci.mcmaster.ca/jfox/Misc/Rcmdr/) [
92]. Percentages were arcsine transformed to match a normal distribution of data. Pairwise ANOVAs between combined groups were carried out in R using descriptive parameters of polymorphic loci distribution and abundance.
We used non-metric multidimensional scaling with non-Euclidean Jaccard distances in vegan 2.4-5 (Available online:
https://github.com/vegandevs/vegan) [
93] and ggplot2 3.2.1 (Available online:
https://github.com/tidyverse/ggplot2) [
94] to visualize grouping of individuals according to their methylation patterns. We calculated nine AMOVAs to compare the molecular epigenetic variances within and among our predefined combined groups (2xS, 2xM, 4xM, 4xA), as well as the ploidy levels (diploid, tetraploid) and different reproduction modes (sexual, mixed, apomictic). For F
st values, as measures of genetic divergence), based on the three different types of methylation (non-, internally-, externally methylated see
Supplementary Table S4). In addition, we determined the epigenetic phenotypic differentiation (ΦST) of loci by means of locus-by-locus AMOVA analyses. All AMOVAs were executed in ARLEQUIN 3.5.22 (Swiss Institute of Bioinformatics, Bern, Switzerland) [
95]. We have calculated each for haplotypic data, a gamma of 0.0 and 50,000 permutations.
We tested for potential correlations between individual methylation patterns and spatial distribution with a stratified Mantel test in R with ecodist 2.0.1 (Available online:
https://github.com/phiala/ecodist) [
96] using mismatch coefficients as suitable dissimilarity distances for dominant marker data. We calculated geographic distances from population GPS centroid data. We furthermore calculated Moran’s
I [
97] to examine global spatial structuring over the entire sampling area, as well as Geary’s
C [
98] for more detailed local structure analysis. Moran’s
I values range between −1 and +1, whereby positive values indicate global spatial autocorrelation, a value near 0 indicates random distribution, and negative value perfect dispersal. Geary’s
C values explain local spatial autocorrelation, the values are always positive (>0;
Supplementary Table S5). The main environmental parameters for the distribution of the cytotypes (elevation, annual mean temperature, precipitation) were selected according to the study of [
60] and data were downloaded from the WorldClim 1.4 database (Available online:
https://worldclim.org/data/v1.4/worldclim14.html) [
99]. The correlation of these parameters with observed methylation patterns was investigated with Samßada 0.5.3 (Available online:
http://lasig.epfl.ch/sambada) [
100]. Samßada uses an approach similar to logistic regressions to model the probability of observing a particular genotype of a polymorphic marker given the environmental conditions at the sampling locations [
100] (at the 100 × 100 m scale of [
60]), returning local Moran’s
I values as output. Our chosen multivariate approach with three environmental predictor variables was similar to a forward stepwise regression. Furthermore, we tested for associations between putative candidate epiloci and environmental parameters using a logistic regression for univariate models, with model selection based on Wald and G test statistics as implemented in Samßada. The resulting β-parameters (one constant parameter corresponding to the marker, and one corresponding to the environmental variable) were used for regressions (
Supplementary Table S6 and
Figures S1 and S2).

 ,
, 

