Article

Genome-Wide Analysis of RAV Transcription Factors and Functional Characterization of Anthocyanin-Biosynthesis-Related RAV Genes in Pear

1
College of Horticulture, Qingdao Agricultural University, Qingdao 266109, China
2
Haidu College, Qingdao Agricultural University, Laiyang 265200, China
3
Centre of Pear Engineering Technology Research, Nanjing Agricultural University, Nanjing 210095, China
*
Author to whom correspondence should be addressed.
These authors contributed equally to this study.
Int. J. Mol. Sci. 2021, 22(11), 5567; https://doi.org/10.3390/ijms22115567
Submission received: 26 April 2021 / Revised: 12 May 2021 / Accepted: 19 May 2021 / Published: 25 May 2021
(This article belongs to the Section Molecular Plant Sciences)

Abstract

:
Related to ABSCISIC ACID INSENSITIVE3/VIVIPAROUS1 (ABI3/VP1, RAV), transcription factors (TFs) belonging to the APETALA2/ETHYLENE RESPONSIVE FACTOR (AP2/ERF) TF family play critical roles in plant growth, development, and responses to abiotic and biotic stress. In this study, 11 novel RAV TFs were identified in pear (Pyrus bretschneideri Rehd). A phylogenetic analysis revealed that the TFs clustered into three groups with 10 conserved motifs, some of which were group- or subgroup-specific, implying that they are important for the functions of the RAVs in these clades. RAVs in Pyrus and Malus were closely related, and the former showed a collinear relationship. Analysis of their expression patterns in different tissues and at various growth stages and their responses to abiotic and biotic stress suggested that PbRAV6 and PbRAV7 play important roles in drought stress and salt stress, respectively. We investigated the function of RAVs in pear peel coloration using two red pear varieties with different color patterns and applying data from transcriptome analyses. We found that PbRAV6 participates in the regulation of pericarp color. These findings provide insight into a new TF family in pear and a basis for further studies on the response to drought stress and fruit coloration in this commercially important crop.

1. Introduction

Pear (Pyrus) is one of the most important deciduous fruit trees in the world. The planting area of pear in China is 937,642 ha, which accounts for 67.85% of the total area globally [1]. The quality of the fruit is mainly determined by flavor, aroma, and peel color. Red pear varieties are especially popular among consumers. Therefore, the genetic and molecular determinants of pear fruit color are a major focus of research.
Anthocyanins are pigments that confer red, purple, and blue colors to many fruits and vegetables. The key structural genes in the anthocyanin biosynthesis pathway have been extensively studied, and a large number of transcription factors (TFs) that regulate anthocyanin biosynthesis have been identified, such as myeloblastosis (MYB) and basic helix-loop-helix (bHLH). The APETALA2/ETHYLENE RESPONSIVE FACTOR (AP2/ERF) family is a large family of plant TFs that play important roles in the control of primary and secondary metabolism (including anthocyanin biosynthesis), development, and the response to various types of biotic and abiotic stress [2,3]. The AP2/ERF superfamily has been studied in a variety of plants including Arabidopsis [4,5], rice [4,5], cotton [6], peanut [7], bamboo [8,9], Chinese plum [10], apple [11], Eucalyptus grandis [12], potato [13], musa [14], and pear [15]. AP2/ERF TFs have at least one AP2 DNA-binding domain with a highly conserved sequence of ~60 amino acids [16]. According to the number of repeats and sequence of the AP2 domains, the AP2/ERF family is categorized into the AP2, dehydration-responsive element-binding (DREB), ERF, Related to ABI3/VP1 (RAV), and Soloist subfamilies [17]. AP2/ERF TFs have been found in different species and play important roles in anthocyanin synthesis. For example, PbMYB114 was shown to interact with PbERF3 to modulate anthocyanin biosynthesis in pear (Pyrus bretschneideri Rehd.) [18]; in Arabidopsis thaliana, AtERF4 and AtERF8 contributed to light-modulated anthocyanin biosynthesis [19]; and in apple (Malus domesticus), MdERF1B and MdERF3 stimulated the biosynthesis of anthocyanin and proanthocyanidin through cooperation with MdMYBs [20,21]. MdERF1B not only interacted with MdMYB11, but also activated its transcription by binding directly to the gene promoter [20]. Another study showed that MdERF3 directly activates the expression of MdMYB1 in anthocyanin biosynthesis [21]. Two ERF TFs in Asian pear (Pyrus pyrifolia), Pp4ERF24 and Pp12ERF96, were found to stimulate blue-light-induced anthocyanin biosynthesis via interaction with PpMYB114 [22]. As the member of AP2/ERF family, RAVs play an important role in plant development and defense responses [23]. Arabidopsis RAV1 and RAV2 were the first identified members of the RAV family [24]; there are 147 AP2/ERF TF genes in Arabidopsis, including 18 in the AP2 subfamily (14 with double AP2 domains and 4 with a single AP2 domain), 122 in the ERF subfamily (ERF and DREB/CBF combined), 6 in the RAV subfamily, and a single gene (AT4g13040) in the Soloist subfamily [5]. The functions of family members have been studied in different species. In Arabidopsis and soybean, RAV1 can regulate seed germination and the regeneration of roots and adventitious buds [25,26]. In tobacco, melon, and cotton, RAV1 can promote plant resistance to drought and high salt stress [27,28,29]. MeRAV1 and MeRAV2 activate melatonin to promote cassava resistance to bacterial blight [30]. Recently, it was found that FaRAV1 can activate MYB10 to promote anthocyanin synthesis in strawberry [31]. Although RAV TFs are known to be involved in physiological and biochemical processes in plants, the RAV TFs of Pyrus have not been identified and characterized, including in terms of their expression at different stages of pear fruit development.
To address this issue, we carried out a genome-wide analysis of Chinese white pear (P. bretschneideri) RAV genes and investigated their potential functions in anthocyanin biosynthesis and plant responses to stress using the ‘Xinli No. 7’ cultivar and its red bud variety ‘Xinqihong’.

2. Results

2.1. Identification and Phylogenetic Analysis of RAV TFs in Pear

Putative pear RAV sequences were identified by searching the Rosaceae genome using the Basic Local Alignment Search Tool for protein sequences (BLASTP). Eleven RAV protein sequences were screened based on domain and were renamed PbRAV1PbRAV11 according to chromosome sequence and location (Table 1). The polypeptide lengths of the predicted pear RAVs ranged from 303 to 380 amino acids. The predicted subcellular localization was the nucleus for PbRAV1, PbRAV5, and PbRAV7, and the cytoplasm for the other RAVs. The molecular weight, isoelectric point (pI), and grand average of hydropathicity (GRAVY) are also summarized in Table 1.
We examined the phylogenetic relationships among pear RAVs by generating a phylogenetic tree using the neighbor-joining method. The tree included 11 P. bretschneideri, 9 M. domestica, and 5 Arabidopsis RAV TFs (Figure 1). The family was divided into three groups (Figure 1). PbRAV2, PbRAV3, PbRAV8, PbRAV9, PbRAV10, and PbRAV11 were more closely related to MdRAV2, MdRAV3, MdRAV7, and MdRAV9 and were separate from the RAVs in Arabidopsis. PbRAV6 was in group II, while the other PbRAVs were in group I or III.

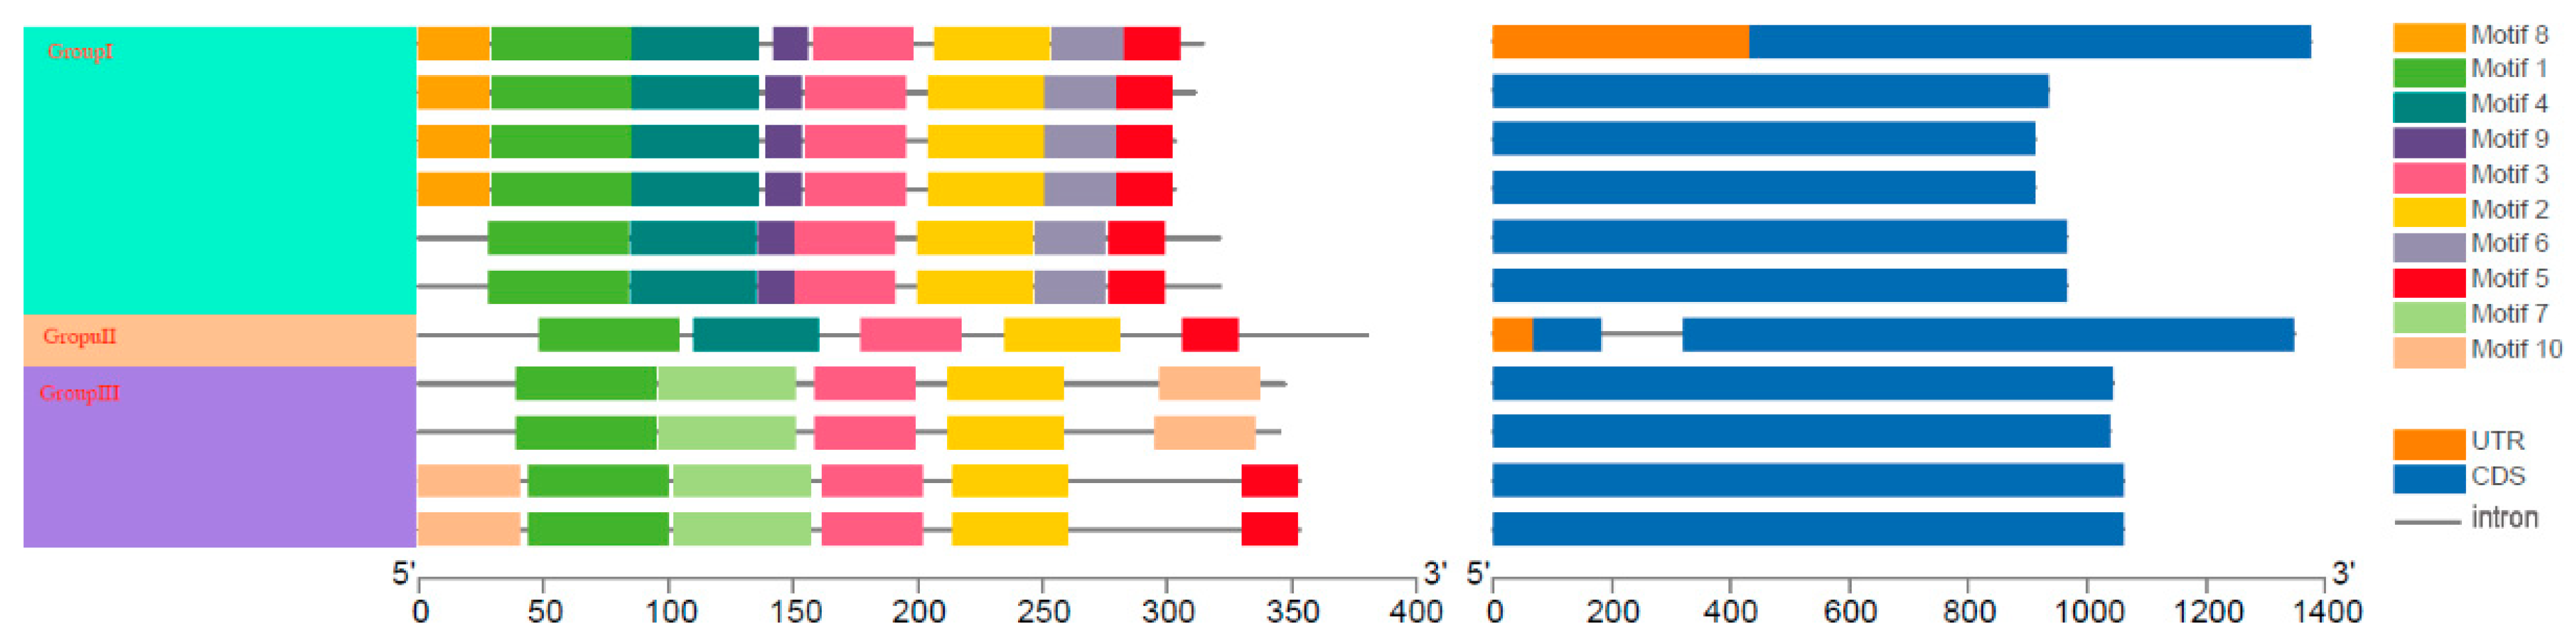
2.2. Conserved Motifs and Gene Structure of PbRAV TFs

The conserved motifs of PbRAVs were analyzed using Multiple Em for Motif Elicitation (MEME). Ten conserved motifs were predicted in PbRAVs (Figure 2 and Supplementary Figure S1); their sizes ranged from 27 to 112 amino acids. Motifs 1, 2, and 3 were present in all PbRAVs; motifs 6, 8, and 9 were found in members of group I; motifs 10 and 7 were present in members of group III; motifs 4 and 5 were present in members of groups I and II; and motif 5 was found in PbRAV7 and PbRAV8. The majority of PbRAV genes had a single exon and only one (PbRAV6) had introns (Figure 2).

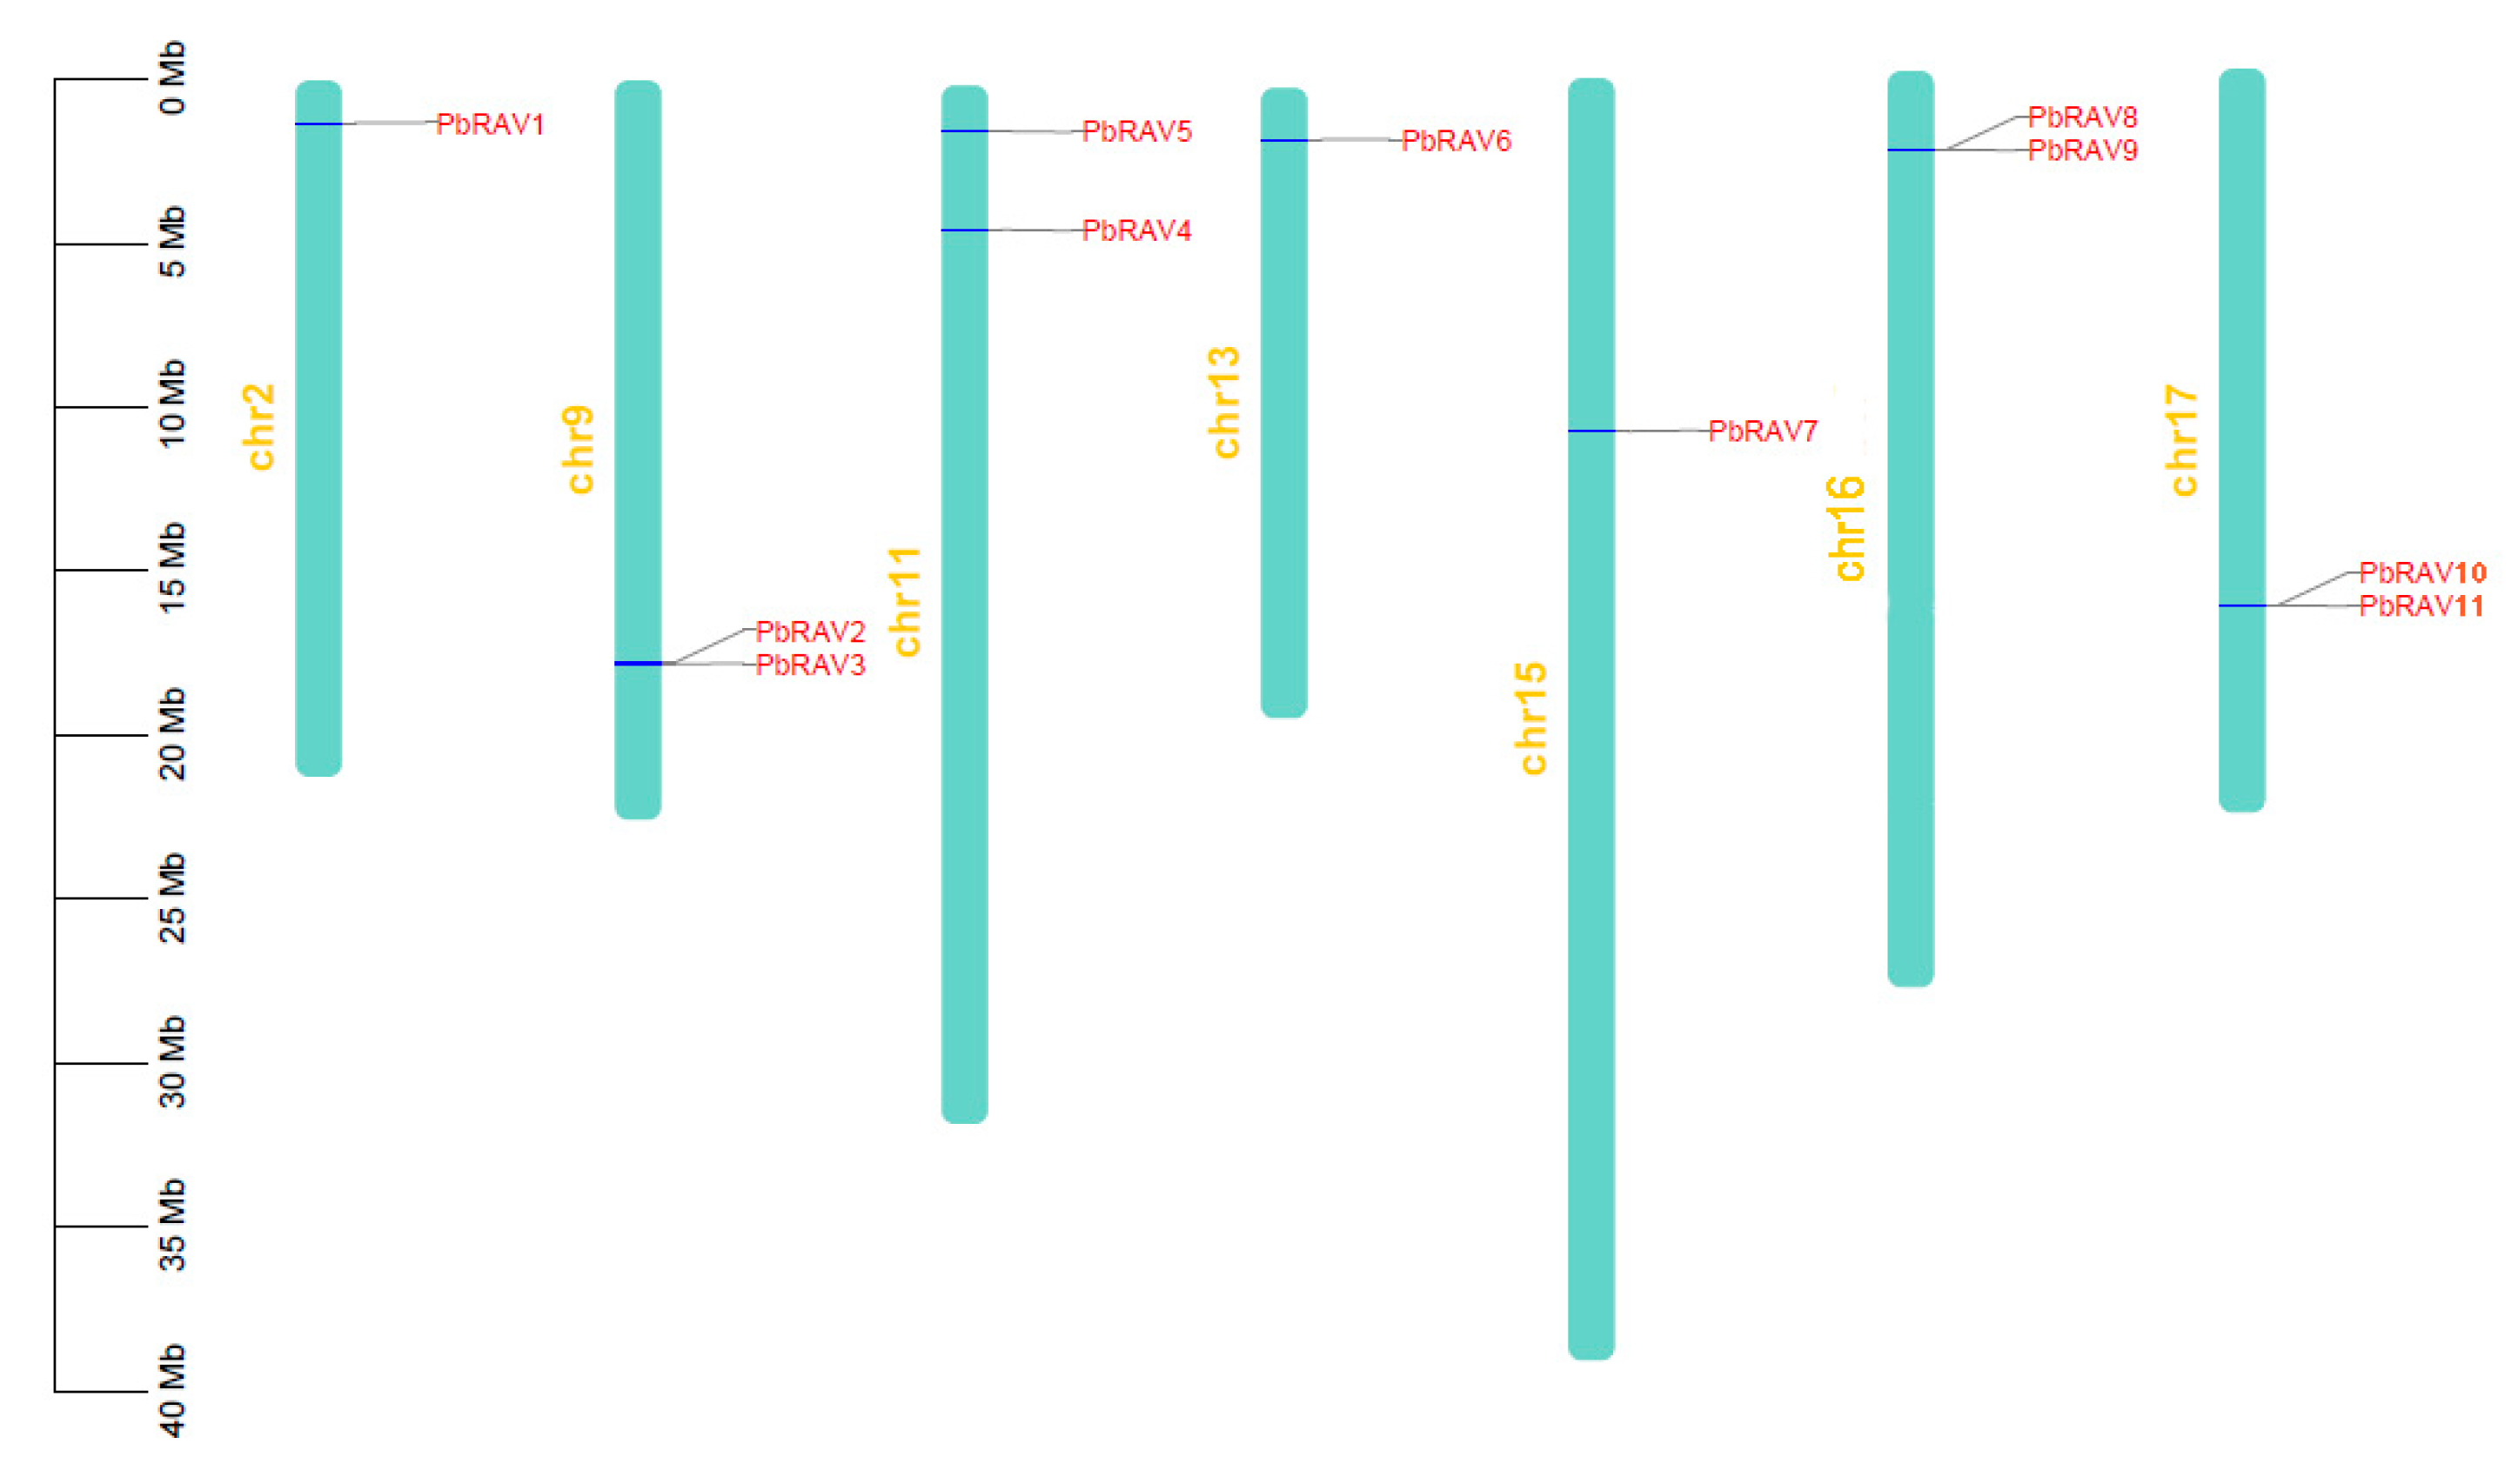
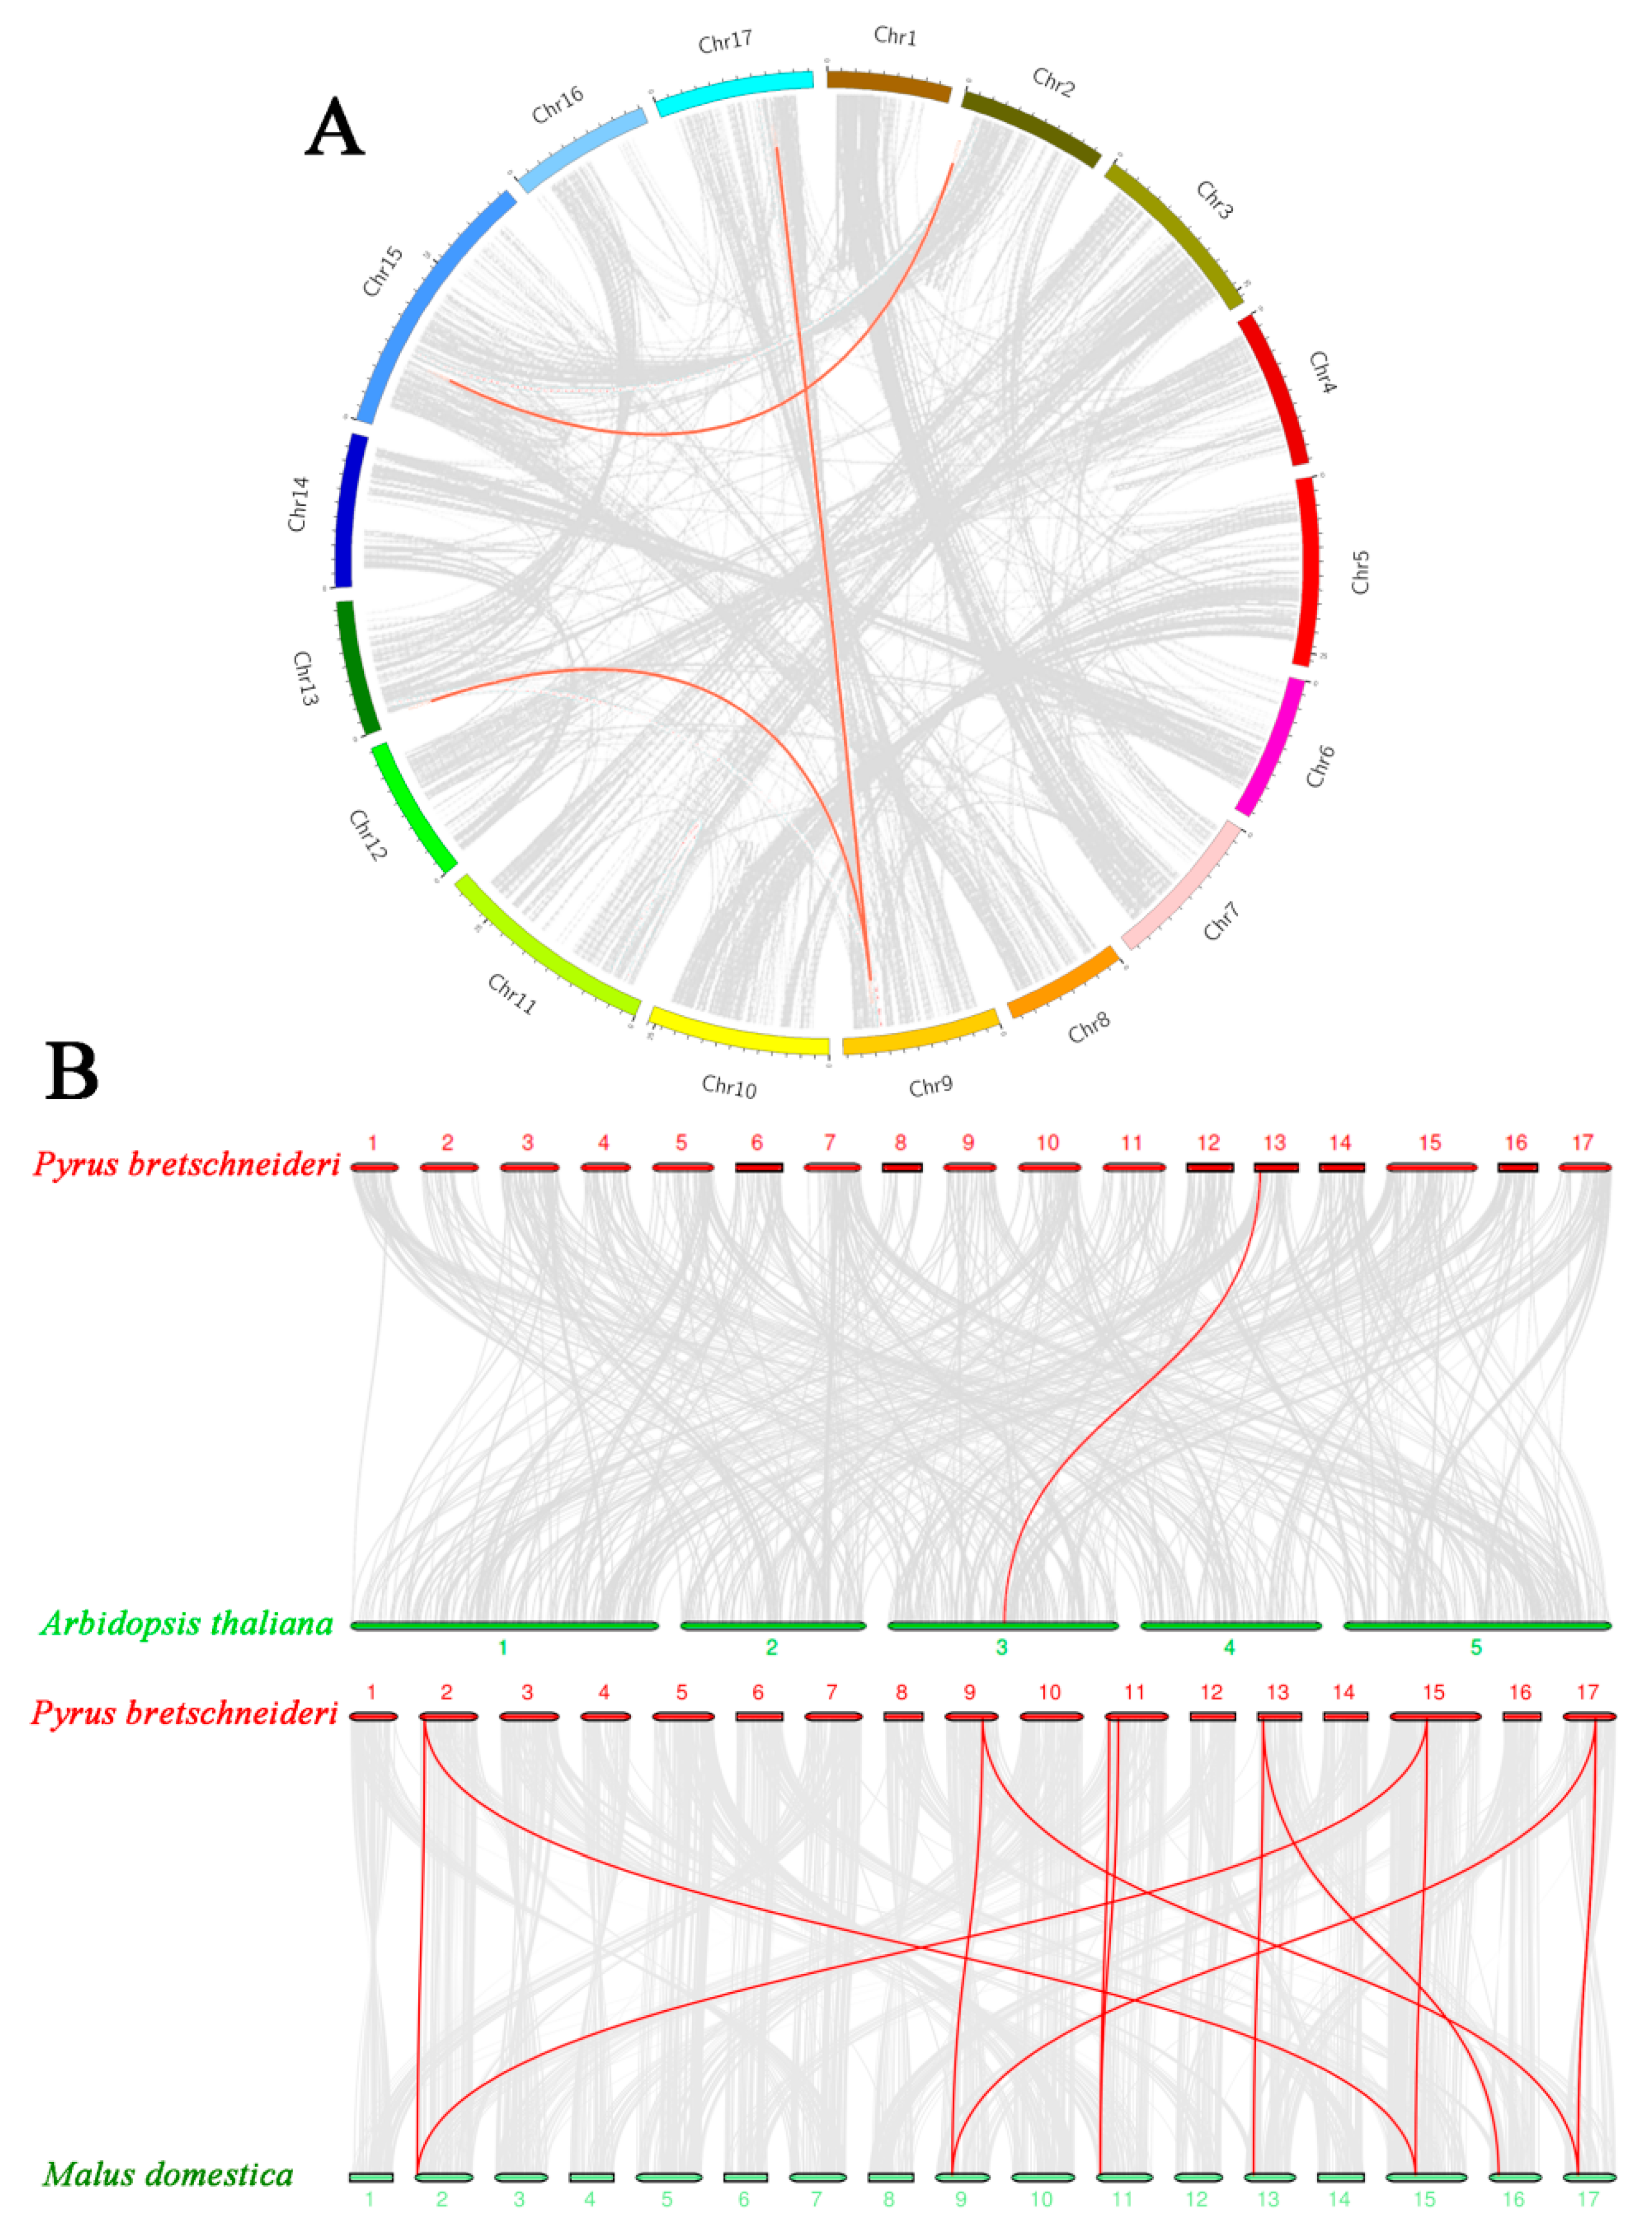
2.3. Chromosomal Distribution and Orthologous Relationships of PbRAV Genes in P. bretschneideri, Arabidopsis, and M. domestica

Physical mapping of PbRAVs on the 17 chromosomes of P. bretschneideri revealed an uneven distribution (Figure 1); the genes were distributed on just 7 chromosomes, with one or two per chromosome. The exact position (in bp) of each PbRAV is presented in Table 1. Two PbRAV genes were tandem repeats (Figure 3) and five (three pairs) were segmentally duplicated (Figure 4A). To establish the orthologous relationships of PbRAVs, we compared the physical location of RAV genes in the genomes of P. bretschneideri, A. thaliana, and M. domestica (Figure 4B). Only PbRAV6 showed a close evolutionary relationship to the RAV genes in Arabidopsis. On the other hand, RAVs in Malus and Pyrus showed a close collinear relationship.

2.4. Expression Pattern of RAV Genes during Pear Development

We analyzed the spatiotemporal expression patterns of PbRAV genes in eight different tissues and at different developmental stages using publicly available gene expression data. Of the examined PbRAV genes, 2 were not expressed in any of the tissue types, 1 was expressed in all eight tissue types and was constitutively expressed (fragments per kilobase of transcript per million mapped reads (FPKM) > 10), and 10 were differentially expressed across tissues (Figure 5). Although 7 genes were expressed during ovary development, 6 of these had low abundance (FPKM < 2) and only PbRAV6 had high expression. The abundance of PbRAV6 was higher during the development of leaf and four representative fruits, and gradually decreased with developmental stage. It is worth noting that the expression of RAVs was not consistent among different varieties of pear: only 3 genes were expressed in ‘Nanguo’ while 6 were detected in ‘Yali’.

2.5. Expression of PbRAV Genes in Response to Abiotic and Biotic Stress

To determine whether PbRAV gene expression was affected by different types of stress, we analyzed the genes’ expression patterns following exposure to abiotic and biotic stress (Figure 6). Four of the PbRAVs (PbRAV1, PbRAV4, PbRAV5, and PbRAV10) were not expressed under the different treatments. Under salt stress, although PbRAV6 had higher expression abundance, the expression changed irregularly. However, PbRAV7 expression decreased with the increase of salt damage time in two varieties. Under drought stress, PbRAV6 was upregulated as drought duration increased but was downregulated after exposure to water. In fruit samples with cork spot, RAV gene expression was low, which may have been due to the fact that the samples were fruit. In addition to PbRAV6, PbRAV8 and PbRAV9 were expressed in all samples exposed to biotic stress.

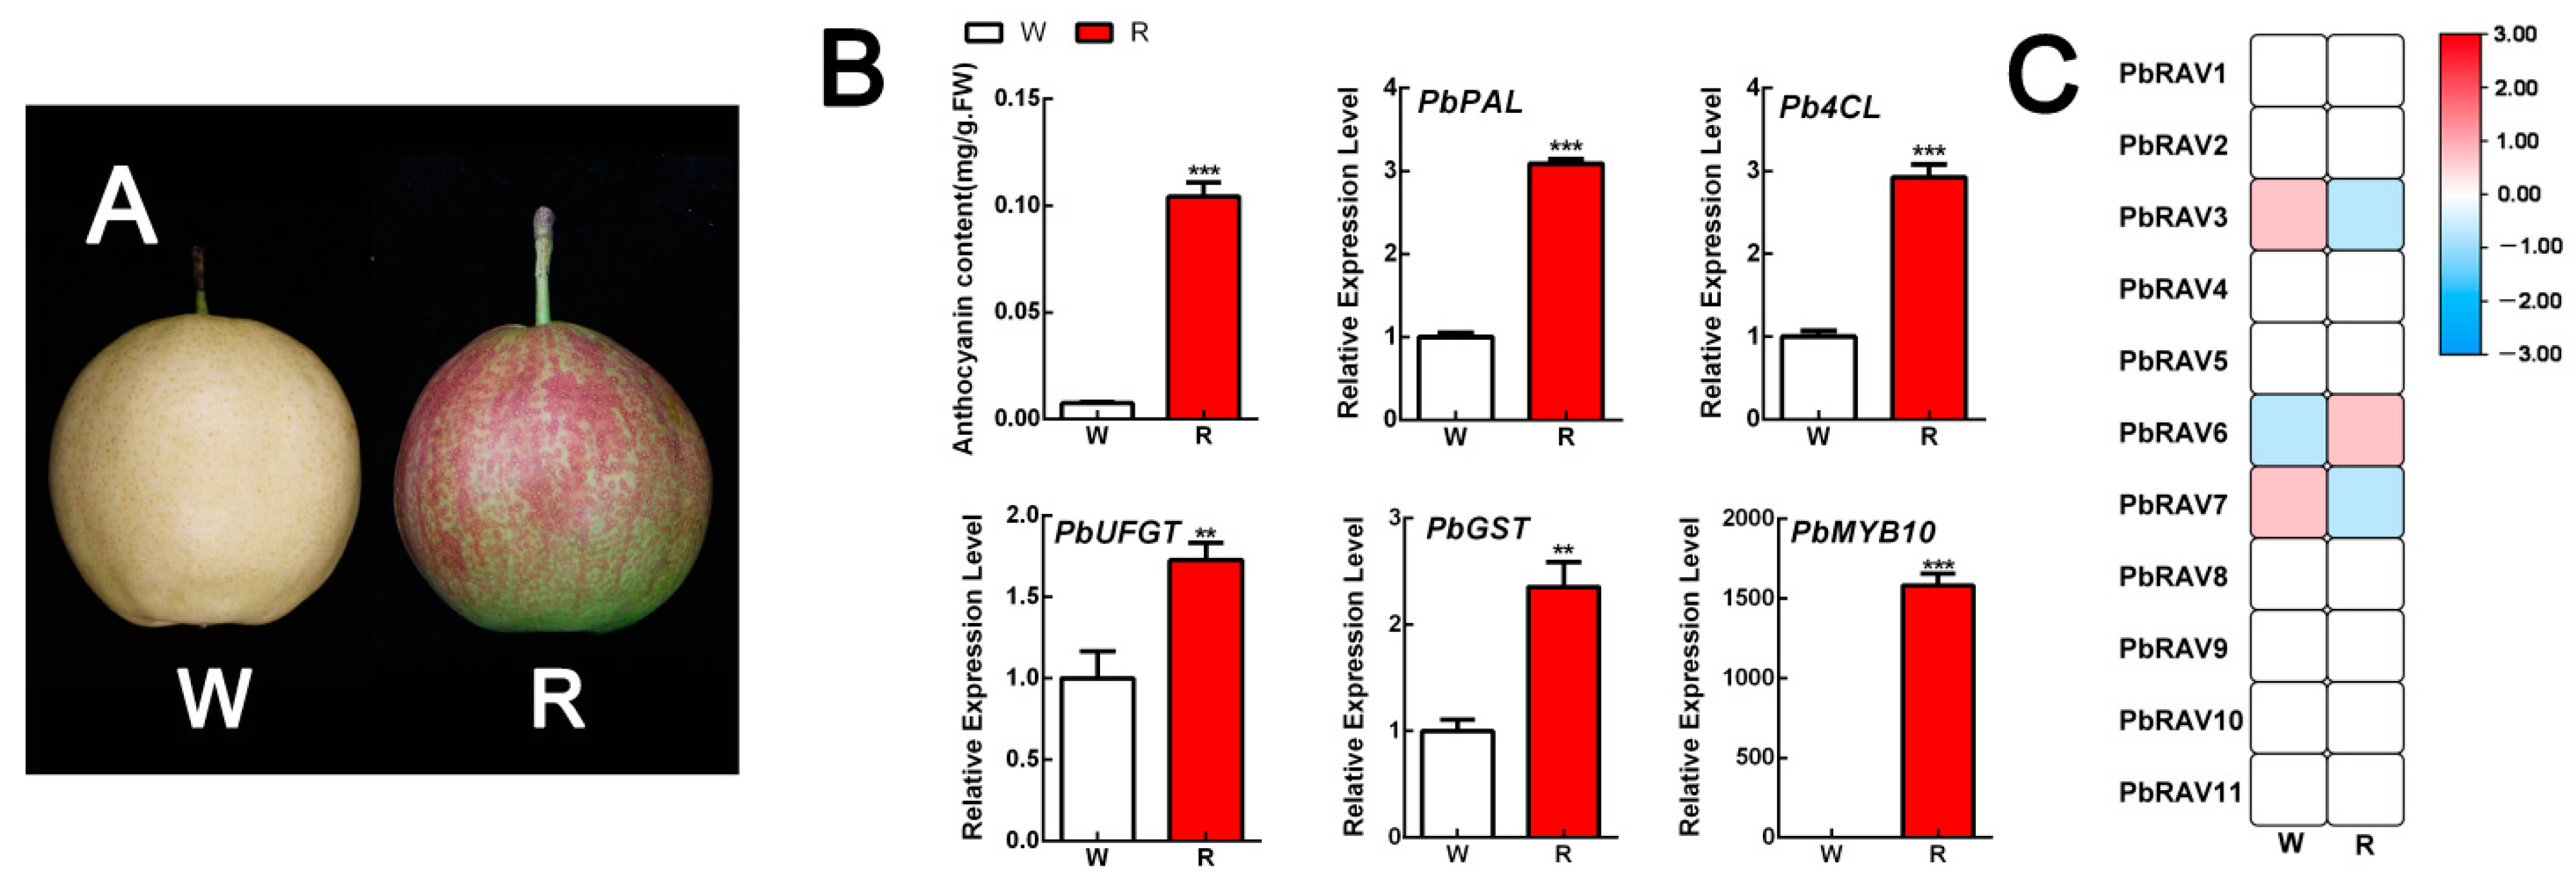
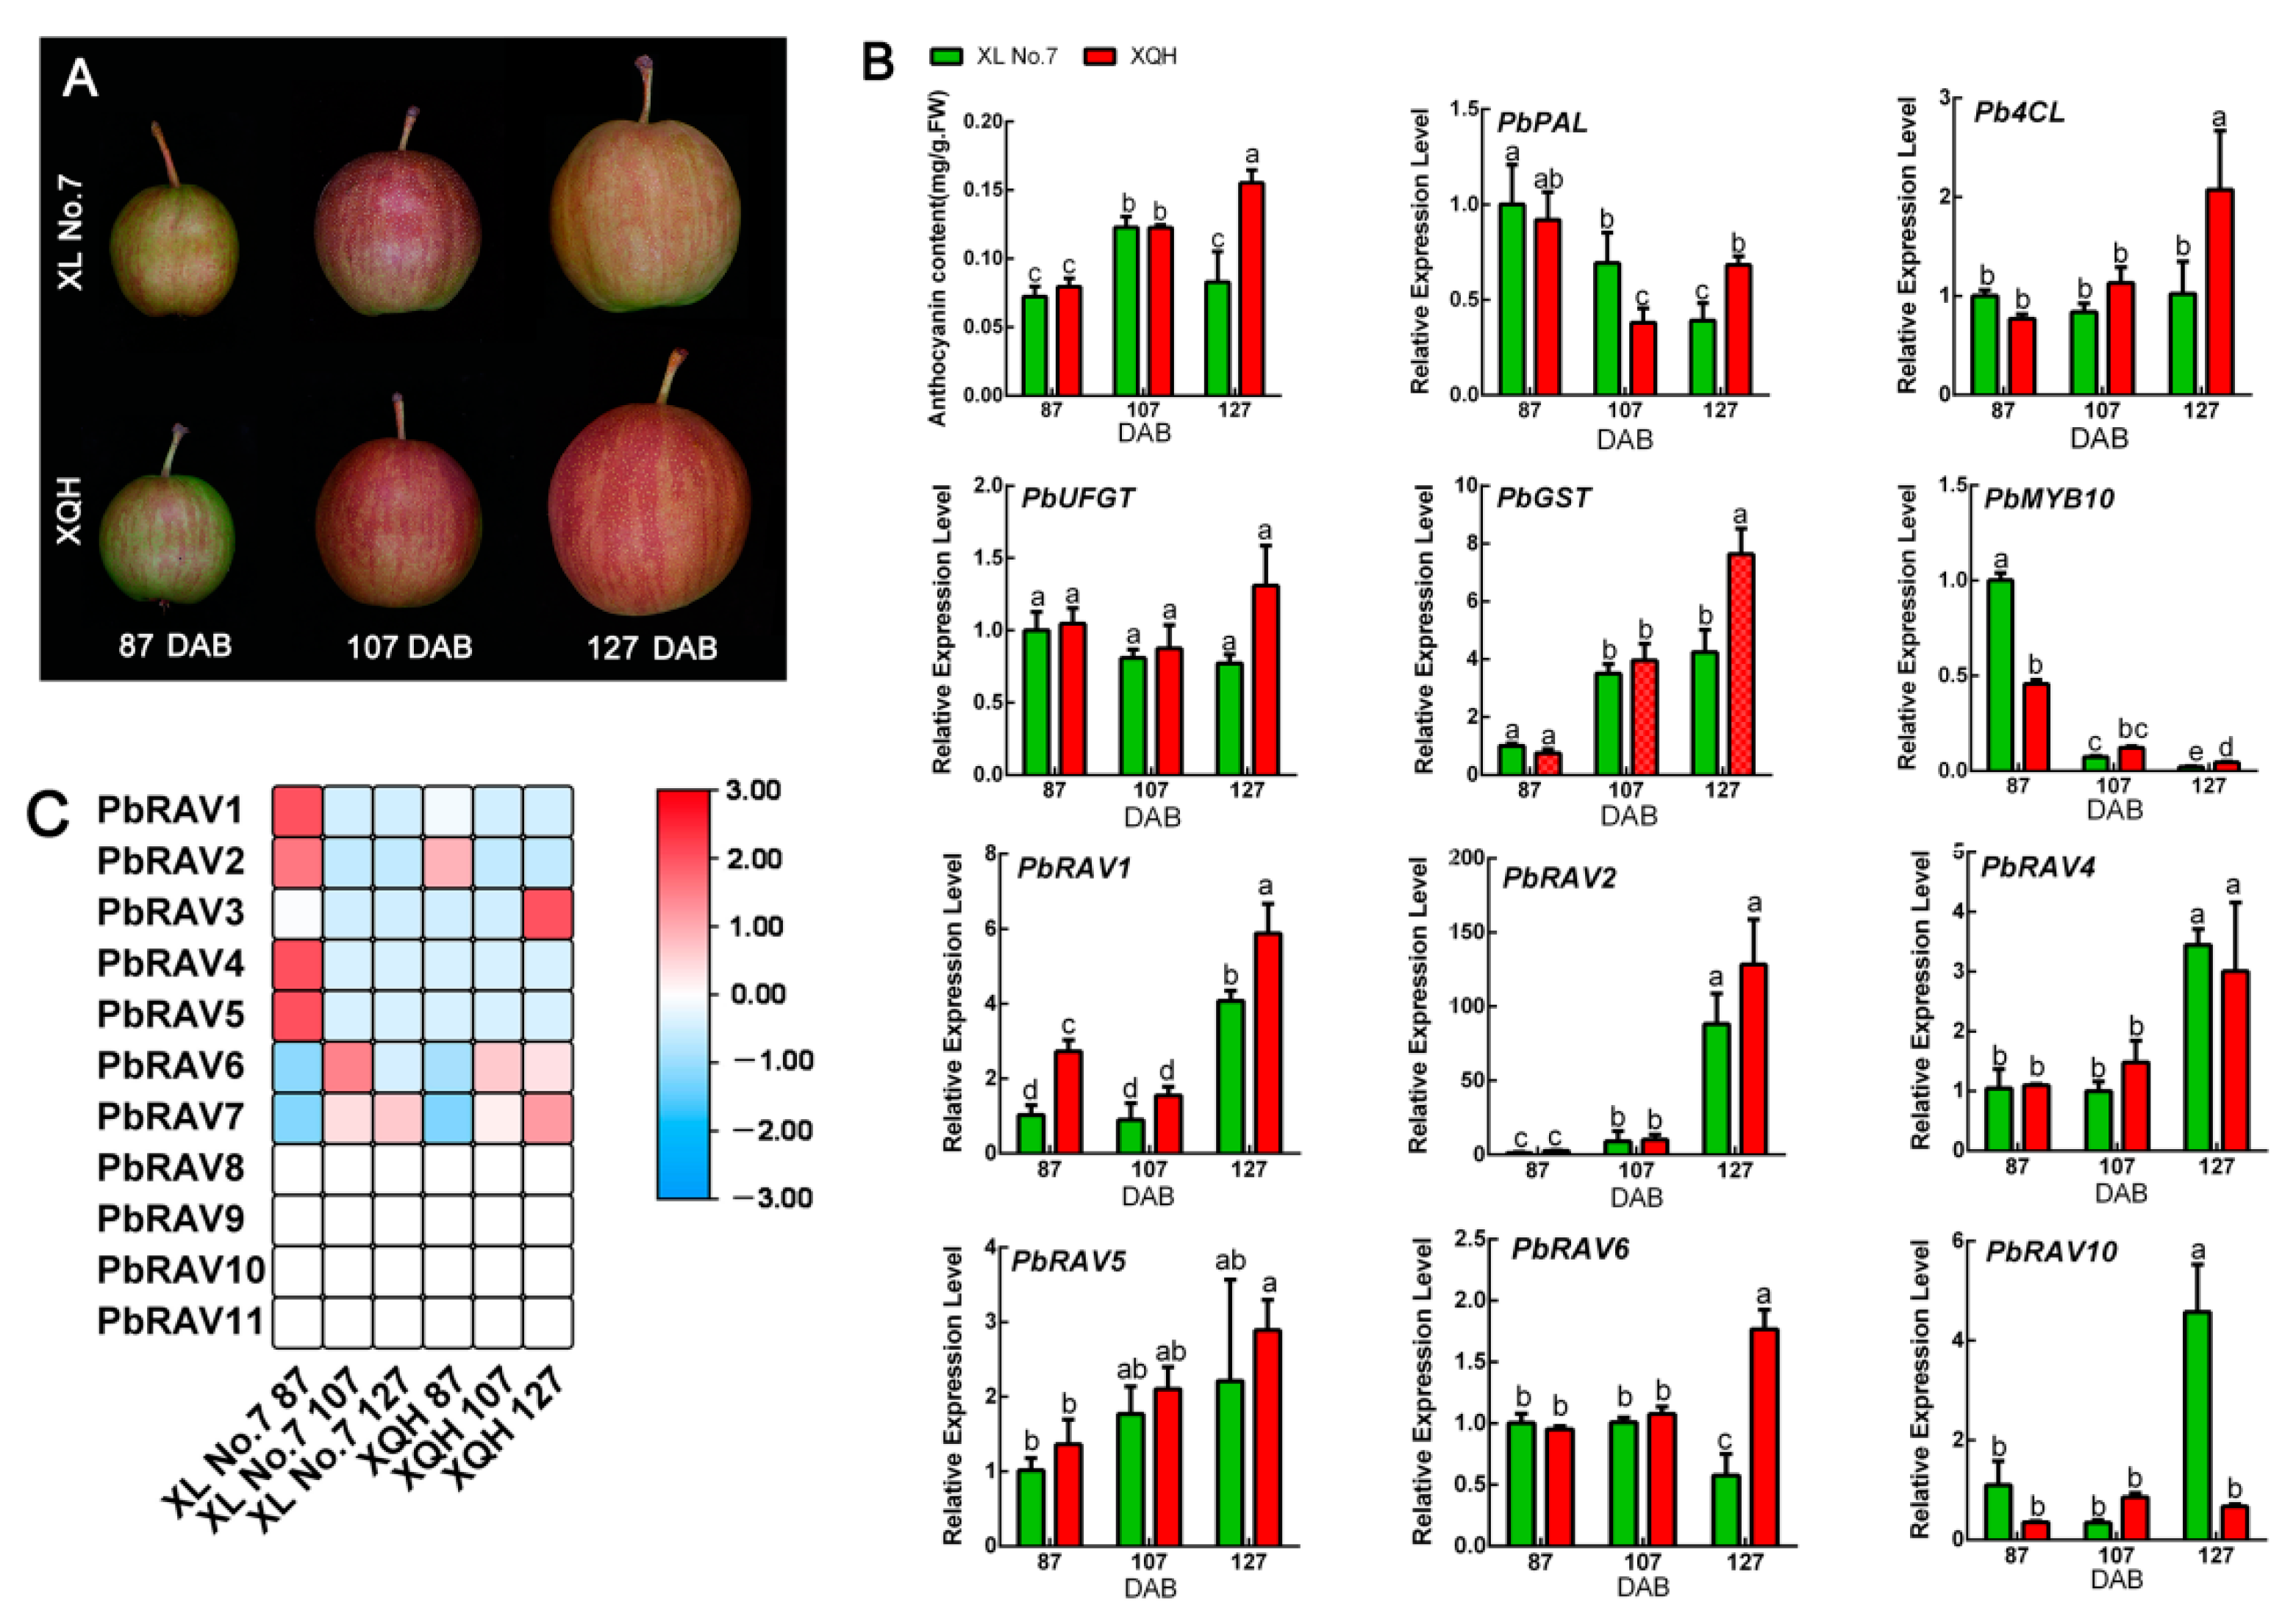
2.6. Expression of PbRAV Genes during Anthocyanin Biosynthesis

To investigate the role of PbRAVs in anthocyanin biosynthesis, we prevented anthocyanin production in the red pear cultivar ‘Xinqihong’ by bagging the fruit, which resulted in the fruit peel changing to a white color (Figure 7). Anthocyanin content and the expression of related genes were markedly higher in red than in white fruit. Only three PbRAVs were expressed, but the abundance of PbRAV3 and PbRAV7 was low (FPKM < 1); in contrast, PbRAV6 was highly expressed and the level was higher in red pear than in white pear. The qRT-PCR results were consistent with the transcriptome analysis (Figure S2). We further analyzed the ‘Xinli No. 7’ and ‘Xinqihong’ pear varieties (Figure 8). The latter is the red bud mutation of the former and remains red at the late fruit stage, whereas the red color of ‘Xinli No. 7’ fades at the late fruit stage. We found that the red color of ‘Xinqihong’ at the late fruit stage was due to a higher anthocyanin content, with the expression pattern of PbRAV6 reflecting the color change. Among them, PbRAVs with low expression abundance were not verified quantitatively.

3. Discussion

As one of the largest gene families in plants, the AP2/ERF family plays a critical role in multiple physiological and biochemical processes by regulating the expression of genes involved in the response to various stressors in Arabidopsis, Taxus chinensis [32], cotton [33], and desert moss (Bryum argenteum) [15]. Although this family has been extensively studied, there have been few reports to date on the RAV subfamily; in particular, there is limited information on the regulation and structure of these genes in pear. In this study, we analyzed whole-genome data of P. bretschneideri and identified genes encoding RAV family TFs, explored their roles in growth development and response to stress based on published expression data of Pyrus tissues, and explored their roles in anthocyanin biosynthesis between pear varieties with a significant color difference.
A total of 11 RAV genes were identified in P. bretschneideri and were classified into three families based on conserved domains. PbRAV2, PbRAV3, PbRAV8, PbRAV9, PbRAV10, and PbRAV11 in pear were grouped with MdRAV2, MdRAV3, MdRAV7, and MdRAV9 in apple, suggesting that RAV genes in pear and apple emerged together during evolution and share a common ancestor. The number of species harboring RAV superfamily genes in Pyrus was higher than the numbers in Arabidopsis (5) and Malus (9). This may be the result of gene duplication in plants, which is considered a fundamental driving force in the evolution of genomes [34] as it provides raw material for new genes that can then lead to the emergence of new functions. Segmental duplication, tandem duplication, and transposition events such as retro- and replicative transposition [35] are the three main patterns of gene evolution; the first two are thought to underlie gene family expansion in plants [36]. Tandem duplications can be identified based on the presence of multiple members of a single gene family within the same or in neighboring intergenic regions [37].
Among the 11 RAV genes in pear, there were two pairs of tandem repeats (PbRAV2/PbRAV3 and PbRAV8/PbRAV9). We also detected three segmental duplication pairs involving five PbRAV genes (PbRAV2/PbRAV8, PbRAV2/PbRAV6, and PbRAV1/PbRAV7), suggesting that segmental duplication was mainly responsible for expansion of the RAV gene family in Pyrus. A syntenic analysis of RAV genes in Pyrus, Arabidopsis, and Malus showed that PbRAV genes had higher homology with RAV genes in Malus and lower homology with those in Arabidopsis. However, PbRAV6 was related to Arabidopsis RAVs, indicating that RAV6 in different plants may have evolved from a common ancestor.
Conserved domains or amino acid motifs in TFs are frequently involved in DNA binding, nuclear localization, protein–protein interactions, and transcriptional activity [10], and TFs with similar domains or motifs are likely to have similar functions. We found that all PbRAV members harbored motifs 1, 2, and 3. All members of group I had motifs 6 and 9, which were not found in other group members, while motif 10 was only present in group III. The distribution of these motifs may account for the variable responses of PbRAVs to different conditions.
Introns not only function in the regulation of gene expression, but also participate in gene evolution [38]; this has been observed in mammals, nematodes, insects, fungi, and plants. Our analysis of RAV gene structure revealed that one of genes (PbRAV6) contained a single intron, whereas the others had no introns. PbRAV genes were expressed in different plant tissues under normal conditions, with PbRAV6 being the most highly expressed. Thus, RAV gene expression may be affected by the presence or absence of an intron. Moreover, the abundance of PbRAVs varied across tissues and PbRAVs showed distinct expression profiles, implying that these genes have specific roles in different pear tissues. For example, PbRAV3 and PbRAV5 were highly expressed in leaf, petal, and ovary but not in root, whereas PbRAV6 was highly expressed in root, leaf, ovary, and sepal. On the other hand, the expression of PbRAV1, PbRAV2, and PbRAV10 was low in all tissues, suggesting that these genes are not involved in plant development. Indeed, PbRAV6 expression decreased as development progressed—including in leaf and fruit—whereas PbRAV2 was upregulated. The fact that the downregulation of PbRAV6 also occurred during pollination confirms the important role of this gene in development.
Unlike animals, plants must adapt to various biotic and abiotic stressors throughout their life cycle. This requires the activation of genes associated with a resistant phenotype by TFs [39]. In our study, PbRAVs were expressed at low levels in fruit under biotic and abiotic stress. In diseased fruit, only PbRAV6 was present in all tissues. PbRAV6 and PbRAV7 were both expressed under drought stress; PbRAV6 expression increased with drought duration but decreased after watering. This indicates that PbRAV6 was involved in the response of pear to drought stress and was closely related to plant water deficit. On the other hand, PbRAV6 level decreased with a longer duration of salt stress, but the pattern was irregular. However, the expression of PbRAV7 decreased with the increase of salt stress time, indicating that PbRAV7 was negatively responsive to salt stress. Thus, different PbRAV genes show distinct responses depending on the type of stressor, which may be related to their structural diversity.
It is worth noting that PbRAVs play an important role in the regulation of peel color. Although their levels in fruit were low overall, there was a significant difference in the abundance of PbRAV6 in white vs. red peel, and it was always highly expressed in red peel. Furthermore, in ‘Xinli No. 7’ and ‘Xinqihong’ (the red bud mutation of ‘Xinli No. 7’), the expression level of PbRAV6 was same at the early coloring stage, but the expression level of PbRAV6 in ‘Xinli No. 7’ after fading was significantly lower than that in ‘Xinqihong’ at the late coloring stage, which indicates that the expression of PbRAV6 was closely related to the synthesis of anthocyanins. In strawberry (Fragaria ananassa), FaRAV1 was shown to promote anthocyanin accumulation by directly binding to the promoter of various genes in the anthocyanin biosynthesis pathway and increasing their expression including FaMYB10 (4.0 fold), chalcone synthase (CHS; 1.53-fold), flavanone hydroxylase (F3H; 1.95-fold), dihydroflavonol 4-reductase (DFR; 3.6-fold), and 5,3-O-glucosyltransferase (GT)1 (2.3-fold) [40]. In pear, PbRAV6 may have a similar function, which requires further investigation.

4. Materials and Methods

4.1. Database Search and Sequence Retrieval

The complete genome assembly of pear (P. bretschneideri Rehd) along with the complete proteome sequence file was downloaded from the Genome Database for Rosaceae (https://www.rosaceae.org (accessed on 5 March 2021)). Conserved amino acid sequences were used as a query to identify RAV TFs in the Pyrus proteome sequence file using CLC Sequence Viewer v7.6.1 [31]. Putative RAV TFs were confirmed by BLASTP searches of the NCBI database. This database was also used to obtain gene accession numbers, chromosome number, genomic information, and the protein size of RAV TFs. The nucleotide sequences of all identified RAVs were also retrieved from NCBI. The ExPASY online tool (https://web.expasy.org/protparam (accessed on 12 March 2021)) was used to calculate molecular weight, pI, and GRAVY of all PbRAV proteins. WoLF PSORT (http://www.genscript.com/psort/wolf_psort.html (accessed on 12 March 2021)) was used to predict the subcellular localization of PbRAV proteins.

4.2. Chromosomal Mapping, Intron/Exon Distribution, and Conserved Domain Analysis

The NCBI database was used to record the positions of the identified PbRAV genes on chromosomes, and Map Chart v2.32 was used to draw a map of chromosomal locations of PbRAV genes to scale [41]. Gene Structure Display Server (v2.0 http://gsds.cbi.pku.edu.cn/ (accessed on 15 March 2021)) was used to draw and visualize the intron–exon organization of RAV genes [42]. The whole genome sequence and the coding sequences of all RAV genes were used to construct the gene structure map containing introns.
In order to identify domains conserved among all PbRAVs, their protein sequences were analyzed with MEME v5.0.3 [43] using default parameters, except that the minimum number of motif sites was set to 10.

4.3. Phylogenetic Comparison of RAV Proteins in P. bretschneideri, M. domestica, and A. thaliana

A phylogenetic tree was constructed using the protein sequences of putative RAV TFs from P. bretschneideri and M. domestica, with A. thaliana sequences used as a reference. Multiple sequence alignment of the 11 PbRAV proteins was performed using ClustalW v1.83. A total of 25 plant RAV proteins were used to construct the phylogenetic tree, including 11 from pear, 9 from apple, and 5 from Arabidosis. The tree was used to infer the evolutionary history and functions of PbRAV TFs. Their coding sequences were used for pairwise alignment with the built-in ClustalW and PAM protein weight matrix of MEGA7 [44]. The resultant alignments were analyzed for DNA sequence polymorphisms and DnaSP v5.10.01 [45] was used to compute the synonymous substitution rate (Ks) and nonsynonymous substitution rate (Ka). Ks/Ka was also calculated to evaluate codon selection during evolution.

4.4. Expression Patterns of PbRAVs in Various Tissues of Pear at Different Developmental Stages

The expression patterns of PbRAV genes in various tissues at different developmental stages were obtained from the pear gene expression atlas. The raw sequence reads from seven pear tissues were analyzed using the NCBI web browser (https://www.ncbi.nlm.nih.gov/bioproject/; accession no. PRJNA498777 (accessed on 12 March 2021)) [46]. The expression patterns of PbRAV genes at three different stages of ovary development and under two treatments (unpollinated (control) and hand-pollinated) were analyzed using 15 year old ‘Dangshansuli’ trees grafted onto P. betulifolia Bge rootstocks; three branches per treatment were used as three replicates. Ovaries were collected at 3, 9, and 14 days after full bloom (DAB) [47]. For the analysis of expression patterns of PbRAV genes in leaf samples at different developmental stages of pear, leaves were collected at 30, 45, 60, 75, and 90 DAB; the RNA sequencing (RNA-seq) data were downloaded from the Sequence Read Archive (SRA) (accession nos. SRR10997902–SRR10997912) [48]. Finally, the expression profiles of PbRAV genes based on RNA-seq data from four pear varieties at seven fruit development stages were downloaded from the SRA (accession no. SRP070620). The transcriptomes of four representative cultivars—namely ‘Yali’ (P. bretschneideri), ‘Kuerlexiangli’ (P. sinkiangensis), ‘Nanguoli’ (P. ussuriensis), and ‘Starkrimson’ (P. communis), which are the main cultivated species worldwide—were used for the analysis of gene expression patterns and to explore the relationship between different fruit traits. The following fruit development stages were analyzed: fruit setting (period 1), physiologic fruit dropping (period 2), rapid fruit enlargement (period 3), 1 month after fruit enlargement (period 4), pre-maturity (period 5), and maturity (period 6); additionally, one fruit senescence stage after harvest (period 7) was included in the analysis [49].

4.5. Expression Patterns of PbRAVs under Different Stress Conditions

Expression patterns of PbRAVs in response to abiotic and biotic stress were based on microarray data downloaded from the SRA (series matrix accession no. SRP051914 and SRP148620) [50,51] and data from the present study.

4.5.1. Salt Stress

This experiment was conducted in the pear breeding laboratory of Qingdao Agricultural University. Two varieties of pear, ‘QAUP-1’ (P. ussuriensis Maxim) and ‘Qingzhen D1’ (P. communis L. × P. bretschneideri Rehd), were used. Plants of similar size (5–6 leaves, about 10 cm tall) were selected after 40 days of growth and transferred to plastic tubs (50 cm × 35 cm × 15 cm) containing 20 L of a half-strength Hoagland’s nutrient solution [52]. The tubs, wrapped with black plastic to block light exposure to the root systems, were placed in a growth chamber (25 °C/18 °C day/night). Light was provided by sodium lamps during a 14 h photoperiod (photon flux density of 150 μmol/m2/s). The nutrient solution was continuously aerated with an air pump, and dissolved oxygen concentrations were maintained at 8.0–8.5 mg/L by a dissolved oxygen controller (FC-680; Corporation of Super, Shanghai, China). The pH was adjusted to 6.5 ± 0.1 with H3PO4, and the solution was refreshed every 3 days. Seedlings were precultured for 10 days to allow them to adapt to the new conditions. After adaption to the culture environment, salt stress treatment was applied: half-strength nutrient solution and 100 mmol/L NaCl. Leaf and root samples were collected from the plants 0, 12, and 24 h after treatment along with control samples. Each treatment contained three replicates of 50 plants. The materials were stored at −80 °C, and then used for transcriptional sequencing.

4.5.2. Drought Stress

P. betulaefolia plants used in this experiment were 3 months old. Uniform and healthy plants were placed in a beaker containing distilled water that was kept in a growth chamber at 26 °C with a 16 h light/8 h dark photoperiod for 2 days before dehydration treatment. Seedlings were transferred to clean filter paper (90 mm × 90 mm) and allowed to dry for 0, 1, 3, and 6 h at 26 °C, followed by recovery in water at 26 °C for 24 h. The leaves were independently harvested at the designated dehydration time points, immediately placed in liquid nitrogen, and stored at −80 °C until they were used for RNA extraction. Each treatment contained three biological repeats [50].

4.5.3. Cork Spots

Fruits of ‘1–43’ pear were obtained from the Jiaozhou experiment and demonstration station of Qingdao Agricultural University in Qingdao, Shandong Province, China. The superior pear line ‘1–43’ is the hybrid from ‘Xinli No. 7’ (P. bretschneideri Rehd) × ‘Zhongxiang Pear’ (P. bretschneideri Rehd). Its fruit showed cork spots at 180 days after anthesis. We took normal pear flesh without disease, pear flesh with moderate disease and pear flesh with serious cork spots 180 days after flowering as materials, including three biological repeats. The materials were stored at −80 °C, and then used for transcriptional sequencing.

4.5.4. Pear Black Spot Disease

For the inoculations, inoculum production was conducted using a pear black spot (PBS) strain (H) obtained from leaves of the ‘Xiangnan’ pear from the germplasm bank of Wu Chang Sand Pear Garden National Fruit-tree Germplasm Resource (WCSPGNFGR). The H strain can infect the ‘Hongfen’ pear but not the ‘Jinjing’ pear. For inoculation assays with PBS, the concentration of conidia was adjusted to 1 × 10⁶ spores mL−1. The spore suspension was sprayed onto detached young leaves of ‘Jinjing’ and ‘Hongfen’ pear varieties with a glass atomizer. Control leaves were sprayed with distilled water. The inoculated leaves were incubated in a humid chamber at 28 °C. Samples H-CK, H-P, J-CK, and J-P were used in the experimental design and data analysis. All of the samples were tested in triplicate, and the experiments were performed on three biological replicates [51].

4.6. Plant Growth Conditions and Quantitative Real-Time (qRT)-PCR Analysis

Samples of healthy and uniform 3 year old ‘Xinqihong’ and ‘Xinli No. 7’ pear plants that had been grafted on P. betulifolia Bunge rootstock were collected at Jiaodong Peninsula Regional Experimental Park (37.52° N, 120.25° E), which is in a region with a warm temperate continental monsoon climate, an average annual precipitation of 672.5 mm, and an average annual temperature of 12.6 °C. ‘Xinqihong’ pears were bagged (white), while others were not bagged (red) as controls. The peel was harvested at the commercial ripening stage for transcriptome analysis. ‘Xinli No. 7’ (P. bretschneideri Rehd.) red pear cultivar and its bud spontaneous mutation ‘Xinqihong’, which has fruits with a stronger red color, were collected and the pericarp was obtained for transcriptomic analysis during the normal growth periods of ‘Xinli No. 7’ (coloring, 87 DAB; coloring peak, 107 DAB; and fading, 127 DAB). Three replicate plants were analyzed for each time point.
Total RNA of pear peel samples at the three different stages was extracted using the RNAprep Pure Plant Plus Kit (Tiangen, Beijing, China) and treated with DNase I (RNase-free; Takara Bio, Dalian, China) to eliminate residual contaminating genomic DNA. For qRT-PCR, 1.5 μg total RNA was used to synthesize first-strand cDNA with the PrimeScript II 1st Strand cDNA Synthesis kit (Takara Bio) according to the manufacturer’s instructions. qRT-PCR amplification was carried out as follows: 95 °C for 5 min, 45 cycles at 95 °C for 15 s, 60 °C for 30 s, and 72 °C for 30 s using the Roche 480 real-time PCR system (Basil, Switzerland) in standard mode with the FastStart Essential DNA Green Master kit. All reactions were performed in triplicate at a volume of 20 µL, containing 2 µL of 10-fold diluted cDNA. The Pyrus ACTIN gene was used as the reference to normalize the qRT-PCR data, and relative gene expression levels were determined via the 2−ΔΔCT method [53]. All experiments were performed with three biological replicates and all primer sequences are shown in Supplementary Table S1.

4.7. Measurement of Anthocyanin Content in Peel

Approximately 1 g of fruit peel was ground to a fine powder in liquid nitrogen and extracted with 5 mL of extraction solution (1% HCl in methanol) at 4 °C for 12 h. After centrifugation at 12,000× g for 20 min, the supernatant was transferred to a clean tube and the absorbance at 510 nm was measured with a spectrophotometer (UV1800; Meipuda, Shanghai, China). The anthocyanin content was calculated using the equation Ca = 1000 × A × V/(a × b × W), where Ca is the total anthocyanin content (mg/g), A is the absorbance value, V is the extraction solution volume, a is the absorptivity of anthocyanin (0.0775), b is the thickness of the colorimetric ware, and W is the fresh weight of fruit skin [54].

4.8. Statistical Analysis

Statistical analysis was performed using Excel 2020 (Microsoft, Redmond, WA, USA). Values are represented as the mean ± SD of three independent biological replicates. Data were analyzed with Duncan’s test, and p ≤ 0.05 was considered significant.

5. Conclusions

In this study, 11 RAV TFs from pear were identified and characterized based on genome sequences. The phylogenetic analysis of PbRAVs provided insight into the evolution of RAV family TFs in fruit plants. Based on our analysis of their expression patterns in pear tissues at different growth stages, we speculate that PbRAV6 and PbRAV7 play an important role in the responses to drought and salt stress, respectively; moreover, the identified expression patterns of pear peel with different coloring patterns showed that PbRAV6 is involved in the regulation of fruit peel color. Although additional studies are needed to clarify the functions of these genes, our findings can provide valuable resources to better understand the biological roles of RAV genes in pear, and serve as a valuable resource for future investigations on the functions of RAV TFs in fruit plants and the genetic and molecular mechanisms underlying fruit color.

Supplementary Materials

The following are available online at https://www.mdpi.com/article/10.3390/ijms22115567/s1, Figure S1: Protein sequences of conserved domains in RAVs, Figure S2: Expression patterns of PbRAVs genes between white and red peel, Table S1: List of qRT-PCR Primers.

Author Contributions

Investigation, H.S.; resources, D.L., J.S.; data curation, J.L.; writing—original draft preparation, J.L.; writing—review and editing, J.L., Z.D., C.L.; project administration, J.L., H.S.; funding acquisition, J.L., R.W., S.Z. All authors have read and agreed to the published version of the manuscript.

Funding

This research was funded by grants from the Agricultural Seed Project of Shandong Province (no. 2019LZGC008); Special Foundation for Distinguished Taishan Scholar of Shangdong; Qingdao People’s Livelihood Science and Technology Project (no. 19-6-1-67-nsh); Open Funds of the State Key Laboratory of Crop Genetics and Germplasm Enhancement (no. ZW202004); and Breeding Plan of Shandong Provincial Qingchuang Research Team (2019).

Institutional Review Board Statement

Not applicable.

Data Availability Statement

Data is contained within the article or supplementary material.

Conflicts of Interest

The authors declare no conflict of interest. The funders had no role in the design of the study; in the collection, analyses, or interpretation of data; in the writing of the manuscript, or in the decision to publish the results.

References

  1. Food and Agriculture Organization of the United Nations. Pear. Available online: http://www.fao.org/faostat/en/#data/QC Faq 2018 (accessed on 26 April 2021).
  2. Xu, Z.S.; Chen, M.; Li, L.C.; Ma, Y.Z. Functions of the ERF transcription factor family in plants. Botany 2008, 86, 969–977. [Google Scholar] [CrossRef]
  3. Licausi, F.; Ohme-Takagi, M.; Perata, P. APETALA2/Ethylene Responsive Factor (AP2/ERF) transcription factors: Mediators of stress responses and developmental programs. New Phytol. 2013, 199, 639–649. [Google Scholar] [CrossRef] [PubMed]
  4. Nakano, T.; Tsujimoto, Y.; Naito, Y.; Suzuki, K.; Fujimura, T.; Shinshi, H. Genome-wide analysis of the Arabidopsis and rice ERF gene families. Plant Cell Physiol. 2004, 45, S204. [Google Scholar] [CrossRef] [PubMed] [Green Version]
  5. Nakano, T.; Suzuki, K.; Fujimura, T.; Shinshi, H. Genome-wide analysis of the ERF gene family in Arabidopsis and rice. Plant Physiol. 2006, 140, 411–432. [Google Scholar] [CrossRef] [Green Version]
  6. Meng, X.; Li, F.; Liu, C.; Zhang, C.; Wu, Z.; Chen, Y. Isolation and characterization of an ERF transcription factor gene from cotton (Gossypium barbadense L.). Plant Mol. Biol. Rep. 2010, 28, 176–183. [Google Scholar] [CrossRef]
  7. Chen, N.; Yang, Q.; Su, M.; Pan, L.J.; Chi, X.Y.; Chen, M.N.; He, Y.A.; Yang, Z.; Wang, T.; Wang, M.A.; et al. Cloning of six ERF family transcription factor genes from peanut and analysis of their expression during abiotic stress. Plant Mol. Biol. Rep. 2012, 30, 1415–1425. [Google Scholar] [CrossRef]
  8. Liu, D.; Chen, X.; Liu, J.; Ye, J.; Guo, Z. The rice ERF transcription factor OsERF922 negatively regulates resistance to Magnaporthe oryzae and salt tolerance. J. Exp. Bot. 2012, 63, 3899–3911. [Google Scholar] [CrossRef] [Green Version]
  9. Liu, L.; Cao, X.L.; Bai, R.; Yao, N.; Li, L.B.; He, C.F. Isolation and characterization of the cold-induced Phyllostachys edulis AP2/ERF family transcription factor, peDREB1. Plant Mol. Biol. Rep. 2012, 30, 679–689. [Google Scholar] [CrossRef]
  10. Du, D.; Hao, R.; Cheng, T.; Pan, H.; Yang, W.; Wang, J.; Zhang, Q. Genome-wide analysis of the AP2/ERF gene family in Prunus mume. Plant Mol. Biol. Rep. 2013, 31, 741–750. [Google Scholar] [CrossRef]
  11. Girardi, C.L.; Rombaldi, C.V.; Dal Cero, J.; Nobile, P.M.; Laurens, F.; Bouzayen, M.; Quecini, V. Genome-wide analysis of the AP2/ERF superfamily in apple and transcriptional evidence of ERF involvement in scab pathogenesis. Sci. Hortic. 2013, 151, 112–121. [Google Scholar] [CrossRef] [Green Version]
  12. Cao, P.B.; Azar, S.; SanClemente, H.; Mounet, F.; Dunand, C.; Marque, G.; Teulieres, C. Genome-wide analysis of the AP2/ERF family in Eucalyptus grandis: An intriguing over-representation of stress-responsive DREB1/CBF genes. PLoS ONE 2015, 10, 0121041. [Google Scholar] [CrossRef] [PubMed]
  13. Charfeddine, M.; Sa€ıdi, M.N.; Charfeddine, S.; Hammami, A.; Bouzid, R.G. Genome-wide analysis and expression profiling of the ERF transcription factor family in potato (Solanum tuberosum L.). Mol. Biotechnol 2015, 57, 348–358. [Google Scholar] [CrossRef] [PubMed]
  14. Lakhwani, D.; Pandey, A.; Dhar, Y.V.; Bag, S.K.; Trivedi, P.K.; Asif, M.H. Genome-wide analysis of the AP2/ERF family in Musa species reveals divergence and neofunctionalisation during evolution. Sci. Rep. 2016, 6, 18878. [Google Scholar] [CrossRef] [Green Version]
  15. Li, X.; Tao, S.; Wei, S.; Ming, M.; Huang, X.; Zhang, S.; Wu, J. The mining and evolutionary investigation of AP2/ERF genes in pear (Pyrus). BMC Plant Biol. 2018, 18, 46. [Google Scholar] [CrossRef] [Green Version]
  16. Riechmann, J.L.; Meyerowitz, E.M. The AP2/EREBP family of plant transcription factors. Biol. Chem. 1998, 379, 633–646. [Google Scholar] [PubMed]
  17. Sakuma, Y.; Liu, Q.; Dubouzet, J.G.; Abe, H.; Shinozaki, K.; Yamaguchishinozaki, K. DNA-binding specificity of the ERF/AP2 domain of Arabidopsis DREBs, transcription factors involved in dehydration- and cold-inducible gene expression. Biochem. Biophys. Res. Commun. 2002, 290, 998–1009. [Google Scholar] [CrossRef]
  18. Yao, G.; Ming, M.; Allan, A.C.; Gu, C.; Li, L.T.; Wu, X.; Wang, R.Z.; Chang, Y.J.; Qi, K.J.; Zhang, S.L.; et al. Map-based cloning of the pear gene MYB114 identifies an interaction with other transcription factors to coordinately regulate fruit anthocyanin biosynthesis. Plant J. 2017, 92, 437–451. [Google Scholar] [CrossRef] [PubMed] [Green Version]
  19. Koyama, T.; Sato, F. The function of ETHYLENE RESPONSE FACTOR genes in the light-induced anthocyanin production of Arabidopsis thaliana leaves. Plant Biotechnol. 2018, 35, 87–91. [Google Scholar] [CrossRef] [Green Version]
  20. Zhang, J.; Xu, H.; Wang, N.; Jiang, S.; Fang, H.; Zhang, Z.; Yang, G.; Wang, Y.; Su, M.; Chen, X. The ethylene response factor MdERF1B regulates anthocyanin and proanthocyanidin biosynthesis in apple. Plant Mol. Biol. 2018, 98, 205–218. [Google Scholar] [CrossRef]
  21. An, J.P.; Wang, X.F.; Li, Y.Y.; Song, L.Q.; Zhao, L.L.; You, C.X.; Hao, Y.J. EIN3-LIKE1, MYB1, and ETHYLENE RESPONSE FACTOR3 act in a regulatory loop that synergistically modulates ethylene biosynthesis and anthocyanin accumulation. Plant Physiol. 2018, 178, 808–823. [Google Scholar] [CrossRef]
  22. Ni, J.; Bai, S.; Zhao, Y.; Qian, M.; Tao, R.; Yin, L.; Gao, L.; Teng, Y. Ethylene response factors Pp4ERF24 and Pp12ERF96 regulate blue light-induced anthocyanin biosynthesis in ‘Red Zaosu’ pear fruits by interacting with MYB114. Plant Mol. Biol. 2019, 99, 67–78. [Google Scholar] [CrossRef] [PubMed]
  23. Fu, M.J.; Kang, H.K.; Son, S.H.; Kim, S.K.; Nam, K.H. A subset of Arabidopsis RAV transcription factors modulates drought and salt stress responses independent of ABA. Plant Cell Physiol. 2014, 55, 1892–1904. [Google Scholar] [CrossRef] [Green Version]
  24. Kagaya, Y.; Ohmiya, K.; Hattori, T. RAV1, a novel DNA-binding protein, binds to bipartite recognition sequence through two distinct DNA-binding domains uniquely found in higher plants. Nucleic Acids Res. 1999, 27, 470–478. [Google Scholar] [CrossRef] [PubMed]
  25. Zhang, K.X.; Lin, Z.; Yang, X.; Li, M.M.; Sun, J.Z.; Wang, K.; Li, Y.H.; Zheng, Y.H.; Yao, Y.H.; Li, W.B. GmRAV1 regulates regeneration of roots and adventitious buds by the cytokinin signaling pathway in Arabidopsis and soybean. Physiol. Plant. 2018, 165, 814–829. [Google Scholar] [CrossRef] [PubMed]
  26. Feng, C.Z.; Yun, C.; Wang, C.; Kong, Y.H.; Wu, W.H.; Chen, Y.F. Arabidopsis RAV1 transcription factor, phosphorylated by SnRK2 kinases, regulates the expression of ABI3, ABI4, and ABI5 during seed germination and early seedling development. Plant J. 2015, 80, 654–668. [Google Scholar] [CrossRef]
  27. Gao, Y.; Han, D.; Jia, W.; Ma, X.H.; Yang, Y.X.; Xu, Z.C. Molecular characterization and systematic analysis of NtAP2/ERF in tobacco and functional determination of NtRAV-4 under drought stress. Plant Physiol. Biochem. 2020, 156, 420–435. [Google Scholar] [CrossRef] [PubMed]
  28. Zhao, L.; Zhang, F.; Liu, B.; Yang, S.L.; Xiong, X.; Hassani, D.; Zhang, Y.D. CmRAV1 shows differential expression in two melon (Cucumis melo L.) cultivars and enhances salt tolerance in transgenic Arabidopsis plants. Acta Biochim. Biophys. Sin. 2019, 51, 1123–1133. [Google Scholar] [CrossRef]
  29. Li, X.J.; Li, M.; Zhou, Y.; Hu, S.; Hu, R.; Chen, Y.; Li, X.B. Overexpression of cotton RAV1 gene in Arabidopsis confers transgenic plants high salinity and drought sensitivity. PLoS ONE 2015, 10, 0118056. [Google Scholar] [CrossRef] [PubMed] [Green Version]
  30. Wei, Y.; Chang, Y.; Zeng, H.; Liu, G.Y.; He, C.Z.; Shi, H.T. RAV transcription factors are essential for disease resistance against cassava bacterial blight via activation of melatonin biosynthesis genes. J. Pineal Res. 2018, 64, e12454. [Google Scholar] [CrossRef]
  31. Jin, J.; Tian, F.; Yang, D.C.; Meng, Y.Q.; Kong, L.; Luo, J.; Gao, G. Plant TFDB 4.0: Toward a central hub for transcription factors and regulatory interactions in plants. Nucleic Acids Res. 2017, 45, D1040–D1045. [Google Scholar] [CrossRef] [Green Version]
  32. Zhang, M.; Chen, Y.; Jin, X.F.; Cai, Y.X.; Yuan, Y.Y.; Fu, C.H.; Yu, L.J. New different origins and evolutionary processes of AP2/EREBP transcription factors in Taxus chinensis. BMC Plant Biol. 2019, 19, 413. [Google Scholar] [CrossRef] [Green Version]
  33. Liu, C.X.; Zhang, T.Z. Expansion and stress responses of the AP2/EREBP superfamily in cotton. BMC Genom. 2017, 18, 118. [Google Scholar] [CrossRef] [PubMed] [Green Version]
  34. Kong, H.; Landherr, L.L.; Frohlich, M.W.; Leebens-Mack, J.; Ma, H.; DePamphilis, C.W. Patterns of gene duplication in the plant SKP1 gene family in angiosperms: Evidence for multiple mechanisms of rapid gene birth. Plant J. 2007, 50, 873–885. [Google Scholar] [CrossRef] [PubMed]
  35. Moore, R.C.; Purugganan, M.D. The early stages of duplicate gene evolution. Proc. Natl. Acad. Sci. USA 2003, 100, 15682–15687. [Google Scholar] [CrossRef] [PubMed] [Green Version]
  36. Cannon, S.B.; Mitra, A.; Baumgarten, A.; Young, N.D.; May, G. The roles of segmental and tandem gene duplication in the evolution of large gene families in Arabidopsis thaliana. BMC Plant Biol. 2004, 4, 10. [Google Scholar] [CrossRef] [Green Version]
  37. Ramamoorthy, R.; Jiang, S.Y.; Kumar, N.; Venkatesh, P.N.; Ramachandran, S. A comprehensive transcriptional profiling of the WRKY gene family in rice under various abiotic and phytohormone treatments. Plant Cell Physiol. 2008, 49, 865–879. [Google Scholar] [CrossRef]
  38. Rose, A.B. Intron-mediated regulation of gene expression. Curr. Top. Microbiol. Immunol. 2008, 326, 277–290. [Google Scholar]
  39. Li, H.; Wang, Y.; Wu, M.; Li, L.; Li, C.; Han, Z.; Yuan, J.; Chen, C.; Song, W.; Wang, C. Genome-wide identification of AP2/ERF transcription factors in Cauliflower and expression profiling of the ERF family under salt and drought stresses. Front. Plant Sci. 2017, 8, 946. [Google Scholar] [CrossRef] [PubMed]
  40. Zhang, Z.Y.; Shi, Y.N.; Ma, Y.C.; Yang, X.F.; Yin, X.R.; Zhang, Y.Y.; Xiao, Y.W.; Liu, W.L.; Li, Y.D.; Li, S.J.; et al. The strawberry transcription factor FaRAV1 positively regulates anthocyanin accumulation by activation of FaMYB10 and anthocyanin pathway genes. Plant Biotechnol. J. 2020, 11, 2267–2279. [Google Scholar] [CrossRef] [Green Version]
  41. Voorrips, R. MapChart: Software for the graphical presentation of linkage maps and QTLs. J. Hered. 2002, 93, 77–78. [Google Scholar] [CrossRef] [Green Version]
  42. Hu, B.; Jin, J.; Guo, A.Y.; Zhang, H.; Luo, J.; Gao, G. GSDS 2.0: An upgraded gene feature visualization server. Bioinformatics 2014, 31, 1296–1297. [Google Scholar] [CrossRef] [Green Version]
  43. Bailey, T.L.; Johnson, J.; Grant, C.E.; Noble, W.S. The MEME Suite. Nucleic Acids Res. 2015, W1, 39–49. [Google Scholar] [CrossRef] [Green Version]
  44. Kumar, S.; Stecher, G.; Tamura, K. MEGA7: Molecular evolutionary genetics analysis version 7.0 for bigger datasets. Mol. Biol. Evol. 2016, 33, 1870–1874. [Google Scholar] [CrossRef] [PubMed] [Green Version]
  45. Librado, P.; Rozas, J. DnaSP v5: A software for comprehensive analysis of DNA polymorphism data. Bioinformatics 2009, 25, 1451–1452. [Google Scholar] [CrossRef] [PubMed] [Green Version]
  46. Li, Q.; Qiao, X.; Yin, H.; Zhou, Y.; Dong, H.; Qi, K.; Li, L.; Zhang, S. Unbiased subgenome evolution following a recent whole-genome duplication in pear (Pyrus bretschneideri Rehd.). Hortic. Res. 2019, 6, 34. [Google Scholar] [CrossRef] [PubMed] [Green Version]
  47. Liu, L.; Wang, Z.; Liu, J.; Liu, F.; Zhai, R.; Zhu, C.; Wang, H.; Ma, F.; Xu, L. Histological, hormonal and transcriptomic reveal the changes upon gibberellininduced parthenocarpy in pear fruit. Hortic. Res. 2018, 5, 1. [Google Scholar] [CrossRef] [Green Version]
  48. Zhao, S.; Wei, Y.; Pang, H.; Xu, J.; Li, Y.; Zhang, H.; Zhang, J.; Zhang, Y. Genome-wide identification of the PEBP genes in pears and the putative role of PbFT in flower bud differentiation. PeerJ 2020, 8. [Google Scholar] [CrossRef] [Green Version]
  49. Zhang, M.Y.; Xue, C.; Xu, L.; Sun, H.; Qin, M.F.; Zhang, S.; Wu, J. Distinct transcriptome profiles reveal gene expression patterns during fruit development and maturation in five main cultivated species of pear (Pyrus L.). Sci. Rep. 2016, 6, 28130. [Google Scholar] [CrossRef] [PubMed] [Green Version]
  50. Li, K.Q.; Xu, X.Y.; Huang, X.S. Identification of differentially expressed genes related to dehydration resistance in a highly drought-tolerant pear, Pyrus betulaefolia, as through RNA-Seq. PLoS ONE 2016, 11. [Google Scholar] [CrossRef] [PubMed]
  51. Yang, X.; Hu, H.; Yu, D.; Sun, Z.; He, X.; Zhang, J.; Chen, Q.; Tian, R.; Fan, J. Candidate resistant genes of sand pear (Pyrus pyrifolia Nakai) to Alternaria alternate revealed by transcriptome sequencing. PLoS ONE 2015, 10. [Google Scholar] [CrossRef]
  52. Hoagland, D.R.; Arnon, D.I. The water-culture method for growing plants without soil. Circ. Calif. Agric. Expt. Stn. 1950, 347, 32. [Google Scholar]
  53. Livak, K.J.; Schmittgen, T.D. Analysis of relative gene expression data using realtime quantitative PCR and the 2−ΔΔCT method. Methods 2001, 25, 402–408. [Google Scholar] [CrossRef] [PubMed]
  54. Chen, H.; Xin, G.; Zhang, B.; Yang, J.Y. Optimization of extraction technique of anthocyanin from red peel of ‘Nanguo’ pear. Food Sci. 2009, 30, 97–100. [Google Scholar]
Figure 1. Phylogenetic tree constructed with the neighbor-joining method using RAV TFs domains in P. bretschneideri, M. domestica, and Arabidopsis. The tree was divided into three groups (Groups I, II, and III).
Ijms 22 05567 g001
Figure 2. Schematic representation of protein and gene structures of P. bretschneideri RAV genes. Motifs 1–10 identified using the MEME search tool are marked on the protein sequences in each clade (I–III). The length and order of each motif corresponds to the actual length and position in the protein sequences. The coding sequence and untranslated regions are represented by filled dark blue and orange boxes, respectively.
Ijms 22 05567 g002
Figure 3. Chromosomal distribution of PbRAV genes drawn using MapChart v2.2. Scale represents chromosome length: 0–40 Mb.
Ijms 22 05567 g003
Figure 4. Collinearity of RAVs. (A) Distribution of segmentally duplicated PbRAV genes on P. bretschneideri chromosomes. Gray lines indicate collinear blocks in the whole P. bretschneideri genome and red lines indicate duplicated PbRAV gene pairs. (B) Collinearity of P. bretschneideri, Arabidopsis, and M. domestica RAV genes. Red lines indicate the syntenic gene pairs.
Ijms 22 05567 g004
Figure 5. Expression profiles of PbRAVs in pear. (A,B) Expression profile of PbRAVs in different tissues (A) and in ovary and leaf at different development stages (B) of P. bretschneideri ‘Xinli No. 7.’ (C) Expression profile of PbRAVs at different fruit development stages in various P. bretschneideri varieties. P-ovary: pollinated ovary; Up-ovary: unpollinated ovary.
Ijms 22 05567 g005
Figure 6. Expression profiles of PbRAV genes under abiotic and biotic stress. (A) Abiotic stress included salt and drought stress. (B) Biotic stress included cork spot and pear black spot disease. C-D: cork spot; MM: moderate disease mesocarp; NM: normal mesocarp; PBS-D: pear black spot disease; QL: ‘Qaup-1’ leaf, QR: ‘Qaup-1’ root; QZL: ‘Qingzhen D1’ leaf; QZR: ‘Qingzhen D1’ root; SM: severe disease mesocarp.
Ijms 22 05567 g006
Figure 7. Expression profile of PbRAVs in red pear peel. (A) Appearance of ‘Xinqihong’ pear after bagging. (B) Anthocyanin content and expression of genes regulating anthocyanin biosynthesis. (C) Expression profile of PbRAVs in white and red pear peel. ** p < 0.01, *** p < 0.001 (Student’s t test). R: red pear peel; W: white pear peel. The expression levels of genes in the peel of white pear under control conditions were normalized as 1.0.
Ijms 22 05567 g007
Figure 8. Expression profiles of PbRAVs in two pear cultivars during the fading period. (A) Morphological changes in ‘Xinli No. 7’ and ‘Xinqihong’ pear varieties during the fading period. (B) Anthocyanin content, expression of genes regulating anthocyanin biosynthesis, and expression of PbRAVs. (C) Expression profile of PbRAVs in the two pear cultivars. Different lowercase letters indicate statistical significance at p < 0.05 (Duncan’s test). The expression levels of genes in the peel of ‘Xinli No. 7’ pear at 87 DAB were normalized as 1.0. DAB: days after full bloom.
Ijms 22 05567 g008
Table 1. General information on Pyrus bretschneideri RAV genes.
Gene NameGene ID Number 1ChromosomeStart SiteTermination SiteAmino Acid ResiduesMW
(Da)
pIHydrophilicitySubcellular Localization 2
PbRAV1rna2033421254332125536934539,656.688.75−0.663Nuclear
PbRAV2rna110289177132981771471531435,670.508.61−0.525Cytoplasmic
PbRAV3rna110309177517681775270331135,287.238.98−0.497Cytoplasmic
PbRAV4rna18153114367928436898935340,901.036.34−0.635Cytoplasmic
PbRAV5rna51022111362857136391835340,901.036.34−0.635Nuclear
PbRAV6rna37631131545457154718338041,708.859.14−0.553Cytoplasmic
PbRAV7rna1248715107316071073265034740,063.178.87−0.631Nuclear
PbRAV8rna50871162581667258292631335,191.358.79−0.491Cytoplasmic
PbRAV9rna50870162568673256999633137,772.828.42−0.568Cytoplasmic
PbRAV10rna2544317163153241631629630334,391.248.89−0.491Cytoplasmic
PbRAV11rna2544417163283531632941632136,732.828.71−0.568Cytoplasmic
1 From Pyrus bretschneideri Genome Sequence Consortium database. 2 Predicted using WoLFPSORT (http://www.genscript.com/psort/wolf_psort.html (accessed on 12 March 2021)). Abbreviations: MW: molecular weight; pI: theoretical isoelectric point.
Publisher’s Note: MDPI stays neutral with regard to jurisdictional claims in published maps and institutional affiliations.

