
Do Autophagy Enhancers/ROS Scavengers Alleviate Consequences of Mild Mitochondrial Dysfunction Induced in Neuronal-Derived Cells?


Abstract
:1. Introduction
2. Materials and Methods
2.1. Cell Culture
2.2. Determination of Cell Viability by the MTT Assay
2.3. Determination of Mitochondrial Respiration Parameters
2.4. Determination of Protein Concentration
2.5. Determination of ATP Levels
2.6. Determination of Mitochondrial OXPHOS Complex I Enzymatic Activity
2.7. Western Blotting
2.8. Statistical Analysis
3. Results
4. Discussion
5. Limitations
Supplementary Materials
Author Contributions
Funding
Institutional Review Board Statement
Informed Consent Statement
Data Availability Statement
Acknowledgments
Conflicts of Interest
References
- Osellame, L.D.; Blacker, T.S.; Duchen, M.R. Cellular and molecular mechanisms of mitochondrial function. Best Pract. Res. Clin. Endocrinol. Metab. 2012, 26, 711–723. [Google Scholar] [CrossRef]
- Jeong, S.-Y.; Seol, D.-W. The role of mitochondria in apoptosis. BMB Rep. 2008, 41, 11–22. [Google Scholar] [CrossRef] [PubMed]
- Niizuma, K.; Yoshioka, H.; Chen, H.; Kim, G.S.; Jung, J.E.; Katsu, M.; Okami, N.; Chan, P.H. Mitochondrial and apoptotic neuronal death signaling pathways in cerebral ischemia. Biochim. Biophys. Acta 2010, 1802, 92–99. [Google Scholar] [CrossRef]
- Haeberlein, S.L.B. Mitochondrial function in apoptotic neuronal cell death. Neurochem. Res. 2004, 29, 521–530. [Google Scholar] [CrossRef] [PubMed]
- Faizi, M.; Salimi, A.; Rasoulzadeh, M.; Naserzadeh, P.; Pourahmad, J. Schizophrenia Induces Oxidative Stress and Cytochrome C Release in Isolated Rat Brain Mitochondria: A Possible Pathway for Induction of Apoptosis and Neurodegeneration. Iran. J. Pharm. Res. IJPR 2014, 13, 93–100. [Google Scholar] [PubMed]
- Clay, H.B.; Sillivan, S.; Konradi, C. Mitochondrial dysfunction and pathology in bipolar disorder and schizophrenia. Int. J. Dev. Neurosci. 2011, 29, 311–324. [Google Scholar] [CrossRef] [PubMed]
- Desagher, S.; Martinou, J.-C. Mitochondria as the central control point of apoptosis. Trends Cell Biol. 2000, 10, 369–377. [Google Scholar] [CrossRef]
- Batlevi, Y.; La Spada, A.R. Mitochondrial autophagy in neural function, neurodegenerative disease, neuron cell death, and aging. Neurobiol. Dis. 2011, 43, 46–51. [Google Scholar] [CrossRef]
- Edens, B.M.; Miller, N.; Ma, Y.-C. Impaired Autophagy and Defective Mitochondrial Function: Converging Paths on the Road to Motor Neuron Degeneration. Front. Cell. Neurosci. 2016, 10, 44. [Google Scholar] [CrossRef]
- Scheffler, I.E. A century of mitochondrial research: Achievements and perspectives. Mitochondrion 2001, 1, 3–31. [Google Scholar] [CrossRef]
- Valko, M.; Leibfritz, D.; Moncol, J.; Cronin, M.T.D.; Mazur, M.; Telser, J. Free radicals and antioxidants in normal physiological functions and human disease. Int. J. Biochem. Cell Biol. 2007, 39, 44–84. [Google Scholar] [CrossRef] [PubMed]
- Adam-Vizi, V.; Starkov, A.A. Calcium and Mitochondrial Reactive Oxygen Species Generation: How to Read the Facts. J. Alzheimers Dis. 2010, 20, S413–S426. [Google Scholar] [CrossRef] [PubMed]
- Zorov, D.B.; Juhaszova, M.; Sollott, S.J. Mitochondrial Reactive Oxygen Species (ROS) and ROS-Induced ROS Release. Physiol. Rev. 2014, 94, 909–950. [Google Scholar] [CrossRef]
- Raichle, M.E.; Gusnard, D.A. Appraising the brain’s energy budget. Proc. Natl. Acad. Sci. USA 2002, 99, 10237–10239. [Google Scholar] [CrossRef]
- Simpson, I.A.; Carruthers, A.; Vannucci, S.J. Supply and Demand in Cerebral Energy Metabolism: The Role of Nutrient Transporters. Br. J. Pharmacol. 2007, 27, 1766–1791. [Google Scholar] [CrossRef] [PubMed]
- Gleichmann, M.; Mattson, M.P. Neuronal Calcium Homeostasis and Dysregulation. Antioxid. Redox Signal. 2011, 14, 1261–1273. [Google Scholar] [CrossRef]
- Fang, C.; Gu, L.; Smerin, D.; Mao, S.; Xiong, X. The Interrelation between Reactive Oxygen Species and Autophagy in Neurological Disorders. Oxidative Med. Cell. Longev. 2017, 2017, 1–16. [Google Scholar] [CrossRef]
- Bar-Yosef, T.; Damri, O.; Agam, G. Dual Role of Autophagy in Diseases of the Central Nervous System. Front. Cell. Neurosci. 2019, 13, 196. [Google Scholar] [CrossRef]
- Chen, B.; Zhao, J.; Zhang, R.; Zhang, L.; Zhang, Q.; Yang, H.; An, J. Neuroprotective effects of natural compounds on neurotoxin-induced oxidative stress and cell apoptosis. Nutr. Neurosci. 2020, 1–22. [Google Scholar] [CrossRef]
- Ray, S.K. Modulation of autophagy for neuroprotection and functional recovery in traumatic spinal cord injury. Neural Regen. Res. 2020, 15, 1601. [Google Scholar] [CrossRef]
- Damri, O.; Shemesh, N.; Agam, G. Is There Justification to Treat Neurodegenerative Disorders by Repurposing Drugs? The Case of Alzheimer’s Disease, Lithium, and Autophagy. Int. J. Mol. Sci. 2020, 22, 189. [Google Scholar] [CrossRef]
- Rubinsztein, D.C.; Gestwicki, J.E.; Murphy, L.O.; Klionsky, D.J. Potential therapeutic applications of autophagy. Nat. Rev. Drug Discov. 2007, 6, 304–312. [Google Scholar] [CrossRef] [PubMed]
- Damri, O.; Asslih, S.; Shemesh, N.; Natour, S.; Noori, O.; Daraushe, A.; Einat, H.; Kara, N.; Las, G.; Agam, G. Using mitochondrial respiration inhibitors to design a novel model of bipolar disorder-like phenotype with construct, face and predictive validity. Transl. Psychiatry 2021, 11, 1–14. [Google Scholar] [CrossRef] [PubMed]
- Betarbet, R.; Sherer, T.B.; MacKenzie, G.; Garcia-Osuna, M.; Panov, A.V.; Greenamyre, J.T. Chronic systemic pesticide exposure reproduces features of Parkinson’s disease. Nat. Neurosci. 2000, 3, 1301–1306. [Google Scholar] [CrossRef] [PubMed]
- Greenamyre, J.T.; Sherer, T.B.; Betarbet, R.; Panov, A.V. Complex I and Parkinson’s Disease. IUBMB Life 2001, 52, 135–141. [Google Scholar] [CrossRef]
- Chu, C.T.; Bayır, H.; E Kagan, V. LC3 binds externalized cardiolipin on injured mitochondria to signal mitophagy in neurons. Autophagy 2014, 10, 376–378. [Google Scholar] [CrossRef] [PubMed]
- Chu, C.T.; Ji, J.; Dagda, R.K.; Jiang, J.F.; Tyurina, Y.; Kapralov, A.A.; Tyurin, V.A.; Yanamala, N.; Shrivastava, I.H.; Mohammadyani, D.; et al. Cardiolipin externalization to the outer mitochondrial membrane acts as an elimination signal for mitophagy in neuronal cells. Nat. Cell Biol. 2013, 15, 1197–1205. [Google Scholar] [CrossRef]
- Abdelkader, N.F.; Safar, M.M.; Salem, H.A. Ursodeoxycholic Acid Ameliorates Apoptotic Cascade in the Rotenone Model of Parkinson’s Disease: Modulation of Mitochondrial Perturbations. Mol. Neurobiol. 2016, 53, 810–817. [Google Scholar] [CrossRef] [PubMed]
- Kim, M.H.; Min, J.-S.; Lee, J.Y.; Chae, U.; Yang, E.-J.; Song, K.-S.; Lee, H.-S.; Lee, H.J.; Lee, S.-R.; Lee, N.-S. Oleuropein isolated from Fraxinus rhynchophylla inhibits glutamate-induced neuronal cell death by attenuating mitochondrial dysfunction. Nutr. Neurosci. 2017, 21, 520–528. [Google Scholar] [CrossRef]
- Rai, Y.; Pathak, R.; Kumari, N.; Sah, D.K.; Pandey, S.; Kalra, N.; Soni, R.; Dwarakanath, B.S.; Bhatt, A.N. Mitochondrial biogenesis and metabolic hyperactivation limits the application of MTT assay in the estimation of radiation induced growth inhibition. Sci. Rep. 2018, 8, 1–15. [Google Scholar] [CrossRef] [PubMed]
- Shamir, A.; Rosolio, N.E.; Belmaker, R.H.; Agam, G. Interaction of calbindin D28k and inositol monophosphatase in human postmortem cortex: Possible implications for bipolar disorder. Bipolar Disord. 2005, 7, 42–48. [Google Scholar] [CrossRef]
- Janes, K.A. An analysis of critical factors for quantitative immunoblotting. Sci. Signal. 2015, 8, rs2. [Google Scholar] [CrossRef] [PubMed]
- Sarkar, S.; Davies, J.E.; Huang, Z.; Tunnacliffe, A.; Rubinsztein, D.C. Trehalose, a Novel mTOR-independent Autophagy Enhancer, Accelerates the Clearance of Mutant Huntingtin and α-Synuclein. J. Biol. Chem. 2007, 282, 5641–5652. [Google Scholar] [CrossRef]
- Li, J.; Kim, S.G.; Blenis, J. Rapamycin: One Drug, Many Effects. Cell Metab. 2014, 19, 373–379. [Google Scholar] [CrossRef]
- Maurer, I.C.; Schippel, P.; Volz, H.-P. Lithium-induced enhancement of mitochondrial oxidative phosphorylation in human brain tissue. Bipolar Disord. 2009, 11, 515–522. [Google Scholar] [CrossRef]
- Dean, O.; Giorlando, F.; Berk, M. N-acetylcysteine in psychiatry: Current therapeutic evidence and potential mechanisms of action. J. Psychiatry Neurosci. 2011, 36, 78–86. [Google Scholar] [CrossRef]
- Faulkner, K.; Liochev, S.; Fridovich, I. Stable Mn(III) porphyrins mimic superoxide dismutase in vitro and substitute for it in vivo. J. Biol. Chem. 1994, 269, 23471–23476. [Google Scholar] [CrossRef]
- Park, D.; Jeong, H.; Lee, M.N.; Koh, A.; Kwon, O.; Yang, Y.R.; Noh, J.; Suh, P.-G.; Park, H.; Ryu, S.H. Resveratrol induces autophagy by directly inhibiting mTOR through ATP competition. Sci. Rep. 2016, 6, 21772. [Google Scholar] [CrossRef]
- Bachmann, R.F.; Wang, Y.; Yuan, P.; Zhou, R.; Li, X.; Alesci, S.; Du, J.; Manji, H.K. Common effects of lithium and valproate on mitochondrial functions: Protection against methamphetamine-induced mitochondrial damage. Int. J. Neuropsychopharmacol. 2009, 12, 805–822. [Google Scholar] [CrossRef]
- Stacey, D.; Schubert, K.O.; Clark, S.R.; Amare, A.T.; Milanesi, E.; Maj, C.; Leckband, S.G.; Shekhtman, T.; Kelsoe, J.R.; Gurwitz, D.; et al. A gene co-expression module implicating the mitochondrial electron transport chain is associated with long-term response to lithium treatment in bipolar affective disorder. Transl. Psychiatry 2018, 8, 183. [Google Scholar] [CrossRef] [PubMed]
- Pieczenik, S.R.; Neustadt, J. Mitochondrial dysfunction and molecular pathways of disease. Exp. Mol. Pathol. 2007, 83, 84–92. [Google Scholar] [CrossRef]
- Stork, C.; Renshaw, P.F. Mitochondrial dysfunction in bipolar disorder: Evidence from magnetic resonance spectroscopy research. Mol. Psychiatry 2005, 10, 900–919. [Google Scholar] [CrossRef]
- Belmaker, R.H. Bipolar Disorder. N. Engl. J. Med. 2004, 351, 476–486. [Google Scholar] [CrossRef]
- Sarkar, S.; Floto, R.A.; Berger, Z.; Imarisio, S.; Cordenier, A.; Pasco, M.; Cook, L.J.; Rubinsztein, D.C. Lithium induces autophagy by inhibiting inositol monophosphatase. J. Cell Biol. 2005, 170, 1101–1111. [Google Scholar] [CrossRef] [PubMed]
- Heiseke, A.; Aguib, Y.; Riemer, C.; Baier, M.; Schätzl, H.M. Lithium induces clearance of protease resistant prion protein in prion-infected cells by induction of autophagy. J. Neurochem. 2009, 109, 25–34. [Google Scholar] [CrossRef]
- Fornai, F.; Longone, P.; Ferrucci, M.; Lenzi, P.; Isidoro, C.; Ruggieri, S.; Paparelli, A. Autophagy and amyotrophic lateral sclerosis: The multiple roles of lithium. Autophagy 2008, 4, 527–530. [Google Scholar] [CrossRef] [PubMed]
- Sarkar, S.; Krishna, G.; Imarisio, S.; Saiki, S.; O’Kane, C.; Rubinsztein, D.C. A rational mechanism for combination treatment of Huntington’s disease using lithium and rapamycin. Hum. Mol. Genet. 2007, 17, 170–178. [Google Scholar] [CrossRef]
- Mizushima, N.; Yoshimori, T.; Levine, B. Methods in Mammalian Autophagy Research. Cell 2010, 140, 313–326. [Google Scholar] [CrossRef] [PubMed]
- De Sousa, R.T.; Streck, E.L.; Zanetti, M.V.; Ferreira, G.K.; Diniz, B.S.; Brunoni, A.R.; Busatto, G.F.; Gattaz, W.F.; Machado-Vieira, R. Lithium increases leukocyte mitochondrial complex I activity in bipolar disorder during depressive episodes. Psychopharmacology 2014, 232, 245–250. [Google Scholar] [CrossRef]
- Fiorentini, A.; Rosi, M.C.; Grossi, C.; Luccarini, I.; Casamenti, F. Lithium Improves Hippocampal Neurogenesis, Neuropathology and Cognitive Functions in APP Mutant Mice. PLoS ONE 2010, 5, e14382. [Google Scholar] [CrossRef]
- Yoneyama, M.; Shiba, T.; Hasebe, S.; Umeda, K.; Yamaguchi, T.; Ogita, K. Lithium Promotes Neuronal Repair and Ameliorates Depression-Like Behavior following Trimethyltin-Induced Neuronal Loss in the Dentate Gyrus. PLoS ONE 2014, 9, e87953. [Google Scholar] [CrossRef]
- Kara, N.; Narayanan, S.; Belmaker, R.H.; Einat, H.; Vaidya, V.A.; Agam, G. Chronic Lithium Treatment Enhances the Number of Quiescent Neural Progenitors but Not the Number of DCX-Positive Immature Neurons. Int. J. Neuropsychopharmacol. 2015, 18, pyv003. [Google Scholar] [CrossRef]
- Hosseinpour-Moghaddam, K.; Caraglia, M.; Sahebkar, A. Autophagy induction by trehalose: Molecular mechanisms and therapeutic impacts. J. Cell. Physiol. 2018, 233, 6524–6543. [Google Scholar] [CrossRef] [PubMed]
- DeBosch, B.J.; Heitmeier, M.R.; Mayer, A.L.; Higgins, C.B.; Crowley, J.R.; Kraft, T.E.; Chi, M.; Newberry, E.P.; Chen, Z.; Finck, B.N.; et al. Trehalose inhibits solute carrier 2A (SLC2A) proteins to induce autophagy and prevent hepatic steatosis. Sci. Signal. 2016, 9, ra21. [Google Scholar] [CrossRef]
- Lee, H.-J.; Yoon, Y.-S.; Lee, S.-J. Mechanism of neuroprotection by trehalose: Controversy surrounding autophagy induction. Cell Death Dis. 2018, 9, 1–12. [Google Scholar] [CrossRef] [PubMed]
- Medeiros, D.M. Assessing mitochondria biogenesis. Methods 2008, 46, 288–294. [Google Scholar] [CrossRef] [PubMed]
- Pan, T.; Rawal, P.; Wu, Y.; Xie, W.; Jankovic, J.; Le, W. Rapamycin protects against rotenone-induced apoptosis through autophagy induction. Neuroscience 2009, 164, 541–551. [Google Scholar] [CrossRef]
- Li, Q.; Zhang, T.; Wang, J.; Zhang, Z.; Zhai, Y.; Yang, G.-Y.; Sun, X. Rapamycin attenuates mitochondrial dysfunction via activation of mitophagy in experimental ischemic stroke. Biochem. Biophys. Res. Commun. 2014, 444, 182–188. [Google Scholar] [CrossRef] [PubMed]
- Butler, C.R.; Boychuk, J.A.; Smith, B.N. Effects of Rapamycin Treatment on Neurogenesis and Synaptic Reorganization in the Dentate Gyrus after Controlled Cortical Impact Injury in Mice. Front. Syst. Neurosci. 2015, 9, 163. [Google Scholar] [CrossRef]
- Ramanathan, A.; Schreiber, S.L. Direct control of mitochondrial function by mTOR. Proc. Natl. Acad. Sci. USA 2009, 106, 22229–22232. [Google Scholar] [CrossRef]
- Zheng, X.; Boyer, L.; Jin, M.; Kim, Y.; Fan, W.; Bardy, C.; Berggren, T.; Evans, R.M.; Gage, F.H.; Hunter, T. Alleviation of neuronal energy deficiency by mTOR inhibition as a treatment for mitochondria-related neurodegeneration. eLife 2016, 5. [Google Scholar] [CrossRef] [PubMed]
- Lagouge, M.; Argmann, C.; Gerhart-Hines, Z.; Meziane, H.; Lerin, C.; Daussin, F.; Messadeq, N.; Milne, J.; Lambert, P.; Elliott, P.; et al. Resveratrol improves mitochondrial function and protects against metabolic disease by activating SIRT1 and PGC-1α. Cell 2006, 127, 1109–1122. [Google Scholar] [CrossRef] [PubMed]
- Leonard, S.S.; Xia, C.; Jiang, B.-H.; Stinefelt, B.; Klandorf, H.; Harris, G.K.; Shi, X. Resveratrol scavenges reactive oxygen species and effects radical-induced cellular responses. Biochem. Biophys. Res. Commun. 2003, 309, 1017–1026. [Google Scholar] [CrossRef] [PubMed]
- Li, J.; Yu, S.; Ying, J.; Shi, T.; Wang, P. Resveratrol Prevents ROS-Induced Apoptosis in High Glucose-Treated Retinal Capillary Endothelial Cells via the Activation of AMPK/Sirt1/PGC-1α Pathway. Oxidative Med. Cell. Longev. 2017, 2017, 1–10. [Google Scholar] [CrossRef] [PubMed]
- Jardim, F.R.; De Rossi, F.T.; Nascimento, M.X.; Barros, R.G.d.S.; Borges, P.A.; Prescilio, I.C.; De Oliveira, M.R. Resveratrol and Brain Mitochondria: A Review. Mol. Neurobiol. 2017, 55, 2085–2101. [Google Scholar] [CrossRef] [PubMed]
- Garza-Lombó, C.; Gonsebatt, M.E. Mammalian Target of Rapamycin: Its Role in Early Neural Development and in Adult and Aged Brain Function. Front. Cell. Neurosci. 2016, 10, 157. [Google Scholar] [CrossRef] [PubMed]
- Xu, L.; Yang, Y.; Gao, L.; Zhao, J.; Cai, Y.; Huang, J.; Jing, S.; Bao, X.; Wang, Y.; Gao, J.; et al. Protective effects of resveratrol on the inhibition of hippocampal neurogenesis induced by ethanol during early postnatal life. Biochim. Biophys. Acta 2015, 1852, 1298–1310. [Google Scholar] [CrossRef]
- Blanquer-Rosselló, M.D.M.; Hernández-López, R.; Roca, P.; Oliver, J.; Valle, A. Resveratrol induces mitochondrial respiration and apoptosis in SW620 colon cancer cells. Biochim. Biophys. Acta 2017, 1861, 431–440. [Google Scholar] [CrossRef]
- Price, N.L.; Gomes, A.P.; Ling, A.J.; Duarte, F.V.; Martin-Montalvo, A.; North, B.J.; Agarwal, B.; Ye, L.; Ramadori, G.; Teodoro, J.S.; et al. SIRT1 Is Required for AMPK Activation and the Beneficial Effects of Resveratrol on Mitochondrial Function. Cell Metab. 2012, 15, 675–690. [Google Scholar] [CrossRef]
- Madrigal-Perez, L.A.; Nava, G.M.; González-Hernández, J.C.; Ramos-Gomez, M. Resveratrol increases glycolytic flux in Saccharomyces cerevisiae via a SNF1-dependet mechanism. J. Bioenerg. Biomembr. 2015, 47, 331–336. [Google Scholar] [CrossRef]
- Gomez, L.S.; Zancan, P.; Marcondes, M.C.; Ramos-Santos, L.; Meyer-Fernandes, J.R.; Sola-Penna, M.; Da Silva, D. Resveratrol decreases breast cancer cell viability and glucose metabolism by inhibiting 6-phosphofructo-1-kinase. Biochimie 2013, 95, 1336–1343. [Google Scholar] [CrossRef] [PubMed]
- Udenigwe, C.C.; Ramprasath, V.R.; Aluko, R.; Jones, P.J.H. Potential of resveratrol in anticancer and anti-inflammatory therapy. Nutr. Rev. 2008, 66, 445–454. [Google Scholar] [CrossRef]
- Saunier, E.; Antonio, S.; Regazzetti, A.; Auzeil, N.; Laprévote, O.; Shay, J.W.; Coumoul, X.; Barouki, R.; Benelli, C.; Huc-Lemarié, L.; et al. Resveratrol reverses the Warburg effect by targeting the pyruvate dehydrogenase complex in colon cancer cells. Sci. Rep. 2017, 7, 1–16. [Google Scholar] [CrossRef]
- Widlund, A.L.; Baral, K.; Dalgaard, L.T.; Vang, O. Functional Mitochondria Are Important for the Effect of Resveratrol. Molecules 2017, 22, 847. [Google Scholar] [CrossRef]
- Sheu, S.-J.; Liu, N.-C.; Ou, C.-C.; Bee, Y.-S.; Chen, S.-C.; Lin, H.-C.; Chan, J.Y.H. Resveratrol Stimulates Mitochondrial Bioenergetics to Protect Retinal Pigment Epithelial Cells From Oxidative Damage. Investig. Opthalmology Vis. Sci. 2013, 54, 6426–6438. [Google Scholar] [CrossRef]
- Berk, M.; Malhi, G.S.; Gray, L.J.; Dean, O.M. The promise of N-acetylcysteine in neuropsychiatry. Trends Pharmacol. Sci. 2013, 34, 167–177. [Google Scholar] [CrossRef] [PubMed]
- Fries, G.R.; Kapczinski, F. N-acetylcysteine as a mitochondrial enhancer: A new class of psychoactive drugs? Rev. Bras. Psiquiatr. 2011, 33, 321–322. [Google Scholar] [CrossRef]
- Douiev, L.; Soiferman, D.; Alban, C.; Saada, A. The Effects of Ascorbate, N-Acetylcysteine, and Resveratrol on Fibroblasts from Patients with Mitochondrial Disorders. J. Clin. Med. 2016, 6, 1. [Google Scholar] [CrossRef]
- Underwood, B.R.; Imarisio, S.; Fleming, A.; Rose, C.; Krishna, G.; Heard, P.; Quick, M.; Korolchuk, V.I.; Renna, M.; Sarkar, S.; et al. Antioxidants can inhibit basal autophagy and enhance neurodegeneration in models of polyglutamine disease. Hum. Mol. Genet. 2010, 19, 3413–3429. [Google Scholar] [CrossRef] [PubMed]
- Qanungo, S.; Wang, M.; Nieminen, A.-L. N-Acetyl-l-cysteine Enhances Apoptosis through Inhibition of Nuclear Factor-κB in Hypoxic Murine Embryonic Fibroblasts. J. Biol. Chem. 2004, 279, 50455–50464. [Google Scholar] [CrossRef] [PubMed]
- Liu, Y.; Liu, K.; Wang, N.; Zhang, H. N-acetylcysteine induces apoptosis via the mitochondria-dependent pathway but not via endoplasmic reticulum stress in H9c2 cells. Mol. Med. Rep. 2017, 16, 6626–6633. [Google Scholar] [CrossRef] [PubMed]
- Molina-Jimenez, M.; Sanchez-Reus, M.; Benedi, J. Effect of fraxetin and myricetin on rotenone-induced cytotoxicity in SH-SY5Y cells: Comparison with N-acetylcysteine. Eur. J. Pharmacol. 2003, 472, 81–87. [Google Scholar] [CrossRef]
- Okamoto, A.; Tanaka, M.; Sumi, C.; Oku, K.; Kusunoki, M.; Nishi, K.; Matsuo, Y.; Takenaga, K.; Shingu, K.; Hirota, K. The antioxidant N-acetyl cysteine suppresses lidocaine-induced intracellular reactive oxygen species production and cell death in neuronal SH-SY5Y cells. BMC Anesthesiol. 2016, 16, 104. [Google Scholar] [CrossRef] [PubMed]
- Zhang, Z.; Dawson, P.A.; Piper, M.; Simmons, D.G. Postnatal N-acetylcysteine administration rescues impaired social behaviors and neurogenesis in Slc13a4 haploinsufficient mice. EBioMedicine 2019, 43, 435–446. [Google Scholar] [CrossRef] [PubMed]
- Al-Kafaji, G.; Golbahar, J. High Glucose-Induced Oxidative Stress Increases the Copy Number of Mitochondrial DNA in Human Mesangial Cells. BioMed Res. Int. 2013, 2013, 1–8. [Google Scholar] [CrossRef] [PubMed]
- Zhuang, Y.; Wang, C.; Wu, C.; Ding, D.; Zhao, F.; Hu, C.; Gong, W.; Ding, G.; Zhang, Y.; Chen, L.; et al. Mitochondrial oxidative stress activates COX-2/mPGES-1/PGE2 cascade induced by albumin in renal proximal tubular cells. Oncotarget 2018, 9, 9235–9245. [Google Scholar] [CrossRef] [PubMed]
- Kim, J.S.; Chang, M.-Y.; Yu, I.T.; Kim, J.H.; Lee, S.-H.; Lee, Y.-S.; Son, H. Lithium selectively increases neuronal differentiation of hippocampal neural progenitor cells both in vitro and in vivo. J. Neurochem. 2004, 89, 324–336. [Google Scholar] [CrossRef] [PubMed]
- Chen, G.; Rajkowska, G.; Du, F.; Seraji-Bozorgzad, N.; Manji, H.K. Enhancement of Hippocampal Neurogenesis by Lithium. J. Neurochem. 2002, 75, 1729–1734. [Google Scholar] [CrossRef]
- Li, H.; Li, Q.; Du, X.; Sun, Y.; Wang, X.; Kroemer, G.; Blomgren, K.; Zhu, C. Lithium-Mediated Long-Term Neuroprotection in Neonatal Rat Hypoxia–Ischemia is Associated with Antiinflammatory Effects and Enhanced Proliferation and Survival of Neural Stem/Progenitor Cells. Br. J. Pharmacol. 2011, 31, 2106–2115. [Google Scholar] [CrossRef]
- Klionsky, D.J.; Abdelmohsen, K.; Abe, A.; Abedin, M.J.; Abeliovich, H.; Arozena, A.A.; Adachi, H.; Adams, C.M.; Adams, P.D.; Adeli, K.; et al. Guidelines for the use and interpretation of assays for monitoring autophagy (3rd edition). Autophagy 2016, 12, 1–222. [Google Scholar] [CrossRef]


| Drug Parameters | vs. Control | ||||||||||||
|---|---|---|---|---|---|---|---|---|---|---|---|---|---|
| Lithium 24 hrs | Trehalose 24 hrs | Rapamycin 24 hrs | Resveratrol 24 hrs | NAC 24 hrs | Mn-Tbap 24 hrs | Lithium 48 hrs | Trehalose 48 hrs | Rapamycin 48 hrs | Resveratrol 48 hrs | NAC 48 hrs | Mn-Tbap 48 hrs | ||
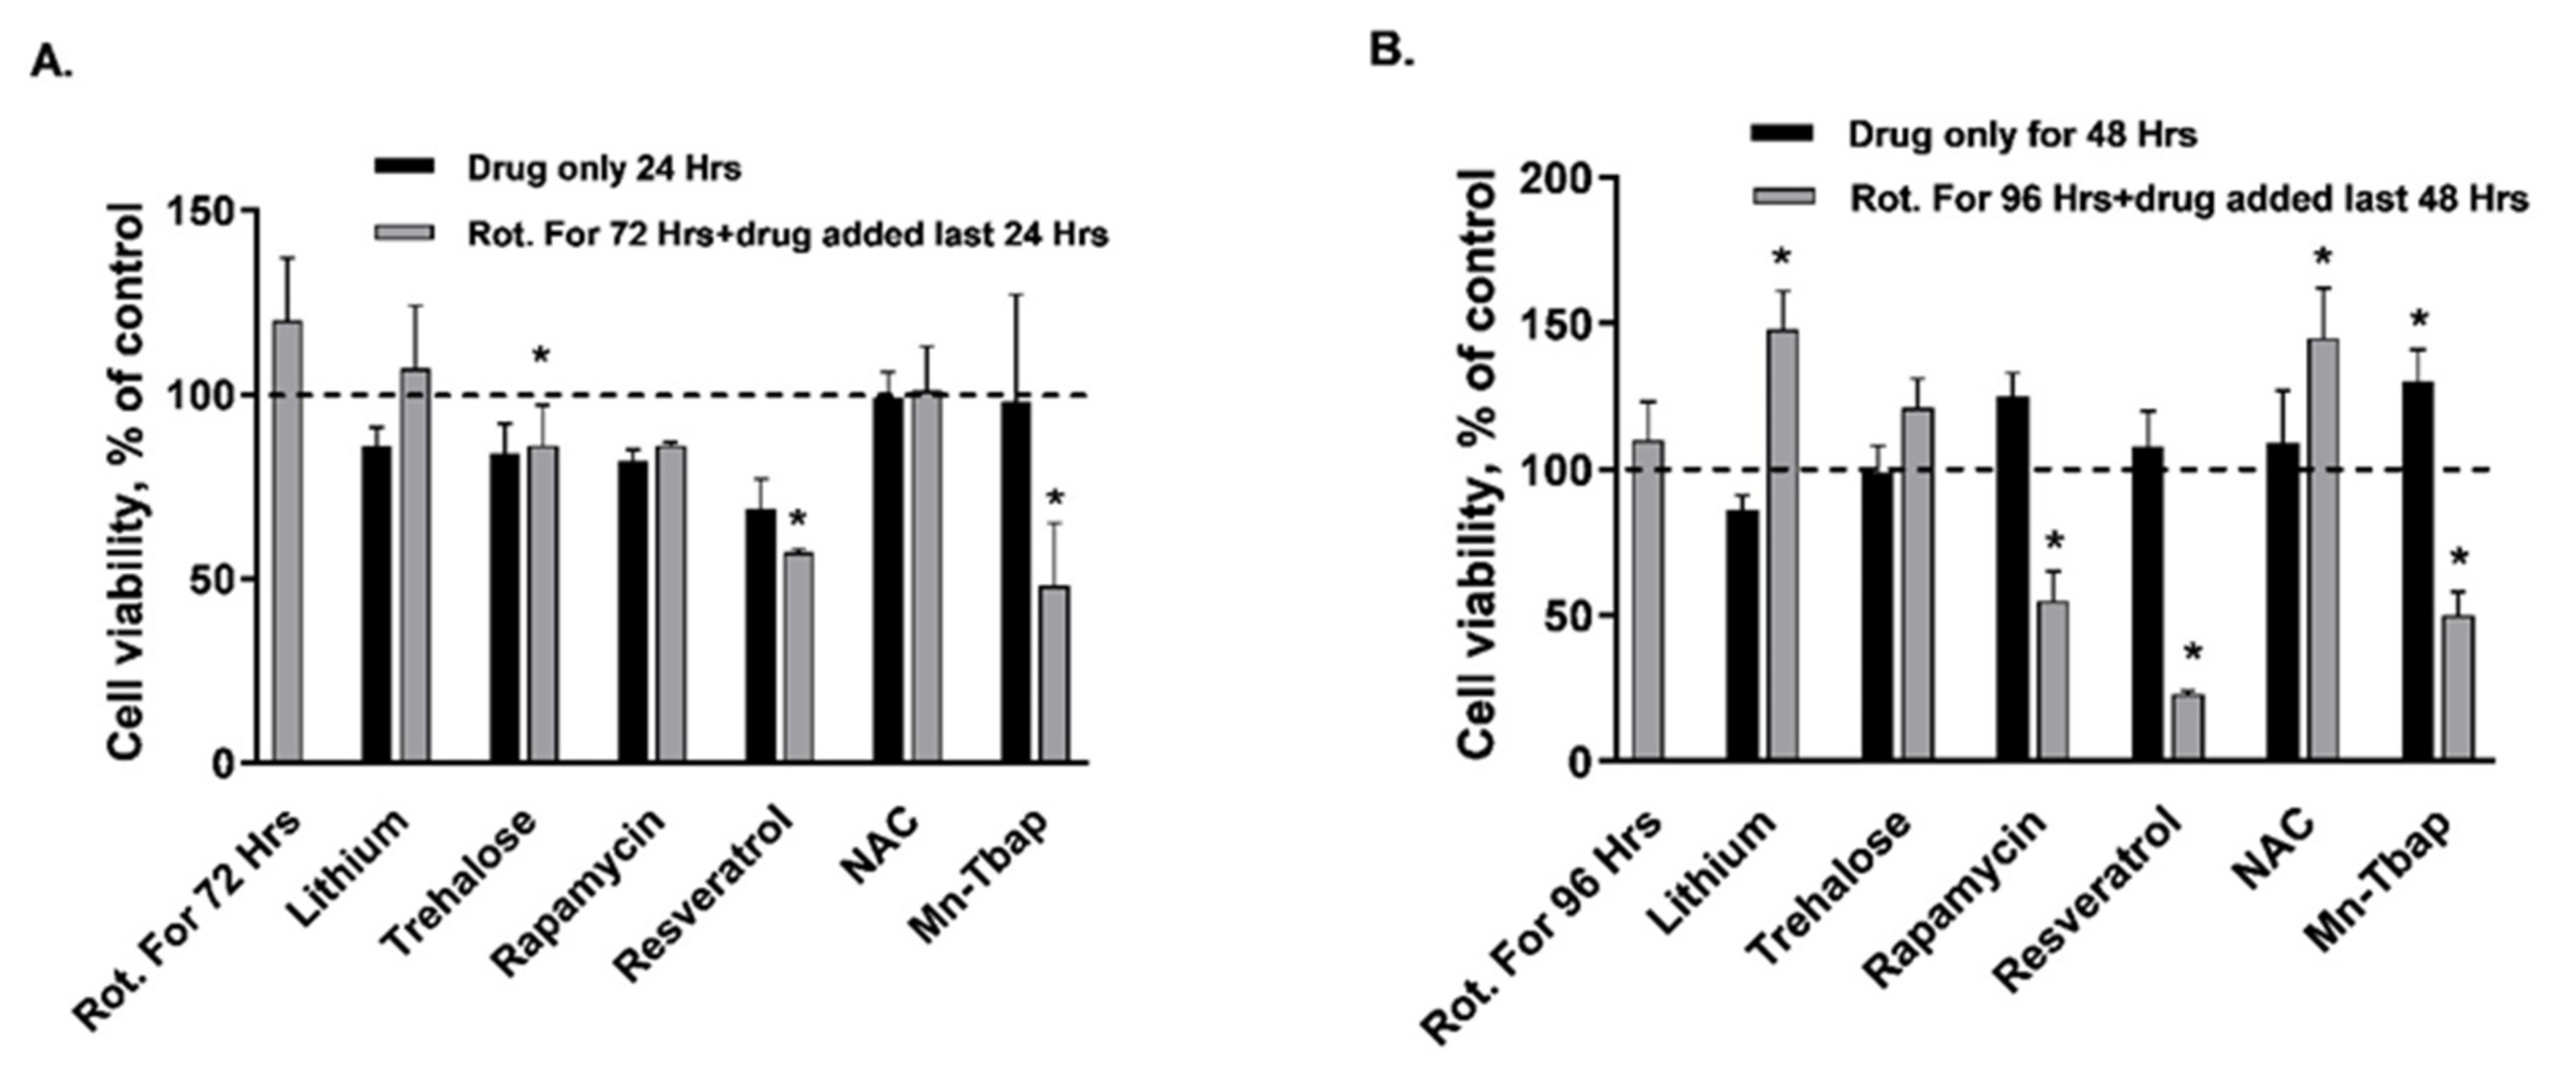
| Cell viability | MTT assay | ↔ | ↔ | ↔ | ↓ | ↔ | ↔ | ↔ | ↔ | ↔ | ↔ | ↔ | ↑ |
| ApoLive-Glo multiplex assay | ↔ | ↔ | ↔ | ↔ | ↔ | ↔ | ↔ | ↔ | ↔ | ↑ | ↑ | ↔ | |
| Mito. characteristics | Mito. mass | ↔ | ↔ | ↔ | ↔ | ↔ | ↓ | ↔ | ↔ | ↔ | ↑ | ↔ | ↔ |
| MMP (ΔψM) | ↔ | ↔ | ↔ | ↔ | ↔ | ↔ | ↔ | ↔ | ↔ | ↔ | ↔ | ↔ | |
| ROS | ↔ | ↔ | ↔ | ↔ | ↔ | ↔ | ↔ | ↔ | ↔ | ↔ | ↔ | ↔ | |
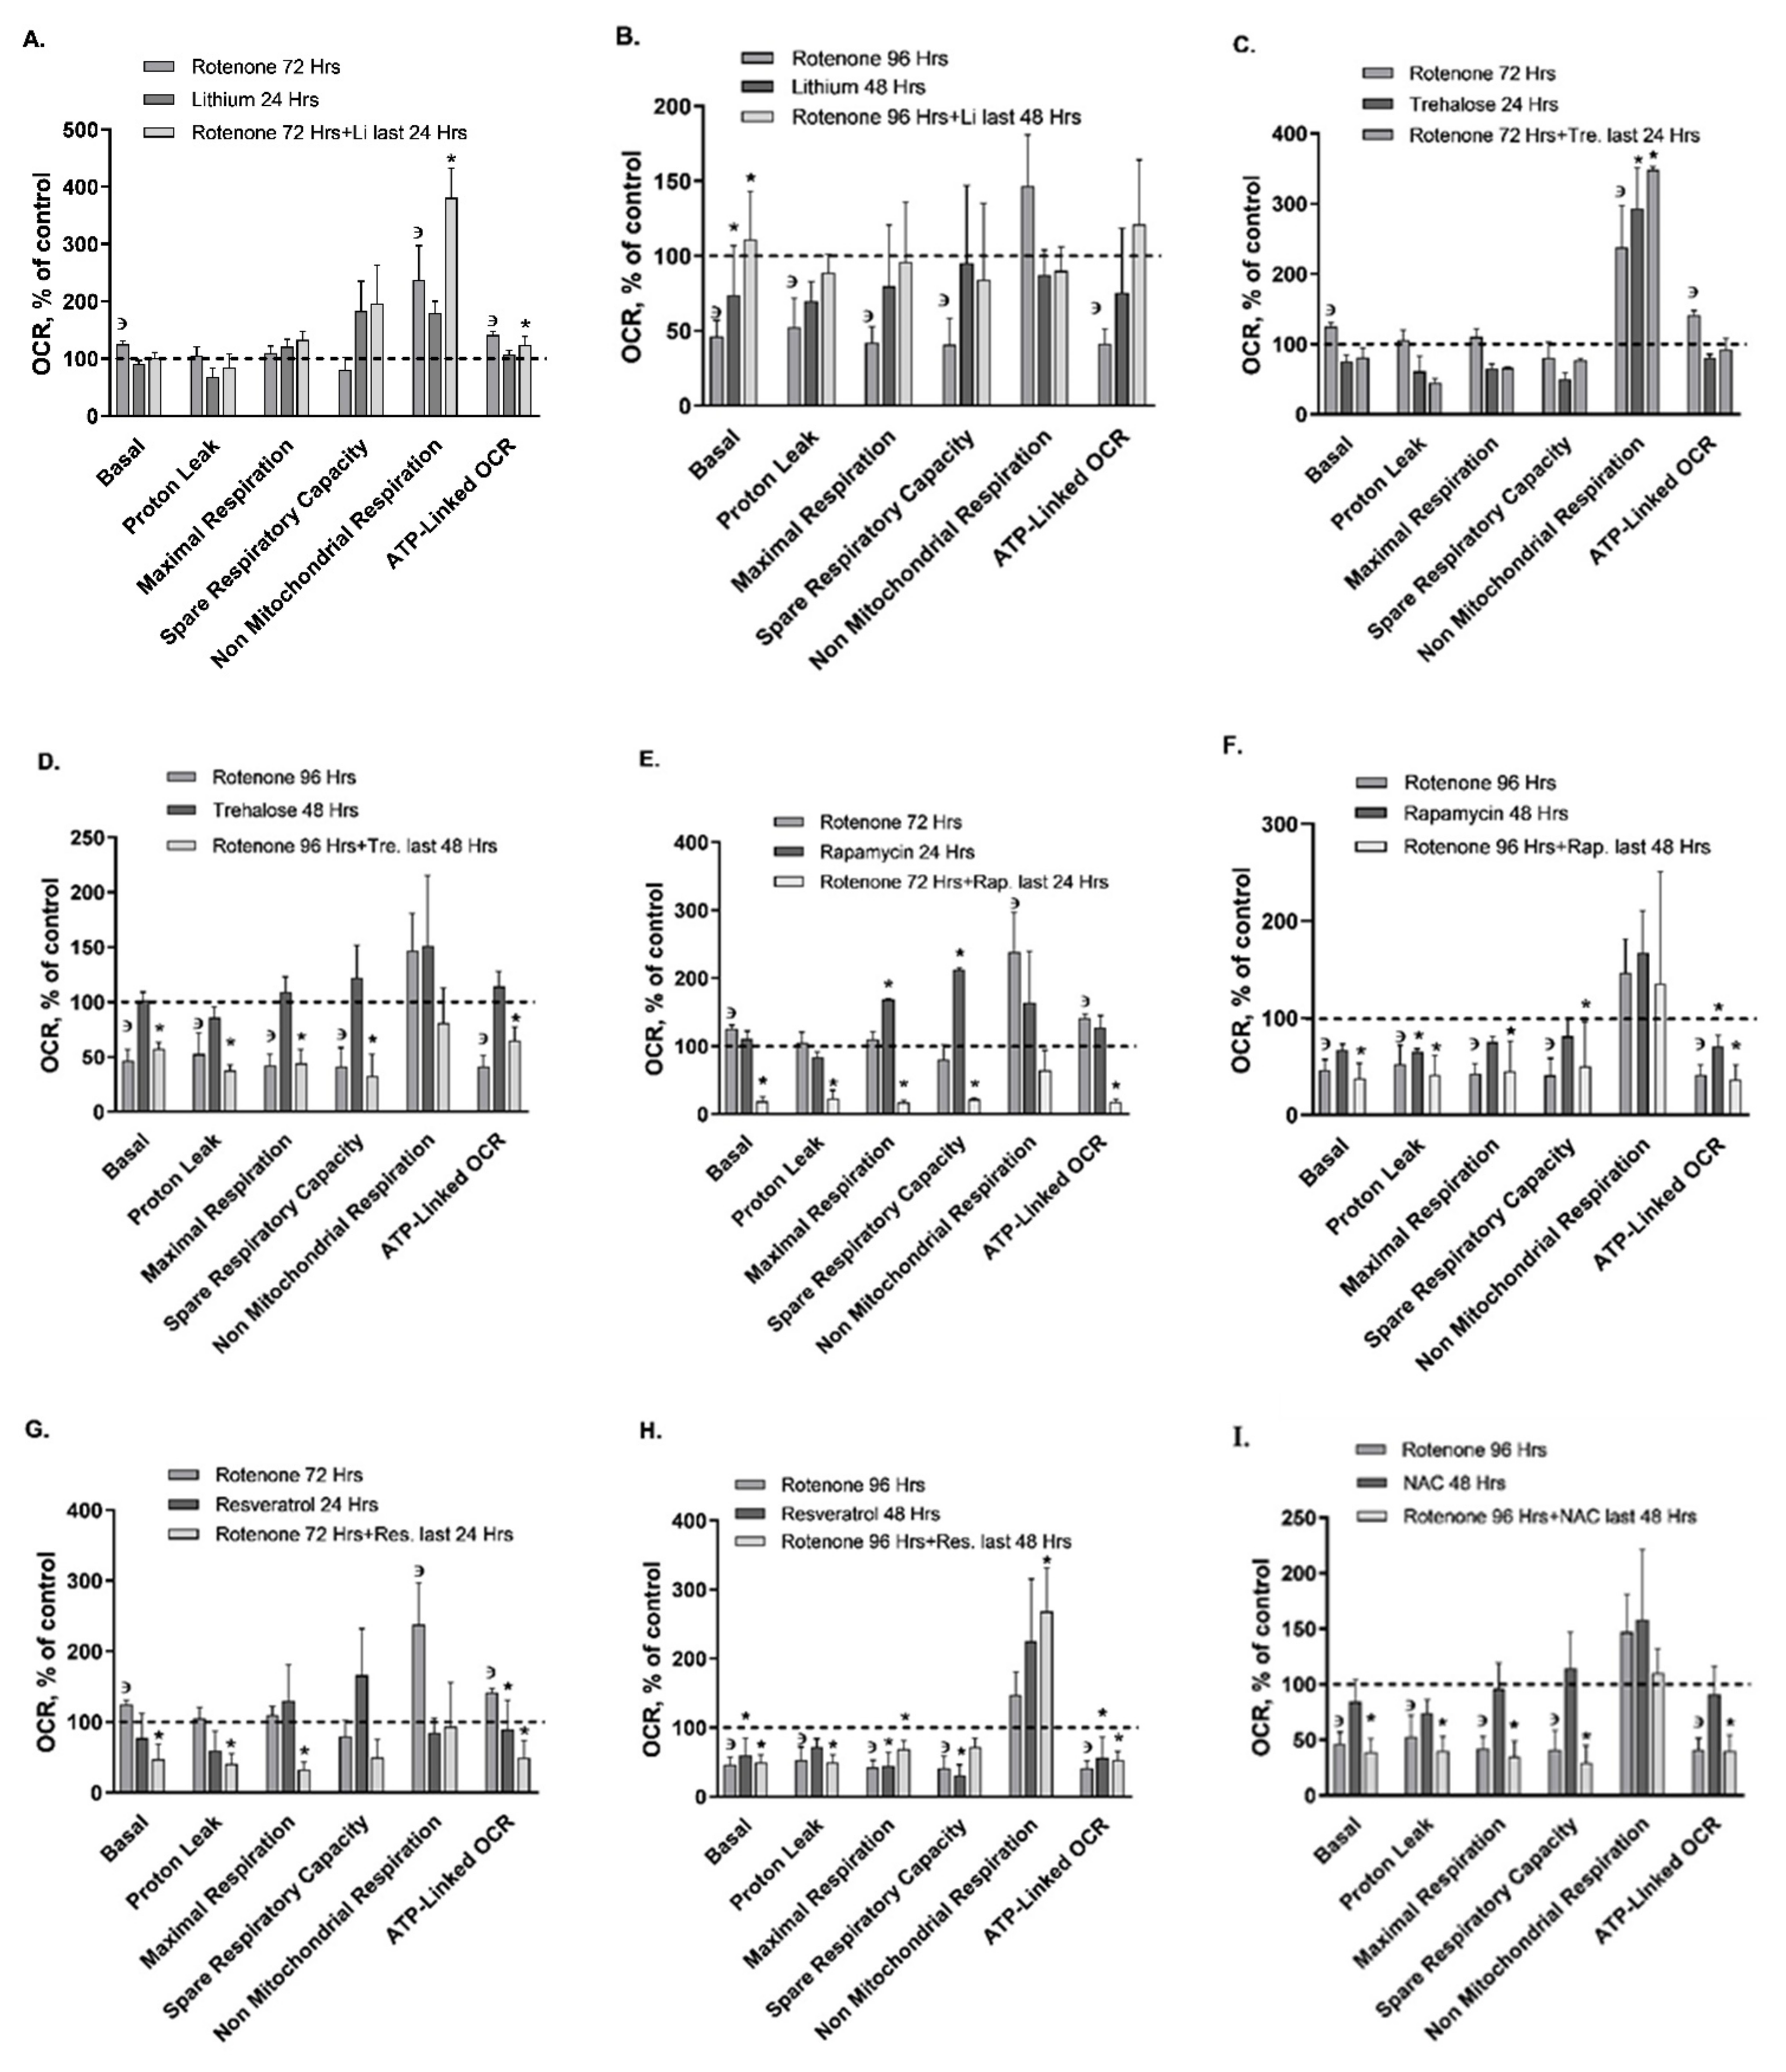
| Mito. respiration | Basal OCR | ↔ | ↔ | ↔ | ↔ | ↔ | ↓ | ↓ | ↔ | ↔ | ↓ | ↔ | ↓ |
| Proton leak | ↔ | ↔ | ↔ | ↔ | ↔ | ↓ | ↔ | ↔ | ↓ | ↔ | ↔ | ↓ | |
| Maximal respiration | ↔ | ↔ | ↑ | ↔ | ↔ | ↔ | ↔ | ↔ | ↔ | ↓ | ↔ | ↓ | |
| Spare respiratory capacity | ↔ | ↔ | ↑ | ↔ | ↔ | ↔ | ↔ | ↔ | ↔ | ↓ | ↔ | ↓ | |
| ATP-linked OCR | ↔ | ↔ | ↔ | ↔ | ↔ | ↔ | ↔ | ↔ | ↓ | ↓ | ↔ | ↓ | |
| Non mito. respiration | ↔ | ↑ | ↔ | ↔ | ↔ | ↔ | ↔ | ↔ | ↔ | ↔ | ↔ | ↑ | |
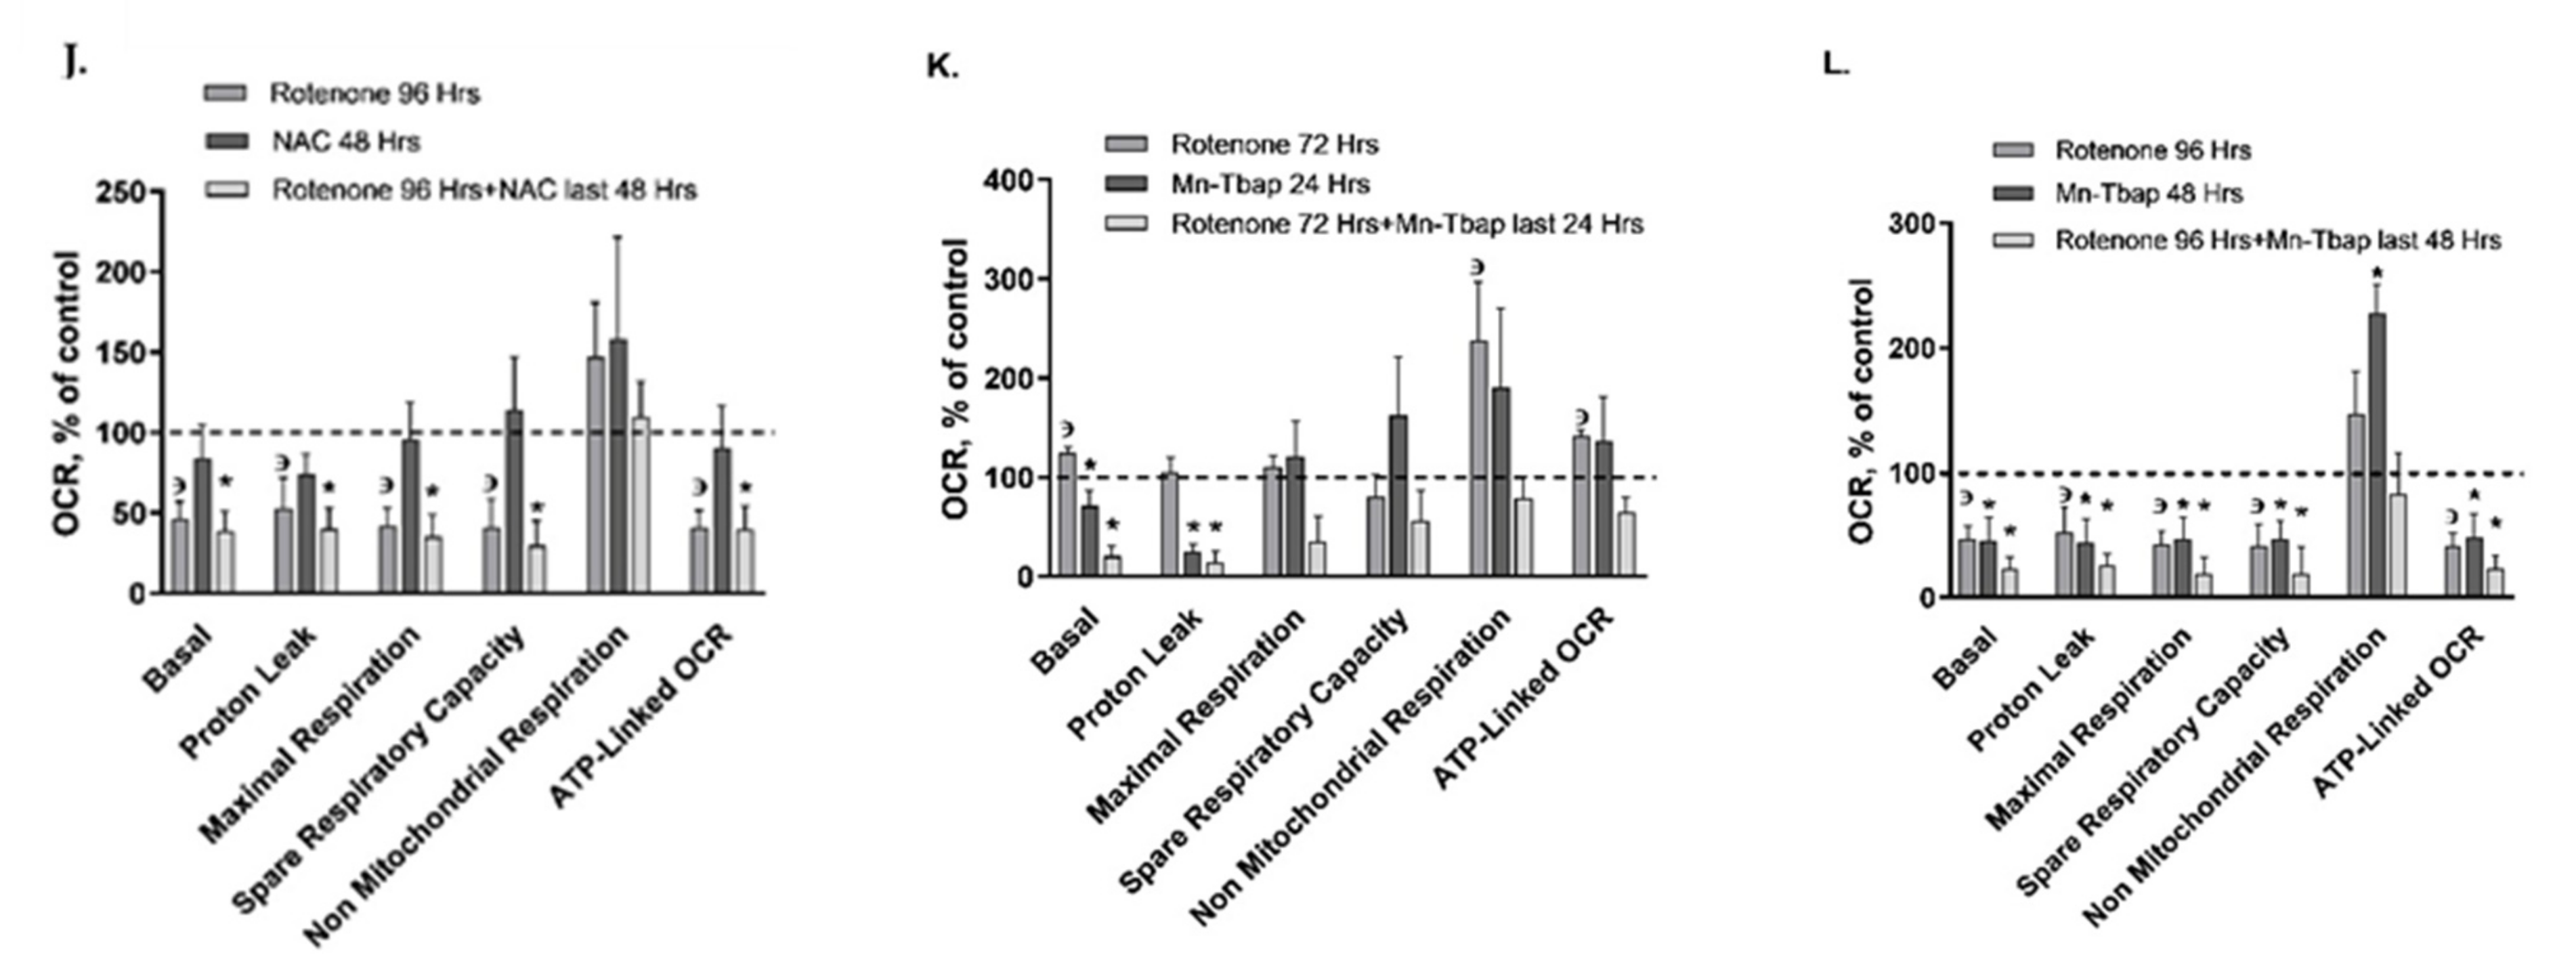
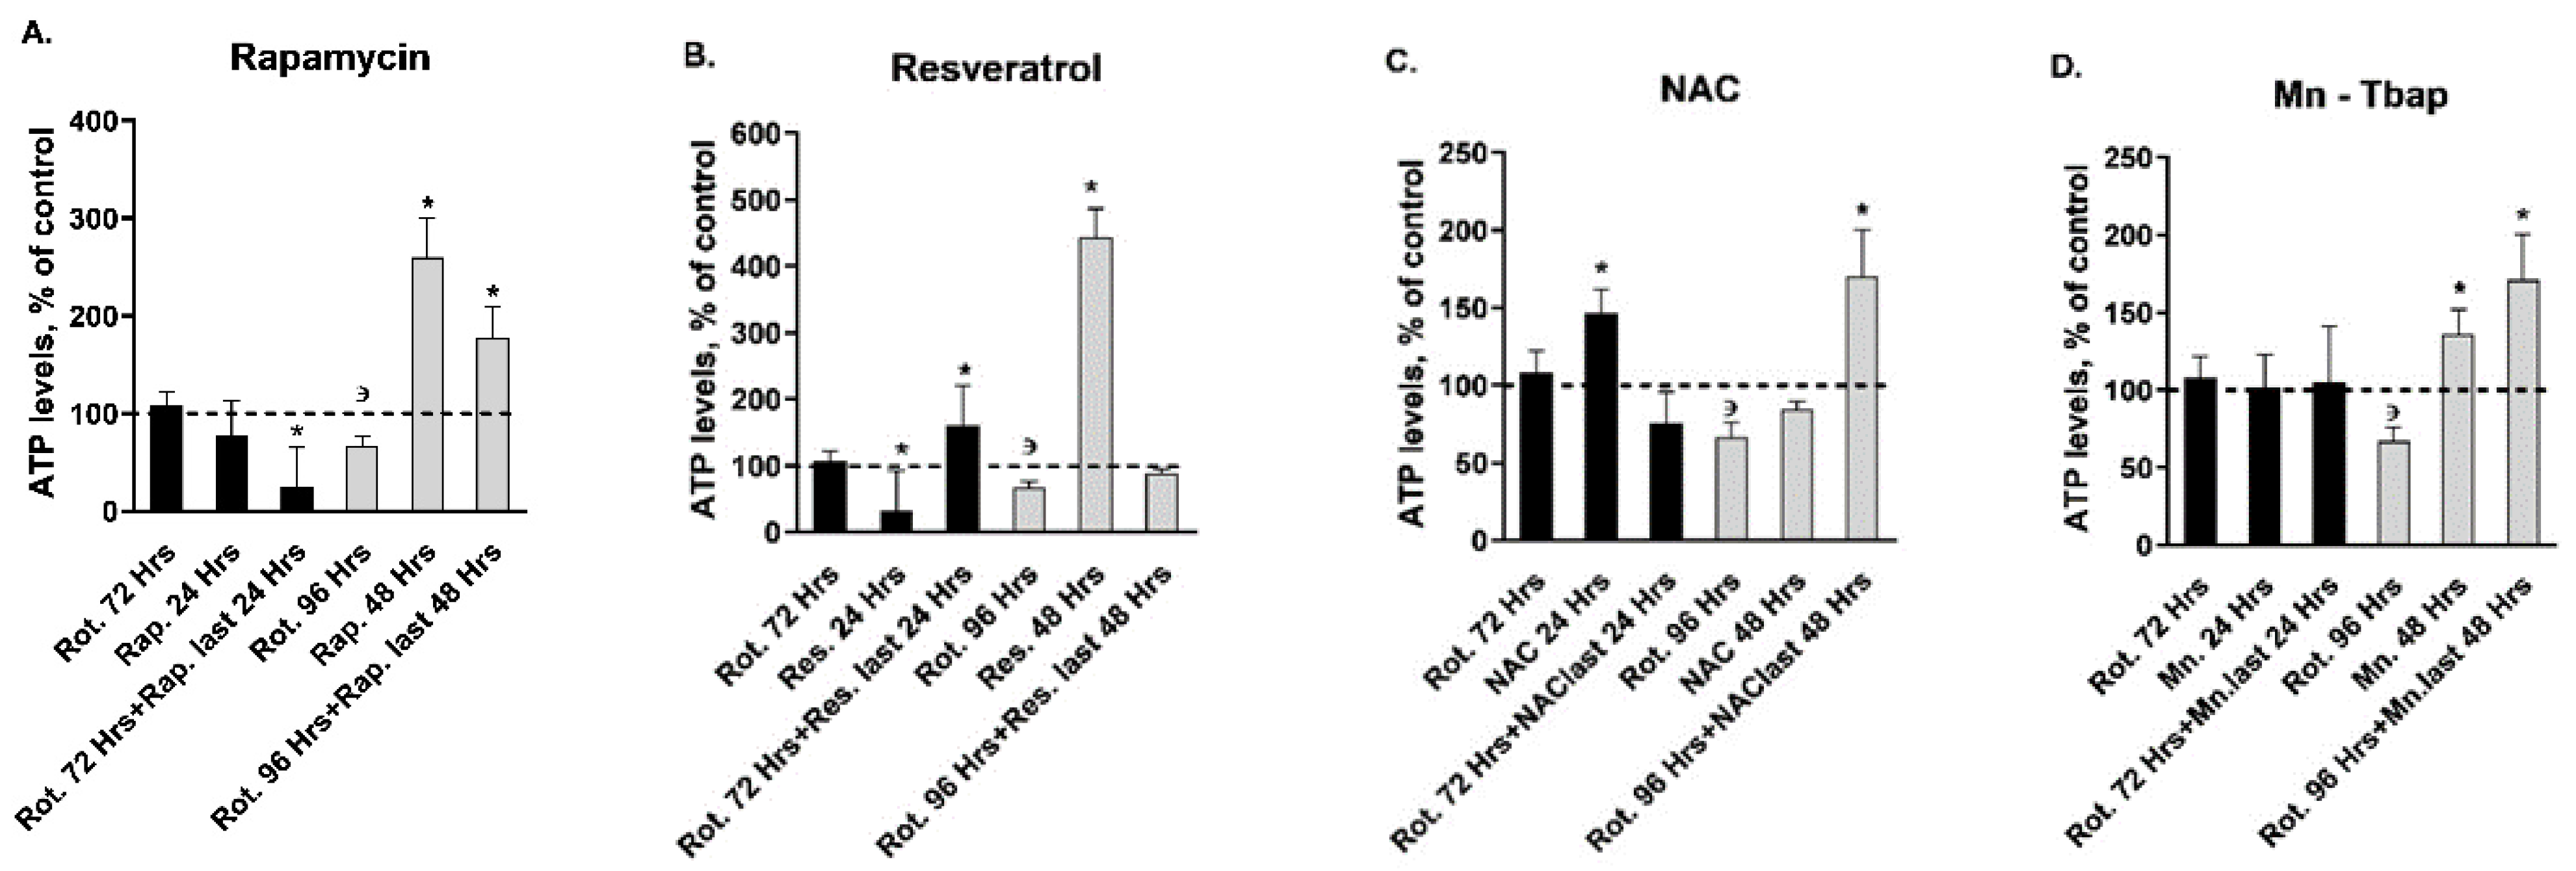
| ATP | Levels | ↔ | ↑ | ↔ | ↓ | ↑ | ↔ | ↔ | ↑ | ↑ | ↑ | ↔ | ↑ |
| Autophagy markers | LC3-II | ↑ | ↑ | ↔ | ↔ | ↔ | ↔ | ↔ | ↔ | ↔ | ↔ | ↔ | ↔ |
| p62 | ↔ | ↔ | ↔ | ↔ | ↔ | ↔ | ↔ | ↔ | ↔ | ↔ | ↔ | ↔ | |
| Complex I | Activity | ↔ | ↔ | ↔ | ↔ | ↔ | ↔ | ↔ | ↔ | ↔ | ↔ | ↔ | ↔ |
| Protein levels | ↔ | ↔ | ↔ | ↔ | ↔ | ↔ | ↔ | ↔ | ↔ | ↔ | ↔ | ↔ | |
| Mito. Complexes II-V | CoII protein levels | ↔ | ↔ | ↔ | ↔ | ↔ | ↔ | ↔ | ↔ | ↔ | ↔ | ↔ | ↔ |
| CoIII protein levels | ↔ | ↔ | ↔ | ↔ | ↔ | ↔ | ↔ | ↔ | ↔ | ↑ | ↔ | ↔ | |
| CoIV protein levels | ↔ | ↑ | ↔ | ↔ | ↔ | ↑ | ↔ | ↔ | ↔ | ↔ | ↔ | ↔ | |
| CoV protein levels | ↔ | ↔ | ↔ | ↔ | ↔ | ↔ | ↔ | ↔ | ↔ | ↔ | ↔ | ↔ | |
| Drug Parameters | vs. Control | ||||||||||||||
|---|---|---|---|---|---|---|---|---|---|---|---|---|---|---|---|
| Rot. for 72 hrs | Rot.+Li. Last 24 hrs | Rot.+Tre. Last 24 hrs | Rot.+Rap. Last 24 hrs | Rot.+Res. Last 24 hrs | Rot.+NAC Last 24 hrs | Rot.+Mn. Last 24 hrs | Rot. for 96 hrs | Rot.+Li. Last 48 hrs | Rot.+Tre. Last 48 hrs | Rot.+Rap. Last 48 hrs | Rot.+Res. Last 48 hrs | Rot.+NAC Last 48 hrs | Rot.+Mn. Last 48 hrs | ||
| Cell viability | MTT assay | ↔ | ↔ | ↓ | ↔ | ↓ | ↔ | ↓ | ↔ | ↑ | ↔ | ↓ | ↓ | ↑ | ↓ |
| ApoLive-Glo multiplex assay | ↔ | ↔ | ↔ | ↔ | ↔ | ↔ | ↔ | ↔ | ↔ | ↔ | ↔ | ↔ | ↔ | ↔ | |
| Mito. Characteristics | Mito. mass | ↔ | ↔ | ↔ | ↔ | ↔ | ↔ | ↓ | ↔ | ↔ | ↔ | ↔ | ↑ | ↔ | ↔ |
| MMP (ΔψM) | ↔ | ↔ | ↔ | ↑ | ↔ | ↔ | ↔ | ↔ | ↔ | ↔ | ↔ | ↔ | ↔ | ↔ | |
| ROS | ↔ | ↔ | ↔ | ↔ | ↔ | ↔ | ↔ | ↔ | ↔ | ↔ | ↔ | ↔ | ↔ | ↔ | |
| Mito. respiration | Basal OCR | ↑ | ↔ | ↔ | ↓ | ↓ | ↓ | ↓ | ↓ | ↔ | ↓ | ↓ | ↓ | ↓ | ↓ |
| Proton leak | ↑ * | ↔ | ↔ | ↓ | ↓ | ↓ | ↓ | ↓ | ↔ | ↓ | ↓ | ↓ | ↓ | ↓ | |
| Maximal respiration | ↔ | ↔ | ↔ | ↓ | ↓ | ↔ | ↔ | ↓ | ↔ | ↓ | ↓ | ↓ | ↓ | ↓ | |
| Spare respiratory capacity | ↔ | ↔ | ↔ | ↓ | ↔ | ↔ | ↔ | ↓ | ↔ | ↓ | ↓ | ↓ | ↓ | ↓ | |
| ATP- linked OCR | ↑ | ↑ | ↔ | ↓ | ↓ | ↓ | ↔ | ↓ | ↔ | ↓ | ↓ | ↓ | ↓ | ↓ | |
| Non mito. respiration | ↑ | ↑ | ↑ | ↔ | ↔ | ↔ | ↔ | ↔ | ↔ | ↔ | ↔ | ↔ | ↔ | ↔ | |
| ATP | Levels | ↔ | ↔ | ↔ | ↓ | ↑ | ↔ | ↔ | ↓ | ↔ | ↔ | ↑ | ↔ | ↑ | ↑ |
| autophagy markers | LC3-II | ↑ | ↑ | ↔ | ↔ | ↔ | ↔ | ↑ | ↓ | ↔ | ↔ | ↔ | ↔ | ↔ | ↔ |
| p62 | ↔ | ↔ | ↔ | ↔ | ↔ | ↔ | ↔ | ↔ | ↔ | ↔ | ↔ | ↔ | ↔ | ↔ | |
| Complex I | Activity | ↑ | ↔ | ↔ | ↔ | ↔ | ↔ | ↔ | ↓ | ↔ | ↔ | ↔ | ↔ | ↔ | ↔ |
| Protein levels | ↑ | ↔ | ↔ | ↓ | ↔ | ↔ | ↑ | ↔ | ↔ | ↔ | ↔ | ↔ | ↔ | ↔ | |
| Mito. Complexes II-V | CoII protein levels | ↔ | ↔ | ↔ | ↔ | ↔ | ↔ | ↔ | ↔ | ↔ | ↔ | ↔ | ↔ | ↔ | ↔ |
| CoIII protein levels | ↔ | ↔ | ↔ | ↔ | ↑ | ↔ | ↔ | ↔ | ↔ | ↔ | ↔ | ↔ | ↔ | ↔ | |
| CoIV protein levels | ↑ | ↔ | ↔ | ↔ | ↔ | ↔ | ↑ | ↑ | ↔ | ↑ | ↔ | ↔ | ↔ | ↔ | |
| CoV protein levels | ↔ | ↔ | ↔ | ↔ | ↔ | ↔ | ↔ | ↔ | ↔ | ↔ | ↔ | ↔ | ↔ | ↔ | |
Publisher’s Note: MDPI stays neutral with regard to jurisdictional claims in published maps and institutional affiliations. |
© 2021 by the authors. Licensee MDPI, Basel, Switzerland. This article is an open access article distributed under the terms and conditions of the Creative Commons Attribution (CC BY) license (https://creativecommons.org/licenses/by/4.0/).
Share and Cite
Damri, O.; Natur, S.; Agam, G. Do Autophagy Enhancers/ROS Scavengers Alleviate Consequences of Mild Mitochondrial Dysfunction Induced in Neuronal-Derived Cells? Int. J. Mol. Sci. 2021, 22, 5753. https://doi.org/10.3390/ijms22115753
Damri O, Natur S, Agam G. Do Autophagy Enhancers/ROS Scavengers Alleviate Consequences of Mild Mitochondrial Dysfunction Induced in Neuronal-Derived Cells? International Journal of Molecular Sciences. 2021; 22(11):5753. https://doi.org/10.3390/ijms22115753
Chicago/Turabian StyleDamri, Odeya, Sarya Natur, and Galila Agam. 2021. "Do Autophagy Enhancers/ROS Scavengers Alleviate Consequences of Mild Mitochondrial Dysfunction Induced in Neuronal-Derived Cells?" International Journal of Molecular Sciences 22, no. 11: 5753. https://doi.org/10.3390/ijms22115753