
Visual Disfunction due to the Selective Effect of Glutamate Agonists on Retinal Cells

 , , ,
, , , 
Abstract
:1. Introduction
2. Results
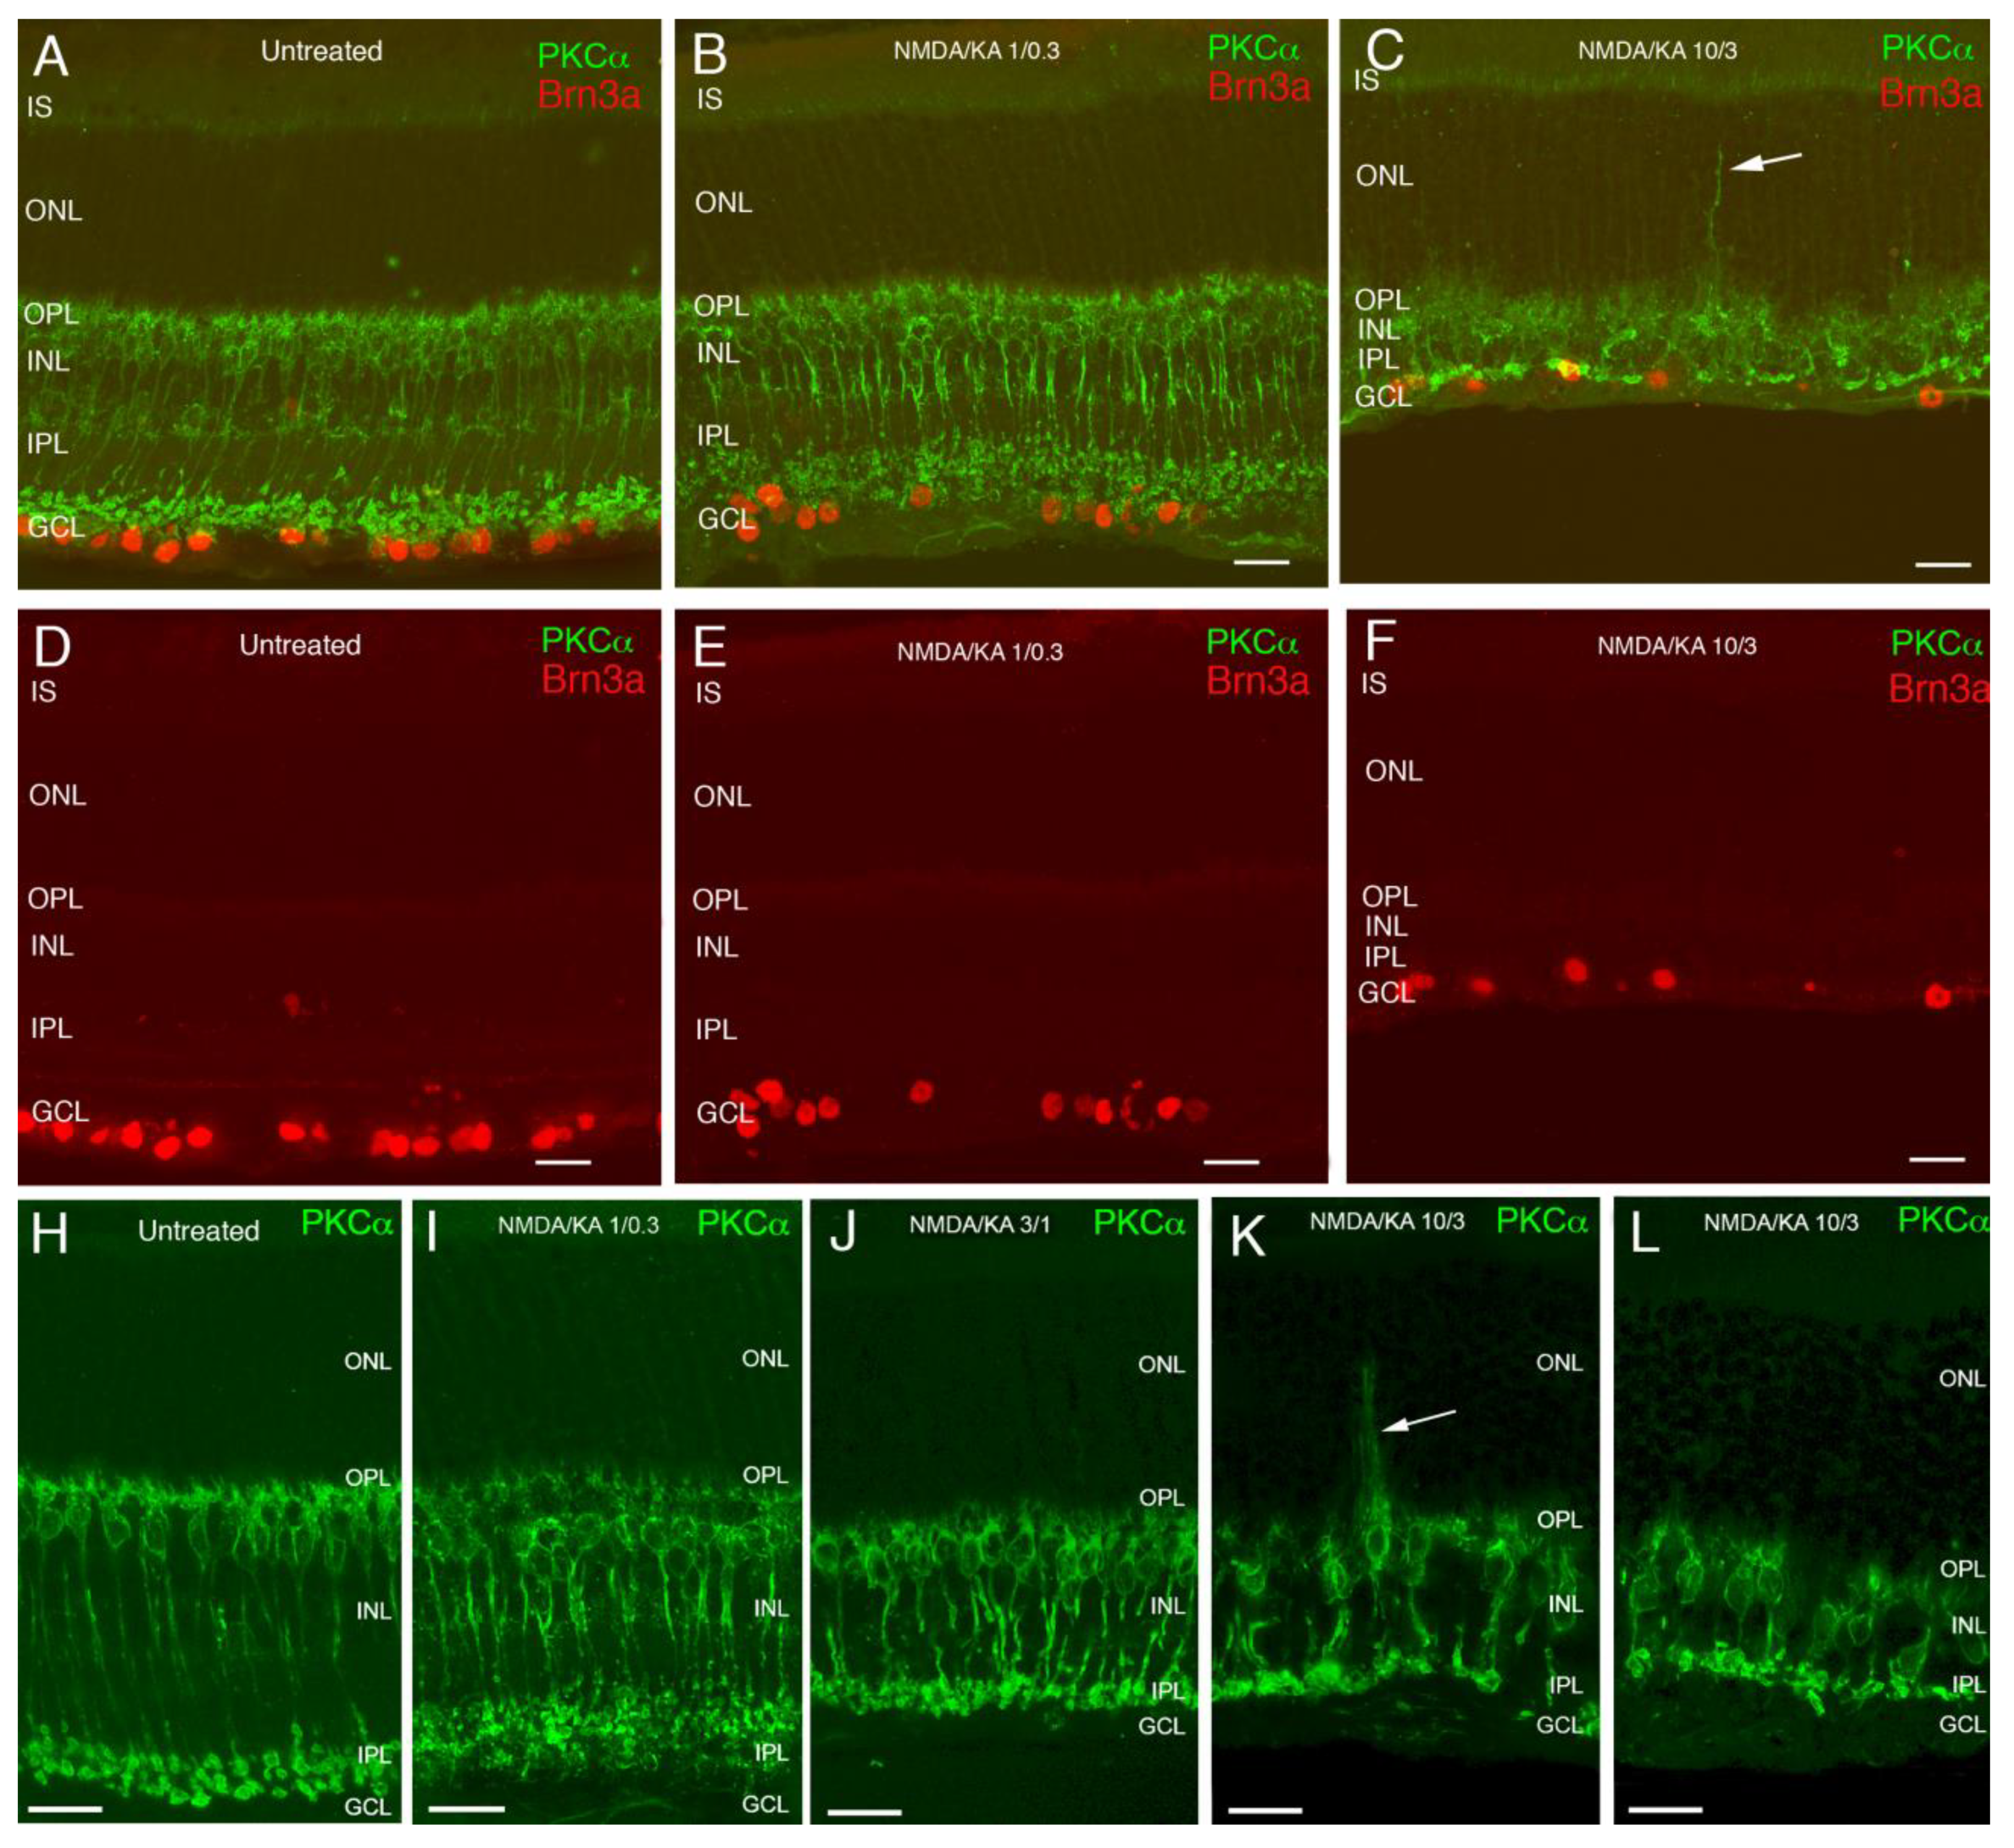
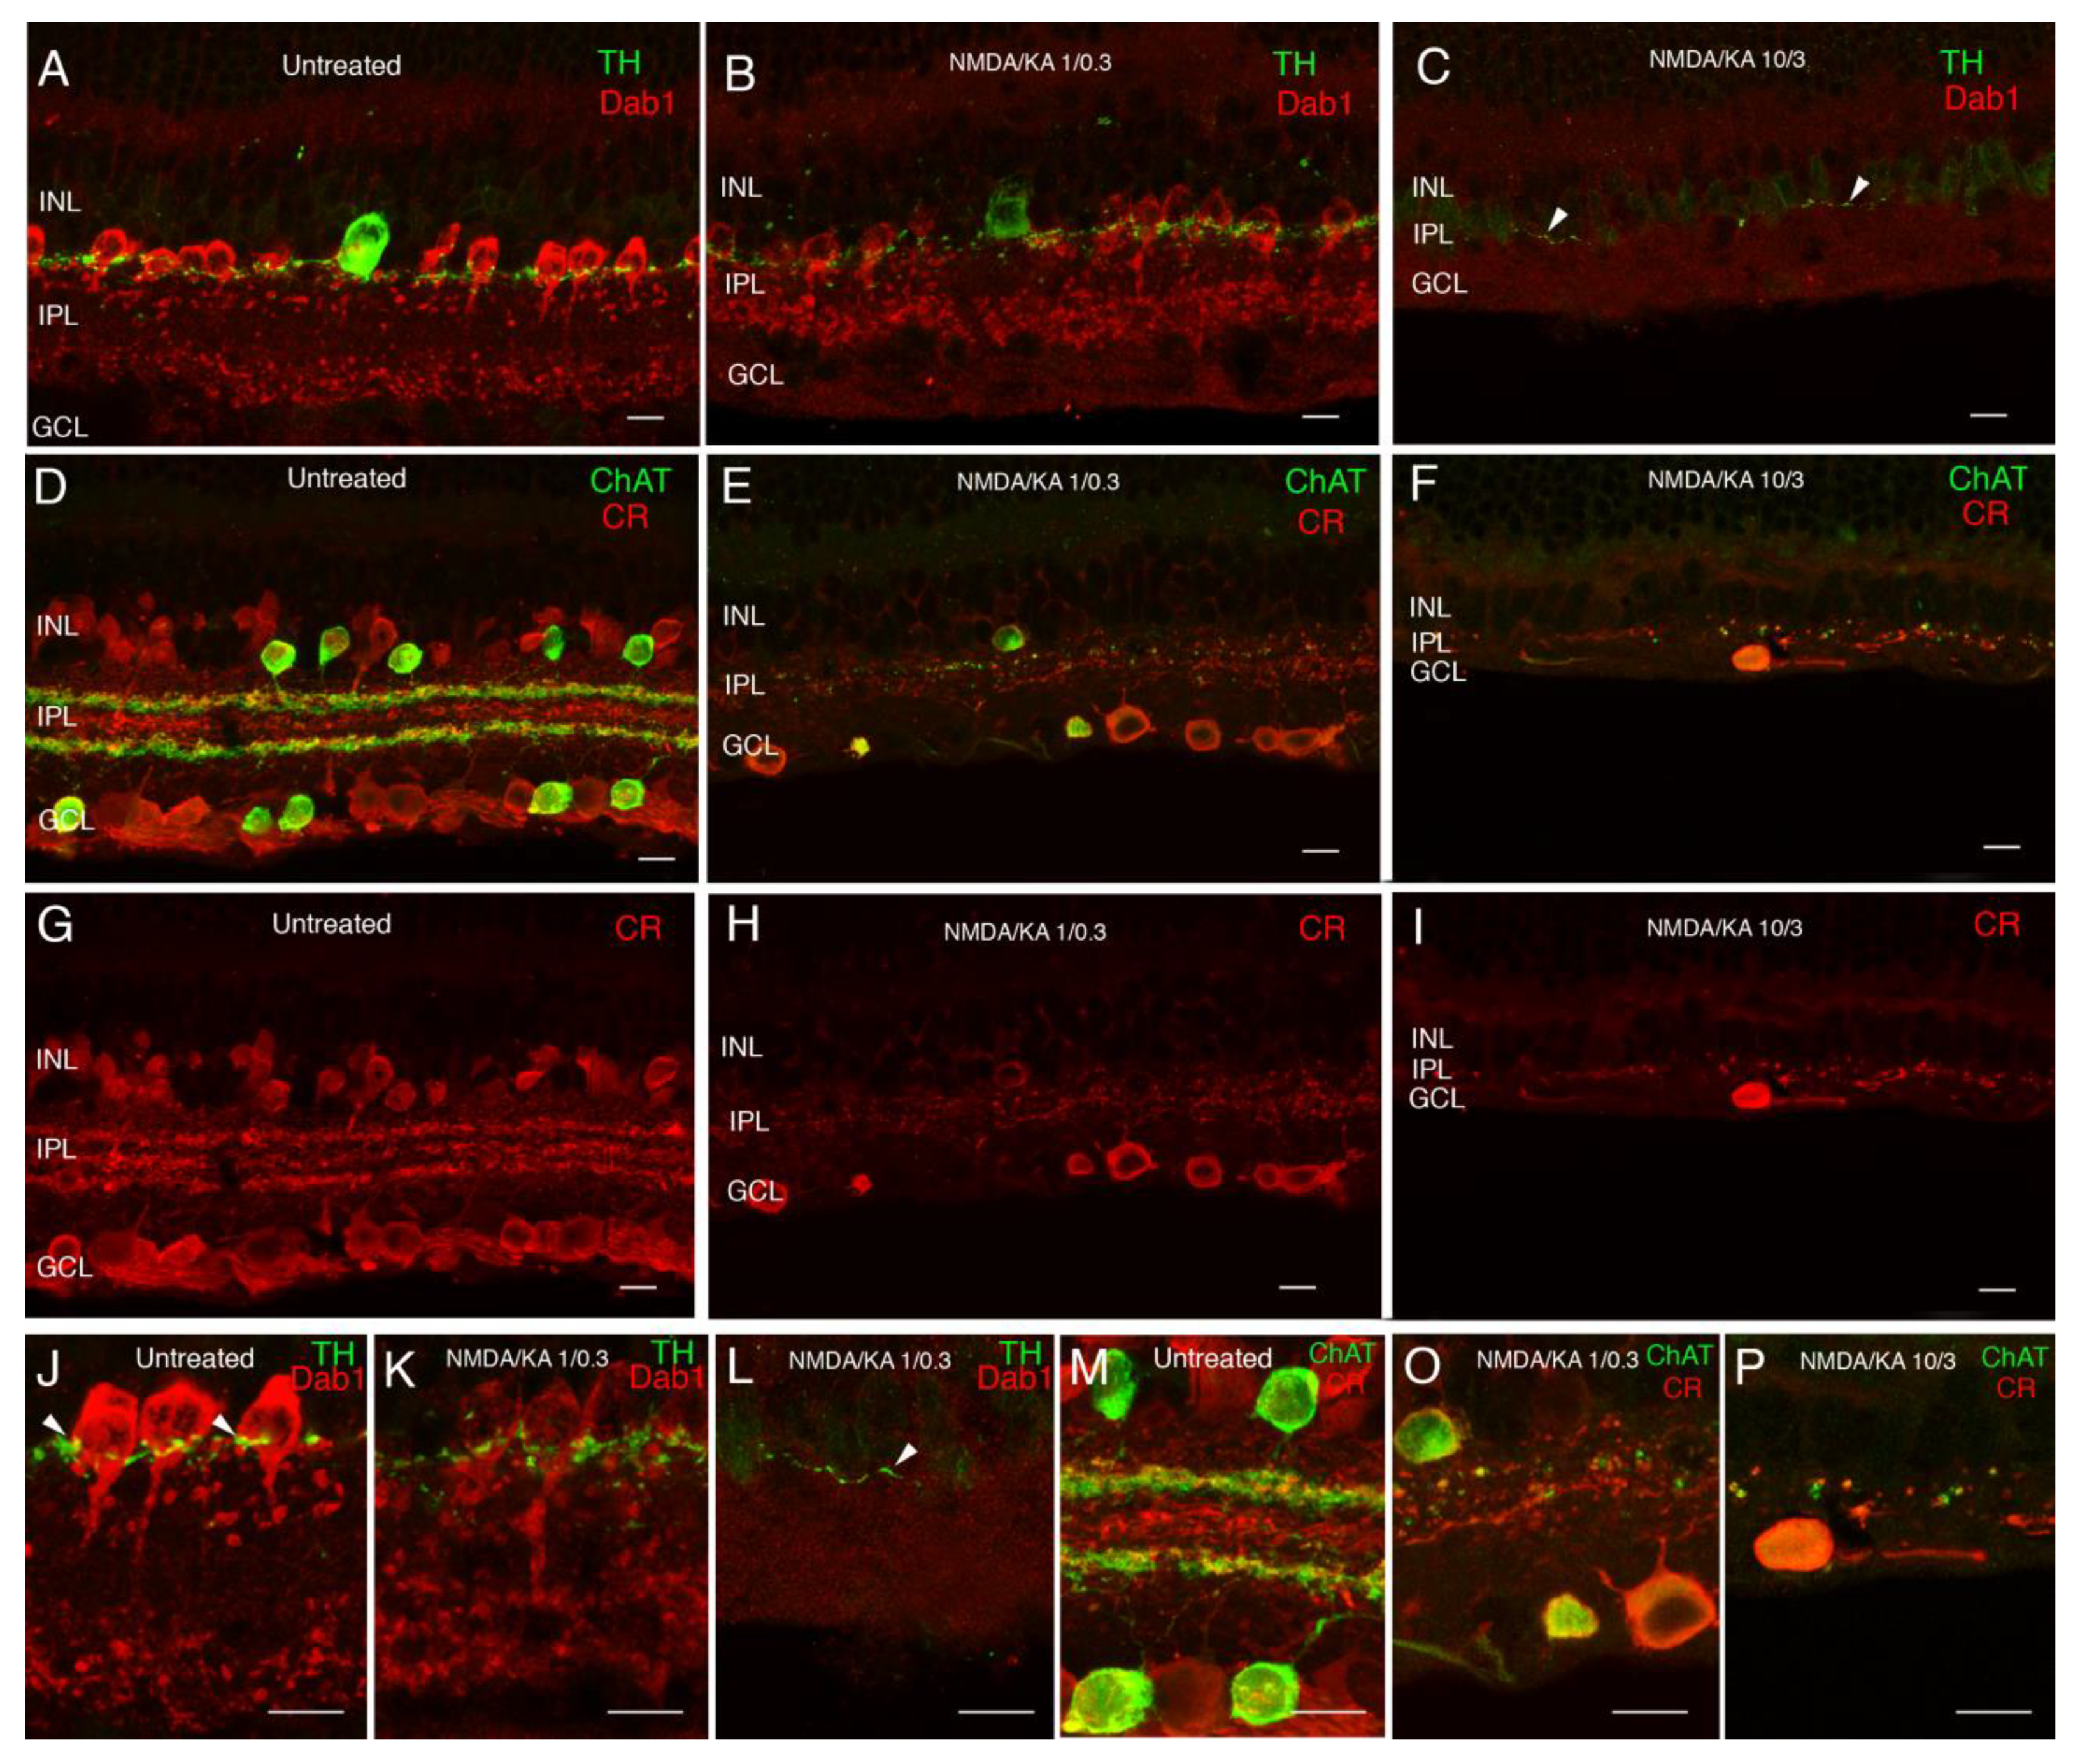
2.1. Immunostaining
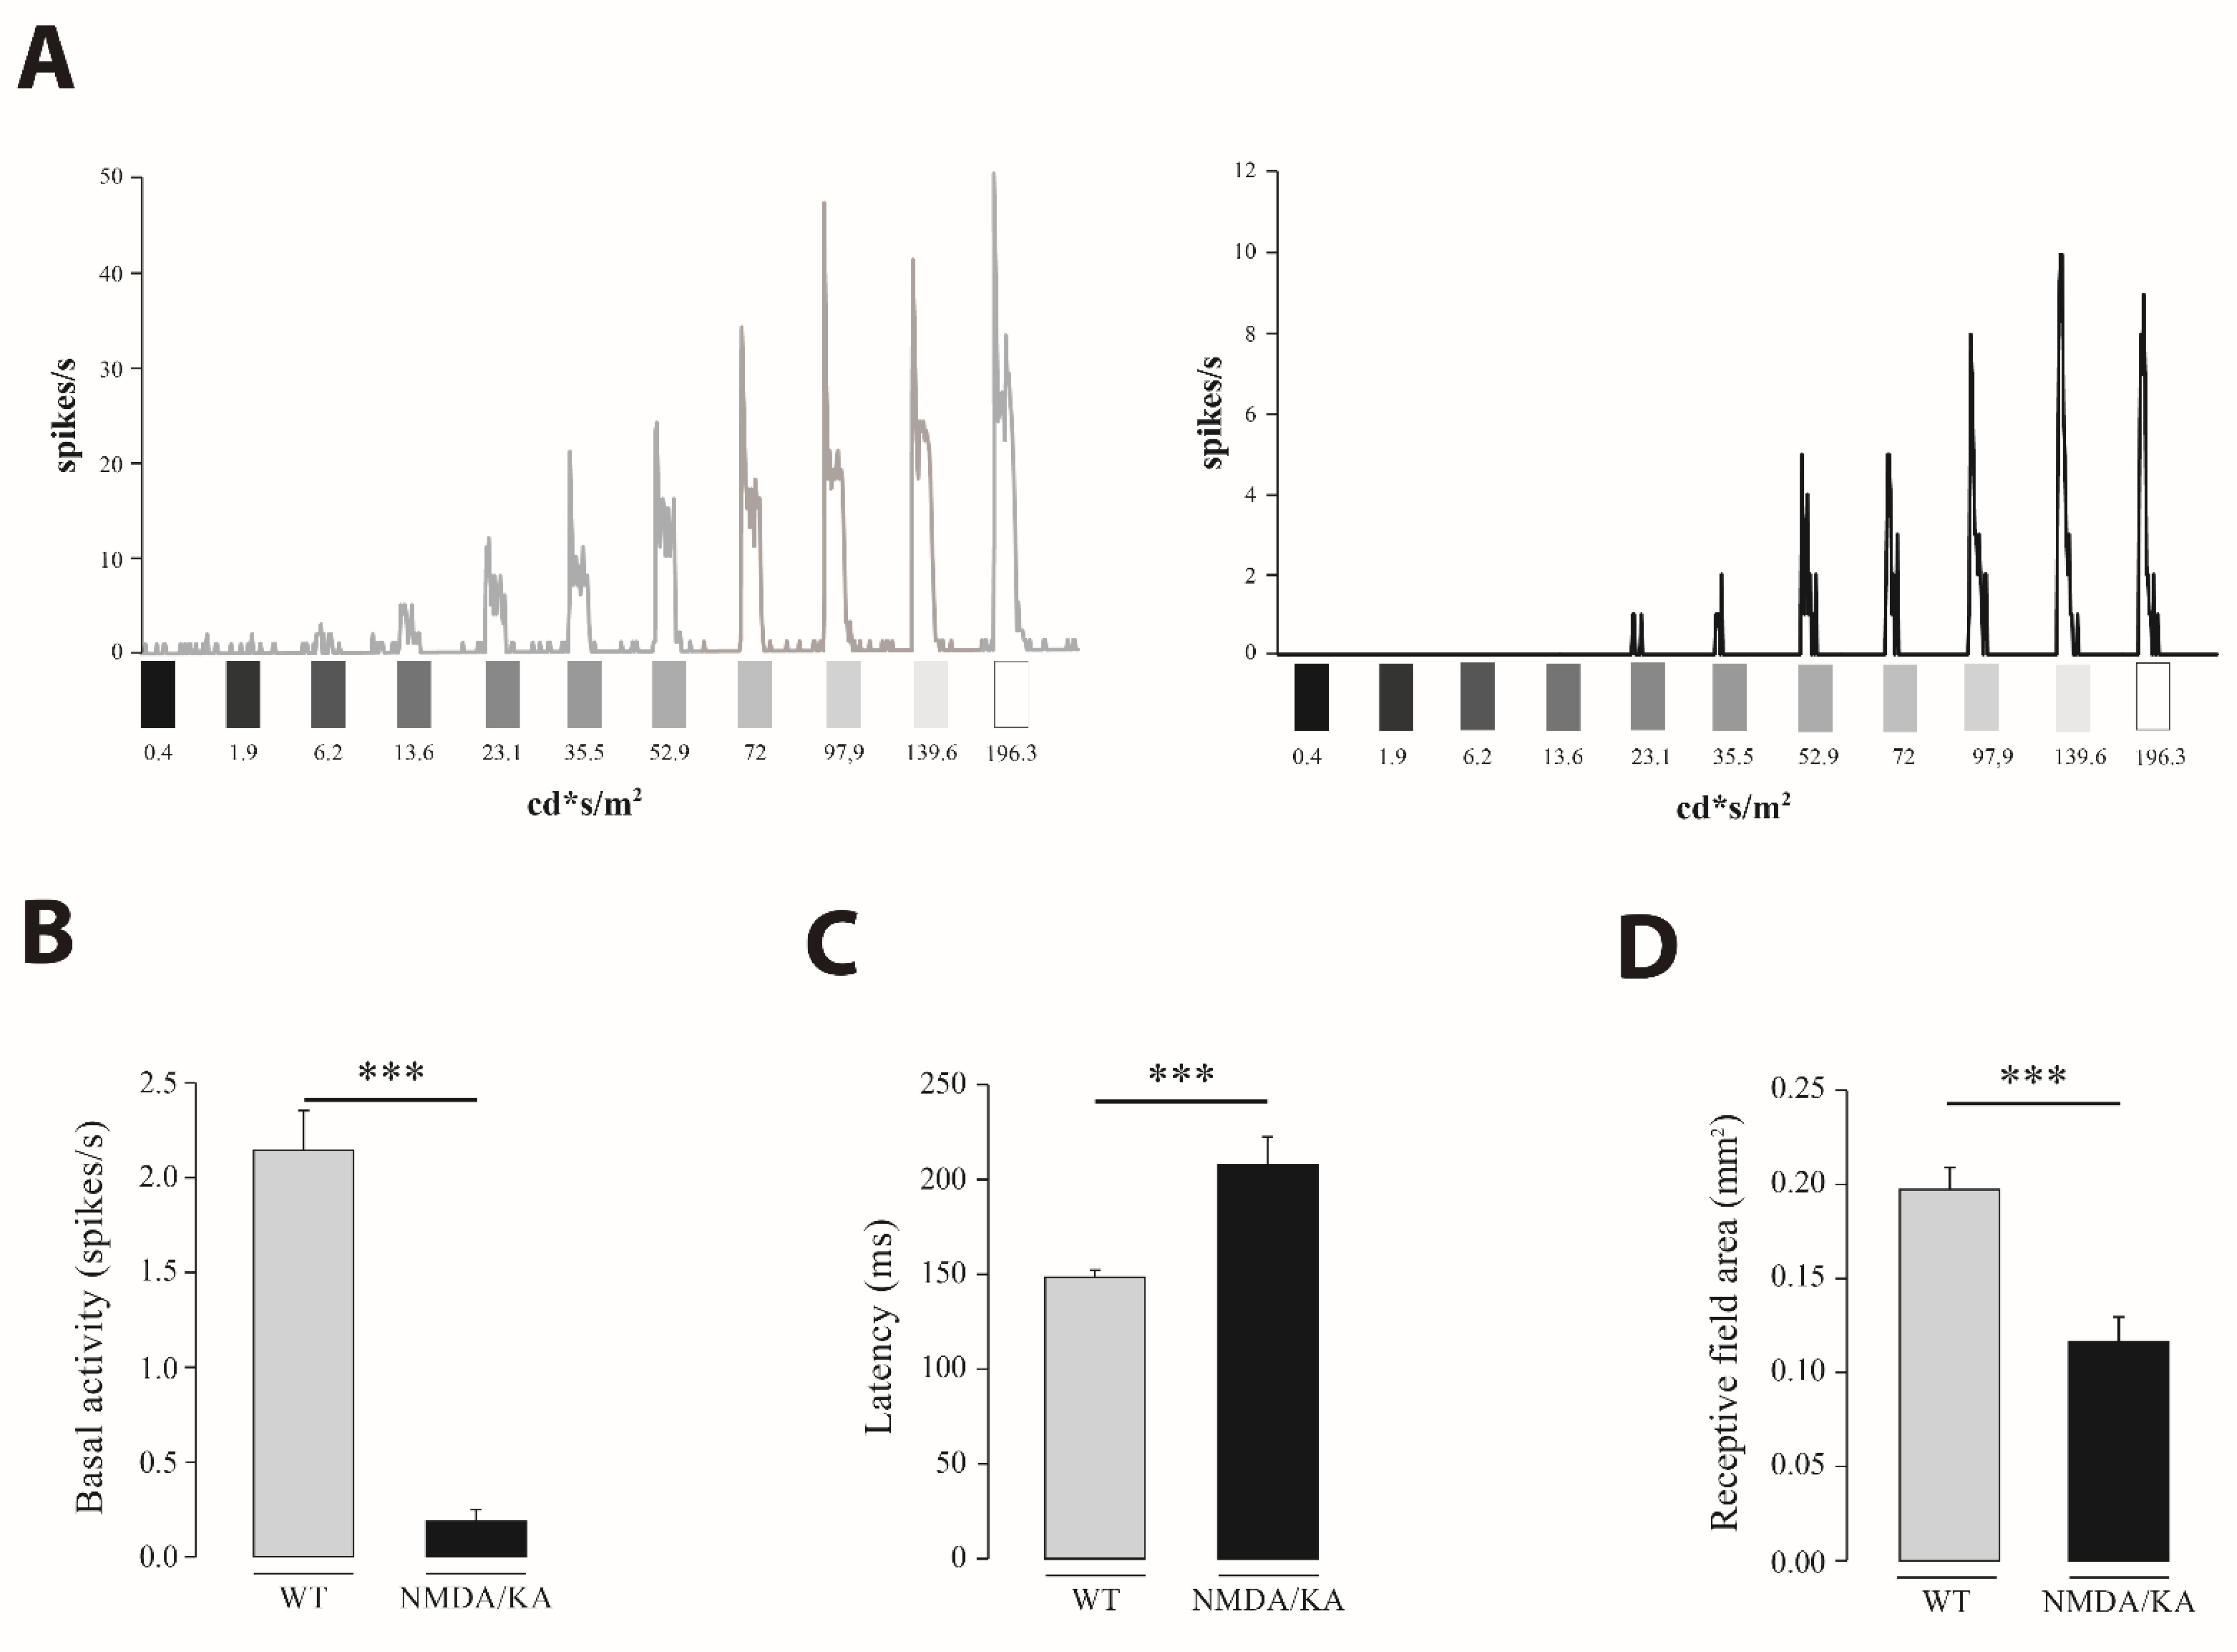
2.2. Retinal Multielectrode Recording
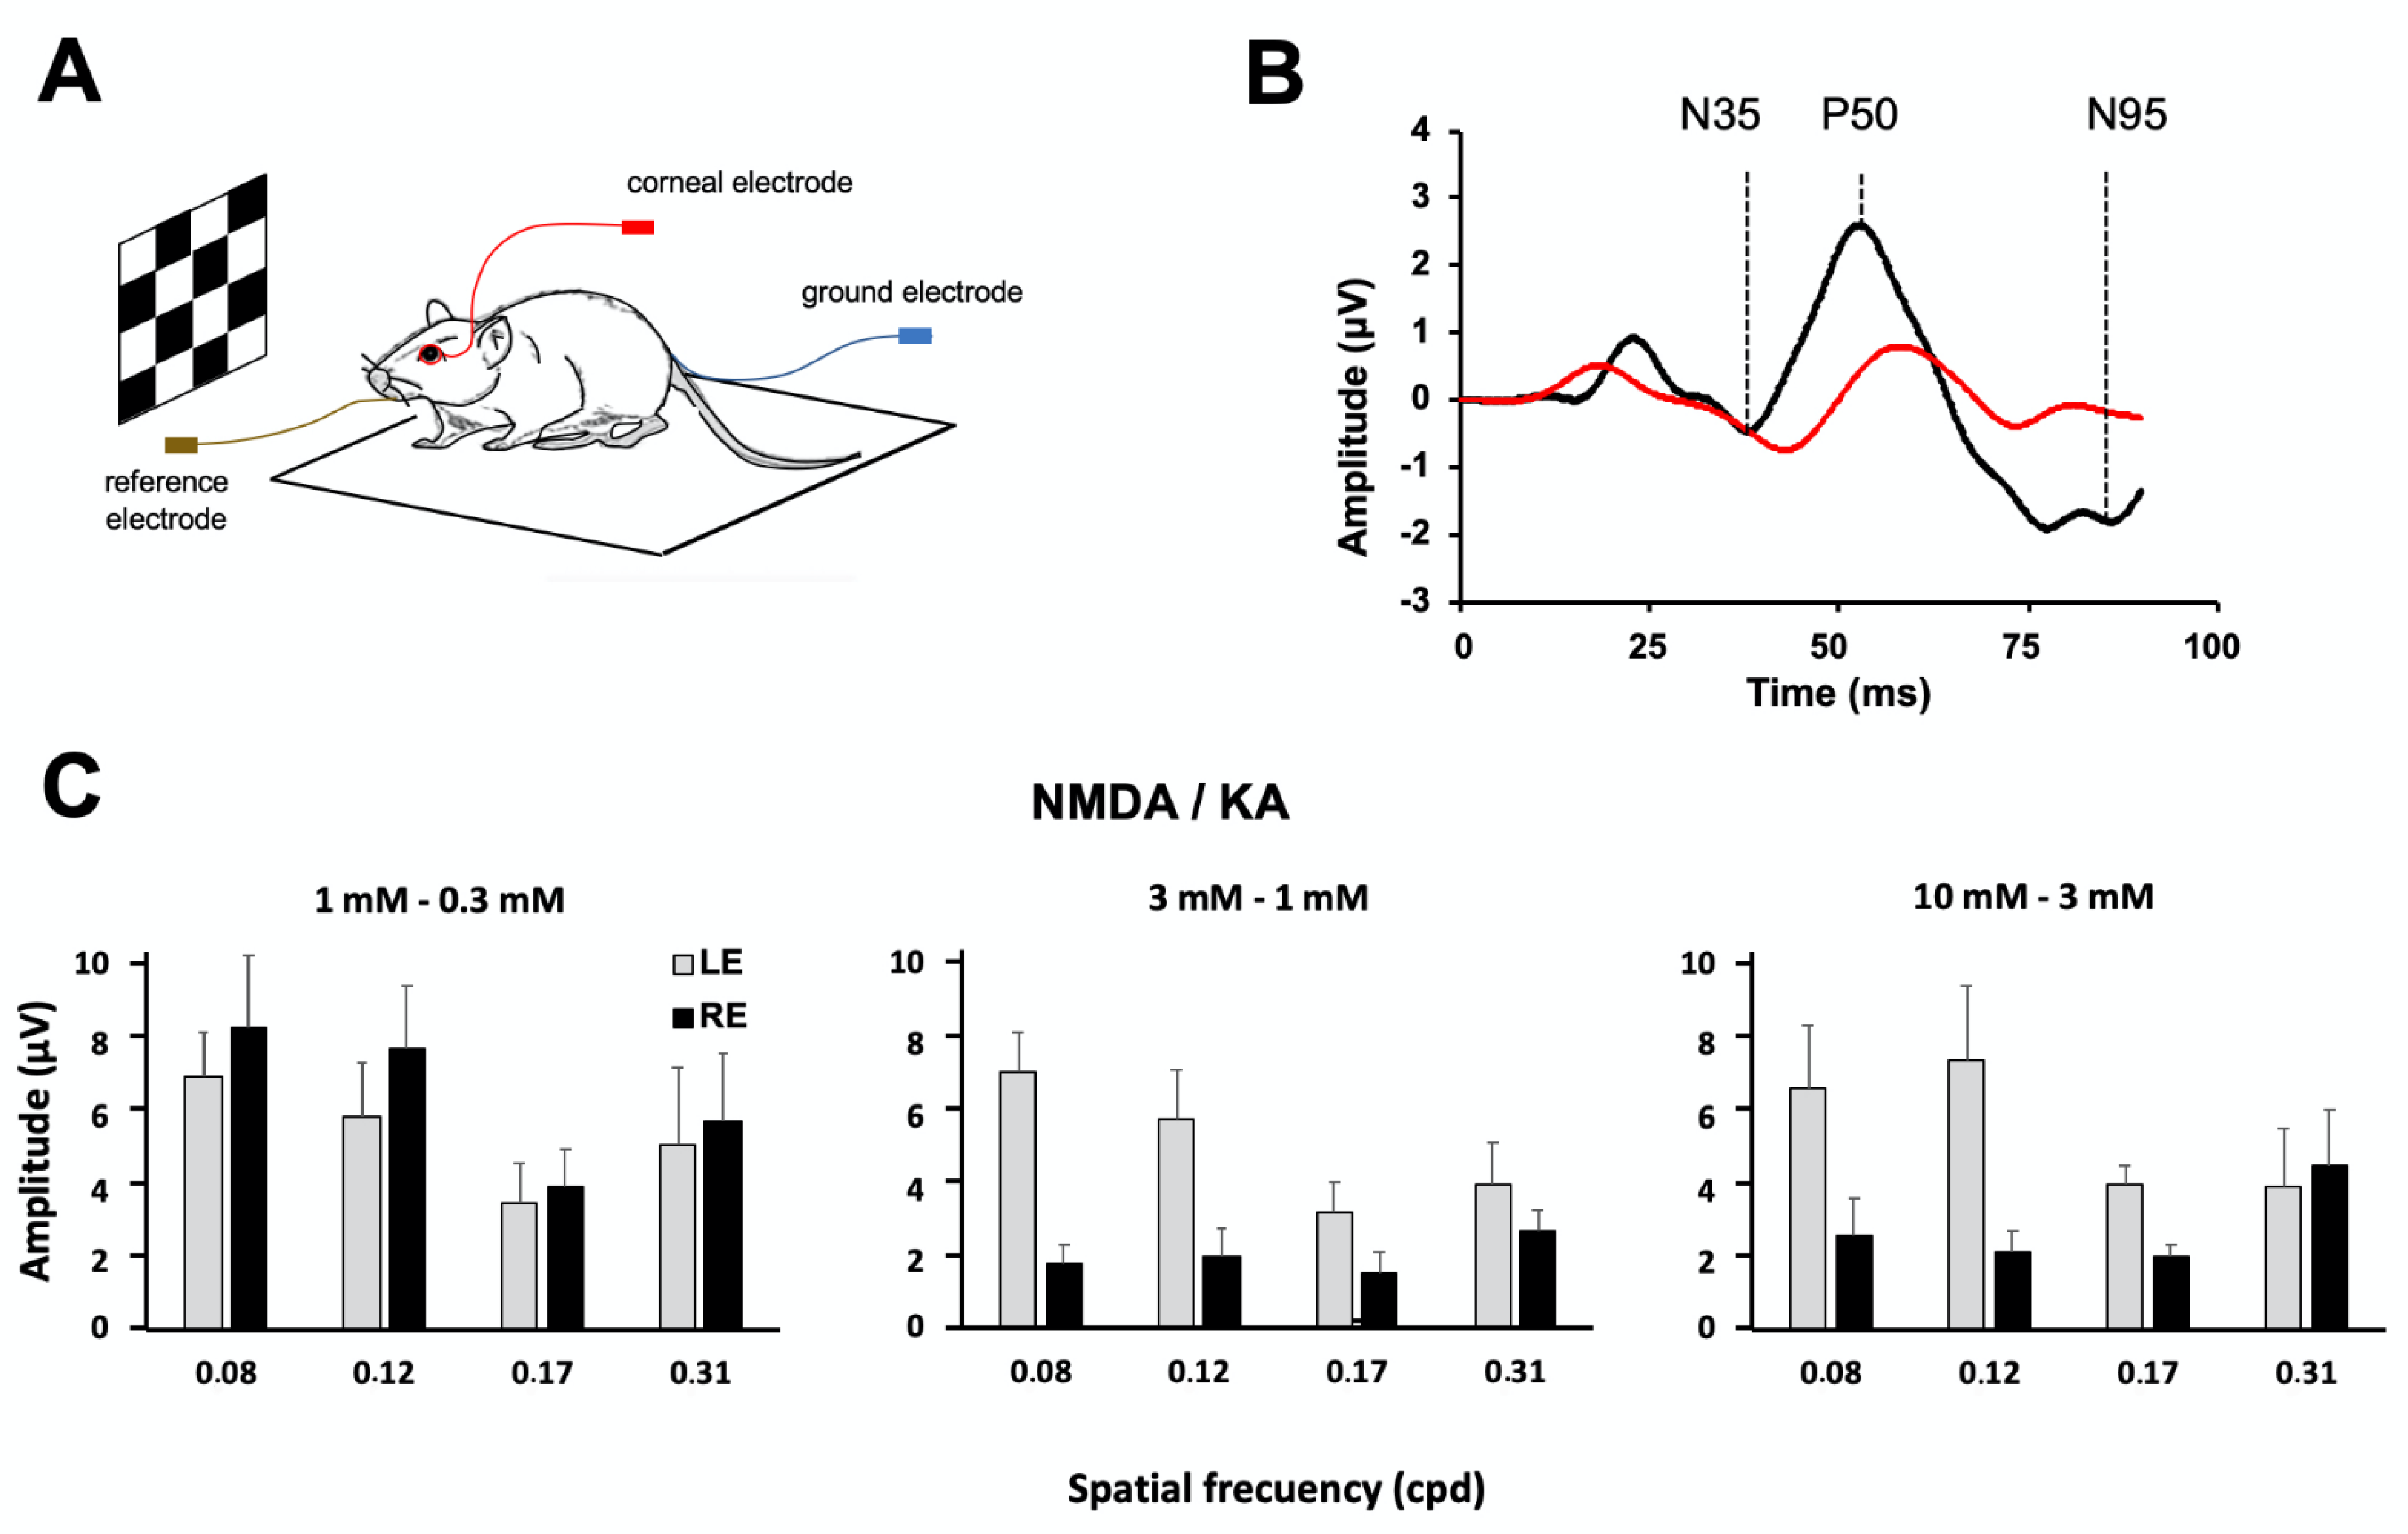
2.3. Pattern Electroretinography
2.4. Optomotor Test
3. Discussion
4. Material and Methods
4.1. Experimental Animals
4.2. Intravitreal Injection of Excitotoxic Agents
4.3. Dose Estimation of Excitotoxic Agents
4.4. Immunohistochemistry
4.5. Electrophysiological Recordings
4.5.1. Extracellular Multielectrode Recording
4.5.2. Pattern Electroretinography
4.5.3. Optomotor Response
4.6. Statistical Analysis
Author Contributions
Funding
Institutional Review Board Statement
Informed Consent Statement
Data Availability Statement
Acknowledgments
Conflicts of Interest
References
- Freedman, J.K.; Potts, A.M. Repression of glutaminase I in the rat retina by administration of sodium-L-glutamate. Investig. Ophthalmol. Vis. Sci. 1962, 1, 118–121. [Google Scholar]
- Olney, J.W.; Sharpe, L.G. Brain lesions in an infant rhesus monkey treated with monosodium glutamate. Science 1969, 166, 386–388. [Google Scholar] [CrossRef] [PubMed]
- Jancso, G.; Karcsu, S.; Kiraly, E.; Szebeni, A.; Toth, L.; Bacsy, E.; Joo, F.; Parducz, A. Neurotoxin induced nerve cell degeneration: Possible involvement of calcium. Brain Res. 1984, 295, 211–216. [Google Scholar] [CrossRef]
- Berdichevsky, E.; Riveros, N.; Sanchez-Armass, S.; Orrego, F. Kainate, N-methylaspartate and other excitatory amino acids increase calcium influx into rat brain cortex cells in vitro. Neurosci. Lett. 1983, 36, 75–80. [Google Scholar] [CrossRef]
- Goldberg, M.P.; Weiss, J.H.; Pham, P.C.; Choi, D.W. N-methyl-D-aspartate receptors mediate hypoxic neuronal injury in cortical culture. J. Pharmacol. Exp. Ther. 1987, 243, 784–791. [Google Scholar]
- Sheardown, M.J.; Nielsen, E.O.; Hansen, A.J.; Jacobsen, P.; Honore, T. 2,3-Dihydroxy-6-nitro-7-sulfamoyl-benzo(F)quinoxaline: A neuroprotectant for cerebral ischemia. Science 1990, 247, 571–574. [Google Scholar] [CrossRef]
- Shen, W.; Slaughter, M.M. A non-excitatory paradigm of glutamate toxicity. J. Neurophysiol. 2002, 87, 1629–1634. [Google Scholar] [CrossRef] [Green Version]
- Uematsu, D.; Greenberg, J.H.; Hickey, W.F.; Reivich, M. Nimodipine attenuates both increase in cytosolic free calcium and histologic damage following focal cerebral ischemia and reperfusion in cats. Stroke 1989, 20, 1531–1537. [Google Scholar] [CrossRef] [Green Version]
- Tymianski, M.; Wallace, M.C.; Spigelman, I.; Uno, M.; Carlen, P.L.; Tator, C.H.; Charlton, M.P. Cell-permeant Ca2+ chelators reduce early excitotoxic and ischemic neuronal injury in vitro and in vivo. Neuron 1993, 11, 221–235. [Google Scholar] [CrossRef]
- Lucas, D.R.; Newhouse, J.P. The toxic effect of sodium L-glutamate on the inner layers of the retina. AMA Arch. Ophthalmol. 1957, 58, 193–201. [Google Scholar] [CrossRef]
- Nivison-Smith, L.; Sun, D.; Fletcher, E.L.; Marc, R.E.; Kalloniatis, M. Mapping kainate activation of inner neurons in the rat retina. J. Comp. Neurol. 2013, 521, 2416–2438. [Google Scholar] [CrossRef] [PubMed]
- Calvo, E.; Milla-Navarro, S.; Ortuño-Lizarán, I.; Gómez-Vicente, V.; Cuenca, N.; De la Villa, P.; Germain, F. Deleterious Effect of NMDA Plus Kainate on the Inner Retinal Cells and Ganglion Cell Projection of the Mouse. Int. J. Mol. Sci. 2020, 21, 1570. [Google Scholar] [CrossRef] [Green Version]
- Kolb, H.; Nelson, R.; Ahnelt, P.; Cuenca, N. Cellular organization of the vertebrate retina. Prog. Brain Res. 2001, 131, 3–26. [Google Scholar]
- Cuenca, N.; Fernández-Sánchez, L.; Campello, L.; Maneu, V.; De la Villa, P.; Lax, P.; Pinilla, I. Cellular responses following retinal injuries and therapeutic approaches for neurodegenerative diseases. Prog. Retin. Eye Res. 2014, 43, 17–75. [Google Scholar] [CrossRef] [PubMed]
- Kuehn, S.; Rodust, C.; Stute, G.; Grotegut, P.; Meißner, W.; Reinehr, S.; Dick, H.B.; Joachim, S.C. Concentration-Dependent Inner Retina Layer Damage and Optic Nerve Degeneration in a NMDA Model. J. Mol. Neurosci. 2017, 63, 283–299. [Google Scholar] [CrossRef] [PubMed]
- Christensen, I.; Lu, B.; Yang, N.; Huang, K.; Wang, P.; Tian, N. The Susceptibility of Retinal Ganglion Cells to Glutamatergic Excitotoxicity Is Type-Specific. Front. Neurosci. 2019, 15, 219. [Google Scholar] [CrossRef] [Green Version]
- Vorwerk, C.K.; Naskar, R.; Schuettauf, F.; Zurakowski, D.; McDermott, L.M.; Quinto, K.M.; Dreyer, E.B. Excitotoxicity can be mediated through an interaction within the optic nerve; activation of cell body NMDA receptors is not required. Vet. Ophthalmol. 2001, 4, 201–204. [Google Scholar] [CrossRef] [PubMed]
- Balazs, R.; Hack, N.; Jorgensen, O.S. Stimulation of the N-methyl-D-aspartate receptor has a trophic effect on differentiating cerebellar granule cells. Neurosci. Lett. 1988a, 87, 80–86. [Google Scholar] [CrossRef]
- Balazs, R.; Jorgensen, O.S.; Hack, N. N-methyl-D-aspartate promotes the survival of cerebellar granule cells in culture. Neuroscience 1988b, 27, 437–451. [Google Scholar] [CrossRef]
- Brenneman, D.E.; Forsythe, I.D.; Nicol, T.; Nelson, P.G. N-methyl-D-aspartate receptors influence neuronal survival in developing spinal cord cultures. Dev. Brain Res. 1990a, 51, 63–68. [Google Scholar] [CrossRef]
- Brenneman, D.E.; Yu, C.; Nelson, P.G. Multi-determinate regulation of neuronal survival: Neuropeptides, excitatory amino acids and bioelectric activity. Int. J. Dev. Neurosci. 1990b, 8, 371–378. [Google Scholar] [CrossRef]
- Mafei, L.; Fiorentini, A. Electroretinographic responses to alternating gratings before and after section of the optic nerve. Science 1981, 211, 953–955. [Google Scholar] [CrossRef] [PubMed]
- Prusky, G.T.; Alam, N.M.; Beekman, S.; Douglas, R.M. Rapid quantification of adult and developing mouse spatial vision using a virtual optomotor system. Investig. Ophthalmol. Vis. Sci. 2004, 45, 4611–4616. [Google Scholar] [CrossRef] [PubMed] [Green Version]
- Peng, Y.W.; Blackstone, C.D.; Huganir, R.L.; Yau, K.W. Distribution of glutamate receptor subtypes in the vertebrate retina. Neuroscience 1995, 66, 483–497. [Google Scholar] [CrossRef]
- Brandstätter, J.H.; Koulen, P.; Wässle, H. Selective synaptic distribution of kainate receptor subunits in the two plexiform layers of the rat retina. J. Neurosci. 1997, 17, 9298–9307. [Google Scholar] [CrossRef]
- Fletcher, E.L.; Hack, I.; Brandstatter, J.H.; Wassle, H. Synaptic localization of NMDA receptor subunits in the rat retina. J. Comp. Neurol. 2000, 420, 98–112. [Google Scholar] [CrossRef]
- Luo, X.; Heidinger, V.; Picaud, S.; Lambrou, G.; Dreyfus, H.; Sahel, J.; Hicks, D. Selective excitotoxic degeneration of adult pig retinal ganglion cells in vitro. Investig. Ophthalmol. Vis. Sci. 2001, 42, 1096–1106. [Google Scholar]
- Germain, F.; Fernández, E.; de la Villa, P. Morphometrical analysis of dendritic arborization in axotomizes retinal ganglion cell. Eur. J. Neurosci. 2003, 18, 1103–1109. [Google Scholar] [CrossRef]
- Germain, F.; Fernández, E.; de la Villa, P. Morphological signs of apoptosis in axotomized ganglion cells of the rabbit retina. Neuroscience 2007, 144, 898–910. [Google Scholar] [CrossRef]
- Wen, X.; Cahill, A.L.; Barta, C.; Thoreson, W.B.; Nawy, S. Elevated Pressure Increases Ca2+ Influx through AMPA Receptors in Select Populations of Retinal Ganglion Cells. Front. Cell. Neurosci. 2018, 12, 162. [Google Scholar] [CrossRef] [Green Version]
- Oyster, C.W.; Simpson, J.I.; Takahashi, E.S.; Soodak, R.E. Retinal ganglion cells projecting to the rabbit accessory optic system. J. Comp. Neurol. 1980, 190, 49–61. [Google Scholar] [CrossRef]
- Buhl, E.H.; Peichl, L. Morphology of rabbit retinal ganglion cells projecting to the medial terminal nucleus of the accessory optic system. J. Comp. Neurol. 1986, 253, 163–174. [Google Scholar] [CrossRef]
- Amthor, F.R.; Takahashi, E.S.; Oyster, C.W. Morphologies of rabbit retinal ganglion cells with complex receptive fields. J. Comp. Neurol. 1989, 280, 97–121. [Google Scholar] [CrossRef]
- Sun, W.; Deng, Q.; Levick, W.R.; He, S. On direction-selective ganglion cells in the mouse retina. J. Physiol. 2006, 576, 197–202. [Google Scholar] [CrossRef]
- Gauvain, G.; Murphy, G.J. Characteristics of Retinal Input to the Brain. J. Neurosci. 2015, 35, 6575–6583. [Google Scholar] [CrossRef] [PubMed] [Green Version]
- Vaney, D.I.; Sivyer, B.; Taylor, W.R. Direction selectivity in the retina: Symmetry and asymmetry in structure and function. Nat. Rev. Neurosci. 2012, 13, 194–208. [Google Scholar] [CrossRef] [PubMed]
- Kay, J.N.; De la Huerta, I.; Kim, I.J.; Zhang, Y.; Yamagata, M.; Chu, M.W.; Meister, M.; Sanes, J.R. Retinal Ganglion Cells with Distinct Directional Preferences Differ in Molecular Identity, Structure, and Central Projections. J. Neurosci. 2011, 31, 7753–7762. [Google Scholar] [CrossRef] [PubMed] [Green Version]
- Dhande, O.S.; Huberman, A.H. Retinal ganglion cell maps in the brain: Implications for visualprocessing. Curr. Opin. Neurobiol. 2014, 24, 133–142. [Google Scholar] [CrossRef] [Green Version]
- Ryan, S.; Arden, G.B. Electrophysiological discrimination between retinal and optic nerve disorders. Doc. Ophthalmol. 1988, 68, 247–255. [Google Scholar] [CrossRef]
- Bach, M.; Hoffman, M.B. Origins of the pattern electroretinogram. In Principles and Practise of Clinical Electrophysiology of Vision; Nusinowitz, S., Holder, G.E., Bach, M., Eds.; The MIT Press: Cambridge, MA, USA, 2006; pp. 185–196. [Google Scholar]
- Kretschmer, F.; Sajgo, S.; Kretschmer, V.; Badea, T.C. A system to measure the optokinetic and optomotor response in mice. J. Neurosci. Methods 2015, 256, 91–105. [Google Scholar] [CrossRef] [PubMed] [Green Version]
- Alam, N.M.; Altimus, C.M.; Douglas, R.M.; Hattar, S.; Prusky, G.T. Photoreceptor regulation of spatial visual behavior. Investig. Ophthalmol. Vis. Sci. 2015, 256, 1842–1849. [Google Scholar] [CrossRef] [Green Version]
- Schmucker, C.; Seeliger, M.; Humphries, P.; Biel, M.; Schaeffel, F. Grating acuity at different luminances in wild-type mice and in mice lacking rod or cone function. Investig. Ophthalmol. Vis. Sci. 2005, 46, 398–407. [Google Scholar] [CrossRef] [PubMed]
- Kimura, A.; Namekata, K.; Guo, X.; Noro, T.; Harada, C.; Harada, T. Valproic acid prevents NMDA-induced retinal ganglion cell death via stimulation of neuronal TrkB receptor signaling. Am. J. Pathol. 2015, 185, 756–764. [Google Scholar] [CrossRef]
- Zhao, J.; Mysona, B.A.; Qureshi, A.; Kim, L.; Fields, T.; Gonsalvez, G.B.; Smith, S.B.; Bollinger, K.E. (+)-Pentazocine Reduces NMDA-Induced Murine Retinal Ganglion Cell Death Through a σR1-Dependent Mechanism. Investig. Ophthalmol. Vis. Sci. 2016, 57, 453–461. [Google Scholar] [CrossRef] [Green Version]
- Ishimaru, Y.; Sumino, A.; Kajioka, D.; Shibagaki, F.; Yamamuro, A.; Yoshioka, Y.; Maeda, S. Apelin protects against NMDA-induced retinal neuronal death via an APJ receptor by activating Akt and ERK1/2, and suppressing TNF-α expression in mice. J. Pharmacol. Sci. 2017, 133, 34–41. [Google Scholar] [CrossRef] [PubMed]
- Maekawa, S.; Sato, K.; Fujita, K.; Daigaku, R.; Tawarayama, H.; Murayama, N.; Moritoh, S.; Yabana, T.; Shiga, Y.; Omodaka, K.; et al. The neuroprotective effect of hesperidin in NMDA-induced retinal injury acts by suppressing oxidative stress and excessive calpain activation. Sci. Rep. 2017, 7, 6885. [Google Scholar] [CrossRef] [PubMed] [Green Version]
- Gao, L.; Zheng, Q.J.; Ai, L.Q.; Chen, K.J.; Zhou, Y.G.; Ye, J.; Liu, W. Exploration of the glutamate-mediated retinal excitotoxic damage: A rat model of retinal neurodegeneration. Int. J. Ophthalmol. 2018, 11, 1746–1754. [Google Scholar]
- Lambuk, L.; Jafri, A.J.A.; Iezhitsa, I.; Agarwal, R.; Bakar, N.S.; Agarwal, P.; Abdullah, A.; Ismail, N.M. Dose dependent effects of NMDA on retinal and optic nerve morphology in rats. Int. J. Ophthalmol. 2019, 12, 746–753. [Google Scholar]
- Röhrenbeck, J.; Wässle, H.; Heizmann, C.W. Immunocytochemical labelling of horizontal cells in mammalian retina using antibodies against calcium-binding proteins. Neurosci. Lett. 1987, 77, 255–260. [Google Scholar] [CrossRef]
- Wässle, H.; Peichl, L.; Airaksinen, M.S.; Meyer, M. Calcium-binding proteins in the retina of a calbindin-null mutant mouse. Cell Tissue Res. 1998, 292, 211–218. [Google Scholar] [CrossRef]
- Massey, S.C.; Mills, S.L. A calbindin-immunoreactive cone bipolar cell type in the rabbit retina. J. Comp. Neurol. 1996, 366, 15–33. [Google Scholar] [CrossRef]
- Haverkamp, S.; Wässle, H. Immunocytochemical analysis of the mouse retina. J. Comp. Neurol. 2000, 424, 1–23. [Google Scholar] [CrossRef]
- Fox, M.A.; Sanes, J.R. Synaptotagmin I and II are present in distinct subsets of central synapses. J. Comp. Neurol. 2007, 503, 280–296. [Google Scholar] [CrossRef]
- Wässle, H.; Puller, C.; Müller, F.; Haverkamp, S. Cone contacts, mosaics, and territories of bipolar cells in the mouse retina. J. Neurosci. 2009, 29, 106–117. [Google Scholar] [CrossRef]
- Nadal-Nicolás, F.M.; Jiménez-López, M.; Sobrado-Calvo, P.; Nieto-López, L.; Cánovas-Martínez, I.; Salinas-Navarro, M.; Vidal-Sanz, M.; Agudo, M. Brn3a as a marker of retinal ganglion cells: Qualitative and quantitative time course studies in naive and optic nerve-injured retinas. Investig. Ophthalmol. Vis. Sci. 2009, 50, 3860–3868. [Google Scholar] [CrossRef] [Green Version]
- Greferath, U.; Grünert, U.; Wässle, H. Rod bipolar cells in the mammalian retina show protein kinase C-like immunoreactivity. J. Comp. Neurol. 1990, 301, 433–442. [Google Scholar] [CrossRef]
- Barhoum, R.; Martínez-Navarrete, G.; Corrochano, S.; Germain, F.; Fernandez-Sanchez, L.; de la Rosa, E.J.; de la Villa, P.; Cuenca, N. Functional and structural modifications during retinal degeneration in the rd10 mouse. Neuroscience 2008, 155, 698–713. [Google Scholar] [CrossRef] [Green Version]
- Xiong, W.H.; Pang, J.J.; Pennesi, M.E.; Duvoisin, R.M.; Wu, S.M.; Morgans, C.W. The Effect of PKCα on the Light Response of Rod Bipolar Cells in the Mouse Retina. Investig. Ophthalmol. Vis. Sci. 2015, 56, 4961–4974. [Google Scholar] [CrossRef] [Green Version]
- Rice, D.S.; Curran, T. Disabled-1 is expressed in type AII amacrine cells in the mouse retina. J. Comp. Neurol. 2000, 424, 327–338. [Google Scholar] [CrossRef]
- Gabriel, G.; Gómez, R.; Bongard, M.; Benito, N.; Fernández, N.; Villa, R. Easily made single-walled carbon nanotube surface microelectrodes for neuronal applications. Biosens. Bioelectron. 2009, 24, 1942–1948. [Google Scholar] [CrossRef]
- Maynard, E.M.; Fernandez, E.; Normann, R.A. A technique to prevent dural adhesions to chronically implanted microelectrode arrays. J. Neurosci. Methods. 2000, 97, 93–101. [Google Scholar] [CrossRef]
- Straw, A. Vision egg: An open-source library for realtime visual stimulus generation. Front. Neuroinformatics 2008, 2, 4. [Google Scholar] [CrossRef] [PubMed] [Green Version]
- Fernández, E.; Ferrandez, J.; Ammermüller, J.; Normann, R.A. Population coding in spike trains of simultaneously recorded retinal ganglion cells. Brain Res. 2000, 887, 222–229. [Google Scholar] [CrossRef]
- Elstrott, J.; Anishchenko, A.; Greschner, M.; Sher, A.; Litke, A.M.; Chichilnisky, E.J.; Feller, M.B. Direction selectivity in the retina is established independent of visual experience and cholinergic retinal waves. Neuron 2008, 58, 499–506. [Google Scholar] [CrossRef] [PubMed] [Green Version]
- Holder, G.E. Pattern electroretinography (PERG) and an integrated approach to visual pathway diagnosis. Prog. Retin. Eye Res. 2001, 20, 531–561. [Google Scholar] [CrossRef]
- Franco, L.M.; Zulliger, R.; Wolf-Schnurrbusch, U.E.; Katagiri, Y.; Kaplan, H.J.; Wolf, S.; Enzmann, V. Decreased visual function after patchy loss of retinal pigment epithelium induced by low-dose sodium iodate. Investig. Ophthalmol. Vis. Sci. 2009, 50, 4004–4010. [Google Scholar] [CrossRef] [PubMed] [Green Version]
- Redfern, W.S.; Storey, S.; Tse, K.; Hussain, Q.; Maung, K.P.; Valentin, J.P.; Ahmed, G.; Bigley, A.; Heathcote, D.; McKay, J.S. Evaluation of a convenient method of assessing rodent visual function in safety pharmacology studies: Effects of sodium iodate on visual acuity and retinal morphology in albino and pigmented rats and mice. J. Pharmacol. Toxicol. Methods 2011, 63, 102–114. [Google Scholar] [CrossRef] [PubMed]
- Barabas, P.; Huang, W.; Chen, H.; Koehler, C.L.; Howell, G.; John, S.W.M.; Tian, N.; Rentería, R.C.; Krizaj, D. Missing Optomotor Head-Turning Reflex in the DBA/2J Mouse. Investig. Ophthalmol. Vis. Sci. 2011, 52, 6766–6773. [Google Scholar] [CrossRef]


Publisher’s Note: MDPI stays neutral with regard to jurisdictional claims in published maps and institutional affiliations. |
© 2021 by the authors. Licensee MDPI, Basel, Switzerland. This article is an open access article distributed under the terms and conditions of the Creative Commons Attribution (CC BY) license (https://creativecommons.org/licenses/by/4.0/).
Share and Cite
Milla-Navarro, S.; Diaz-Tahoces, A.; Ortuño-Lizarán, I.; Fernández, E.; Cuenca, N.; Germain, F.; de la Villa, P. Visual Disfunction due to the Selective Effect of Glutamate Agonists on Retinal Cells. Int. J. Mol. Sci. 2021, 22, 6245. https://doi.org/10.3390/ijms22126245
Milla-Navarro S, Diaz-Tahoces A, Ortuño-Lizarán I, Fernández E, Cuenca N, Germain F, de la Villa P. Visual Disfunction due to the Selective Effect of Glutamate Agonists on Retinal Cells. International Journal of Molecular Sciences. 2021; 22(12):6245. https://doi.org/10.3390/ijms22126245
Chicago/Turabian StyleMilla-Navarro, Santiago, Ariadna Diaz-Tahoces, Isabel Ortuño-Lizarán, Eduardo Fernández, Nicolás Cuenca, Francisco Germain, and Pedro de la Villa. 2021. "Visual Disfunction due to the Selective Effect of Glutamate Agonists on Retinal Cells" International Journal of Molecular Sciences 22, no. 12: 6245. https://doi.org/10.3390/ijms22126245