Author Contributions
Material, M.H., J.S., X.L. and D.L.; methodology, M.H. and L.S.; formal analysis, M.H. and W.L.; writing—original draft preparation, W.Y. and M.H.; writing—review and editing, W.Y., M.S. and A.Z.; supervision, W.Y., and A.Z.; funding acquisition, W.Y. All authors have read and agreed to the published version of the manuscript.
Figure 1.
Comparison of anther and pollen grains of AL18B and AL18A. (A), (a,d) Mature pollen grains of AL18B and AL18A stained with I2-KI (Scale bar: 200 μm); (b,e) Mature pollen grains of AL18B and AL18A (Scale bar: 300 μm); (c,f) Tapetal cell surface-localized orbicule (Or) structures of AL18B and AL18A (Scale bars: 10 µm). (B), (h,i,j) Paraffin sections of early-uninucleate, later-uninucleate, and binucleate stage of AL18B. (k,l,m) Paraffin sections of early-uninucleate, later-uninucleate, and binucleate stage of AL18A (Scale bars: 10 µm). (C), (o–q) Carmine acetate dyeing of pollen in uninucleate, early-binucleate, and later- binucleate stage of AL18B. (r–t) Carmine acetate dyeing of pollen in uninucleate, early-binucleate, and later- binucleate stage of AL18A, red arrows indicate nucleus. (Scale bars: 30 µm).
Figure 2.
Comparison of mitochondrial DNA between AL18A and Triticum timopheevii (A), AL18B and Chinese Yumai (B). (A) The abscissa represents the mitochondrial DNA sequence of AL18A, and the ordinate represents the mitochondrial DNA sequence of Triticum timopheevii. (B) The abscissa represents the mitochondrial DNA sequence of AL18B, and the ordinate represents the mitochondrial DNA sequence of Chinese Yumai.
Figure 3.
Circle map of AL18B (A) and AL18A (B) mitochondrial genome. Genes on the forward and reverse strands are presented on the outside and inside of the circle, respectively. The two gray layers represent the GC content in the mitochondrial genome.
Figure 3.
Circle map of AL18B (A) and AL18A (B) mitochondrial genome. Genes on the forward and reverse strands are presented on the outside and inside of the circle, respectively. The two gray layers represent the GC content in the mitochondrial genome.
Figure 4.
Venn diagram showing the mutual overlaps of orfs in the AL18B and AL18A.
Figure 4.
Venn diagram showing the mutual overlaps of orfs in the AL18B and AL18A.
Figure 5.
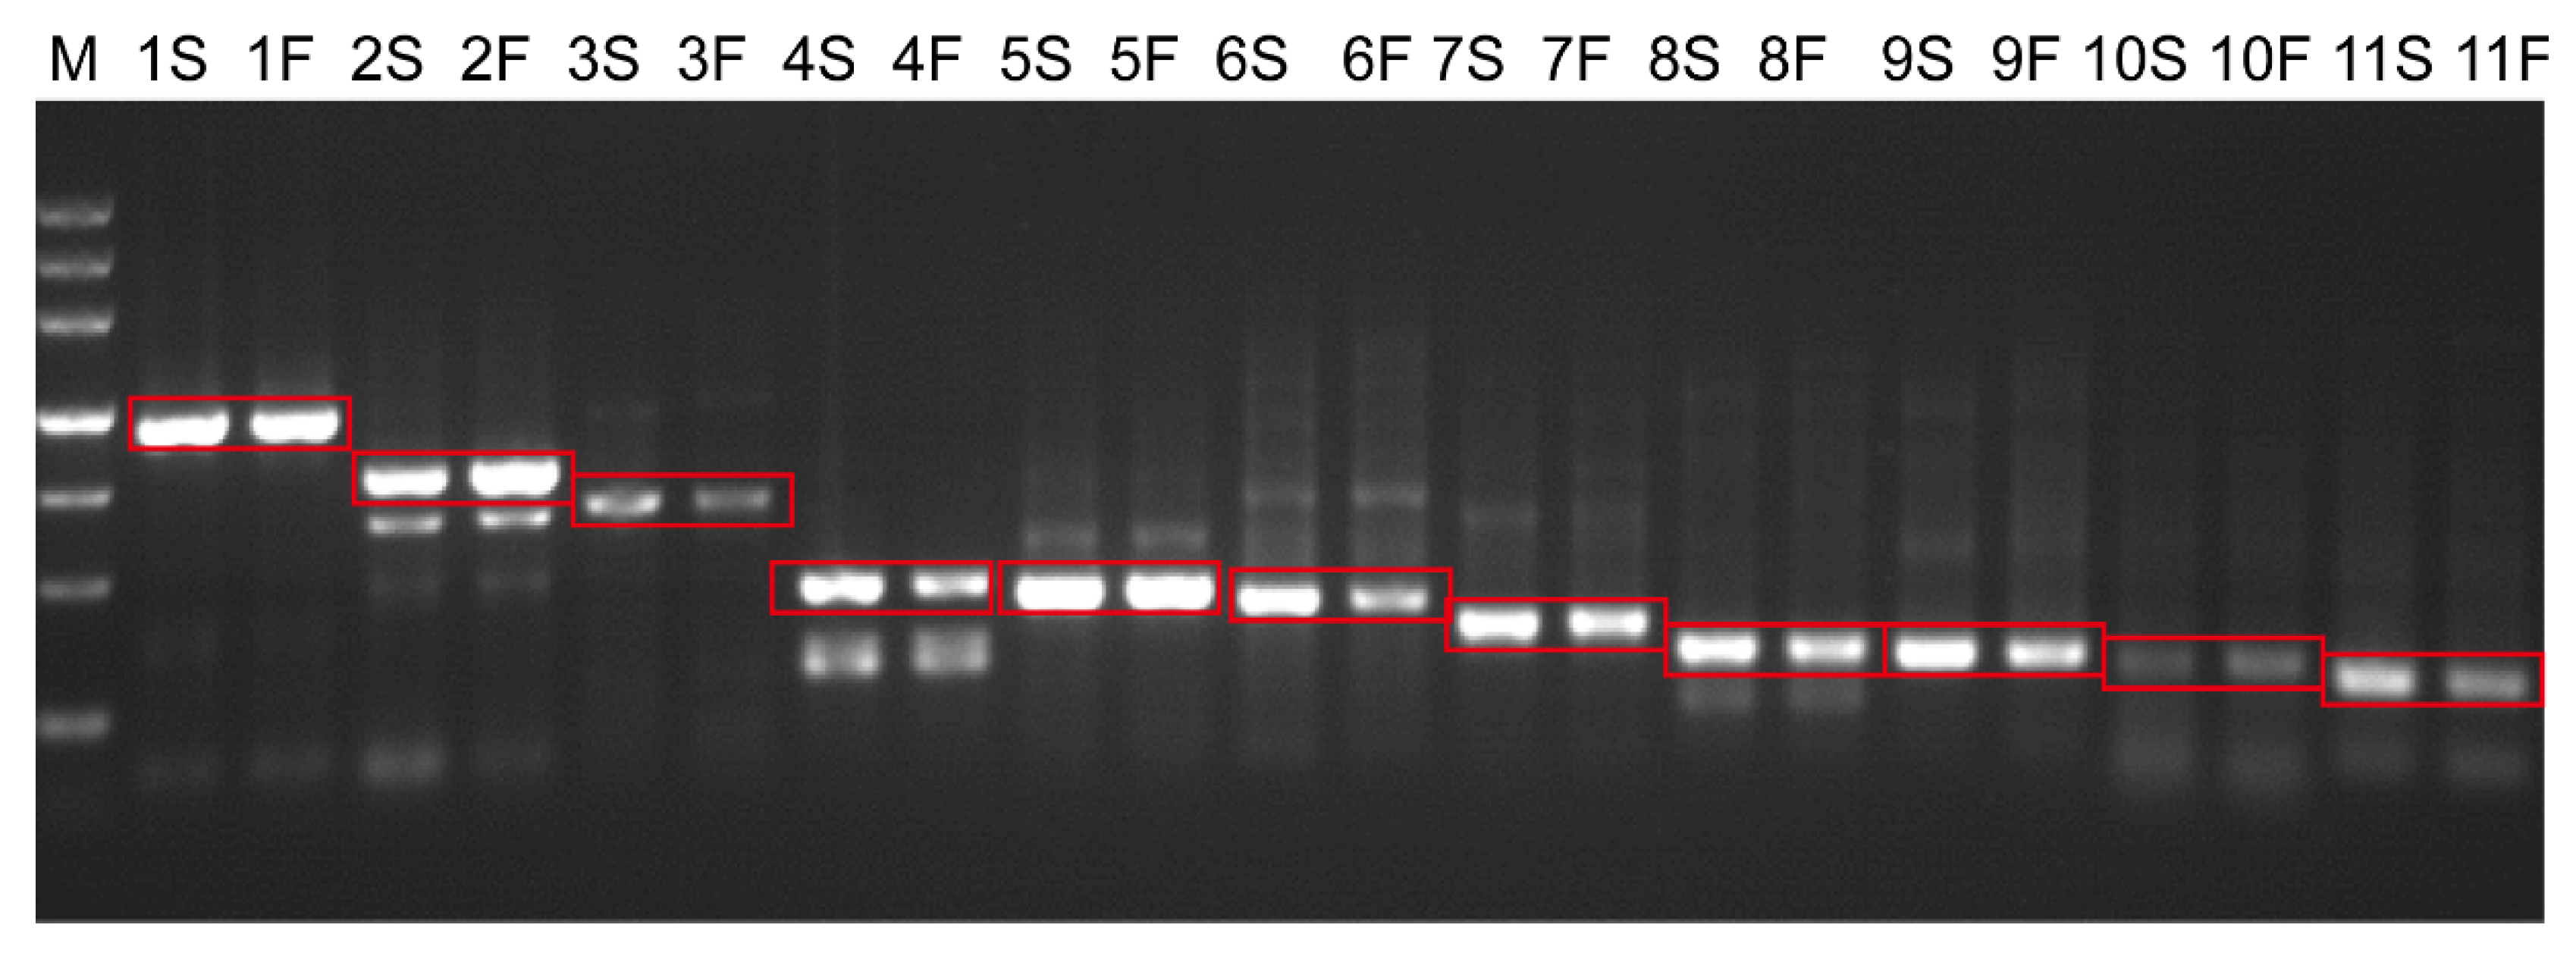
Transcription detection of 11 candidate orfs in AL18A and F1. M, molecular marker, from bottom to the upper, 200, 500, 800, 1200, 2000, 3000, 4500 bp, respectively; 1–11 represented 11 candidate orfs (orf376, orf279, orf232, orf139, orf129, orf124, orf103, orf85, orf83, orf74, and orf66) in AL18A and F1 (AL18A × 99AR144-1), S represents AL18A, and F represents F1 (AL18A × 99AR144-1).
Figure 5.
Transcription detection of 11 candidate orfs in AL18A and F1. M, molecular marker, from bottom to the upper, 200, 500, 800, 1200, 2000, 3000, 4500 bp, respectively; 1–11 represented 11 candidate orfs (orf376, orf279, orf232, orf139, orf129, orf124, orf103, orf85, orf83, orf74, and orf66) in AL18A and F1 (AL18A × 99AR144-1), S represents AL18A, and F represents F1 (AL18A × 99AR144-1).
Figure 6.
Phenotype of wild-type, orf256 and orf279 transgenic plants. (A) Transgenic plants; (B) siliques; (C) pollen germination rate, scale bar is 200 μm.
Figure 6.
Phenotype of wild-type, orf256 and orf279 transgenic plants. (A) Transgenic plants; (B) siliques; (C) pollen germination rate, scale bar is 200 μm.
Figure 7.
Transmembrane domain prediction of orf279 (A) and atp8 (B).
Figure 7.
Transmembrane domain prediction of orf279 (A) and atp8 (B).
Table 1.
Illumina PE sequencing data statistics of AL18A and AL18B.
Table 1.
Illumina PE sequencing data statistics of AL18A and AL18B.
| Sample ID | Insert Size (bp) | Raw Data (Mb) | Clean Data (Mb) | Reads Length (bp) | Clean Data GC (%) | Clean Data Q20 (%) | Clean Data Q30 (%) |
|---|
| AL18A | 450 | 4325 | 4116 | (150:150) | 48.15 | 97.75 | 93.22 |
| AL18B | 430 | 5806 | 5469 | (150:150) | 45.82 | 98.59 | 95.45 |
Table 2.
PacBio sequencing data statistics of AL18A and AL18B.
Table 2.
PacBio sequencing data statistics of AL18A and AL18B.
| Sample ID | Subreads Number | Subreads Bases (bp) | Subreads Largest Length (bp) | Subreads N50 Length (bp) | Subreads N90 Length (bp) | Subreads Average Length (bp) |
|---|
| AL18A | 10,307 | 82,044,853 | 21,253 | 9924 | 5003 | 7960 |
| AL18B | 44,802 | 134,889,953 | 21,302 | 7467 | 909 | 3011 |
Table 3.
Comparison of coding genes in different mitochondrial genomes.
Table 3.
Comparison of coding genes in different mitochondrial genomes.
| Functional Category | AL18A | Triticum timopheevii | AL18B | Functional Category | AL18A | Triticum timopheevii | AL18B |
|---|
| Complex V | atp1 | atp1 | atp1 | Complex I | nad1 | nad1 | nad1 |
| atp4 | atp4 | atp4 | nad2 | nad2 | nad2 |
| atp6 | atp6 | atp6-1 | nad3 | nad3 | nad3 |
| | | atp6-2 | nad4 | nad4 | nad4 |
| atp8 | atp8-1 | atp8-1 | nad4L | nad4L | nad4L |
| atp8-p | atp8-p | atp8-2 | nad5 | nad5 | nad5 |
| atp9 | atp9 | atp9 | nad6 | nad6 | nad6 |
| Cytochtome c biogenesis | ccmB | ccmB | ccmB | nad7 | nad7 | nad7 |
| ccmC-1 | ccmC-1 | ccmC | nad9 | nad9 | nad9 |
| ccmC-p | ccmC-p | | Ribosomal proteins | rpl16 | rpl16 | rpl16 |
| ccmFC | ccmFC | ccmFC | rpl16-p | rpl16-p | |
| ccmFN | ccmFN | ccmFN | rpl2-p | rpl2-p | |
| Complex III & IV | cobA | cobA | | rpl5 | rpl5 | rpl5 |
| cobB | cobB | cobB | rps1 | rps1 | rps1 |
| cox1 | cox1 | cox1 | rps12 | rps12 | rps12 |
| cox2 | cox2 | cox2 | rps13 | rps13 | rp13 |
| cox2a-p | cox2a-p | | rps19-p | rps19-p | rps19-p |
| cox3 | cox3 | cox3 | rps2 | rps2 | rps2 |
| others | matR | matR | matR | rps3 | rps3 | rps3 |
| mttB | mttB | mttB | rps4 | rps4 | rps4 |
| | | | | rps7 | rps7 | rps7 |
Table 4.
Comparison of noncoding genes in different mitochondrial genomes.
Table 4.
Comparison of noncoding genes in different mitochondrial genomes.
| Functional Category | AL18A | Triticum timopheevii | AL18B | Functional Category | AL18A | Triticum timopheevii | AL18B |
|---|
| rRNAs | rrn18-1 | rrn18-1 | rrn18-1 | tRNA
(amino acid) | Asn | Asn | Asn |
| rrn18-2 | rrn18-2 | rrn18-2 | Met | Met | Met |
| rrn18-3 | rrn18-3 | rrn18-3 | Trp | Trp | Trp |
| rrn26-1 | rrn26-1 | rrn26-1 | Met | Met | Met |
| rrn26-2 | rrn26-2 | rrn26-2 | Asp | Asp | Asp |
| | | rrn26-p | Met | Met | Met |
| rrn5-1 | rrn5-1 | rrn5-1 | Ser | Ser | Ser |
| rrn5-2 | rrn5-2 | rrn5-2 | Phe | Phe | Phe |
| rrn5-3 | rrn5-3 | rrn5-3 | Ser | Ser | Ser |
tRNAs
(amino acid) | Cys | Cys | Cys | Asp | Asp | Asp |
| Pro | Pro | Pro | Tyr | Tyr | Tyr |
| Gln | Gln | Gln | His | His | His |
| Lys | Lys | Lys | Met | | Met |
| Gln | Gln | Gln | | | Lys |
| Glu | Glu | Glu | | | Gln |
| Lys | Lys | Lys | Leu | Leu | |
| Met | Met | Met | Leu | Leu | |
| Pro | Pro | Pro | | Ala | |
| Ser | Ser | Ser | Ile | Ile | |
Table 5.
Description of eleven orfs containing transmembrane domains in AL18A.
Table 5.
Description of eleven orfs containing transmembrane domains in AL18A.
| Number | orf | Start | End | Direction | Size (bp) | Description |
|---|
| 1 | orf376 | 170,465 | 171,595 | + | 1131 | Ribosomal protein S2 |
| 2 | orf279 | 111,818 | 112,657 | − | 840 | ATP synthase subunit 8 |
| 3 | orf232 | 296,072 | 296,770 | − | 699 | |
| 4 | orf139 | 295,683 | 296,102 | − | 420 | Hypothetical protein |
| 5 | orf129 | 112,174 | 112,563 | − | 390 | orf143 (mitochondrion) |
| 6 | orf124 | 156,900 | 157,274 | − | 375 | |
| 7 | orf103 | 207,567 | 207,878 | + | 312 | |
| 8 | orf85 | 156,879 | 157,136 | + | 258 | |
| 9 | orf83 | 296,477 | 296,728 | + | 252 | |
| 10 | orf74 | 25,285 | 25,509 | + | 225 | |
| 11 | orf66 | 23,773 | 23,973 | + | 201 | |
Table 6.
Phenotypic study of transgenic Arabidopsis thaliana containing 315 bp mitochondrial signal peptide of Rf1b.
Table 6.
Phenotypic study of transgenic Arabidopsis thaliana containing 315 bp mitochondrial signal peptide of Rf1b.
| Candidate orfs | Number of T1 Plants | Seed Setting Rate of T1 Plant (%) |
|---|
| >90 | 51–90 | 11–50 | 1–10 |
|---|
| CK-Rf1b | 9 | 9 (100%) | | | |
| orf66 | 32 | 26 (81%) | | 4 (13%) | 2 (6%) |
| orf74 | 28 | 8 (29%) | 6 (21%) | 7 (25%) | 7 (25%) |
| orf85 | 26 | 24 (92%) | 1 (4%) | | 1 (4%) |
| orf103 | 51 | 39 (76%) | 2 (4%) | 5 (10%) | 5 (10%) |
| orf279 | 49 | 39 (80%) | 2 (4%) | 6 (12%) | 2 (4%) |
| orf129 | 38 | 37 (97%) | | | 1 (3%) |
| orf139 | 37 | 32 (87%) | | 2 (5%) | 3 (8%) |
| orf83 | 36 | 33 (92%) | | | 3 (8%) |
| orf232 | 14 | 14 (100%) | | | |
| orf124 | 16 | 13 (82%) | | 1 (6%) | 2 (12%) |
| orf376 | 67 | 64 (96%) | | 2 (3%) | 1 (1%) |
| orf256 | 57 | 55 (96%) | | | 2 (4%) |
Table 7.
Phenotypic study of transgenic Arabidopsis thaliana containing 105 bp mitochondrial signal peptide of Rf1b.
Table 7.
Phenotypic study of transgenic Arabidopsis thaliana containing 105 bp mitochondrial signal peptide of Rf1b.
| Candidate orfs | Number of T1 Plants | Seed Setting Rate of T1 Plant (%) |
|---|
| 1–50 | 51–90 | >90 |
|---|
| orf279 | 61 | 26 (43%) | 20 (33%) | 15 (24%) |
| orf74 | 36 | 1 (3%) | 2 (6%) | 33 (91%) |
| orf83 | 36 | | | 36 (100%) |
| orf256 | 57 | 3 (5%) | | 54 (95%) |
| orf376 | 53 | 3 (6%) | 3 (6%) | 47 (88%) |
| orf139 | 28 | | | 28 (100%) |
| orf124 | 36 | | | 36 (100%) |
| orf66 | 53 | 1 (2%) | 2 (4%) | 50 (94%) |
| orf103 | 60 | 1 (2%) | 1 (2%) | 58 (96%) |
| orf232 | 23 | 1 (4%) | 2 (9%) | 20 (87%) |
| orf129 | 19 | 1 (5%) | | 18 (95%) |
| orf85 | 32 | 2 (6%) | | 30 (94%) |
Table 8.
Pollen germination rate of transgenic plants.
Table 8.
Pollen germination rate of transgenic plants.
| Candidate orfs | Flower Number of T1 Plants | Pollen Germination Rate (%) |
|---|
| <30 | 30–60 | >60 |
|---|
| orf279 | 122 | 50 (41%) | 38 (31%) | 34 (28%) |
| orf74 | 72 | 2 (3%) | 4 (6%) | 66 (91%) |
| orf83 | 72 | | 2 (3%) | 70 (97%) |
| orf256 | 114 | 6 (5%) | 2 (2%) | 106 (93%) |


 ,
, 


