
The Alterations of Mitochondrial Function during NAFLD Progression—An Independent Effect of Mitochondrial ROS Production

 , ,
, ,  , , ,
, , , 
Abstract
:1. Introduction
2. Results
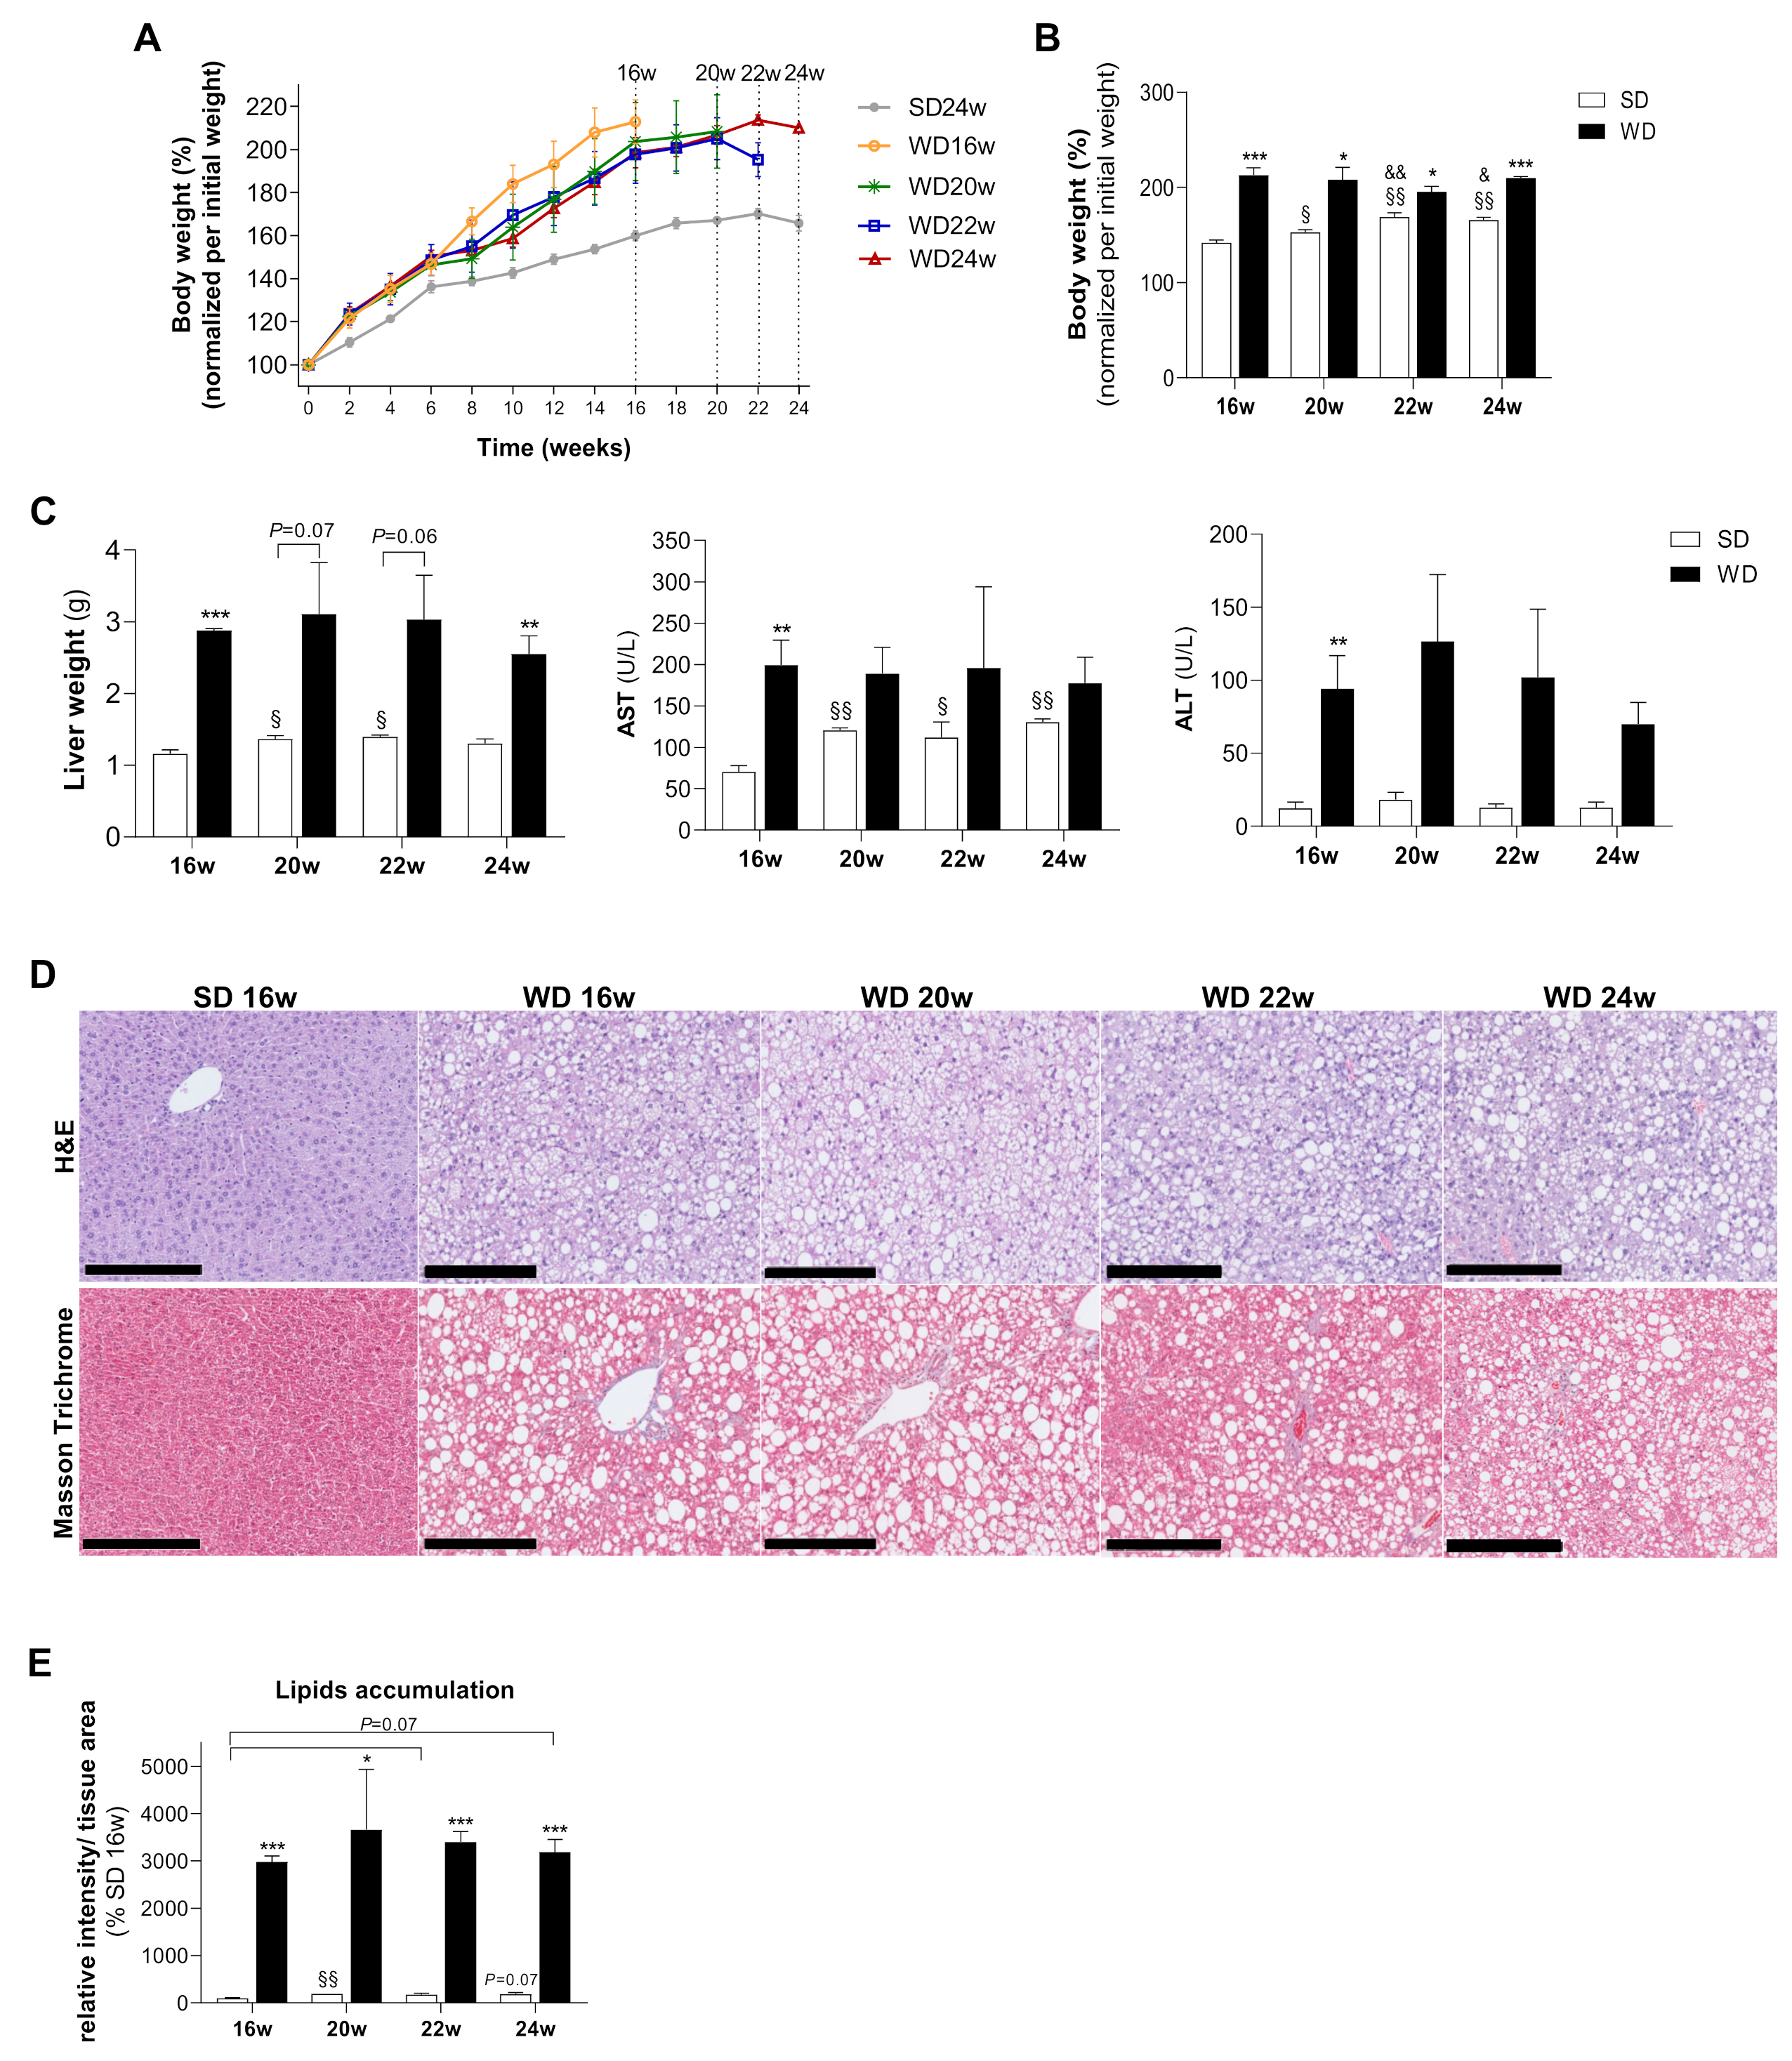
2.1. WD Induces Animal Body Weight Gain, Fatty Liver Accumulation with Signs of Liver Damage, Ballooning, and Fibrosis
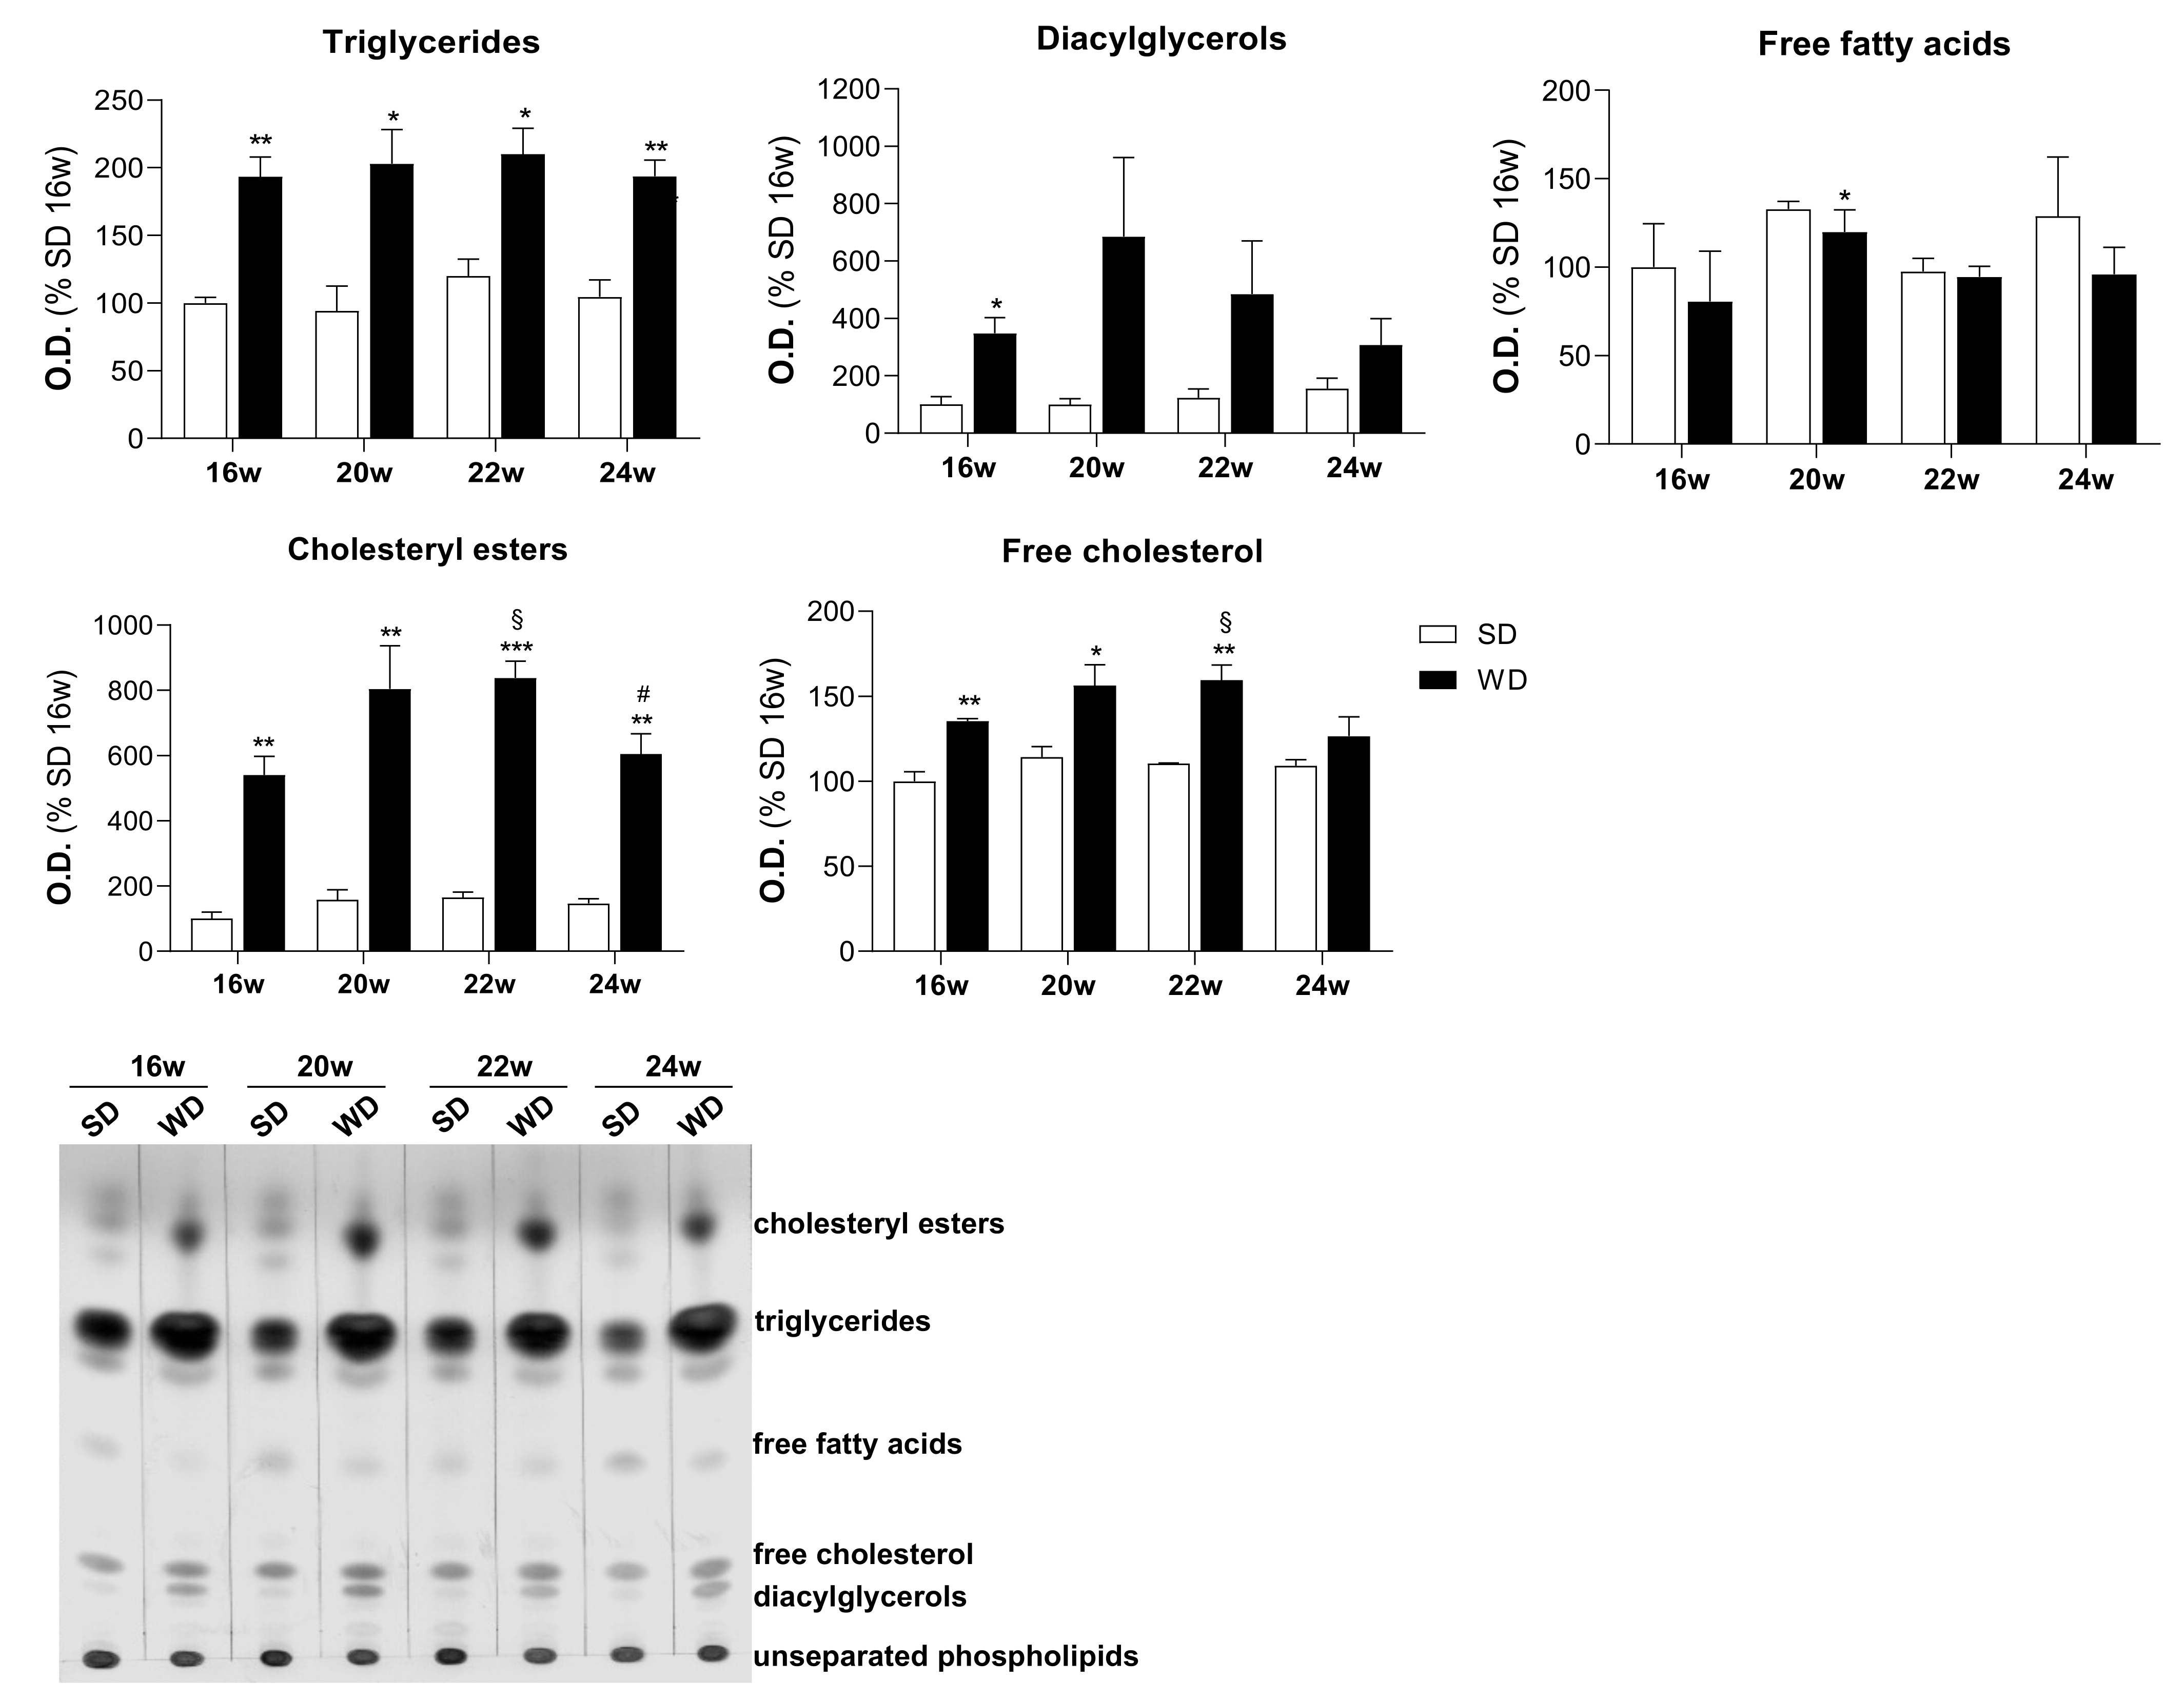
2.2. Increased Accumulation of Triglycerides and Cholesteryl Esters in Hepatocytes Triggered by WD
2.3. Progressive Decline of Mitochondrial Function in the WD-Induced Mouse Model of NAFLD
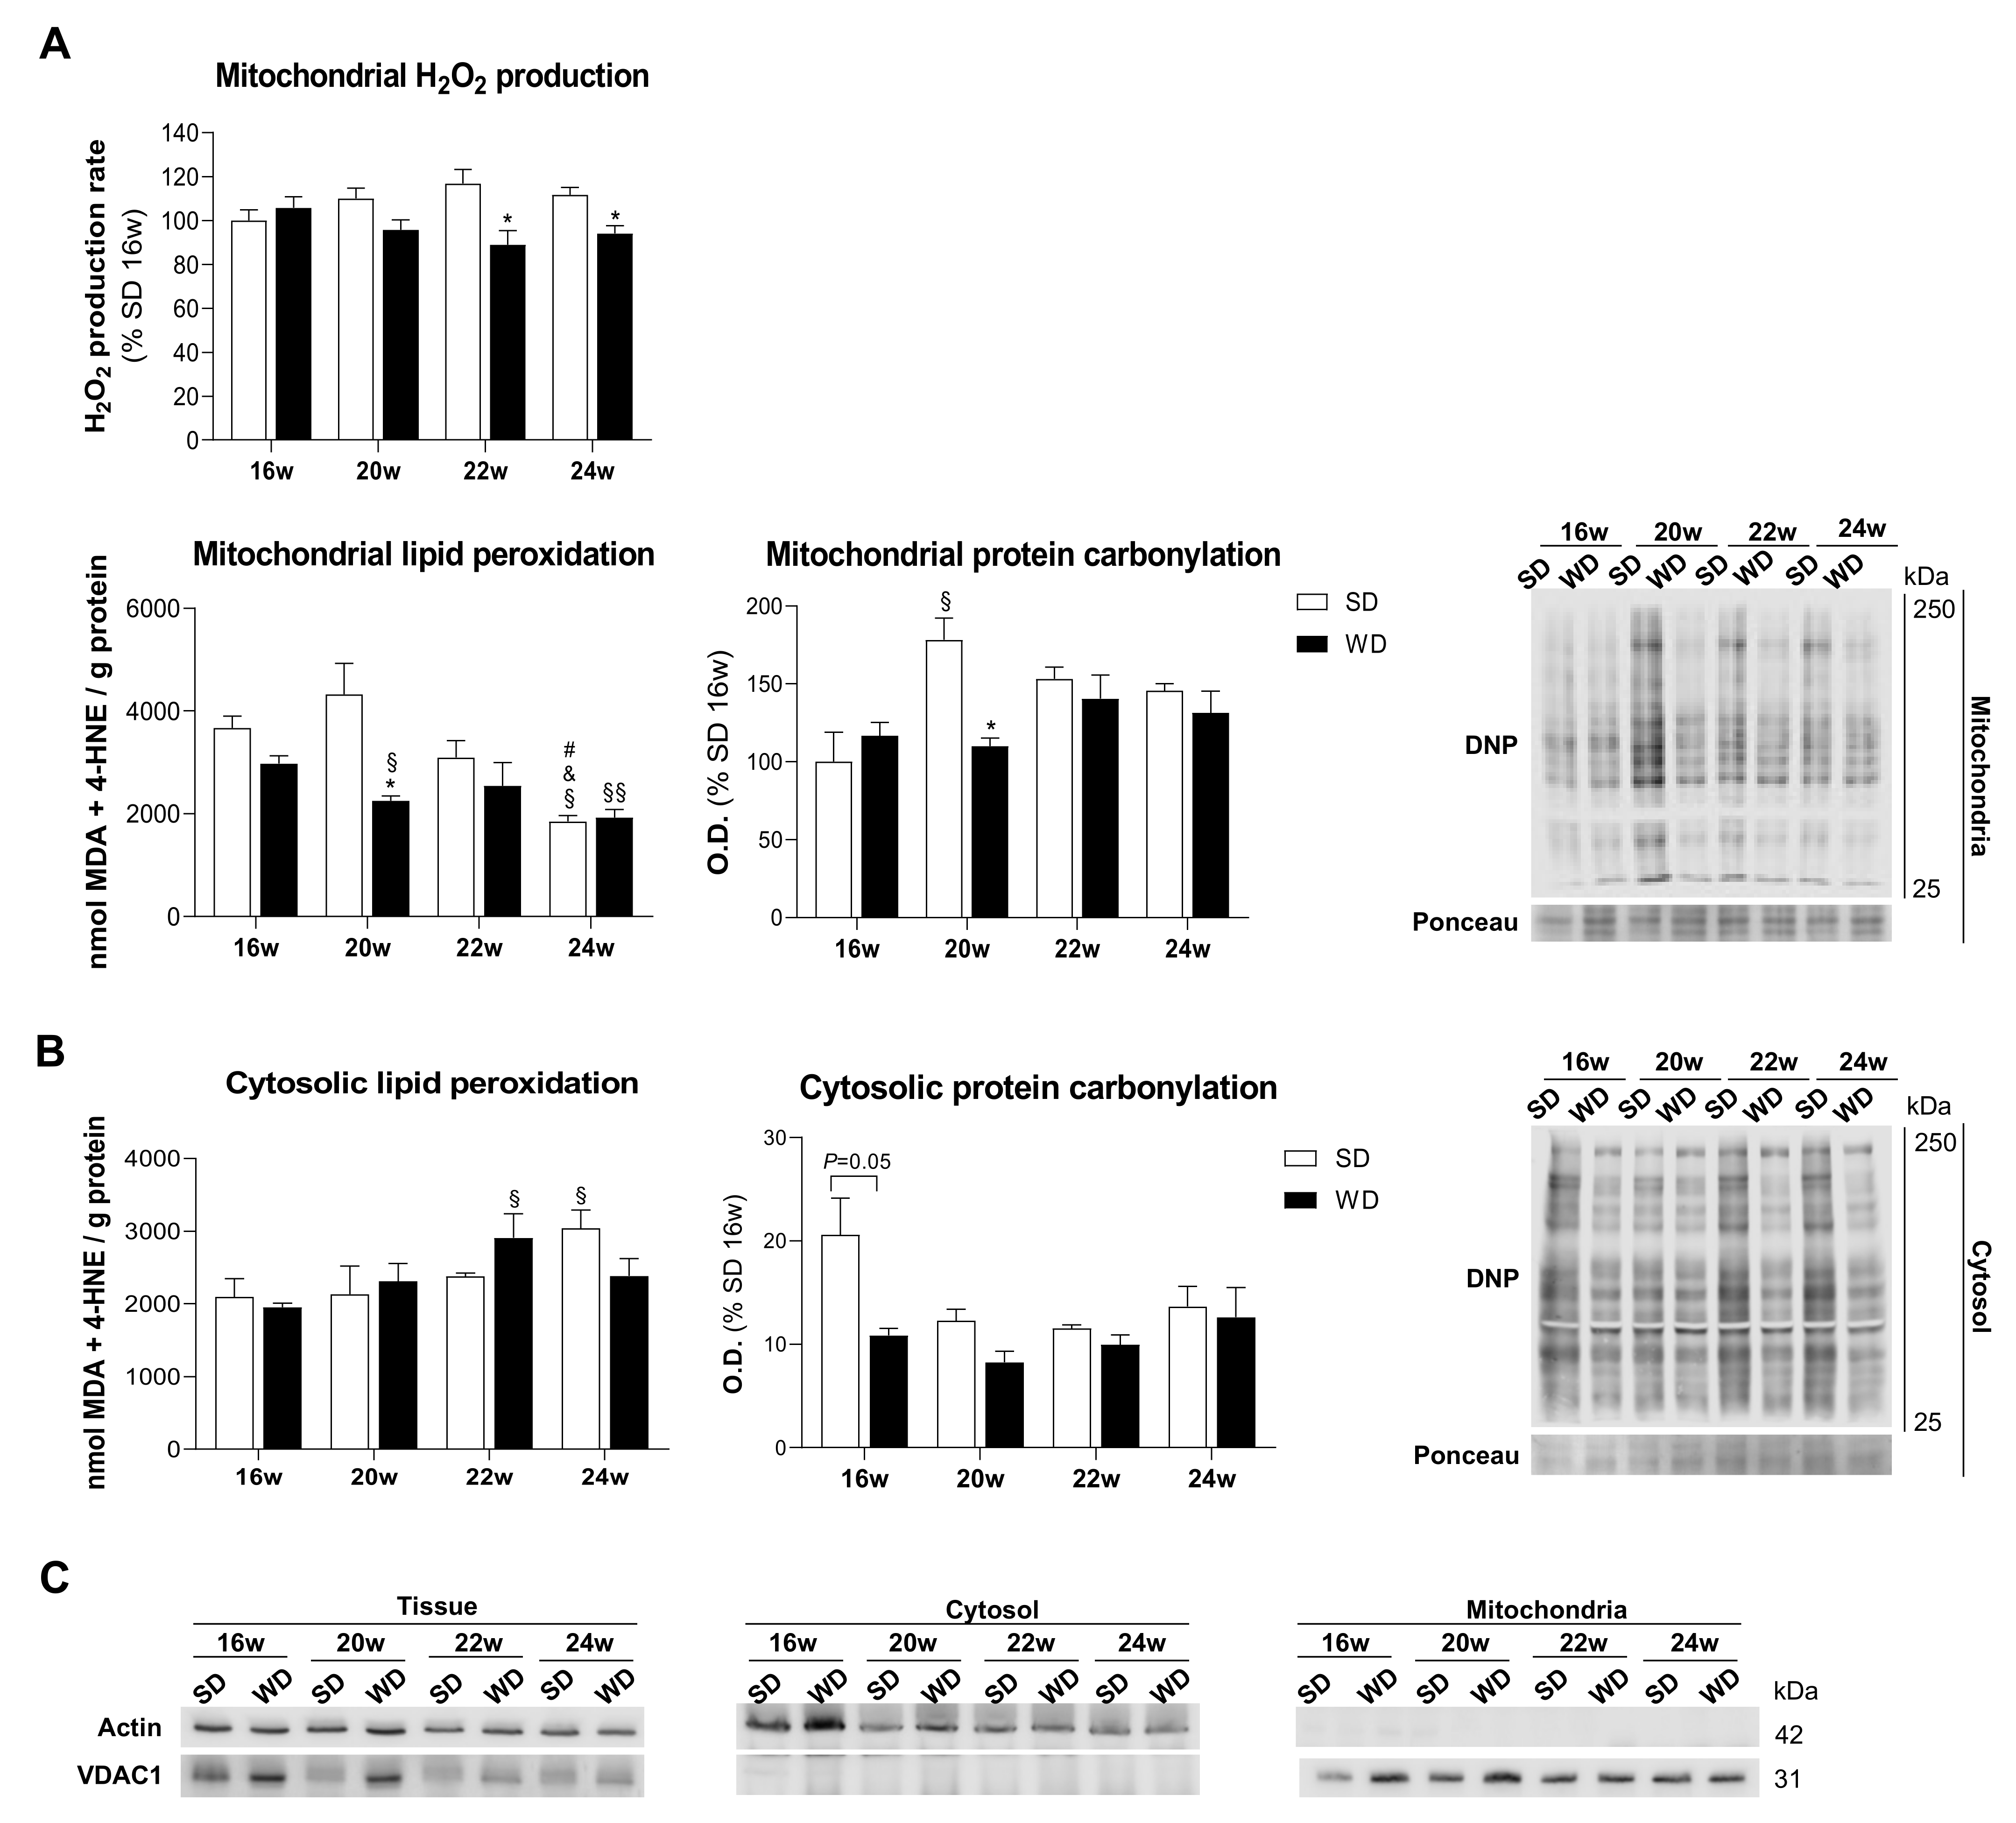
2.4. Declined Mitochondrial ROS Generation Is Associated with NAFLD Progression
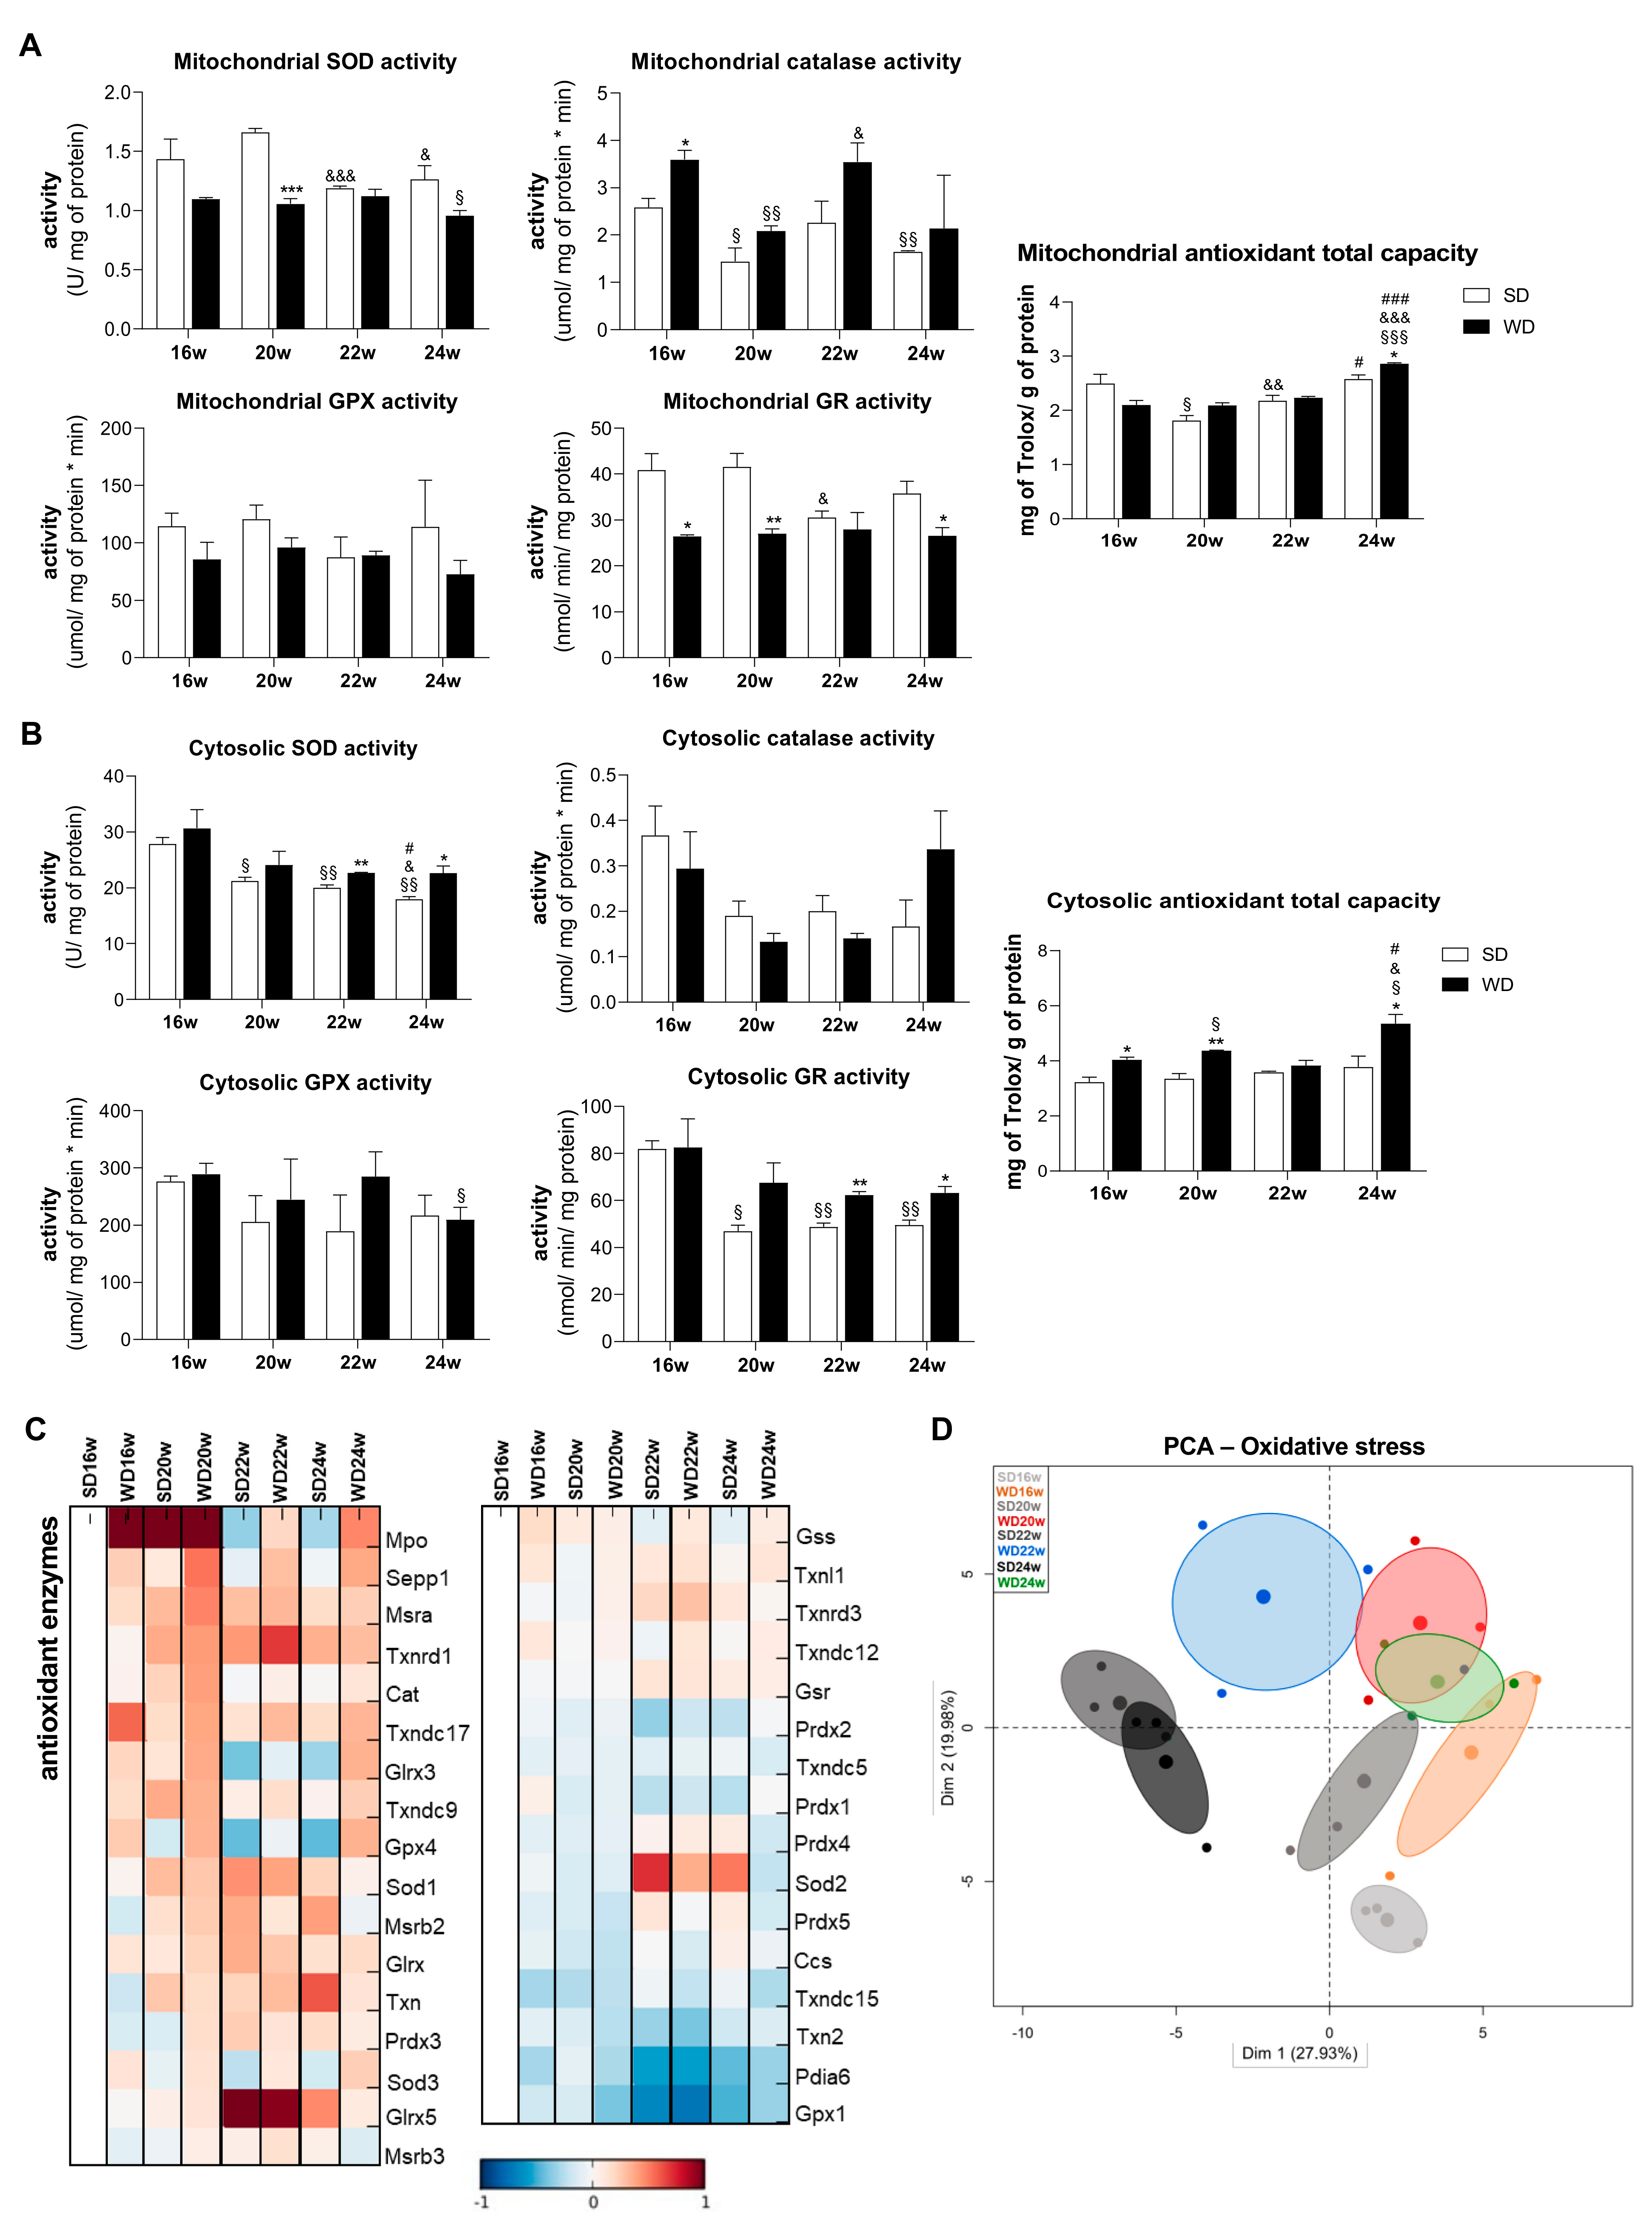
2.5. WD Provokes Hepatocyte Alterations in Both Mitochondrial and Non-Mitochondrial Antioxidant Defenses
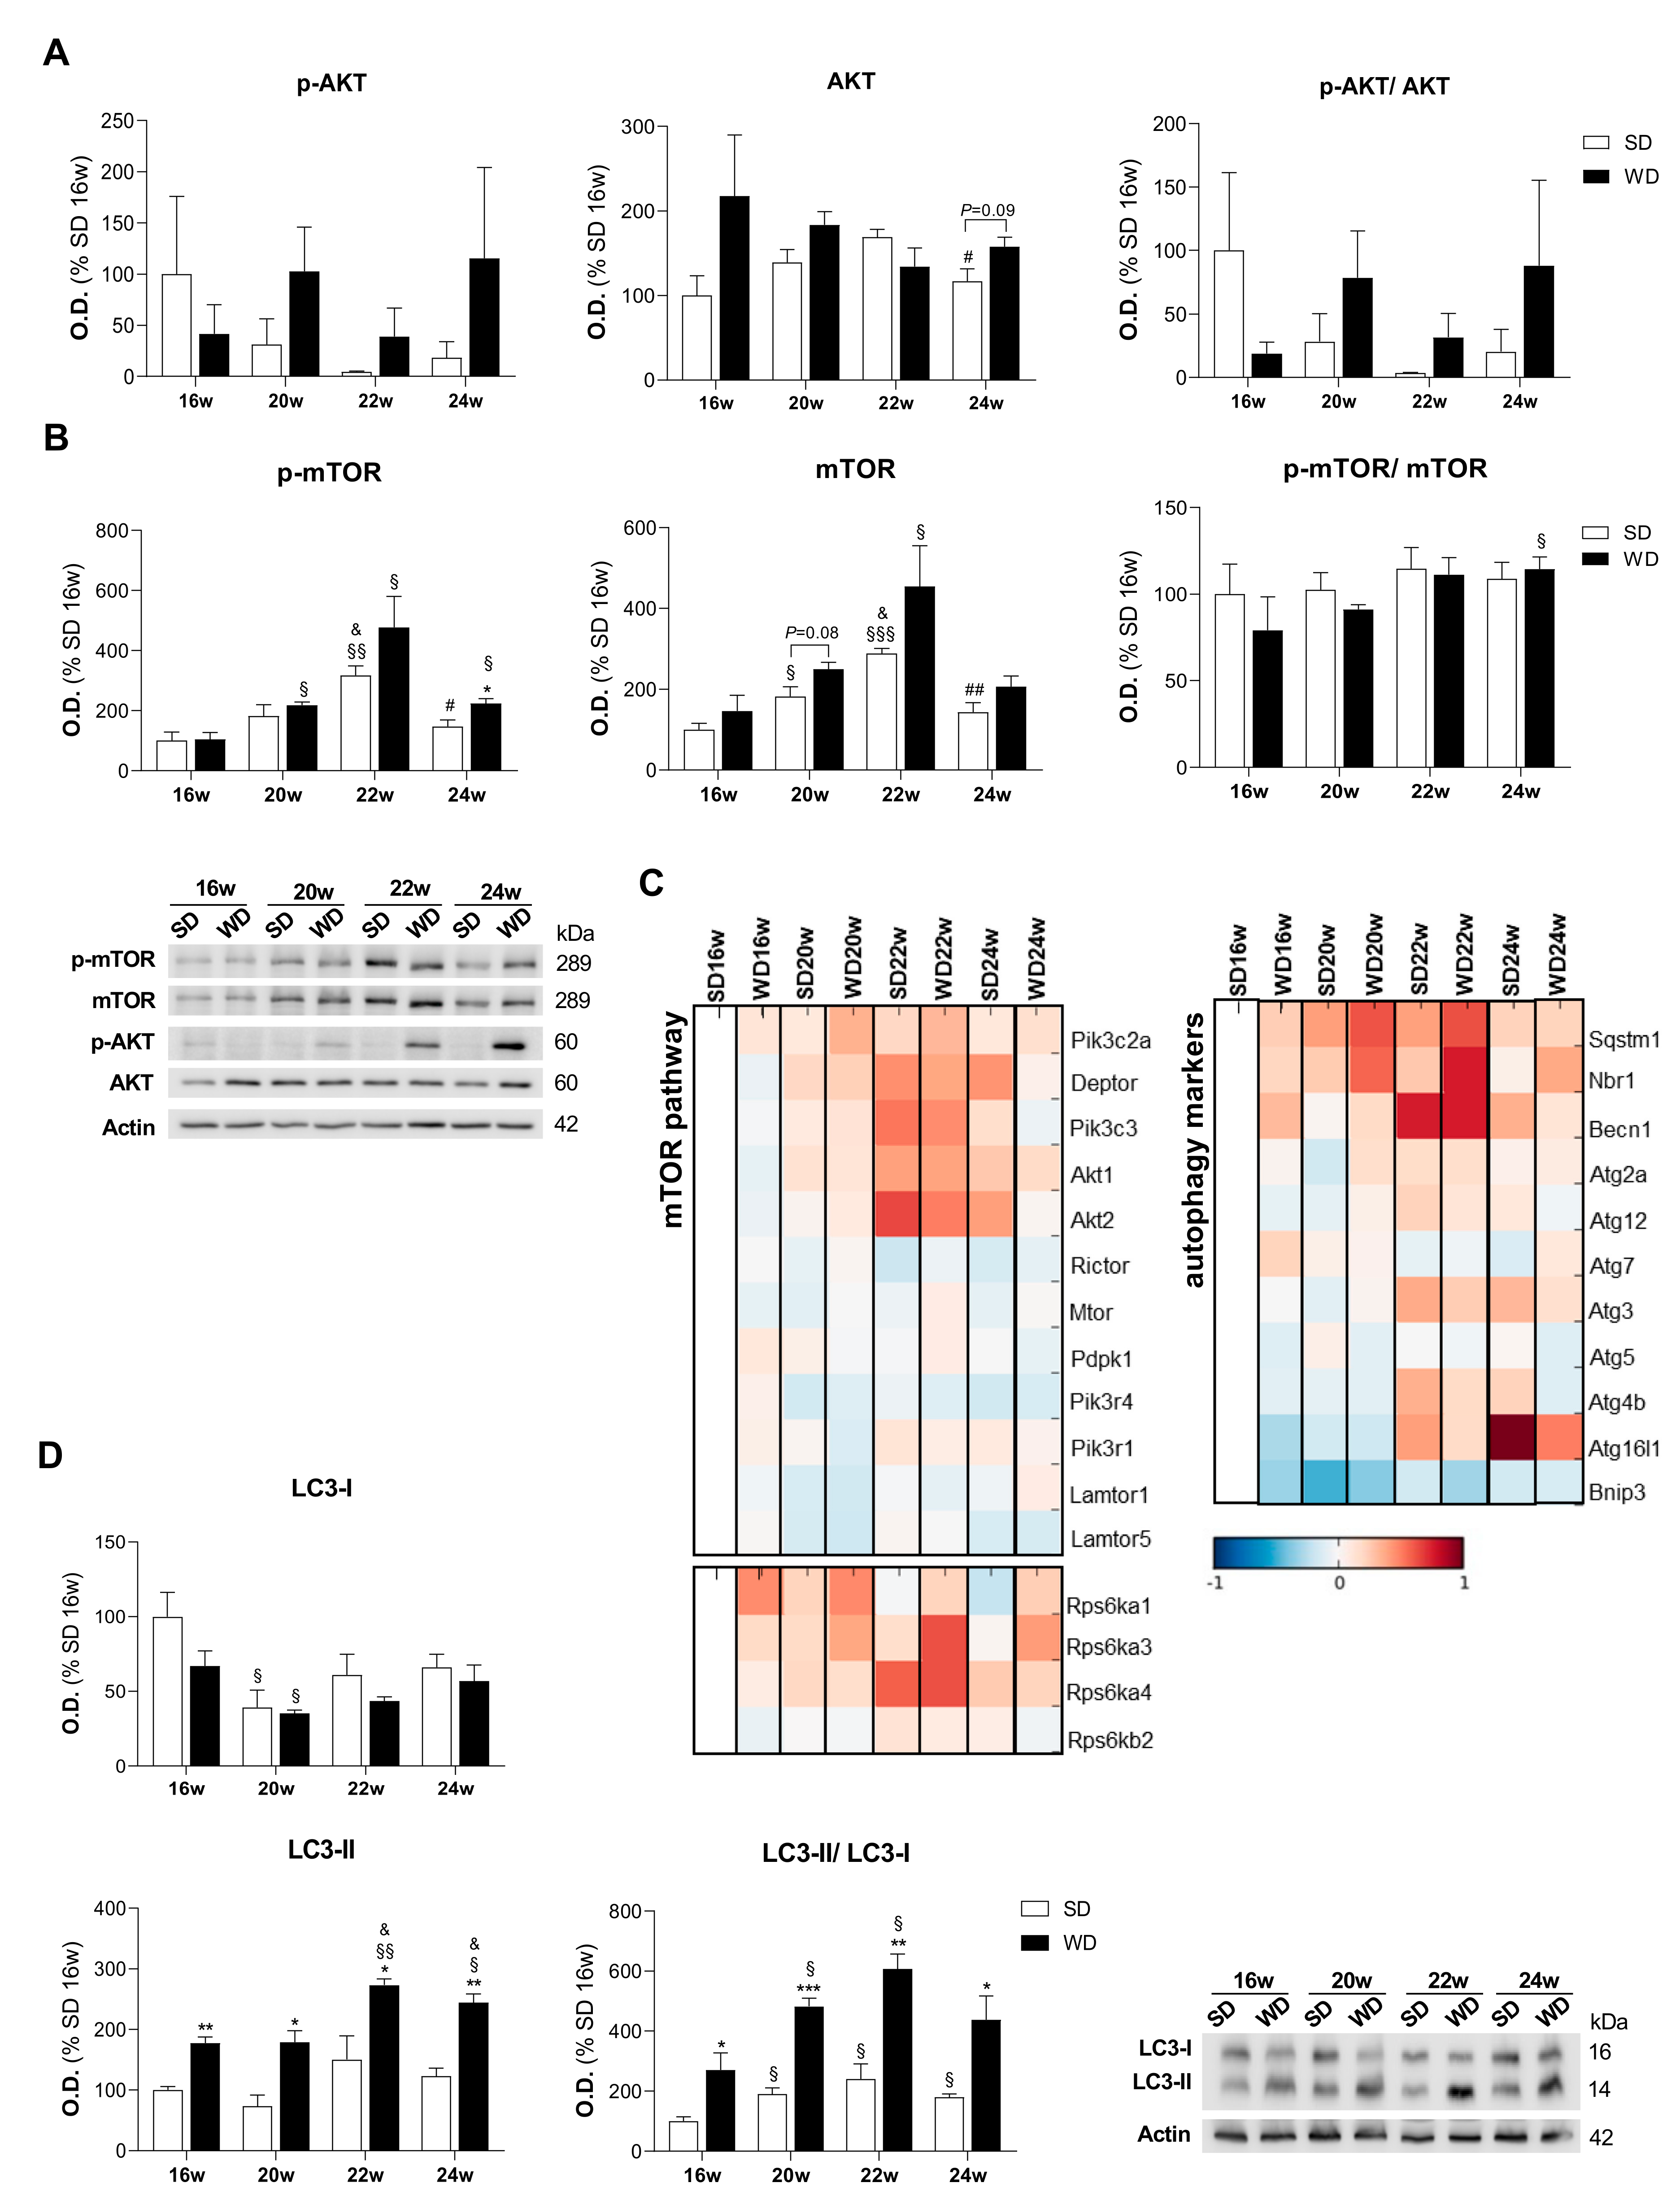
2.6. WD Increases the Accumulation of Protein-Related Markers of Autophagy: LC3, Sequestosome-1, and Autophagy Cargo-Receptor
3. Discussion
4. Materials and Methods
4.1. Materials
4.2. Ethics
4.3. Animals
4.4. Plasma Analysis
4.5. Histology
- (a)
- For H&E, Masson trichrome and/or immunohistochemistry, paraffin blocks were cut, and liver slices were prepared with 3 µm thickness on SuperFrostPlus microscope slides (Gerhard Menzel GMBH, Braunschweig, Germany). Then, liver slices were deparaffinized and rehydrated before the staining with H&E and Masson Trichrome, which was done according to the following Szymanska-Debinska protocol [46]. In the case of Masson Trichrome, staining included Bouin’s solution (HT10132, Sigma-Aldrich), Weigert’s iron hematoxylin solution (HT1079-1SET, Sigma-Aldrich), and Masson Trichrome Stain kit (HT15-1KT, Sigma-Aldrich).
- (b)
- For immunohistochemistry of CD3, CD45, and CD68, paraffin-embedded liver slices were used for antigen retrieval by applying low pH Target Retrieval Solution (DAKO, Glostrup, Denmark) at 99.5 °C for 30 min. Next, liver slices were incubated with: CD3 (A0452, Agilent, Santa Clara, CA, USA), CD45 (GTX65913 GeneTex, Alton Pkwy Irvine, CA, USA), and CD68 (GTX37743, GeneTex, Alton Pkwy Irvine, CA, USA).
- (c)
- Histological and immunohistochemical stainings were scanned using a Hamamatsu NanoZoomer 2.0 RS scanner (Hamamatsu Photonics, Hamamatsu, Japan) with an original magnification of 40×.
- (d)
- NAFLD activity (NAS) score was determined based on H&E and Masson Trichrome stainings, in which were evaluated four criteria: steatosis (grade 0–3), hepatocellular ballooning (grade 0–2), lobular inflammation (grade 0–3), and fibrosis (S 0–4) [47]. This evaluation was performed in a blind way by the pathologist from The Children’s Memorial Health Institute’s pathologist.
4.6. Mitochondria Isolation
4.7. Evaluation of Oxygen Consumption Rates
4.8. Assessment of MPTP Opening
4.9. Measurement of Mitochondrial ROS Production
4.10. Lipid Analysis
- (a)
- Extraction of lipids: Lipids were extracted from frozen liver (1.8 mg) and frozen liver isolated mitochondria (500 µg) according to the method described by Bligh and Dyer [49]. Samples were homogenized in 2 chloroform: 1 methanol mixture containing 0.01% butylated hydroxytoluene. Then, homogenized samples were mixed with distilled water and vortexed before being centrifuged at 3000 rpm for 10 min at 4 °C. The resulting two-phase system was separated, and the bottom layer constituting the organic lipidic phase was collected and stored at −20 °C.
- (b)
- Separation of mitochondrial phospholipids: Stored liver mitochondrial organic samples were evaporated under a N2 flow at 37 °C. Next, evaporated samples were resuspended in 2 chloroform: 1 methanol mixture and loaded into a thin-layer chromatography (TLC) silica gel 60 plate (Merck, Darmstadt, Germany) that was previously pre-activated in the oven at 110 °C for 90 min. The different phospholipids species were separated in a TLC tank containing the mobile solvent composed by chloroform/methanol/acetic acid/water (50/37.5/3.5/2 (v/v/v/v)) for 2 h. After TLC, the silica plate was soaked in 10% cupric sulfate and 8% phosphoric acid and put again in the oven at 140 °C for 20 min to visualize phospholipids bands. Bands were quantified using Image Studio Lite (version 5.2) (LI-COR Biosciences, Lincoln, NE, USA).
- (c)
- Separation of neutral lipids: Stored liver organic samples were evaporated under a N2 flow at 37 °C. Then, evaporated samples were resuspended in 2 chloroform: 1 methanol mixture and loaded into a TLC silica gel 60 plate. Neutral lipids species were separated in a TLC tank containing the mixture heptane/isopropyl ether/glacial acetic acid (60/40/3 (v/v/v)) for 50 min. After TLC running, the silica plate was soaked in a 10% cupric sulfate and 8% phosphoric acid solution, and neutral lipids bands were visualized after 20 min at 140 °C. Bands were quantified using Image Studio Lite (version 5.2).
4.11. Assessment of Lipid Peroxidation
4.12. Assessment of Protein Carbonylation
4.13. Total Antioxidant Capacity
4.14. Assessment of Antioxidant Enzymes Activities
4.15. Western Blotting
4.16. Proteomic Analysis
- (a)
- Quantitative MS analysis. An ice-cold lysis buffer composed by 50 mM Tris, pH 8.5, 8 M Urea, and 1% SDS supplemented with protease and phosphatase inhibitors (Roche, Basel, Switzerland) was mixed with the liver frozen samples. Protein quantification was assessed using a micro-BCA assay (Pierce Biotechnology Inc., Rockford, IL, USA), and a final concentration of 2–8 mg/mL of liver lysates was used for further analyses. After reduction and alkylation of proteins, proteins were precipitated with methanol (4:1; solvent:protein), chloroform (1:1), and distilled water (3:1). After vortex, the mixture was centrifuged for phase separation, and the aqueous phase containing proteins was collected. Protein extract was washed with ice-cold methanol and dried out. Then, protein extracts were resuspended in 50 mM Tris, pH 8.5, and 4 M Urea solution following its first digestion with LysC (1:50; enzyme:protein) for 12 h. Digested proteins were mixed with 50 mM Tris, pH 8.5, 1 M Urea before their second digestion with trypsin (1:100) for 8 h. The resulting peptides were desalted in a C18 solid-phase extraction cartridge and dissolved in 200 mM EPPS, pH 8.0. At this step, peptides were quantified using the micro-BCA assay (Pierce Biotechnology Inc.). Peptides from each condition were organized in 10-plex samples and labelled with tandem mass tag (TMT) reagent (Pierce Biotechnology Inc.) (1:4; peptide:reagent) for 2 h. The reaction of TMT with tyrosine residues was reconstituted by adding 5% hydroxyl amine for 15 min. Reactions were quenched with 0.5% TFA and samples prepared in 1:1:1:1:1:1:1:1:1:1 ratio for 10-plex samples experiments. Then, samples were desalted and fractionated offline into 24 fractions [54].
- (b)
- LC-MS/MS. Twelve out of twenty-four peptide samples were studied by LC-MS3 data collection strategy [55] on an Orbitrap Fusion mass spectrometer (Thermo Fisher Scientific Inc.) with a Proxeon Easy nLC 1000 dedicated to peptide fractions handling and separation. Peptides (equivalent to 5 µg) were mixed with 5% formic acid and 5% acetonitrile (ACN) solution and loaded into a 100 µm diameter of silica microcapillary that was inserted in a C18 reversed-phase resin (GP118 resin, 1.8 μm, 120 Å, Sepax Technologies Inc., Newark, DE, USA). Peptides factions were analyzed for 2 h in a linear gradient of 3–25% of solvent mixture B (100% ACN and 0.125% formic acid) with solvent mixture A (3% ACN and 0.125% formic acid) at a flow rate of 600 nL/min. Orbitrap Fusion protocol included: MS1 spectrum (resolution of 120,000; 400–1400 m/z scan range; AGC target of 2 × 10⁵; maximum injection time of 100 ms; dynamic exclusion of 75 sec); MS2 (quadrupole isolation set at 0.5 Da and ion trap analysis; AGC, 4 × 10³; NCE, 35; maximum injection time, 150 ms) for 2 sec; and MS3 consisting of the top ten precursors of each MS2 scan, which were fragmented by HCD prior to analysis (NCE, 55; AGC, 5 × 10⁴; maximum injection time, 150 ms; isolation window, 2.5 Da; resolution, 60,000).
- (c)
- LC-MS3 analysis. Distinct software was used to evaluate the raw data and control protein false discovery rates and to proceed to the protein quantification of assembled proteins and peptides. Raw data were compared with an UniProt mouse database (2014) (including forward and reverse sequences), and distinct criteria were applied for this analysis: tryptic with two missed cleavages, a precursor mass tolerance of 50 ppm, fragment ion mass tolerance of 1.0 Da, static alkylation of cysteine (57.02146 Da), static TMT labelling of lysine residues and N-terminal of peptides (229.162932 Da), and variable oxidation of methionine (15.99491 Da). TMT tag intensity was quantified using a 0.003 Da range from the theoretical m/z for each reporter tag in the MS3 scan. Poor quality MS3 matches were not considered for the final quantification (<200 summed signal-to-noise across 10 channels, <100 for 6-plex, and <0.5 precursor isolation specificity).
- (d)
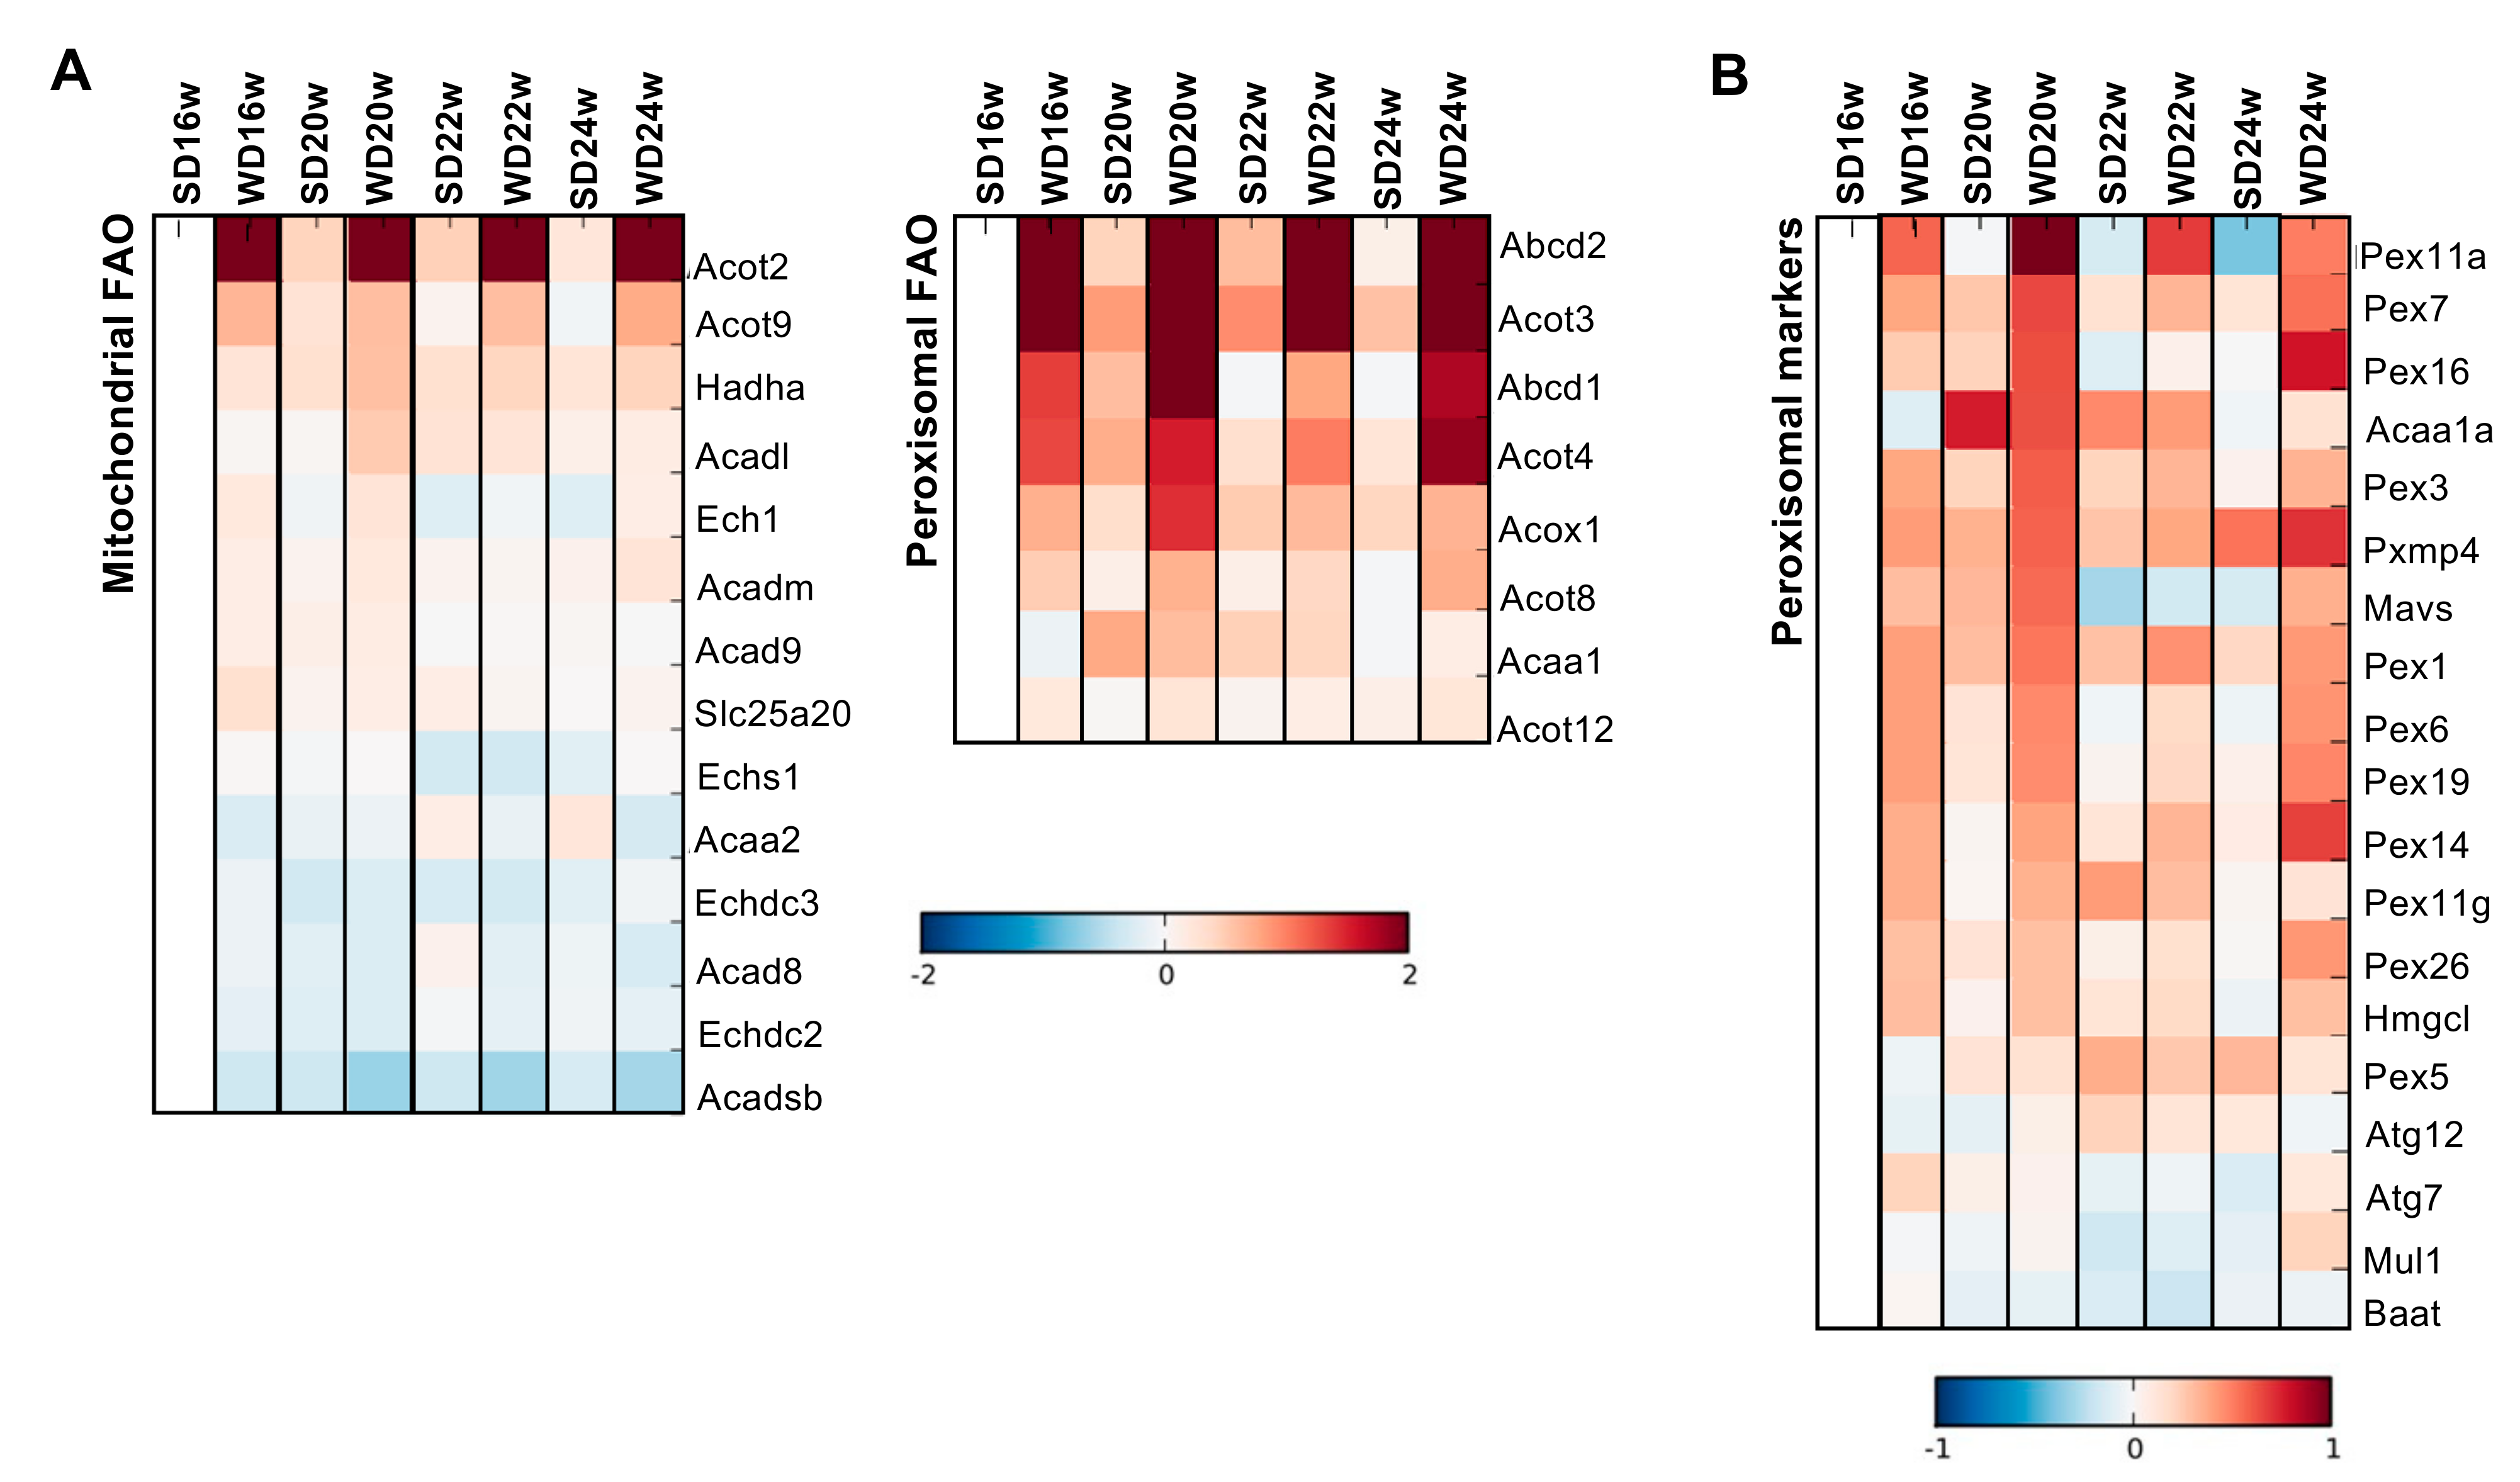
- MS data analysis. Protein data (ProteinQuant) for 5930 different protein IDs (SwissProt/UniProt ID) were obtained from the analysis of different plexes (groups of 10 samples in each plex), with the same reference sample per plex. Protein quantification values were normalized by calculating the ratio between the quantification value of the protein in each sample and the quantification value (non-zero) of the protein in the reference sample of the plex. If the quantification value of the protein in the reference sample was zero or null, the final quantification value of the protein in every sample of the plex turned to be null. After excluding zero and null values, a total of 4573 rows corresponding to distinct protein IDs were considered and clustered with the number of significant clusters established by gap statistics. Data (mean between each group and the control group) were integrated in KeggAnim program for visualization of cellular pathways [56], and protein levels were represented as heatmaps by Taverna Workbench Bioinformatics (version 2.5.0).
4.17. Statistical Analysis
Supplementary Materials
Author Contributions
Funding
Institutional Review Board Statement
Informed Consent Statement
Data Availability Statement
Acknowledgments
Conflicts of Interest
References
- Younossi, Z.; Anstee, Q.M.; Marietti, M.; Hardy, T.; Henry, L.; Eslam, M.; George, J.; Bugianesi, E. Global burden of NAFLD and NASH: Trends, predictions, risk factors and prevention. Nat. Rev. Gastroenterol. Hepatol. 2018, 15, 11–20. [Google Scholar] [CrossRef] [PubMed]
- McPherson, S.; Hardy, T.; Henderson, E.; Burt, A.D.; Day, C.P.; Anstee, Q.M. Evidence of NAFLD progression from steatosis to fibrosing-steatohepatitis using paired biopsies: Implications for prognosis and clinical management. J. Hepatol. 2015, 62, 1148–1155. [Google Scholar] [CrossRef] [PubMed]
- Yin, X.; Zheng, F.; Pan, Q.; Zhang, S.; Yu, D.; Xu, Z.; Li, H. Glucose fluctuation increased hepatocyte apoptosis under lipotoxicity and the involvement of mitochondrial permeability transition opening. J. Mol. Endocrinol. 2015, 55, 169–181. [Google Scholar] [CrossRef] [PubMed] [Green Version]
- Friedman, S.L.; Neuschwander-Tetri, B.A.; Rinella, M.; Sanyal, A.J. Mechanisms of NAFLD development and therapeutic strategies. Nat. Med. 2018, 24, 908–922. [Google Scholar] [CrossRef]
- Begriche, K.; Massart, J.; Robin, M.A.; Bonnet, F.; Fromenty, B. Mitochondrial adaptations and dysfunctions in nonalcoholic fatty liver disease. Hepatology 2013, 58, 1497–1507. [Google Scholar] [CrossRef]
- Koliaki, C.; Szendroedi, J.; Kaul, K.; Jelenik, T.; Nowotny, P.; Jankowiak, F.; Herder, C.; Carstensen, M.; Krausch, M.; Knoefel, W.T.; et al. Adaptation of hepatic mitochondrial function in humans with non-alcoholic fatty liver is lost in steatohepatitis. Cell Metab. 2015, 21, 739–746. [Google Scholar] [CrossRef] [Green Version]
- Eccleston, H.B.; Andringa, K.K.; Betancourt, A.M.; King, A.L.; Mantena, S.K.; Swain, T.M.; Tinsley, H.N.; Nolte, R.N.; Nagy, T.R.; Abrams, G.A.; et al. Chronic exposure to a high-fat diet induces hepatic steatosis, impairs nitric oxide bioavailability, and modifies the mitochondrial proteome in mice. Antioxid. Redox Signal. 2011, 15, 447–459. [Google Scholar] [CrossRef] [Green Version]
- Boland, M.L.; Oldham, S.; Boland, B.B.; Will, S.; Lapointe, J.M.; Guionaud, S.; Rhodes, C.J.; Trevaskis, J.L. Nonalcoholic steatohepatitis severity is defined by a failure in compensatory antioxidant capacity in the setting of mitochondrial dysfunction. World J. Gastroenterol. 2018, 24, 1748–1765. [Google Scholar] [CrossRef]
- Mendez, L.; Pazos, M.; Molinar-Toribio, E.; Sanchez-Martos, V.; Gallardo, J.M.; Rosa Nogues, M.; Torres, J.L.; Medina, I. Protein carbonylation associated to high-fat, high-sucrose diet and its metabolic effects. J. Nutr. Biochem. 2014, 25, 1243–1253. [Google Scholar] [CrossRef] [Green Version]
- Garcia-Berumen, C.I.; Ortiz-Avila, O.; Vargas-Vargas, M.A.; Del Rosario-Tamayo, B.A.; Guajardo-Lopez, C.; Saavedra-Molina, A.; Rodriguez-Orozco, A.R.; Cortes-Rojo, C. The severity of rat liver injury by fructose and high fat depends on the degree of respiratory dysfunction and oxidative stress induced in mitochondria. Lipids Health Dis. 2019, 18, 78. [Google Scholar] [CrossRef] [Green Version]
- Serviddio, G.; Bellanti, F.; Tamborra, R.; Rollo, T.; Capitanio, N.; Romano, A.D.; Sastre, J.; Vendemiale, G.; Altomare, E. Uncoupling protein-2 (UCP2) induces mitochondrial proton leak and increases susceptibility of non-alcoholic steatohepatitis (NASH) liver to ischaemia-reperfusion injury. Gut 2008, 57, 957–965. [Google Scholar] [CrossRef]
- Rector, R.S.; Thyfault, J.P.; Uptergrove, G.M.; Morris, E.M.; Naples, S.P.; Borengasser, S.J.; Mikus, C.R.; Laye, M.J.; Laughlin, M.H.; Booth, F.W.; et al. Mitochondrial dysfunction precedes insulin resistance and hepatic steatosis and contributes to the natural history of non-alcoholic fatty liver disease in an obese rodent model. J. Hepatol. 2010, 52, 727–736. [Google Scholar] [CrossRef] [Green Version]
- Lockman, K.A.; Baren, J.P.; Pemberton, C.J.; Baghdadi, H.; Burgess, K.E.; Plevris-Papaioannou, N.; Lee, P.; Howie, F.; Beckett, G.; Pryde, A.; et al. Oxidative stress rather than triglyceride accumulation is a determinant of mitochondrial dysfunction in in vitro models of hepatic cellular steatosis. Liver Int. 2012, 32, 1079–1092. [Google Scholar] [CrossRef]
- Paradies, G.; Paradies, V.; Ruggiero, F.M.; Petrosillo, G. Oxidative stress, cardiolipin and mitochondrial dysfunction in nonalcoholic fatty liver disease. World J. Gastroenterol. 2014, 20, 14205–14218. [Google Scholar] [CrossRef]
- Einer, C.; Hohenester, S.; Wimmer, R.; Wottke, L.; Artmann, R.; Schulz, S.; Gosmann, C.; Simmons, A.; Leitzinger, C.; Eberhagen, C.; et al. Mitochondrial adaptation in steatotic mice. Mitochondrion 2018, 40, 1–12. [Google Scholar] [CrossRef]
- Simoes, I.C.M.; Karkucinska-Wieckowska, A.; Janikiewicz, J.; Szymanska, S.; Pronicki, M.; Dobrzyn, P.; Dabrowski, M.; Dobrzyn, A.; Oliveira, P.J.; Zischka, H.; et al. Western Diet Causes Obesity-Induced Nonalcoholic Fatty Liver Disease Development by Differentially Compromising the Autophagic Response. Antioxidants 2020, 9, 995. [Google Scholar] [CrossRef]
- Yamaguchi, K.; Yang, L.; McCall, S.; Huang, J.; Yu, X.X.; Pandey, S.K.; Bhanot, S.; Monia, B.P.; Li, Y.X.; Diehl, A.M. Inhibiting triglyceride synthesis improves hepatic steatosis but exacerbates liver damage and fibrosis in obese mice with nonalcoholic steatohepatitis. Hepatology 2007, 45, 1366–1374. [Google Scholar] [CrossRef]
- Satapati, S.; Sunny, N.E.; Kucejova, B.; Fu, X.; He, T.T.; Mendez-Lucas, A.; Shelton, J.M.; Perales, J.C.; Browning, J.D.; Burgess, S.C. Elevated TCA cycle function in the pathology of diet-induced hepatic insulin resistance and fatty liver. J. Lipid Res. 2012, 53, 1080–1092. [Google Scholar] [CrossRef] [Green Version]
- Grattagliano, I.; de Bari, O.; Bernardo, T.C.; Oliveira, P.J.; Wang, D.Q.; Portincasa, P. Role of mitochondria in nonalcoholic fatty liver disease--from origin to propagation. Clin. Biochem. 2012, 45, 610–618. [Google Scholar] [CrossRef]
- Lee, K.; Haddad, A.; Osme, A.; Kim, C.; Borzou, A.; Ilchenko, S.; Allende, D.; Dasarathy, S.; McCullough, A.; Sadygov, R.G.; et al. Hepatic Mitochondrial Defects in a Nonalcoholic Fatty Liver Disease Mouse Model Are Associated with Increased Degradation of Oxidative Phosphorylation Subunits. Mol. Cell Proteom. 2018, 17, 2371–2386. [Google Scholar] [CrossRef] [Green Version]
- Fouret, G.; Gaillet, S.; Lecomte, J.; Bonafos, B.; Djohan, F.; Barea, B.; Badia, E.; Coudray, C.; Feillet-Coudray, C. 20-Week follow-up of hepatic steatosis installation and liver mitochondrial structure and activity and their interrelation in rats fed a high-fat-high-fructose diet. Br. J. Nutr. 2018, 119, 368–380. [Google Scholar] [CrossRef] [Green Version]
- Muoio, D.M. Metabolic inflexibility: When mitochondrial indecision leads to metabolic gridlock. Cell 2014, 159, 1253–1262. [Google Scholar] [CrossRef] [Green Version]
- Aoun, M.; Fouret, G.; Michel, F.; Bonafos, B.; Ramos, J.; Cristol, J.P.; Carbonneau, M.A.; Coudray, C.; Feillet-Coudray, C. Dietary fatty acids modulate liver mitochondrial cardiolipin content and its fatty acid composition in rats with non alcoholic fatty liver disease. J. Bioenerg. Biomembr. 2012, 44, 439–452. [Google Scholar] [CrossRef]
- Peng, K.Y.; Watt, M.J.; Rensen, S.; Greve, J.W.; Huynh, K.; Jayawardana, K.S.; Meikle, P.J.; Meex, R.C.R. Mitochondrial dysfunction-related lipid changes occur in nonalcoholic fatty liver disease progression. J. Lipid Res. 2018, 59, 1977–1986. [Google Scholar] [CrossRef] [Green Version]
- Schlame, M. Cardiolipin synthesis for the assembly of bacterial and mitochondrial membranes. J. Lipid Res. 2008, 49, 1607–1620. [Google Scholar] [CrossRef] [Green Version]
- Prola, A.; Blondelle, J.; Vandestienne, A.; Piquereau, J.; Denis, R.G.P.; Guyot, S.; Chauvin, H.; Mourier, A.; Maurer, M.; Henry, C.; et al. Cardiolipin content controls mitochondrial coupling and energetic efficiency in muscle. Sci. Adv. 2021, 7, eabd6322. [Google Scholar] [CrossRef]
- Gan, L.T.; Van Rooyen, D.M.; Koina, M.E.; McCuskey, R.S.; Teoh, N.C.; Farrell, G.C. Hepatocyte free cholesterol lipotoxicity results from JNK1-mediated mitochondrial injury and is HMGB1 and TLR4-dependent. J. Hepatol. 2014, 61, 1376–1384. [Google Scholar] [CrossRef] [PubMed]
- Colell, A.; Garcia-Ruiz, C.; Lluis, J.M.; Coll, O.; Mari, M.; Fernandez-Checa, J.C. Cholesterol impairs the adenine nucleotide translocator-mediated mitochondrial permeability transition through altered membrane fluidity. J. Biol. Chem. 2003, 278, 33928–33935. [Google Scholar] [CrossRef] [Green Version]
- Fernandez-Checa, J.C.; Kaplowitz, N. Hepatic mitochondrial glutathione: Transport and role in disease and toxicity. Toxicol. Appl. Pharmcol. 2005, 204, 263–273. [Google Scholar] [CrossRef]
- Mari, M.; Caballero, F.; Colell, A.; Morales, A.; Caballeria, J.; Fernandez, A.; Enrich, C.; Fernandez-Checa, J.C.; Garcia-Ruiz, C. Mitochondrial free cholesterol loading sensitizes to TNF- and Fas-mediated steatohepatitis. Cell Metab. 2006, 4, 185–198. [Google Scholar] [CrossRef]
- Perfield, J.W., 2nd; Ortinau, L.C.; Pickering, R.T.; Ruebel, M.L.; Meers, G.M.; Rector, R.S. Altered hepatic lipid metabolism contributes to nonalcoholic fatty liver disease in leptin-deficient Ob/Ob mice. J. Obes. 2013, 2013, 296537. [Google Scholar] [CrossRef] [PubMed] [Green Version]
- Matsuzawa-Nagata, N.; Takamura, T.; Ando, H.; Nakamura, S.; Kurita, S.; Misu, H.; Ota, T.; Yokoyama, M.; Honda, M.; Miyamoto, K.; et al. Increased oxidative stress precedes the onset of high-fat diet-induced insulin resistance and obesity. Metabolism 2008, 57, 1071–1077. [Google Scholar] [CrossRef] [PubMed] [Green Version]
- Knebel, B.; Hartwig, S.; Haas, J.; Lehr, S.; Goeddeke, S.; Susanto, F.; Bohne, L.; Jacob, S.; Koellmer, C.; Nitzgen, U.; et al. Peroxisomes compensate hepatic lipid overflow in mice with fatty liver. Biochim. Biophys. Acta 2015, 1851, 965–976. [Google Scholar] [CrossRef] [PubMed]
- Collins, J.C.; Scheinberg, I.H.; Giblin, D.R.; Sternlieb, I. Hepatic peroxisomal abnormalities in abetalipoproteinemia. Gastroenterology 1989, 97, 766–770. [Google Scholar] [CrossRef]
- De Craemer, D.; Pauwels, M.; Van den Branden, C. Alterations of peroxisomes in steatosis of the human liver: A quantitative study. Hepatology 1995, 22, 744–752. [Google Scholar] [CrossRef]
- Hall, D.; Poussin, C.; Velagapudi, V.R.; Empsen, C.; Joffraud, M.; Beckmann, J.S.; Geerts, A.E.; Ravussin, Y.; Ibberson, M.; Oresic, M.; et al. Peroxisomal and microsomal lipid pathways associated with resistance to hepatic steatosis and reduced pro-inflammatory state. J. Biol. Chem. 2010, 285, 31011–31023. [Google Scholar] [CrossRef] [Green Version]
- Knebel, B.; Goddeke, S.; Hartwig, S.; Horbelt, T.; Fahlbusch, P.; Al-Hasani, H.; Jacob, S.; Koellmer, C.; Nitzgen, U.; Schiller, M.; et al. Alteration of Liver Peroxisomal and Mitochondrial Functionality in the NZO Mouse Model of Metabolic Syndrome. Proteom. Clin. Appl. 2018, 12. [Google Scholar] [CrossRef]
- Natarajan, S.K.; Eapen, C.E.; Pullimood, A.B.; Balasubramanian, K.A. Oxidative stress in experimental liver microvesicular steatosis: Role of mitochondria and peroxisomes. J. Gastroenterol. Hepatol. 2006, 21, 1240–1249. [Google Scholar] [CrossRef]
- Chen, Z.; Tian, R.; She, Z.; Cai, J.; Li, H. Role of oxidative stress in the pathogenesis of nonalcoholic fatty liver disease. Free Radic. Biol. Med. 2020, 152, 116–141. [Google Scholar] [CrossRef]
- Toime, L.J.; Brand, M.D. Uncoupling protein-3 lowers reactive oxygen species production in isolated mitochondria. Free Radic. Biol. Med. 2010, 49, 606–611. [Google Scholar] [CrossRef] [Green Version]
- Turner, N.; Bruce, C.R.; Beale, S.M.; Hoehn, K.L.; So, T.; Rolph, M.S.; Cooney, G.J. Excess lipid availability increases mitochondrial fatty acid oxidative capacity in muscle: Evidence against a role for reduced fatty acid oxidation in lipid-induced insulin resistance in rodents. Diabetes 2007, 56, 2085–2092. [Google Scholar] [CrossRef] [Green Version]
- Braud, L.; Battault, S.; Meyer, G.; Nascimento, A.; Gaillard, S.; de Sousa, G.; Rahmani, R.; Riva, C.; Armand, M.; Maixent, J.M.; et al. Antioxidant properties of tea blunt ROS-dependent lipogenesis: Beneficial effect on hepatic steatosis in a high fat-high sucrose diet NAFLD obese rat model. J. Nutr. Biochem. 2017, 40, 95–104. [Google Scholar] [CrossRef] [Green Version]
- Wang, L.; Liu, X.; Nie, J.; Zhang, J.; Kimball, S.R.; Zhang, H.; Zhang, W.J.; Jefferson, L.S.; Cheng, Z.; Ji, Q.; et al. ALCAT1 controls mitochondrial etiology of fatty liver diseases, linking defective mitophagy to steatosis. Hepatology 2015, 61, 486–496. [Google Scholar] [CrossRef] [Green Version]
- Boveris, A.; Oshino, N.; Chance, B. The cellular production of hydrogen peroxide. Biochem. J. 1972, 128, 617–630. [Google Scholar] [CrossRef]
- Elsner, M.; Gehrmann, W.; Lenzen, S. Peroxisome-generated hydrogen peroxide as important mediator of lipotoxicity in insulin-producing cells. Diabetes 2011, 60, 200–208. [Google Scholar] [CrossRef] [Green Version]
- Szymanska-Debinska, T.; Karkucinska-Wieckowska, A.; Piekutowska-Abramczuk, D.; Jurkiewicz, E.; Iwanicka-Pronicka, K.; Rokicki, D.; Pronicki, M. Leigh disease due to SCO2 mutations revealed at extended autopsy. J. Clin. Pathol. 2015, 68, 397–399. [Google Scholar] [CrossRef]
- Kleiner, D.E.; Brunt, E.M.; Van Natta, M.; Behling, C.; Contos, M.J.; Cummings, O.W.; Ferrell, L.D.; Liu, Y.C.; Torbenson, M.S.; Unalp-Arida, A.; et al. Design and validation of a histological scoring system for nonalcoholic fatty liver disease. Hepatology 2005, 41, 1313–1321. [Google Scholar] [CrossRef]
- Rogers, G.W.; Brand, M.D.; Petrosyan, S.; Ashok, D.; Elorza, A.A.; Ferrick, D.A.; Murphy, A.N. High throughput microplate respiratory measurements using minimal quantities of isolated mitochondria. PLoS ONE 2011, 6, e21746. [Google Scholar] [CrossRef]
- Bligh, E.G.; Dyer, W.J. A rapid method of total lipid extraction and purification. Can. J. Biochem. Physiol. 1959, 37, 911–917. [Google Scholar] [CrossRef] [Green Version]
- Gerard-Monnier, D.; Erdelmeier, I.; Regnard, K.; Moze-Henry, N.; Yadan, J.C.; Chaudiere, J. Reactions of 1-methyl-2-phenylindole with malondialdehyde and 4-hydroxyalkenals. Analytical applications to a colorimetric assay of lipid peroxidation. Chem. Res. Toxicol. 1998, 11, 1176–1183. [Google Scholar] [CrossRef]
- de Gonzalo-Calvo, D.; Neitzert, K.; Fernandez, M.; Vega-Naredo, I.; Caballero, B.; Garcia-Macia, M.; Suarez, F.M.; Rodriguez-Colunga, M.J.; Solano, J.J.; Coto-Montes, A. Differential inflammatory responses in aging and disease: TNF-alpha and IL-6 as possible biomarkers. Free Radic. Biol. Med. 2010, 49, 733–737. [Google Scholar] [CrossRef]
- Arnao, M.B.; Cano, A.; Acosta, M. The hydrophilic and lipophilic contribution to total antioxidant activity. Food Chem. 2001, 73, 239–244. [Google Scholar] [CrossRef]
- Bradford, M.M. A rapid and sensitive method for the quantitation of microgram quantities of protein utilizing the principle of protein-dye binding. Anal. Biochem. 1976, 72, 248–254. [Google Scholar] [CrossRef]
- Weekes, M.P.; Tomasec, P.; Huttlin, E.L.; Fielding, C.A.; Nusinow, D.; Stanton, R.J.; Wang, E.C.Y.; Aicheler, R.; Murrell, I.; Wilkinson, G.W.G.; et al. Quantitative temporal viromics: An approach to investigate host-pathogen interaction. Cell 2014, 157, 1460–1472. [Google Scholar] [CrossRef] [Green Version]
- McAlister, G.C.; Nusinow, D.P.; Jedrychowski, M.P.; Wuhr, M.; Huttlin, E.L.; Erickson, B.K.; Rad, R.; Haas, W.; Gygi, S.P. MultiNotch MS3 enables accurate, sensitive, and multiplexed detection of differential expression across cancer cell line proteomes. Anal. Chem. 2014, 86, 7150–7158. [Google Scholar] [CrossRef]
- Adler, P.; Reimand, J.; Janes, J.; Kolde, R.; Peterson, H.; Vilo, J. KEGGanim: Pathway animations for high-throughput data. Bioinformatics 2008, 24, 588–590. [Google Scholar] [CrossRef] [Green Version]


Publisher’s Note: MDPI stays neutral with regard to jurisdictional claims in published maps and institutional affiliations. |
© 2021 by the authors. Licensee MDPI, Basel, Switzerland. This article is an open access article distributed under the terms and conditions of the Creative Commons Attribution (CC BY) license (https://creativecommons.org/licenses/by/4.0/).
Share and Cite
Simões, I.C.M.; Amorim, R.; Teixeira, J.; Karkucinska-Wieckowska, A.; Carvalho, A.; Pereira, S.P.; Simões, R.F.; Szymanska, S.; Dąbrowski, M.; Janikiewicz, J.; et al. The Alterations of Mitochondrial Function during NAFLD Progression—An Independent Effect of Mitochondrial ROS Production. Int. J. Mol. Sci. 2021, 22, 6848. https://doi.org/10.3390/ijms22136848
Simões ICM, Amorim R, Teixeira J, Karkucinska-Wieckowska A, Carvalho A, Pereira SP, Simões RF, Szymanska S, Dąbrowski M, Janikiewicz J, et al. The Alterations of Mitochondrial Function during NAFLD Progression—An Independent Effect of Mitochondrial ROS Production. International Journal of Molecular Sciences. 2021; 22(13):6848. https://doi.org/10.3390/ijms22136848
Chicago/Turabian StyleSimões, Inês C. M., Ricardo Amorim, José Teixeira, Agnieszka Karkucinska-Wieckowska, Adriana Carvalho, Susana P. Pereira, Rui F. Simões, Sylwia Szymanska, Michał Dąbrowski, Justyna Janikiewicz, and et al. 2021. "The Alterations of Mitochondrial Function during NAFLD Progression—An Independent Effect of Mitochondrial ROS Production" International Journal of Molecular Sciences 22, no. 13: 6848. https://doi.org/10.3390/ijms22136848
APA StyleSimões, I. C. M., Amorim, R., Teixeira, J., Karkucinska-Wieckowska, A., Carvalho, A., Pereira, S. P., Simões, R. F., Szymanska, S., Dąbrowski, M., Janikiewicz, J., Dobrzyń, A., Oliveira, P. J., Potes, Y., & Wieckowski, M. R. (2021). The Alterations of Mitochondrial Function during NAFLD Progression—An Independent Effect of Mitochondrial ROS Production. International Journal of Molecular Sciences, 22(13), 6848. https://doi.org/10.3390/ijms22136848