Article

Transcriptional Profiling of Cardiac Cells Links Age-Dependent Changes in Acetyl-CoA Signaling to Chromatin Modifications

1
Center for Metabolic Disease Research (CMDR), LKSOM, Temple University, Philadelphia, PA 19140, USA
2
Cardiovascular Research Center (CVRC), LKSOM, Temple University, Philadelphia, PA 19140, USA
3
Department of Physiology, LKSOM, Temple University, Philadelphia, PA 19140, USA
*
Author to whom correspondence should be addressed.
Int. J. Mol. Sci. 2021, 22(13), 6987; https://doi.org/10.3390/ijms22136987
Submission received: 4 June 2021 / Revised: 22 June 2021 / Accepted: 23 June 2021 / Published: 29 June 2021

Abstract

:
Metabolism has emerged as a regulator of core stem cell properties such as proliferation, survival, self-renewal, and multilineage potential. Metabolites serve as secondary messengers, fine-tuning signaling pathways in response to microenvironment alterations. Studies show a role for central metabolite acetyl-CoA in the regulation of chromatin state through changes in histone acetylation. Nevertheless, metabolic regulators of chromatin remodeling in cardiac cells in response to increasing biological age remains unknown. Previously, we identified novel cardiac-derived stem-like cells (CTSCs) that exhibit increased functional properties in the neonatal heart (nCTSC). These cells are linked to a unique metabolism which is altered with CTSC aging (aCTSC). Here, we present an in-depth, RNA-sequencing-based (RNA-Seq) bioinformatic with cluster analysis that details a distinct epigenome present in nCTSCs but not in aCTSCs. Gene Ontology (GO) and pathway enrichment reveal biological processes, including metabolism, gene regulation enriched in nCTSCs, and STRING analysis that identifies a network of genes related to acetyl-CoA that can potentially influence chromatin remodeling. Additional validation by Western blot and qRT-PCR shows increased acetyl-CoA signaling and histone acetylation in nCTSCs compared to aCTSCs. In conclusion, our data reveal that the link between metabolism and histone acetylation in cardiac cells is altered with the aging of the cardiac tissue.

1. Introduction

Heart disease is characterized by lack of meaningful repair response by the injured cardiac tissue. Cardiomyocytes lost to injury are never replaced, which ultimately leads to adverse cardiac remodeling and heart failure. Cell-based therapies have offered promising alternatives to existing approaches to heart failure [1,2,3,4]. However, clinical results using several stem cell types have been largely underwhelming [5] and suggest that there is a need for a better understanding of the basic biology of stem cells and their response to injured myocardial environments. We have recently identified a novel cardiac-tissue-derived stem-like cell (CTSC) population in the heart which has a unique molecular and cellular profile compared to other known stem cells [6]. Interestingly, CTSCs possess a distinct metabolic phenotype that changes during the transition of the cells from neonatal to aged cardiac tissue concurrent with changes in proliferation and survival, suggesting that cellular metabolism is a mediator of CTSC function. Nevertheless, the precise role of metabolic signaling in regulating CTSC molecular and cellular function was not tested and remains unknown.
Metabolism has emerged recently as a mediator of stem cell fate as well as cellular and molecular function. Hallmark stem cell processes such as proliferation and survival are influenced by fluctuations in stem cell metabolism [7,8]. Various metabolites generated by stem cells during energy production act as secondary messengers, driving diverse signaling processes [9,10]. Studies have shown that certain metabolites such as acetyl coenzyme A (acetyl-CoA) continuously fluctuate, adjusting gene expression by modulating the epigenome in response to environmental changes [11,12]. Acetyl-CoA directly affects histone acetylation by transferring the acetyl group onto the histone lysine via histone acetyltransferases (HATs), thereby modulating epigenetic changes in gene expression [13,14]. In the cardiac context, epigenetic signaling pathways are known to change during embryonic, neonatal, and adult stages [15,16]. The existence of metabolic regulators of chromatin architecture in cardiac cells, however, is not well studied. Additionally, changes in the metabolic profile of cardiac cells during the transition from young to aged and the role of the acetyl-CoA signaling pathway in regulating chromatin modification remain unknown.
In this article, CTSCs were isolated from neonatal (2-day-old; nCTSCs) and aged (2-year-old; aCTSC) hearts and subjected to bulk RNA-Seq to identify metabolic signaling pathways related to chromatin modulation. Comparative analysis of neonatal and aged CTSCs shows unique metabolic and chromatin modifying processes, and reveals acetyl-CoA regulators and signaling pathways being altered with CTSC age in the heart. These findings provide a novel insight connecting cellular metabolism with the maintenance of chromatin architecture in cardiac cells during transition from young to aged and thereby provide a new dimension to functional regulation in CTSCs.

2. Results

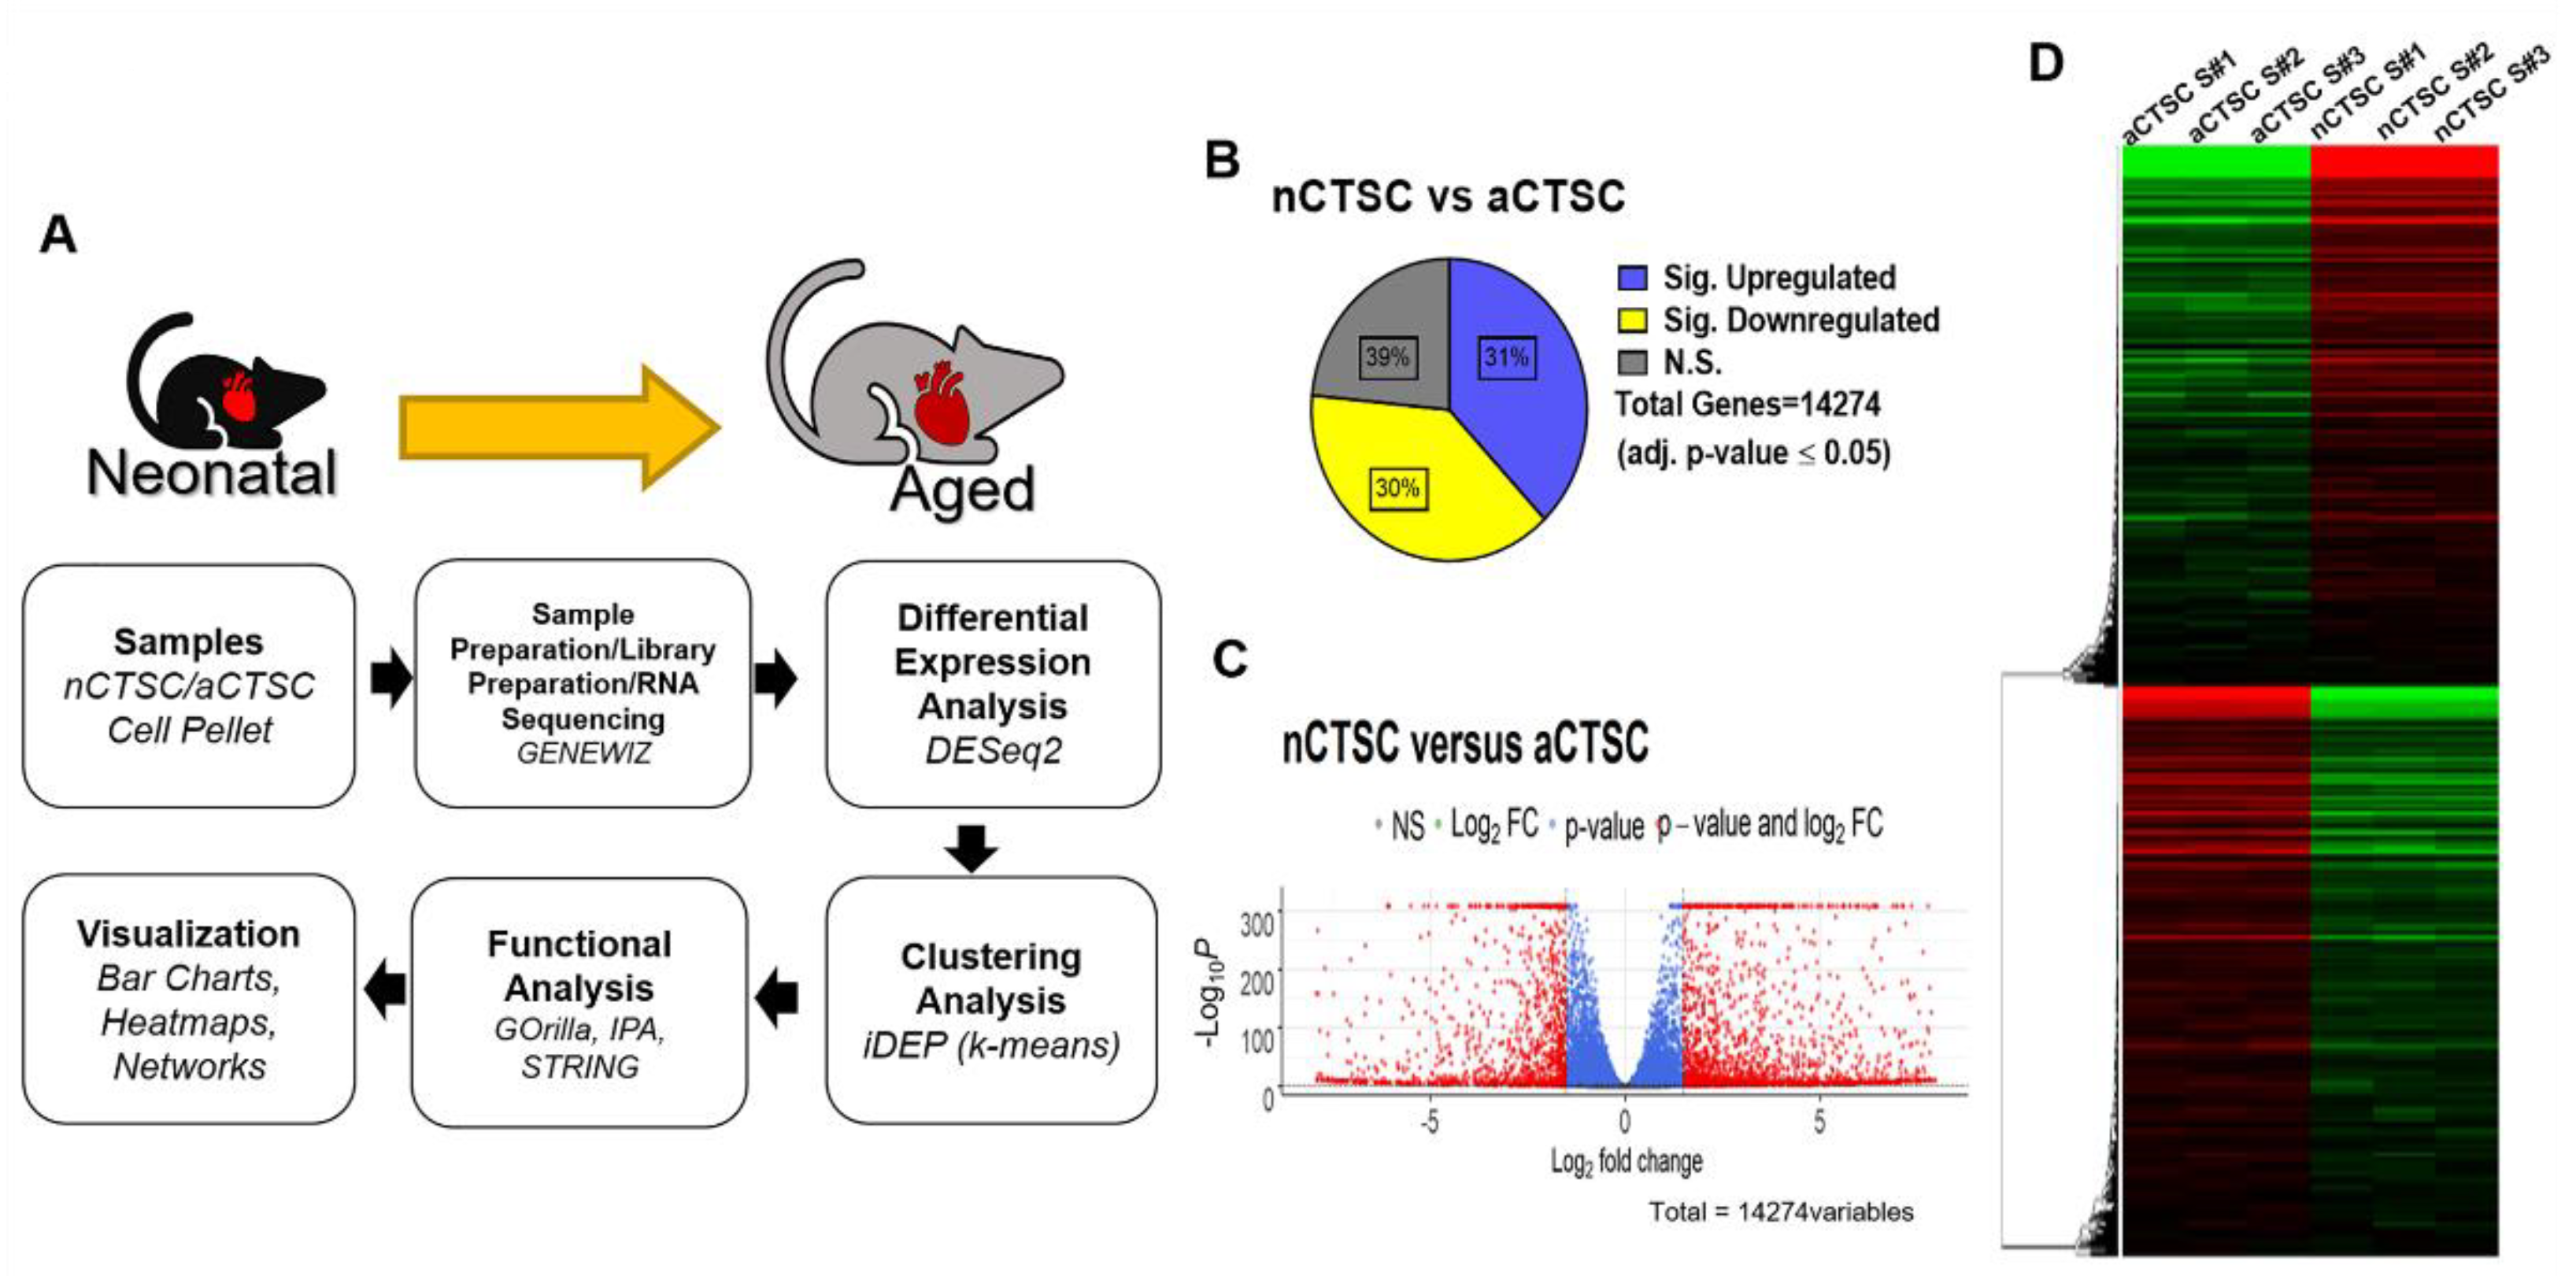
2.1. Distinct CTSC Profiles in Response to Aging as Revealed by Transcriptomic Analysis

In this study, we describe the identification of novel metabolic modulators of chromatin architecture in cardiac-derived stem-like cells (CTSC), a novel cell type in the heart, through bioinformatic and molecular approaches. For this study, we isolated two distinct CTSC populations—one from 2-day-old neonatal (nCTSC) cardiac tissue and one from aged, 2-year-old (aCTSC) cardiac tissue as previously described. This was followed by bulk RNA sequencing and detailed bioinformatic-based analyses to understand the transcriptomic profile of each CTSC line (Figure 1A). The raw count files were retrieved after sequencing, formatted, and uploaded onto the RStudio platform for gene expression analysis via DESeq2. Direct comparison of nCTSC with aCTSC identified a total of 14,274 genes, of which 31% were significantly upregulated in nCTSC and 30% were significantly downregulated (Figure 1B). Scatter plot (Figure 1C) and heatmap (Figure 1D) representations visualize the up- and downregulation of genes between nCTSC and aCTSC.
Next, we assessed transcriptomic differences between nCTSCs and aCTSCs by performing a principal coordinates assay (PCoA) that visualized dissimilarity between the two samples (Figure 2A). In our data, the PCoA plot not only shows that the CTSC replicates from neonatal and aged hearts are low in variance, but also that there are significant differences between nCTSC replicates and the aCTSC transcriptional profile. These changes may detail the developmental transition that occurs as neonatal CTSCs eventually age and acquire aCTSC phenotypic characteristics along with the aging of the cardiac tissue. Finally, the Pearson correlation plot (Figure 2B) shows that even though the nCTSCs and aCTSCs are distinct subpopulations, the overall correlation between the two CTSC populations is high because they both originated in the heart and were isolated under similar conditions. Collectively, data analysis reveals that CTSC transcriptome alters with the age of the cardiac tissue, and this affects the neonatal cells more than the aged CTSCs.

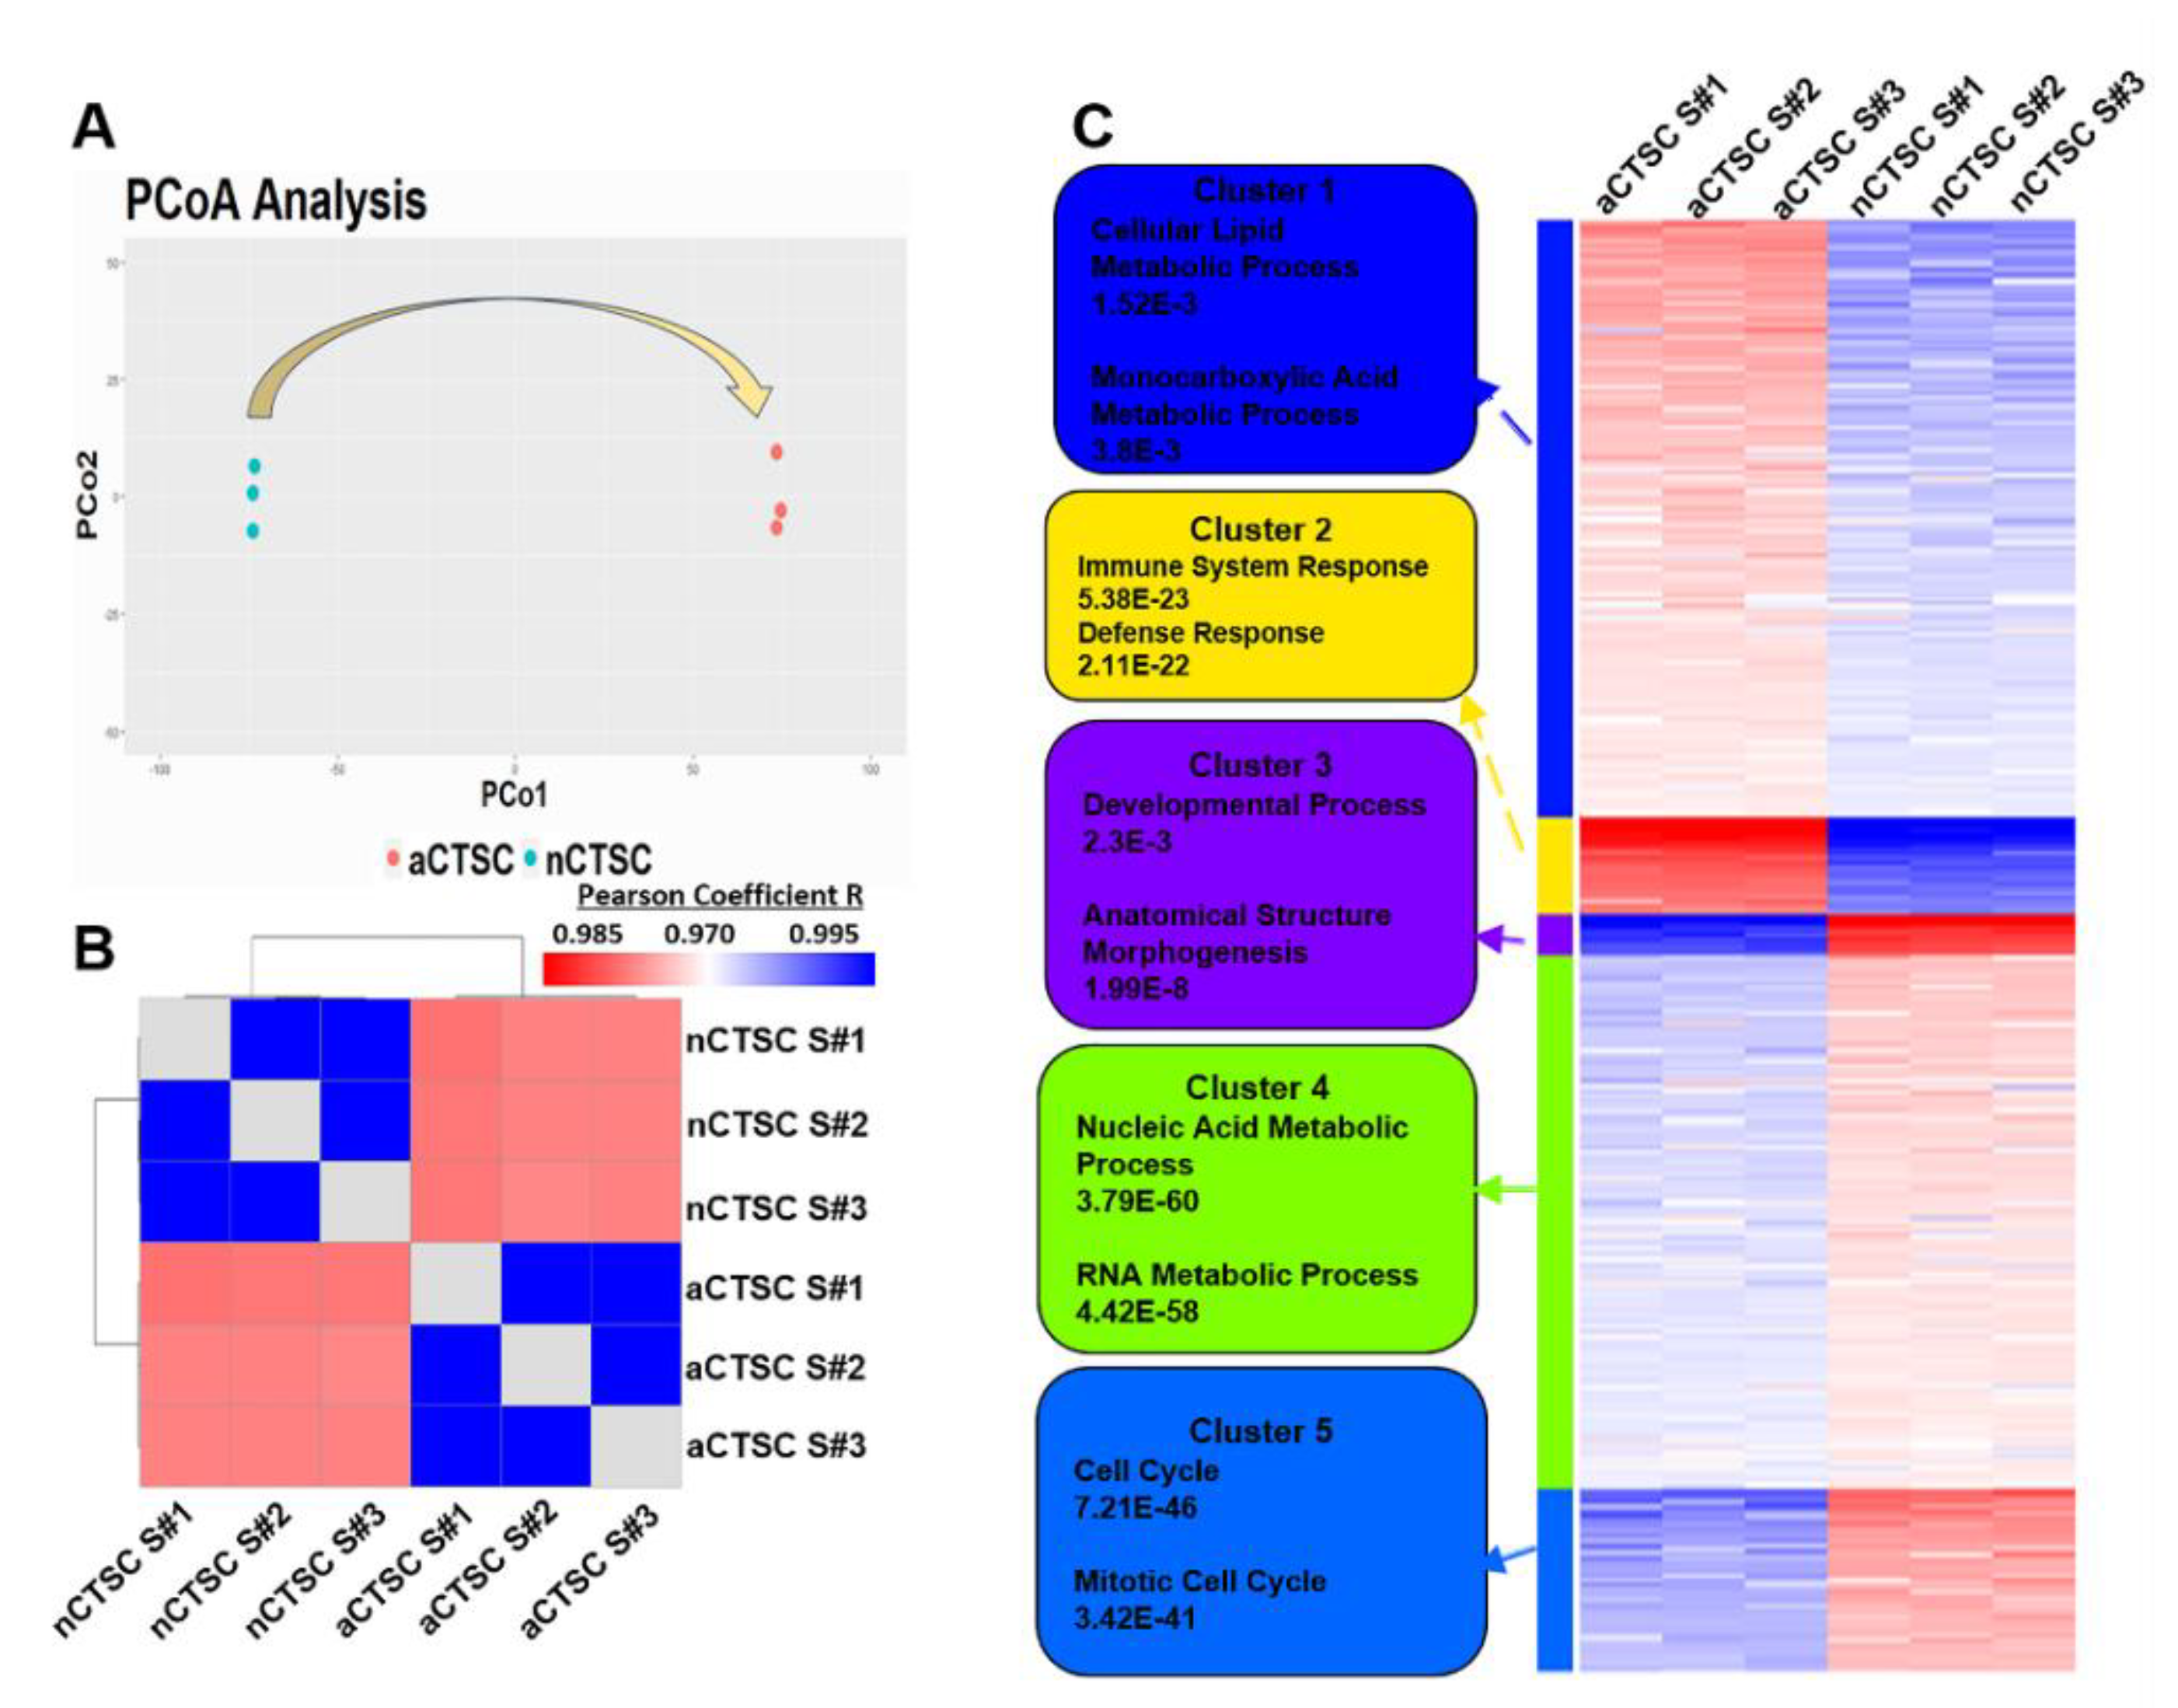
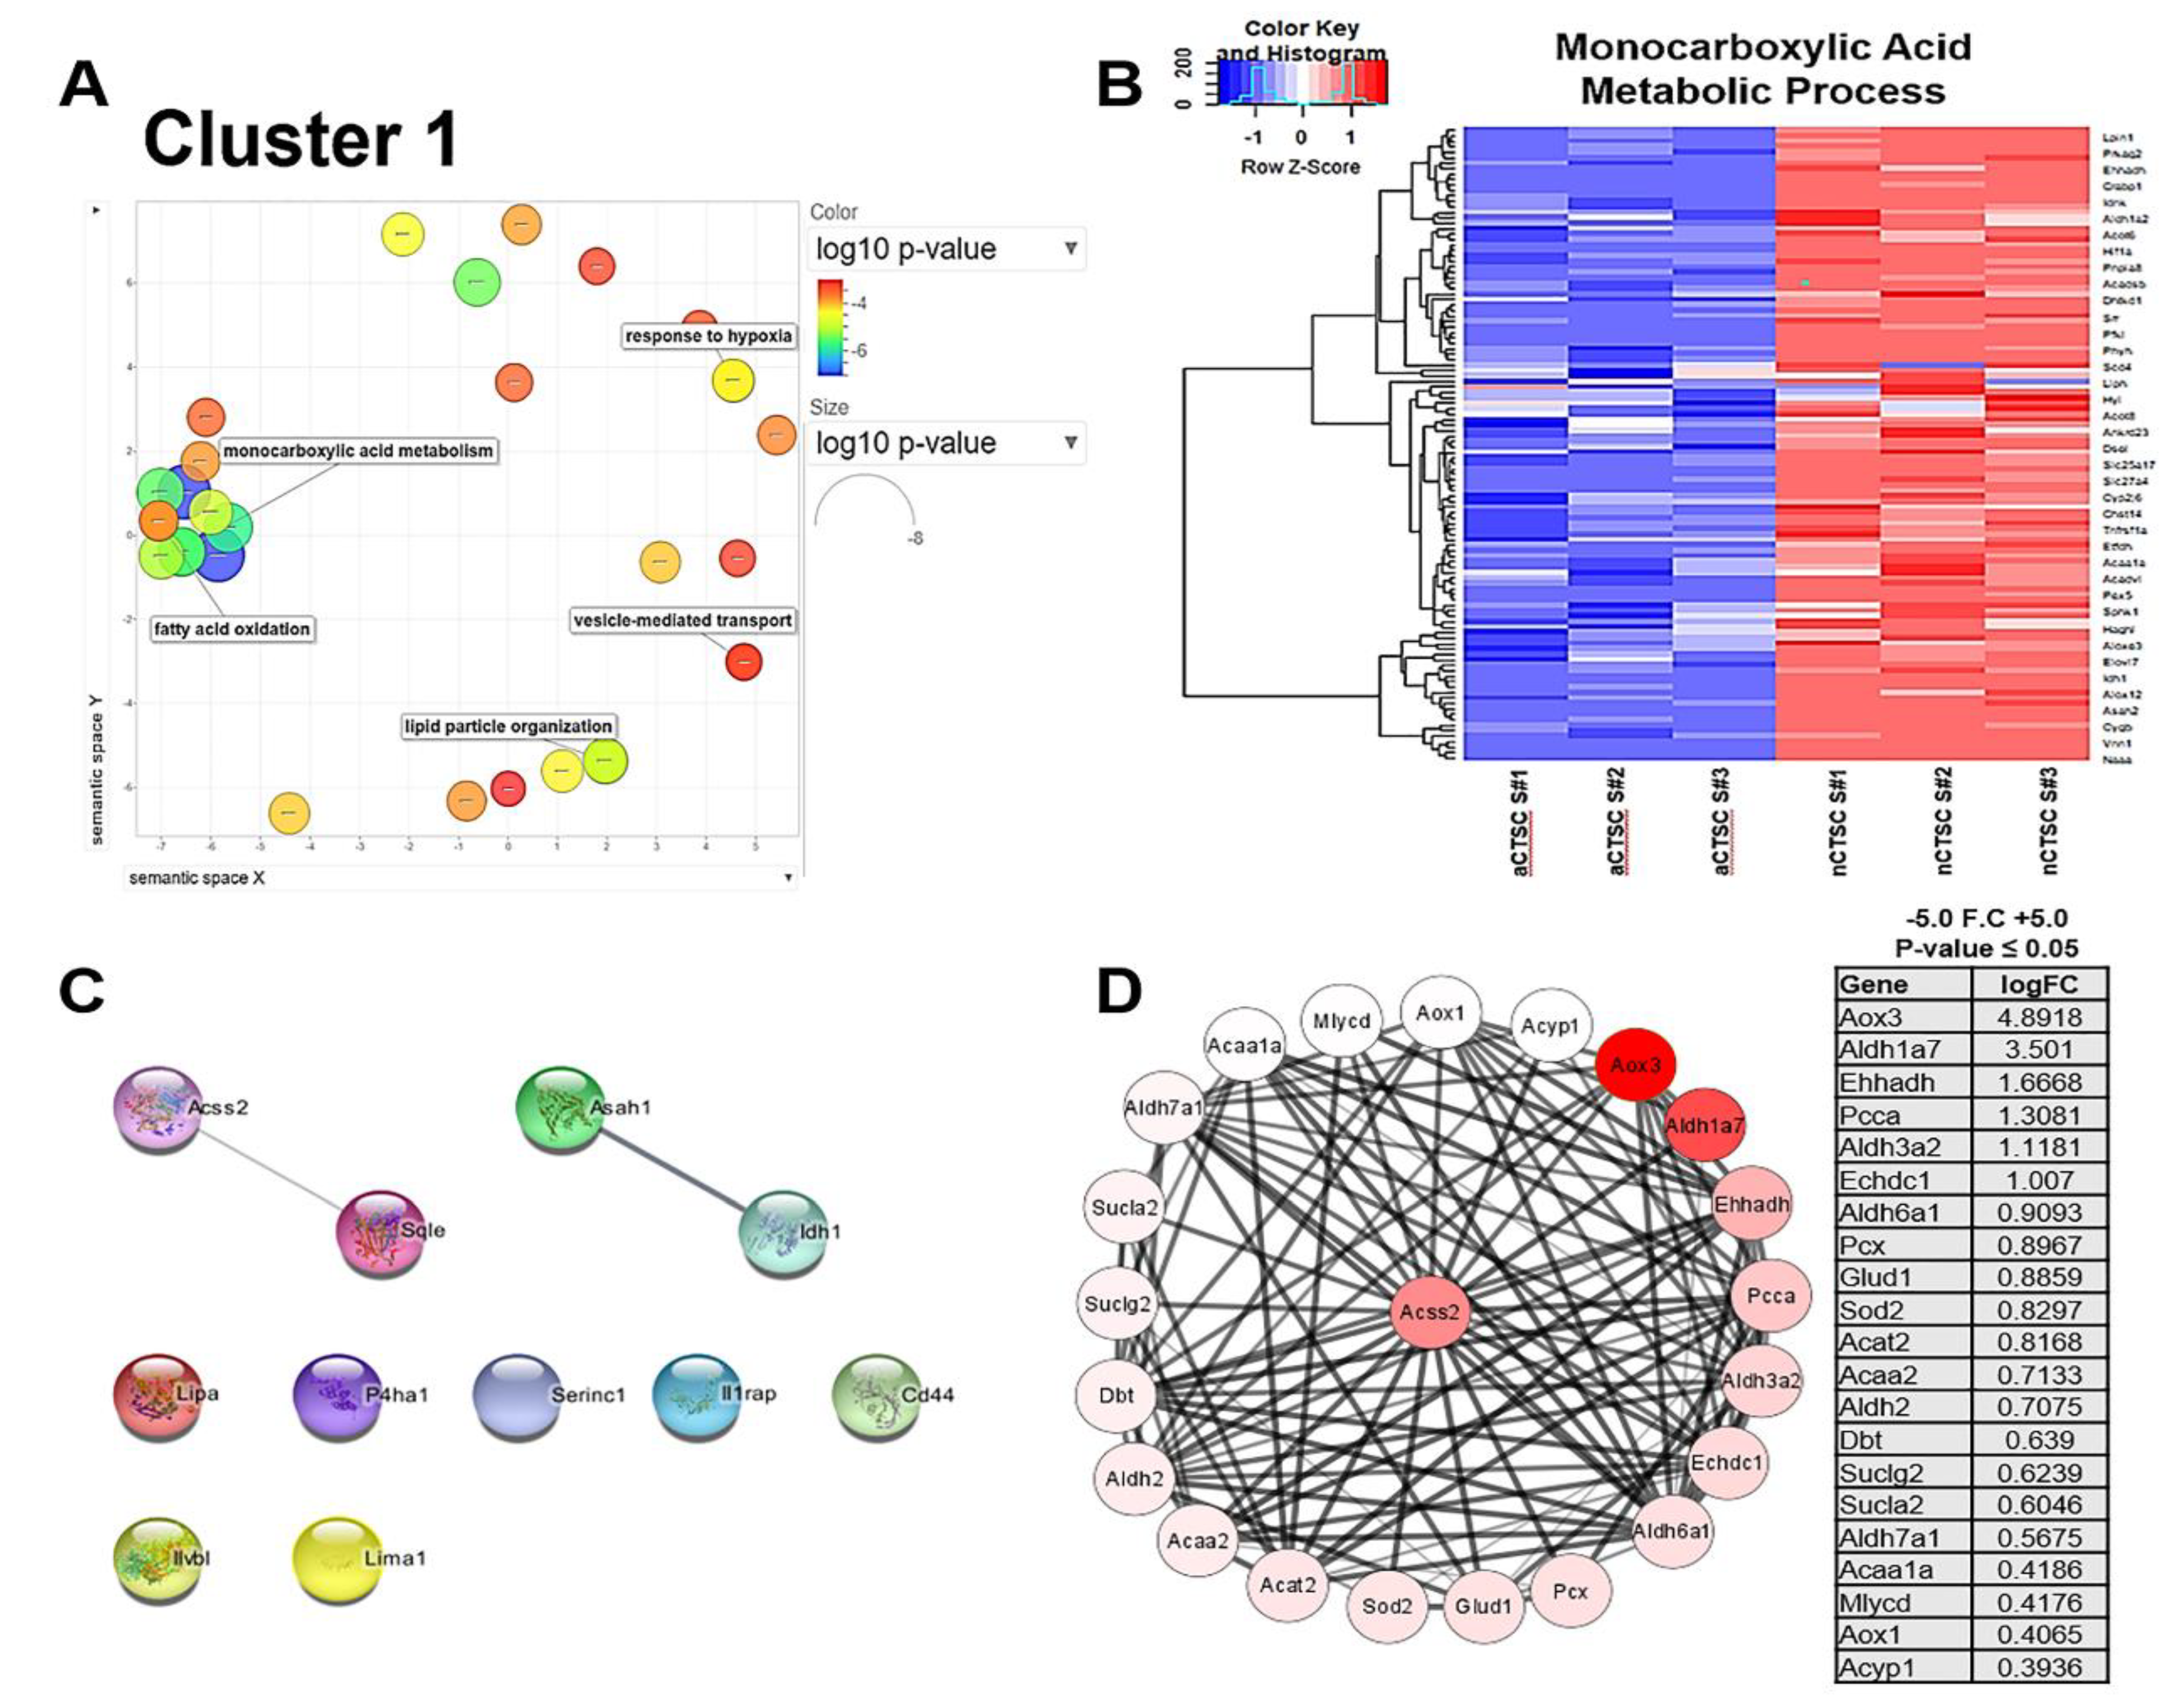
2.2. Metabolic Processes Are Upregulated in nCTSC as Shown by Clustering Analysis

The next set of analyses focused on discovering functionalities occurring between the two CTSC populations and identifying biological relevance. For this, we initially clustered differentially expressed genes (DEG) through k-means methodology and found five clusters identified by the elbow method to be ideal for subsequent analyses (Figure 2C). Genes within each cluster were determined through comparison and identification of the minimum distance to cluster mean. Once generated, the clusters were subjected to downstream functional enrichment analyses, such as Gene Ontology (GO) and Ingenuity Pathway Analysis (IPA). GO analysis of biological processes showed significant GO terms unique to each cluster. For example, cluster 1 consists of GO terms such as Cellular Lipid Metabolic Process (FDR 1.52 × 10⁻³), Monocarboxylic Acid Metabolic Process (FDR 3.8 × 10⁻³), and additional metabolic GO terms, indicating that this cluster is responsible primarily for metabolism (Figure 3A). GO analysis of clusters 2, 3, 4, and 5 shows them to be responsible for cellular processes of immune response (Figure 3B), development (Figure 3C), gene expression (Figure 3D), and cell cycle (Figure 3E), respectively (Figure S1). GO analysis confirmed that the canonical pathway was enriched, as determined by IPA, to similar biological terms and signaling pathways for each cluster. Interestingly, in cluster 4, GO terms involved regulation of gene expression and showed significant enrichment of processes such as ‘Embryonic Stem Cell Differentiation into Cardiac Lineages’ and ‘Mouse Embryonic Stem Cell Pluripotency’ in the nCTSCs. Moreover, pathway analysis of cluster 4 revealed enriched terms that may suggest a unique chromatin remodeling, possibly related to maintaining the stem-like phenotype in nCTSCs. This draws a parallel with previous studies that focus on how chromatin remodeling is essential to stem cell fate in either maintaining pluripotency or progressing to differentiation. Altogether, functional analysis reveals heterogenous clusters of genes involved in many essential activities, such as metabolism and regulation of gene expression.

2.3. ACSS2 Is Highly Enriched in nCTSCs Compared to aCTSCs

We previously reported that in vitro characterization of CTSCs showed a significant metabolic shift occurring as the hearts age [6]. The neonatal heart is largely dependent on glycolytic metabolism, while oxidative phosphorylation is predominant in aged hearts. To identify metabolic regulators connected with changes in gene expression, we conducted further analysis of cluster 1 by REVIGO analysis that removed redundant GO terms and defined prominent terms such as monocarboxylic acid metabolism significantly enriched in nCTSC compared to aCTSC (FDR 3.8 × 10⁻³) (Figure 4A). A heatmap was generated to visualize the genes present in that GO term (Figure 4B). Among those genes significantly upregulated in nCTSCs compared to aCTSCs was Acetyl coenzyme A synthetase short-chain family member 2 (ACSS2). ACSS2 is an essential cytosolic protein involved in lipid metabolism and generates Acetyl-CoA. Previous studies show that ACSS2 is involved in many functions beyond metabolism, such as chromatin regulation. To identify potential ACSS2 targeting genes in nCTSCs and to understand their biological relevance, a table was generated showing the most significantly altered genes present in each of the top 10 GO terms within all clusters (Table 1). Since cluster 1 represented DEGs that belonged to metabolism, the top identified genes in each GO term within cluster 1 were subjected to STRING database and visualized through
Cytoscape to predict the interaction between top identified genes in each GO term and ACSS2 (Table S3). The results showed unique biological signaling pathways regulated by the top identified genes in each GO term (Figure S2). Interestingly, out of all the other top identified genes per GO term in cluster 1, only Sqle was predicted to directly target ACSS2 in nCTSCs (Figure 4C). Finally, we investigated additional genes regulated by ACSS2 in nCTSCs within our data. For this purpose, we utilized a published STRING database for the top 50 genes that are predicted to interact with ACSS2 (Figure S3) and compared them to our list of DEGs altered in nCTSCs compared to aCTSCs. This analysis identified 21 significantly altered genes that directly interact with ACSS2 within the entire group of DEGs altered in cluster 1 (Figure 4D). Our network reveals many metabolically upregulated terms, such as Aox3 and Aldh7a1, but it also includes other genes, such as PCCA and Sod2, that are known to possess histone regulatory functions. Collectively, our data identify ACSS2 as a central nodal signaling pathway in nCTSC, and one that is predicted to be regulated by several metabolic gene targets with potential to affect chromatin regulation as well.

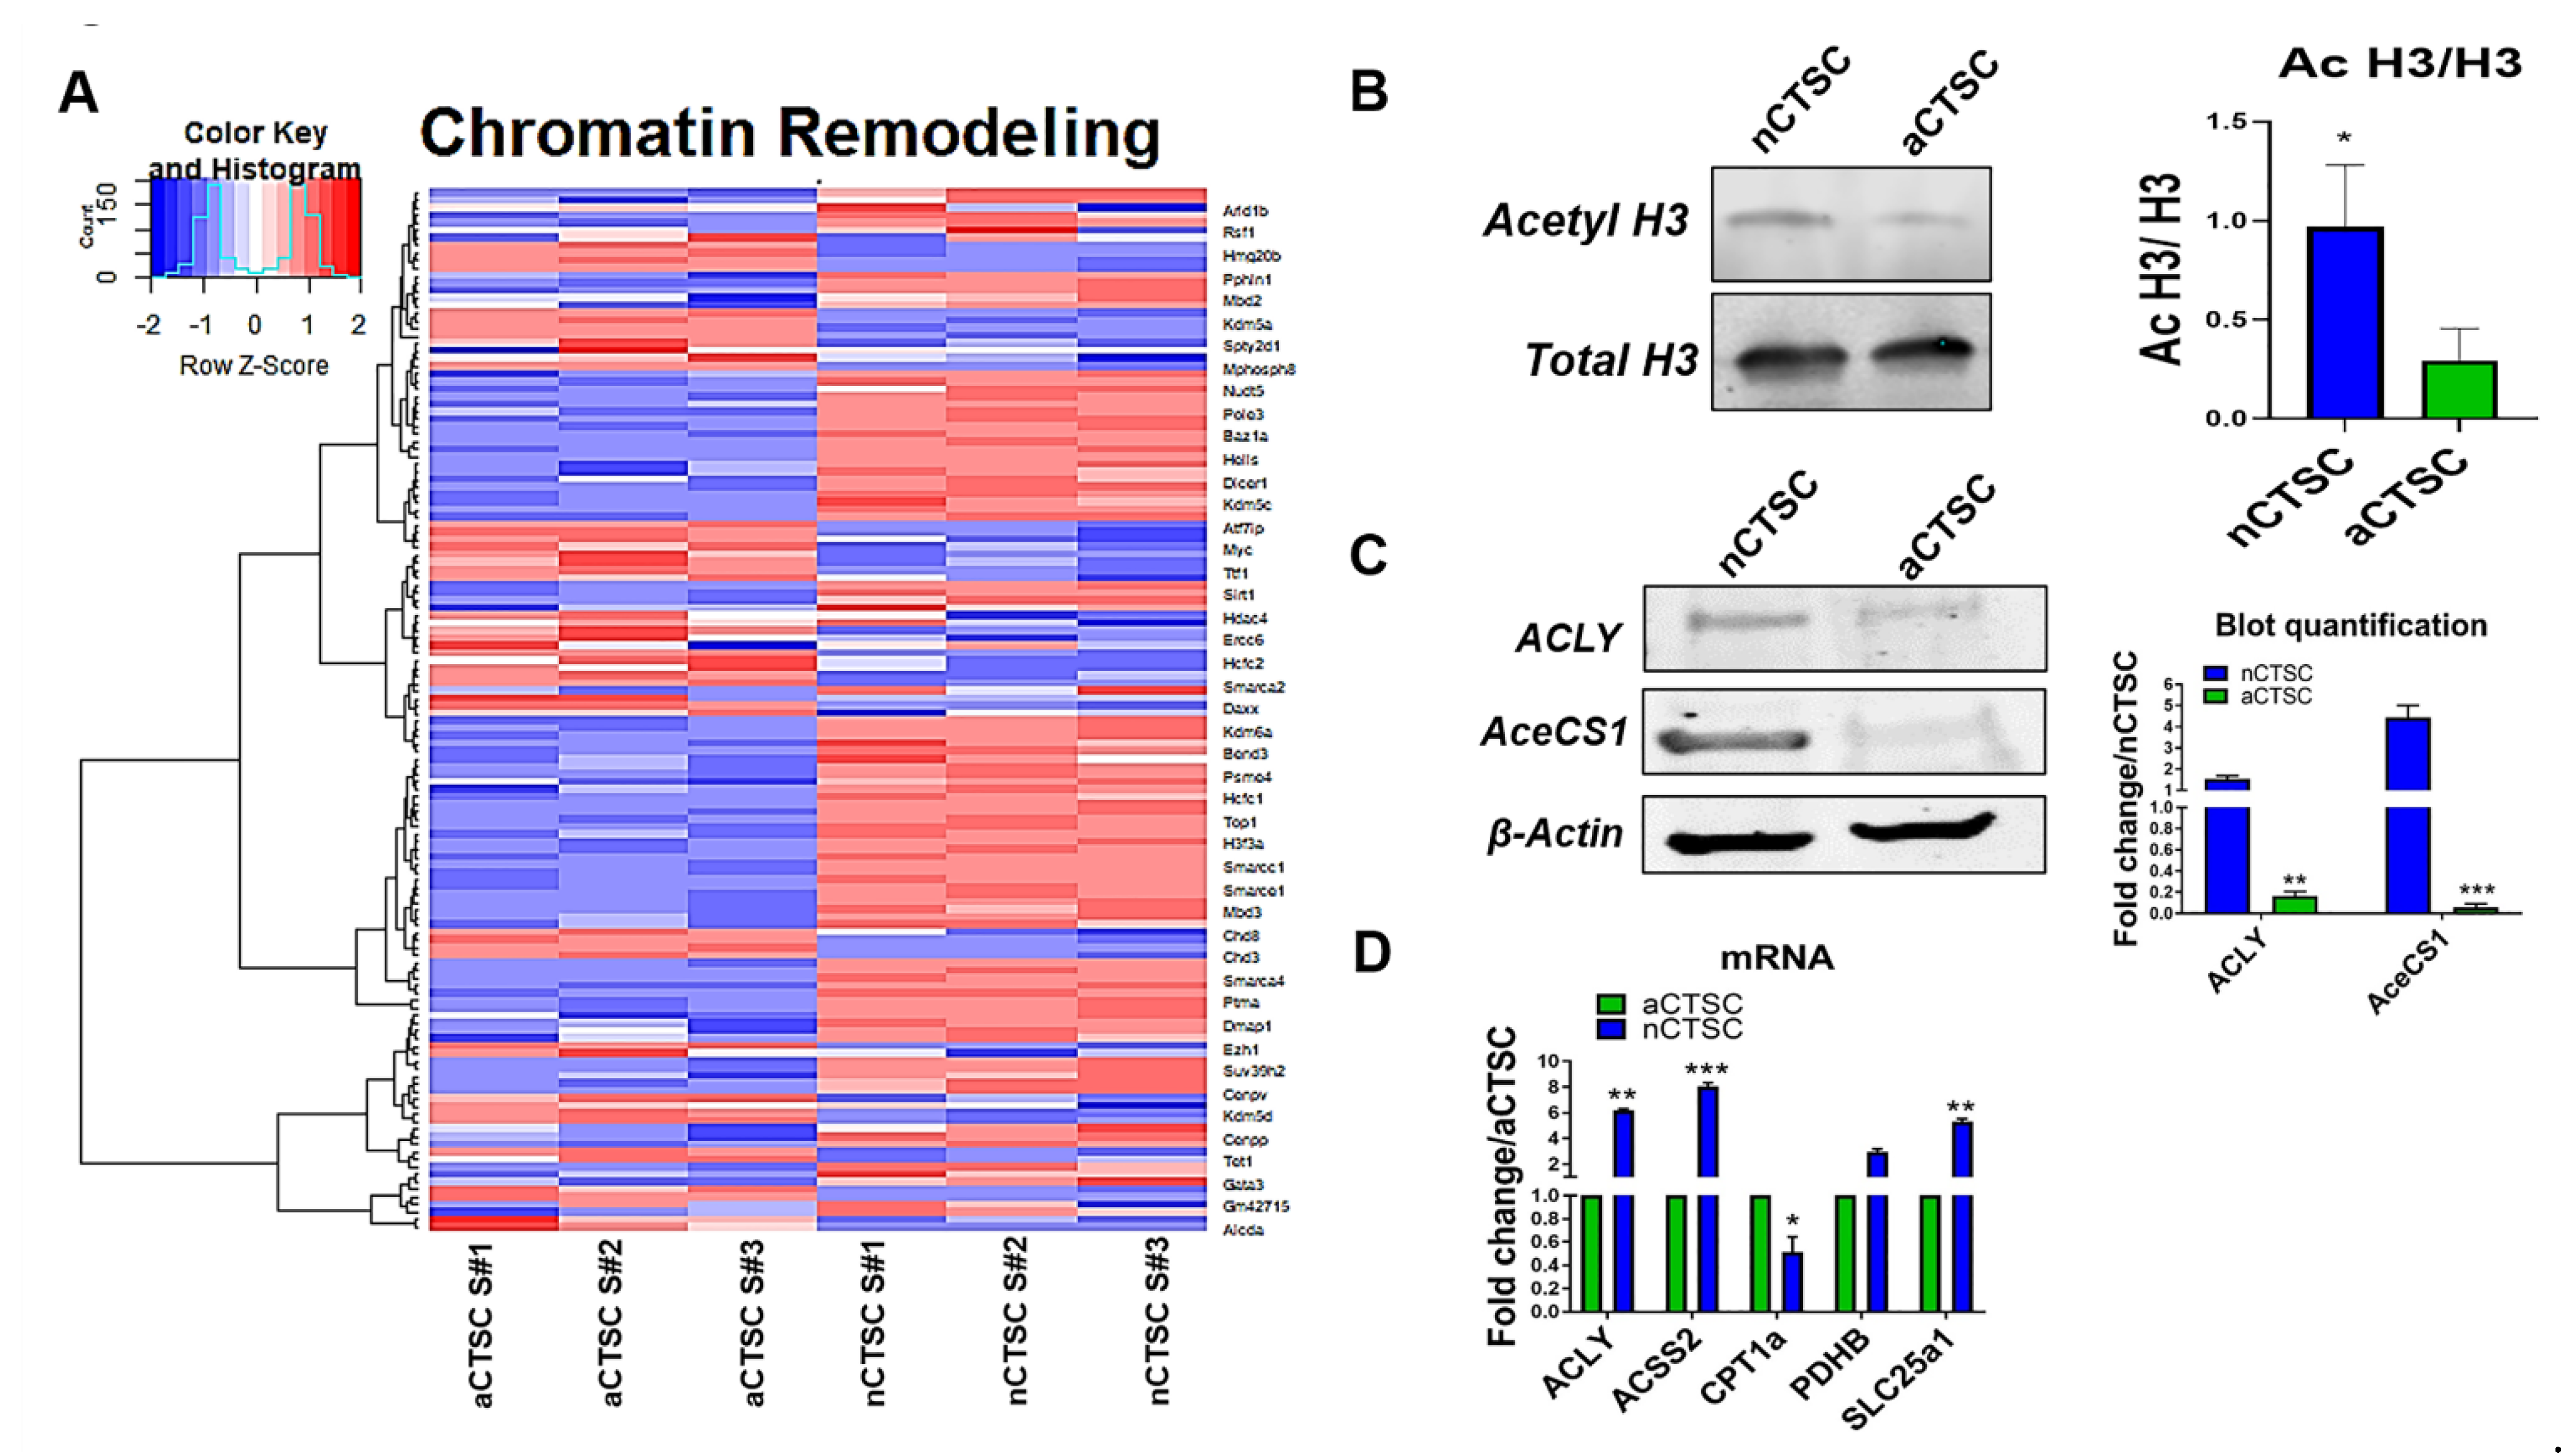
2.4. Altered ACSS2 Signaling Pathway and Chromatin Modifications in nCTSCs

Metabolites are shown to be involved in the regulation of gene expression [10,12]. Epigenetic alterations occur through the interaction of metabolites on histone residues to either open or condense chromatin. Transcriptional access to specific parts of the chromatin leads to phenotypical changes within the cells. Our data identified metabolic regulators of acetyl-CoA in nCTSCs, and we hypothesized that increased acetyl-CoA may be linked to regulation of chromatin modification in nCTSCs and is altered with CTSC age. To confirm the hypothesis, we conducted additional analysis and identified “Chromatin Remodeling” as a top enriched term (FDR 2.57 × 10⁻⁴) in cluster 4 GO analysis, along with many upregulated genes present in the nCTSC population (Figure 5A). Western blot analysis confirmed our RNA-seq data and showed a significantly increased acetylated Histone H3 to total Histone H3 ratio in the nCTSCs compared to the aCTSCs (Figure 5B). Additionally, significant increases in expression of ATP-citrate lyase (ACLY), the primary enzyme involved in the cytosolic synthesis of acetyl-CoA, and cytoplasmic acetyl-CoA synthetase (AceCS1) were observed in nCTSCs compared to aCTSCs (Figure 5C). In concordance, qRT-PCR analysis confirmed that upregulation of ACLY and ACSS2 is associated with cytoplasmic acetyl-CoA synthesis, along with low expression of mitochondrial protein CPT1a (0.6193FC) and high expression of cytosolic PDHB (2.725FC), suggesting the involvement of glycolytic flux in driving synthesis of acetyl-CoA in nCTSCs compared to aCTSCs (Figure 5D). Altogether, our data suggest that chromatin remodeling in nCTSCs may be altered by the metabolic regulation of ACSS2 by synthesizing more cytoplasmic acetyl-CoA, which potentially acetylates histone.

3. Discussion

Our findings here identify metabolic modifiers of chromatin modulation in a novel stem-like cell population termed as CTSCs in the heart during transition from young to old age. Additionally, our data identify acetyl-CoA signaling as a central hub for upstream metabolic regulators and downstream alteration of chromatin architecture. CTSCs from the neonatal heart demonstrate increased activation of the cytosolic acetyl-CoA signaling pathway together with chromatin modifications, in comparison to aCTSCs.
Cell-based therapeutics have emerged recently as a viable strategy for cardiac repair following myocardial injury. Several stem cell types have been used, but their clinical applications [3,5] were largely underwhelming due to massive loss of donated stem cells in the ischemic cardiac environment [17,18]. There is a greater need for understanding the basic biology of stem cells before clinical testing. We have recently identified a novel cell population in the heart with stem cell-like properties termed cardiac-derived stem-like cells (CTSCs) [6]. Characterization of CTSC population isolated from 2-day-old (nCTSCs) and 2-year-old hearts (aCTSC) shows a unique transcriptomic signature of cells in comparison to other known stem cell types, including cardiac tissue-derived stem/progenitor cells and cardiac cells (cardiomyocytes, fibroblasts, endothelial cells), and also shows enhanced functional properties during the neonatal stages that are lost with CTSC age. In concurrence with our findings, cardiac stem cells from the neonatal stages are known to exhibit strong regenerative properties that are altered with age [19,20]. Additionally, Castaldi and colleagues found that aged cardiac progenitor cells exhibit senescent properties, impaired mitochondrial respiration, and decreased ATP generation [20]. Whether metabolic signaling pathways play a central role in maintaining cellular function and gene expression in cardiac-derived stem cells remains unknown.
Cellular metabolism has emerged recently as a regulator of stem cell fate as well as molecular and cellular function [21,22]. Changes in environmental conditions alter energy generation in stem cells leading to a shift from a quiescent to proliferative or differentiated state [23]. In the cardiac context, cardiac stem/progenitor cells reside in hypoxic niches in a quiescent state while operating under glycolysis [24]. Emergence from the niche is associated with a shift in metabolism to oxidative phosphorylation, concurrent with loss of quiescence and acquisition of a differentiated state. Interestingly, nCTSCs exhibit glycolytic metabolism and increased proliferation rates that are largely altered with age [6]. Analysis of molecular signaling showed nCTSCs as expressing stem cell and pluripotent markers, as well as enhanced expression of cell cycle regulators. Whether cellular metabolism or metabolic regulators were responsible for unique CTSC transcriptomic profile, including ability to modulate gene expression and their alteration with age, was not tested. Therefore, in this study, we conducted data mining using bulk RNA-sequencing data from nCTSCs and aCTSCs to identify metabolic regulators that are altered with age. Our results show that the nCTSC transcriptome is significantly different from that of aCTSCs, thus implying susceptibility of CTSCs to age-associated changes in cardiac environment. These results are in concurrence with studies showing age-associated changes in cardiac stem/progenitor cells, attenuating stem cell properties and functionality [20,25]. Bioinformatic analyses revealed that nCTSC transcriptome was divided into five clusters, with cellular metabolism as one of the most prominent categories that is significantly altered in nCTSC compared to aCTSCs. Additionally, analyses identified several key metabolic genes related to the monocarboxylic acid metabolic signaling pathway being significantly altered in nCTSCs compared to aCTSCs, suggesting a critical role is played by cellular metabolism in regulation of nCTSC function, and that it is altered with age. Our results are in accordance with some recent studies that implicate a critical role of metabolism as a determinant of cell therapy effectiveness [26,27,28].
The next question that we addressed through bioinformatic approaches was how the metabolic regulators in nCTSCs affect gene expression. For this purpose, we hypothesized that metabolic regulators influence levels of metabolites and acetyl-CoA to alter gene expression. Various metabolites are known to act as secondary messengers, altering gene expression and signaling pathways in response to environmental changes. Nevertheless, the mechanistic basis for how metabolites influence signaling pathways is only now being uncovered and carries implications for regulation of molecular and cellular function in different cell types. The central metabolite, acetyl-CoA, and its relationship with histone acetylation was first reported in yeast and mammalian cells and is now well established [11,12]. Recent evidence indicates that Acetyl-CoA is essential for stem cell function and maintenance of pluripotency [23]. Pluripotent stem cells (PSCs) exhibit increased proliferative rates, supported primarily by glycolysis and shunting of glycolytic intermediates for acetyl-CoA generation [29]. Additionally, Moussaieff et al. found that PSCs produce cytosolic acetyl-CoA through glycolysis and the pyruvate-derived citrate flux via ATP citrate lyase (ACLY), while PSC differentiation shuts down this mechanism [7]. Increased cytosolic acetyl-CoA levels in PSC regulate histone acetylation, which maintains open euchromatin state, pluripotency, and self-renewal in PSCs [7]. In the cardiac context, acetyl-CoA plays a central role in cardiac energy generation, including allosteric modulation of fatty-acid, glucose oxidation, and acetylation control of cardiac energy pathways that are altered with cardiac disease states [30,31]. Nevertheless, the metabolic pathways connected to acetyl-CoA and chromatin modulation in cardiac-derived stem cells remain unknown. Our findings show that age-dependent alterations in metabolic pathways and acetyl-CoA levels in CTSCs derived from the heart, as well as changes in histone acetylation and chromatin modifications, are in concurrence with recent findings on acetyl-CoA mediated chromatin regulation in other organ systems. In summary, our findings link metabolism to maintenance of chromatin state and gene regulation in CTSCs, which are largely altered with age.

4. Materials and Methods

4.1. Cell Isolation and Culture

Cell isolation and maintenance of CTSCs were performed as previously described [6]. Additional details in the online Data Supplement.

4.2. RNA Sequencing

CTSCs were prepared for bulk RNA sequencing with three replicates of each CTSC line, consisting of 1 million cells per replicate cultured at passage 10 for 48 h prior to sequencing. Samples were sent out to GeneWiz for RNA isolation, cDNA library construction, and sequencing. In brief, RNA was isolated from cells by GeneWiz, including mRNA sequencing via PolyA selection. Library preparation involved fragmentation and random priming, strand cDNA synthesis, end repair, and adapter ligation with polymerase chain reaction (PCR) enrichment for sequencing. Sequencing was carried out on Illumina HiSeq System with 2 × 150 bp PE HO configuration.

4.3. Bioinformatics Analysis

Raw data quality was evaluated with FastQC. Reads were trimmed using Trimmomatric v. 0.36 to remove adapter sequences and poor-quality nucleotides. Reads were then mapped onto Mus musculus GRCm38 reference genome using STAR aligner v. 2.5.2b. Genome was available on ENSEMBL. Generated BAM files were used to extract unique gene-hit counts using FeatureCounts from Subread package v. 1.5.2. Differentially expressed genes (DEG) were identified on mapped reads, followed by downstream differential expression analysis using R package DESeq2. Genes with less than 5 reads per sample were removed. The Wald test was used to statistically identify genes with p value < 0.05. Using regularized logarithm (rlog) function, count data were transformed for visualization on a log2 scale. K-means clustering was performed to identify subgroups of genes that were subjected for downstream enrichment analysis. Number of clusters were determined using elbow method.

4.4. Functional Analysis

Clustered DEGs were uploaded onto the gene ontology enrichment analysis and visualization (GOrilla) server to identify significantly enriched Biological Process GO terms. Heatmaps were generated using R package ggplots on specific GO terms. Clustered genes were uploaded for pathway enrichment through Ingenuity Pathway Analysis (IPA) software to identify canonical pathways for biological relevance. Cytoscape’s STRING database was used to identify and generate functional protein interaction networks. The GO term list generated from each cluster via GOrilla was uploaded onto online server Reduce + Visualize Gen Ontology (REViGO) to summarize and remove redundant terms.

4.5. Reverse Transcriptase Polymerase Chain Reaction

CTSCs RNA extraction and purification were completed using manufacturer’s instructions (Qiagen, Germantown, MD, USA). After RNA quantification (Nanodrop), cDNA was created using iScript cDNA Synthesis Kit (Bio-Rad, Hercules, CA, USA). Amplification was conducted using SimpliAmp thermocycler (Applied Biosystems, Waltham, MA, USA). Real-time polymerase chain reaction (RT-PCR) was conducted by running samples on StepOnePlus RT-PCR System (Applied Biosystems). Primers were created from Life Technologies, and the sequences are included in the Table S1.

4.6. Western Blot

Immunoblot analysis was performed as previously described [6,32,33] and list of antibodies is included in Table S2.

4.7. Statistical Analysis

Statistical analysis was performed using unpaired Student’s t test for data comparing two groups. For data that do not exhibit normal distribution, the Mann–Whitney test was used. All data sets were assessed for normality using the Shapiro–Wilk test. p < 0.05 is considered statistically significant. Error bars represent ±SD. Statistical analysis is performed using Graph Pad prism v 8.0 software (GraphPad Software Inc., San Diego, CA, USA).

5. Conclusions

Here, we report on the interplay between metabolism and chromatin modifications present in nCTSCs. Our previous study reports that the nCTSCs maintain stemness, are more proliferative with a unique secretome, and are more glycolytically driven than their aged counterparts. RNA-seq analysis reveals that the increased Acyl-coenzyme A synthetase short-chain family member 2 (ACSS2) levels lead to more Acetyl-CoA availability for histone acetylation. This regulated gene expression through metabolism may be a promising avenue for future studies focusing on how stem cells maintain their therapeutic profile.

Supplementary Materials

The following are available online at https://www.mdpi.com/article/10.3390/ijms22136987/s1.

Author Contributions

Conceptualization, M.K. and J.K.; methodology, J.K.; software, J.K.; validation, V.B., J.K. and M.B.; formal analysis, J.K.; writing—original draft preparation, J.K.; writing—review and editing, S.M. and M.K.; supervision, M.K.; funding acquisition, M.K. All authors have read and agreed to the published version of the manuscript.

Funding

This research was funded by National Institute of Health grant HL135177, and H1801 WW Smith Charitable Trust to M. Khan and HL137850 to S. Mohsin.

Institutional Review Board Statement

All animal procedures were approved by Temple Institutional Animal Care and Use Committee (IACUC).

Informed Consent Statement

Not applicable.

Data Availability Statement

Data is contained within the article and Supplementary Material.

Acknowledgments

We thank all members of the Khan laboratory for their valuable discussions.

Conflicts of Interest

The authors declare no conflict of interest.

References

  1. Mohsin, S.; Khan, M.; Toko, H.; Bailey, B.; Cottage, C.T.; Wallach, K.; Nag, D.; Lee, A.; Siddiqi, S.; Lan, F.; et al. Human cardiac progenitor cells engineered with Pim-I kinase enhance myocardial repair. J. Am. Coll. Cardiol. 2012, 60, 1278–1287. [Google Scholar] [CrossRef] [Green Version]
  2. Haider, H.; Jiang, S.; Idris, N.M.; Ashraf, M. IGF-1-overexpressing mesenchymal stem cells accelerate bone marrow stem cell mobilization via paracrine activation of SDF-1alpha/CXCR4 signaling to promote myocardial repair. Circ. Res. 2008, 103, 1300–1308. [Google Scholar] [CrossRef] [Green Version]
  3. Bolli, R.; Mitrani, R.D.; Hare, J.M.; Pepine, C.J.; Perin, E.C.; Willerson, J.T.; Traverse, J.H.; Henry, T.D.; Yang, P.C.; Murphy, M.P.; et al. Cardiovascular Cell Therapy Research, A Phase II study of autologous mesenchymal stromal cells and c-kit positive cardiac cells, alone or in combination, in patients with ischaemic heart failure: The CCTRN CONCERT-HF trial. Eur. J. Heart Fail. 2021, 23, 661–674. [Google Scholar] [CrossRef] [PubMed]
  4. Mohsin, S.; Siddiqi, S.; Collins, B.; Sussman, M.A. Empowering adult stem cells for myocardial regeneration. Circ. Res. 2011, 109, 1415–1428. [Google Scholar] [CrossRef] [Green Version]
  5. Makkar, R.R.; Smith, R.R.; Cheng, K.; Malliaras, K.; Thomson, L.E.; Berman, D.; Czer, L.S.; Marban, L.; Mendizabal, A.; Johnston, P.V.; et al. Intracoronary cardiosphere-derived cells for heart regeneration after myocardial infarction (CADUCEUS): A prospective, randomised phase 1 trial. Lancet 2012, 379, 895–904. [Google Scholar] [CrossRef] [Green Version]
  6. Kurian, J.; Yuko, A.E.; Kasatkin, N.; Rigaud, V.O.C.; Busch, K.; Harlamova, D.; Wagner, M.; Recchia, F.A.; Wang, H.; Mohsin, S.; et al. Uncoupling protein 2-mediated metabolic adaptations define cardiac cell function in the heart during transition from young to old age. Stem Cells Transl. Med. 2020. [CrossRef]
  7. Moussaieff, A.; Rouleau, M.; Kitsberg, D.; Cohen, M.; Levy, G.; Barasch, D.; Nemirovski, A.; Shen-Orr, S.; Laevsky, I.; Amit, M.; et al. Glycolysis-mediated changes in acetyl-CoA and histone acetylation control the early differentiation of embryonic stem cells. Cell Metab. 2015, 21, 392–402. [Google Scholar] [CrossRef] [PubMed] [Green Version]
  8. Ito, K.; Suda, T. Metabolic requirements for the maintenance of self-renewing stem cells. Nat. Rev. Mol. Cell Biol. 2014, 15, 243–256. [Google Scholar] [CrossRef] [PubMed] [Green Version]
  9. Campbell, S.L.; Wellen, K.E. Metabolic Signaling to the Nucleus in Cancer. Mol. Cell 2018, 71, 398–408. [Google Scholar] [CrossRef] [Green Version]
  10. Trefely, S.; Lovell, C.D.; Snyder, N.W.; Wellen, K.E. Compartmentalised acyl-CoA metabolism and roles in chromatin regulation. Mol. Metab. 2020, 38, 100941. [Google Scholar] [CrossRef] [PubMed]
  11. Takahashi, H.; McCaffery, J.M.; Irizarry, R.A.; Boeke, J.D. Nucleocytosolic acetyl-coenzyme a synthetase is required for histone acetylation and global transcription. Mol. Cell 2006, 23, 207–217. [Google Scholar] [CrossRef] [PubMed]
  12. Wellen, K.E.; Hatzivassiliou, G.; Sachdeva, U.M.; Bui, T.V.; Cross, J.R.; Thompson, C.B. ATP-citrate lyase links cellular metabolism to histone acetylation. Science 2009, 324, 1076–1080. [Google Scholar] [CrossRef] [PubMed] [Green Version]
  13. Choudhary, C.; Weinert, B.T.; Nishida, Y.; Verdin, E.; Mann, M. The growing landscape of lysine acetylation links metabolism and cell signaling. Nat. Rev. Mol. Cell Biol. 2009, 15, 536–550. [Google Scholar] [CrossRef] [PubMed]
  14. Pietrocola, F.; Galluzzi, L.; Bravo-San Pedro, J.M.; Madeo, F.; Kroemer, G. Acetyl coenzyme A: A central metabolite and second messenger. Cell Metab. 2015, 21, 805–821. [Google Scholar] [CrossRef] [PubMed] [Green Version]
  15. Gilsbach, R.; Schwaderer, M.; Preissl, S.; Gruning, B.A.; Kranzhofer, D.; Schneider, P.; Nuhrenberg, T.G.; Mulero-Navarro, S.; Weichenhan, D.; Braun, C.; et al. Distinct epigenetic programs regulate cardiac myocyte development and disease in the human heart in vivo. Nat. Commun. 2018, 9, 391. [Google Scholar] [CrossRef] [PubMed] [Green Version]
  16. Han, P.; Hang, C.T.; Yang, J.; Chang, C.P. Chromatin remodeling in cardiovascular development and physiology. Circ. Res. 2011, 108, 378–396. [Google Scholar] [CrossRef] [PubMed] [Green Version]
  17. Dow, J.; Simkhovich, B.Z.; Kedes, L.; Kloner, R.A. Washout of transplanted cells from the heart: A potential new hurdle for cell transplantation therapy. Cardiovasc. Res. 2005, 67, 301–307. [Google Scholar] [CrossRef]
  18. Hong, K.U.; Li, Q.H.; Guo, Y.; Patton, N.S.; Moktar, A.; Bhatnagar, A.; Bolli, R. A highly sensitive and accurate method to quantify absolute numbers of c-kit+ cardiac stem cells following transplantation in mice. Basic Res. Cardiol. 2013, 108, 346. [Google Scholar] [CrossRef] [PubMed]
  19. Simpson, D.L.; Mishra, R.; Sharma, S.; Goh, S.K.; Deshmukh, S.; Kaushal, S. A strong regenerative ability of cardiac stem cells derived from neonatal hearts. Circulation 2012, 126 (Suppl. 1), S46–S53. [Google Scholar] [CrossRef] [Green Version]
  20. Castaldi, A.; Dodia, R.M.; Orogo, A.M.; Zambrano, C.M.; Najor, R.H.; Gustafsson, A.B.; Heller Brown, J.; Purcell, N.H. Decline in cellular function of aged mouse c-kit(+) cardiac progenitor cells. J. Physiol. 2017, 595, 6249–6262. [Google Scholar] [CrossRef] [PubMed] [Green Version]
  21. Wang, W.E.; Yang, D.; Li, L.; Wang, W.; Peng, Y.; Chen, C.; Chen, P.; Xia, X.; Wang, H.; Jiang, J.; et al. Prolyl hydroxylase domain protein 2 silencing enhances the survival and paracrine function of transplanted adipose-derived stem cells in infarcted myocardium. Circ. Res. 2013, 113, 288–300. [Google Scholar] [CrossRef] [PubMed]
  22. Wu, Q.; Liu, Q.; Zhan, J.; Wang, Q.; Zhang, D.; He, S.; Pu, S.; Zhou, Z. Cited2 regulates proliferation and survival in young and old mouse cardiac stem cells. BMC Mol. Cell Biol. 2019, 20, 25. [Google Scholar] [CrossRef] [Green Version]
  23. Shyh-Chang, N.; Ng, H.H. The metabolic programming of stem cells. Genes Dev. 2017, 31, 336–346. [Google Scholar] [CrossRef] [Green Version]
  24. Kimura, W.; Sadek, H.A. The cardiac hypoxic niche: Emerging role of hypoxic microenvironment in cardiac progenitors. Cardiovasc. Diagn. Ther. 2012, 2, 278–289. [Google Scholar]
  25. Khan, M.; Mohsin, S.; Khan, S.N.; Riazuddin, S. Repair of senescent myocardium by mesenchymal stem cells is dependent on the age of donor mice. J. Cell Mol. Med. 2011, 15, 1515–1527. [Google Scholar] [CrossRef] [PubMed] [Green Version]
  26. Beegle, J.; Lakatos, K.; Kalomoiris, S.; Stewart, H.; Isseroff, R.R.; Nolta, J.A.; Fierro, F.A. Hypoxic preconditioning of mesenchymal stromal cells induces metabolic changes, enhances survival, and promotes cell retention in vivo. Stem Cells 2015, 33, 1818–1828. [Google Scholar] [CrossRef]
  27. Derlet, A.; Rasper, T.; Roy Choudhury, A.; Bothur, S.; Rieger, M.A.; Namgaladze, D.; Fischer, A.; Schurmann, C.; Brandes, R.P.; Tschulena, U.; et al. Metabolism Regulates Cellular Functions of Bone Marrow-Derived Cells used for Cardiac Therapy. Stem Cells 2016, 34, 2236–2248. [Google Scholar] [CrossRef] [PubMed]
  28. Salazar-Noratto, G.E.; Luo, G.; Denoeud, C.; Padrona, M.; Moya, A.; Bensidhoum, M.; Bizios, R.; Potier, E.; Logeart-Avramoglou, D.; Petite, H. Understanding and leveraging cell metabolism to enhance mesenchymal stem cell transplantation survival in tissue engineering and regenerative medicine applications. Stem Cells 2020, 38, 22–33. [Google Scholar] [CrossRef] [Green Version]
  29. Zhang, J.; Nuebel, E.; Daley, G.Q.; Koehler, C.M.; Teitell, M.A. Metabolic regulation in pluripotent stem cells during reprogramming and self-renewal. Cell Stem Cell 2012, 11, 589–595. [Google Scholar] [CrossRef] [Green Version]
  30. Newman, J.C.; He, W.; Verdin, E. Mitochondrial protein acylation and intermediary metabolism: Regulation by sirtuins and implications for metabolic disease. J. Biol. Chem. 2012, 287, 42436–42443. [Google Scholar] [CrossRef] [PubMed] [Green Version]
  31. Pillai, V.B.; Sundaresan, N.R.; Gupta, M.P. Regulation of Akt signaling by sirtuins: Its implication in cardiac hypertrophy and aging. Circ. Res. 2014, 114, 368–378. [Google Scholar] [CrossRef] [Green Version]
  32. Borden, A.; Kurian, J.; Nickoloff, E.; Yang, Y.; Troupes, C.D.; Ibetti, J.; Lucchese, A.M.; Gao, E.; Mohsin, S.; Koch, W.J.; et al. Transient Introduction of miR-294 in the Heart Promotes Cardiomyocyte Cell Cycle Reentry After Injury. Circ. Res. 2019, 125, 14–25. [Google Scholar] [CrossRef] [PubMed]
  33. Khan, M.; Nickoloff, E.; Abramova, T.; Johnson, J.; Verma, S.K.; Krishnamurthy, P.; Mackie, A.R.; Vaughan, E.; Garikipati, V.N.; Benedict, C.; et al. Embryonic stem cell-derived exosomes promote endogenous repair mechanisms and enhance cardiac function following myocardial infarction. Circ. Res. 2015, 117, 52–64. [Google Scholar] [CrossRef] [Green Version]
Figure 1. Schematic representation of workflow. (A) Cells from distinctly aged mice were isolated and cultured. Cell pellets from 3 replicates were used for RNA extraction and sequencing. Downstream analysis was performed by comparing nCTSC vs. aCTSC genes, with adjusted p-values less than 0.05. (B) Direct comparison of differentially expressed genes (DEG) that are significantly upregulated and downregulated between nCTSC and aCTSC. Total of 14,274 genes were identified. (C) Volcano plot visualizing genes based on log2 Fold-Change vs. −log10 (adjusted p-value). Thresholds of log2 FC (±1.5) and −log10 (adjusted p value) (>5). Each dot represents a gene and is colored in respect to its value. (D) Heatmap was generated using the rlog values (DESeq2) of the top 10,000 most-variable genes present in transcriptomic comparison. Values are normalized in row z-score range between −2 and 2.
Ijms 22 06987 g001
Figure 2. Distinct processes present in each cluster through Gene Ontology (GO) enrichment. (A) Principal coordinates analysis of transcriptomic data comparing the two samples. (B) Correlation matrix compares nCTSC with aCTSC using Pearson correlation coefficient. (C) Heatmap visualizing five clusters distinctly identified using elbow method and subjected to GO enrichment.
Ijms 22 06987 g002
Figure 3. Functional analysis of each cluster. Top 10 GO terms generated from GO Biological Processes analysis for each cluster depicting −log10 (FDR) and enrichment values and Ingenuity Pathway Analysis (IPA) together with Top 10 canonical pathways presented based on –log(p-value) for (A) Cluster 1, (B) Cluster 2, (C) Cluster 3, (D) Cluster 4, (E) Cluster 5.
Ijms 22 06987 g003
Figure 4. Metabolic processes in cluster 1 related to ACSS2. (A) REVIGO analysis of cluster 1 visualizing similar GO terms grouped together in semantic space. (B) Heatmap of GO terms: monocarboxylic acid metabolic process. (C) Top 10 genes present in cluster 1 identified by STRING database and visualized through Cytoscape to show potential interaction with ACSS2. (D) Protein–protein interaction network of genes from cluster 1 that directly interact with Acyl-CoA synthetase short-chain family member 2 protein (ACSS2). Color of each protein ranges from white to red and corresponds to each gene logFC.
Ijms 22 06987 g004
Figure 5. Acetyl-CoA-mediated modulation of chromatin modifications and histone acetylation in nCTSC. (A) Assessment of genes involved in GO term: chromatin remodeling. (B) Increased expression of Acetyl H3: total H3 found in nCTSC compared to aCTSC (n = 3). (C) Immunoblot revealing increased protein expression of ACLY and AceCS1 in the nCTSC (n = 3). (D) Increased mRNA expression of ACSS2 and glycolytic enzymes along with reduced fatty-acid metabolic activity present in nCTSC by qRT-PCR (n = 3). nCTSC vs. aCTSC * p  < 0.05, ** p  < 0.01, *** p  <  0.001.
Ijms 22 06987 g005
Table 1. Top 10 genes/GO terms in each cluster.
Cluster 1MetabolismGO DescriptionTop GeneLogFCadj. p-Value
GO:0044255Cellular lipid Metabolic processLipa1.8804287978.3778 × 10−265
GO:0006629Lipid metabolic processLima11.3865592174.9641 × 10−287
GO:0055114oxidation-reduction processP4ha11.2164355274.0584 × 10−292
GO:0032787monocarboxylic acid metabolic processIdh11.5848980681.4915 × 10−241
GO:0044242cellular lipid catabolic processAsah10.9633409361.8342 × 10−167
GO:0051092positive regulation of NF-kappaB transcription factor activityIl1rap2.2532451624.1379 × 10−303
GO:0008610lipid biosynthetic processSerinc10.9861066667.161 × 10−242
GO:0072329monocarboxylic acid catabolic processIlvbl2.1856769221.048 × 10−151
GO:0034389lipid droplet organizationSqle0.9209636764.2693 × 10−134
GO:0044281small molecule metabolic processCd440.9961984935.32 × 10−285
Cluster 2ImmuneGO DescriptionTop GenelogFCadj. p-Value
GO:0006952defense responseRtp44.1325928711.8172 × 10−298
GO:0051707response to other organismUsp186.25734261.7065 × 10−301
GO:0043207response to external biotic stimulusStat12.5894084091.0021 × 10−269
GO:0002376immune system processIfi446.779964218.9746 × 10−266
GO:0009607response to biotic stimulusMlkl4.4406727777.6562 × 10−261
GO:0006955immune responseCyba6.4011611962.3696 × 10−247
GO:0051704multi-organism processIfit22.8688757897.9652 × 10−245
GO:0009605response to external stimulusGbp34.8604478794.3027 × 10−236
GO:0009615response to virusOasl27.6483772662.6227 × 10−227
GO:0098542defense response to other organismIrgm24.9304209134.1127 × 10−205
Cluster 3DevelopmentGO DescriptionTop GenelogFCadj. p-Value
GO:0032502developmental processSlc6a17−3.4935870341.5326 × 10−295
GO:0048869cellular developmental processKazald1−4.334894281.468 × 10−281
GO:0051239regulation of multicellular organismal processFam19a5−4.1231219714.1061 × 10−272
GO:0032501multicellular organismal processPlxnb1−4.4475055693.2518 × 10−270
GO:0050793regulation of developmental processTenm3−7.8912817182.4011 × 10−266
GO:0009653anatomical structure morphogenesisJag1−3.6083777163.508 × 10−228
GO:2000026regulation of multicellular organismal developmentPrdm16−3.5685653219.015 × 10−253
GO:0051094positive regulation of developmental processP2rx7−6.0080247761.4826 × 10−187
GO:0007155cell adhesionSele−5.0337337394.4538 × 10−253
GO:0022610biological adhesionCol12a1−3.8222950069.6969 × 10−249
Cluster 4Gene ExpressionGO DescriptionTop GenelogFCadj. p-Value
GO:0090304nucleic acid metabolic processSet−1.1089816551.9585 × 10−289
GO:0016070RNA metabolic processDdx3x−1.0816986423.464 × 10−268
GO:0006139nucleobase-containing compound metabolic processRan−1.0187980751.1 × 10−244
GO:0006396RNA processingTardbp−1.2655024775.7847 × 10−261
GO:0046483heterocycle metabolic processDhx9−1.0627682391.0373 × 10−192
GO:0006725cellular aromatic compound metabolic processGspt1−1.021883821.6288 × 10−189
GO:0034641cellular nitrogen compound metabolic processMbnl1−0.977591756.1882 × 10−188
GO:1901360organic cyclic compound metabolic processSmc1a−1.2550232321.3984 × 10−187
GO:0034660ncRNA metabolic processRpl11−0.8343392985.4663 × 10−171
GO:0043170macromolecule metabolic processSrsf3−1.2323006457.5139 × 10−239
Cluster 5Cell CycleGO DescriptionTop GenelogFCadj. p-Value
GO:0007049cell cycleBirc5−2.606563712.1503 × 10−303
GO:1903047mitotic cell cycle processTgfb1−1.6952886955.3792 × 10−306
GO:0022402cell cycle processPrc1−1.7630091437.0517 × 10−300
GO:0006260DNA replicationCcdc88a−1.5964743511.4062 × 10−302
GO:0006259DNA metabolic processNasp−2.488623781.2227 × 10−294
GO:0051301cell divisionCad−1.5499026843.5803 × 10−285
GO:0051276chromosome organizationCenpe−1.7759216636.4099 × 10−272
GO:0010564regulation of cell cycle processRanbp1−0.3919606171.1679 × 10−295
GO:0051983regulation of chromosome segregationRacgap1−1.685938938.6581 × 10−262
GO:0051726regulation of cell cycleCenpf−2.0998421971.7343 × 10−268
Publisher’s Note: MDPI stays neutral with regard to jurisdictional claims in published maps and institutional affiliations.

