
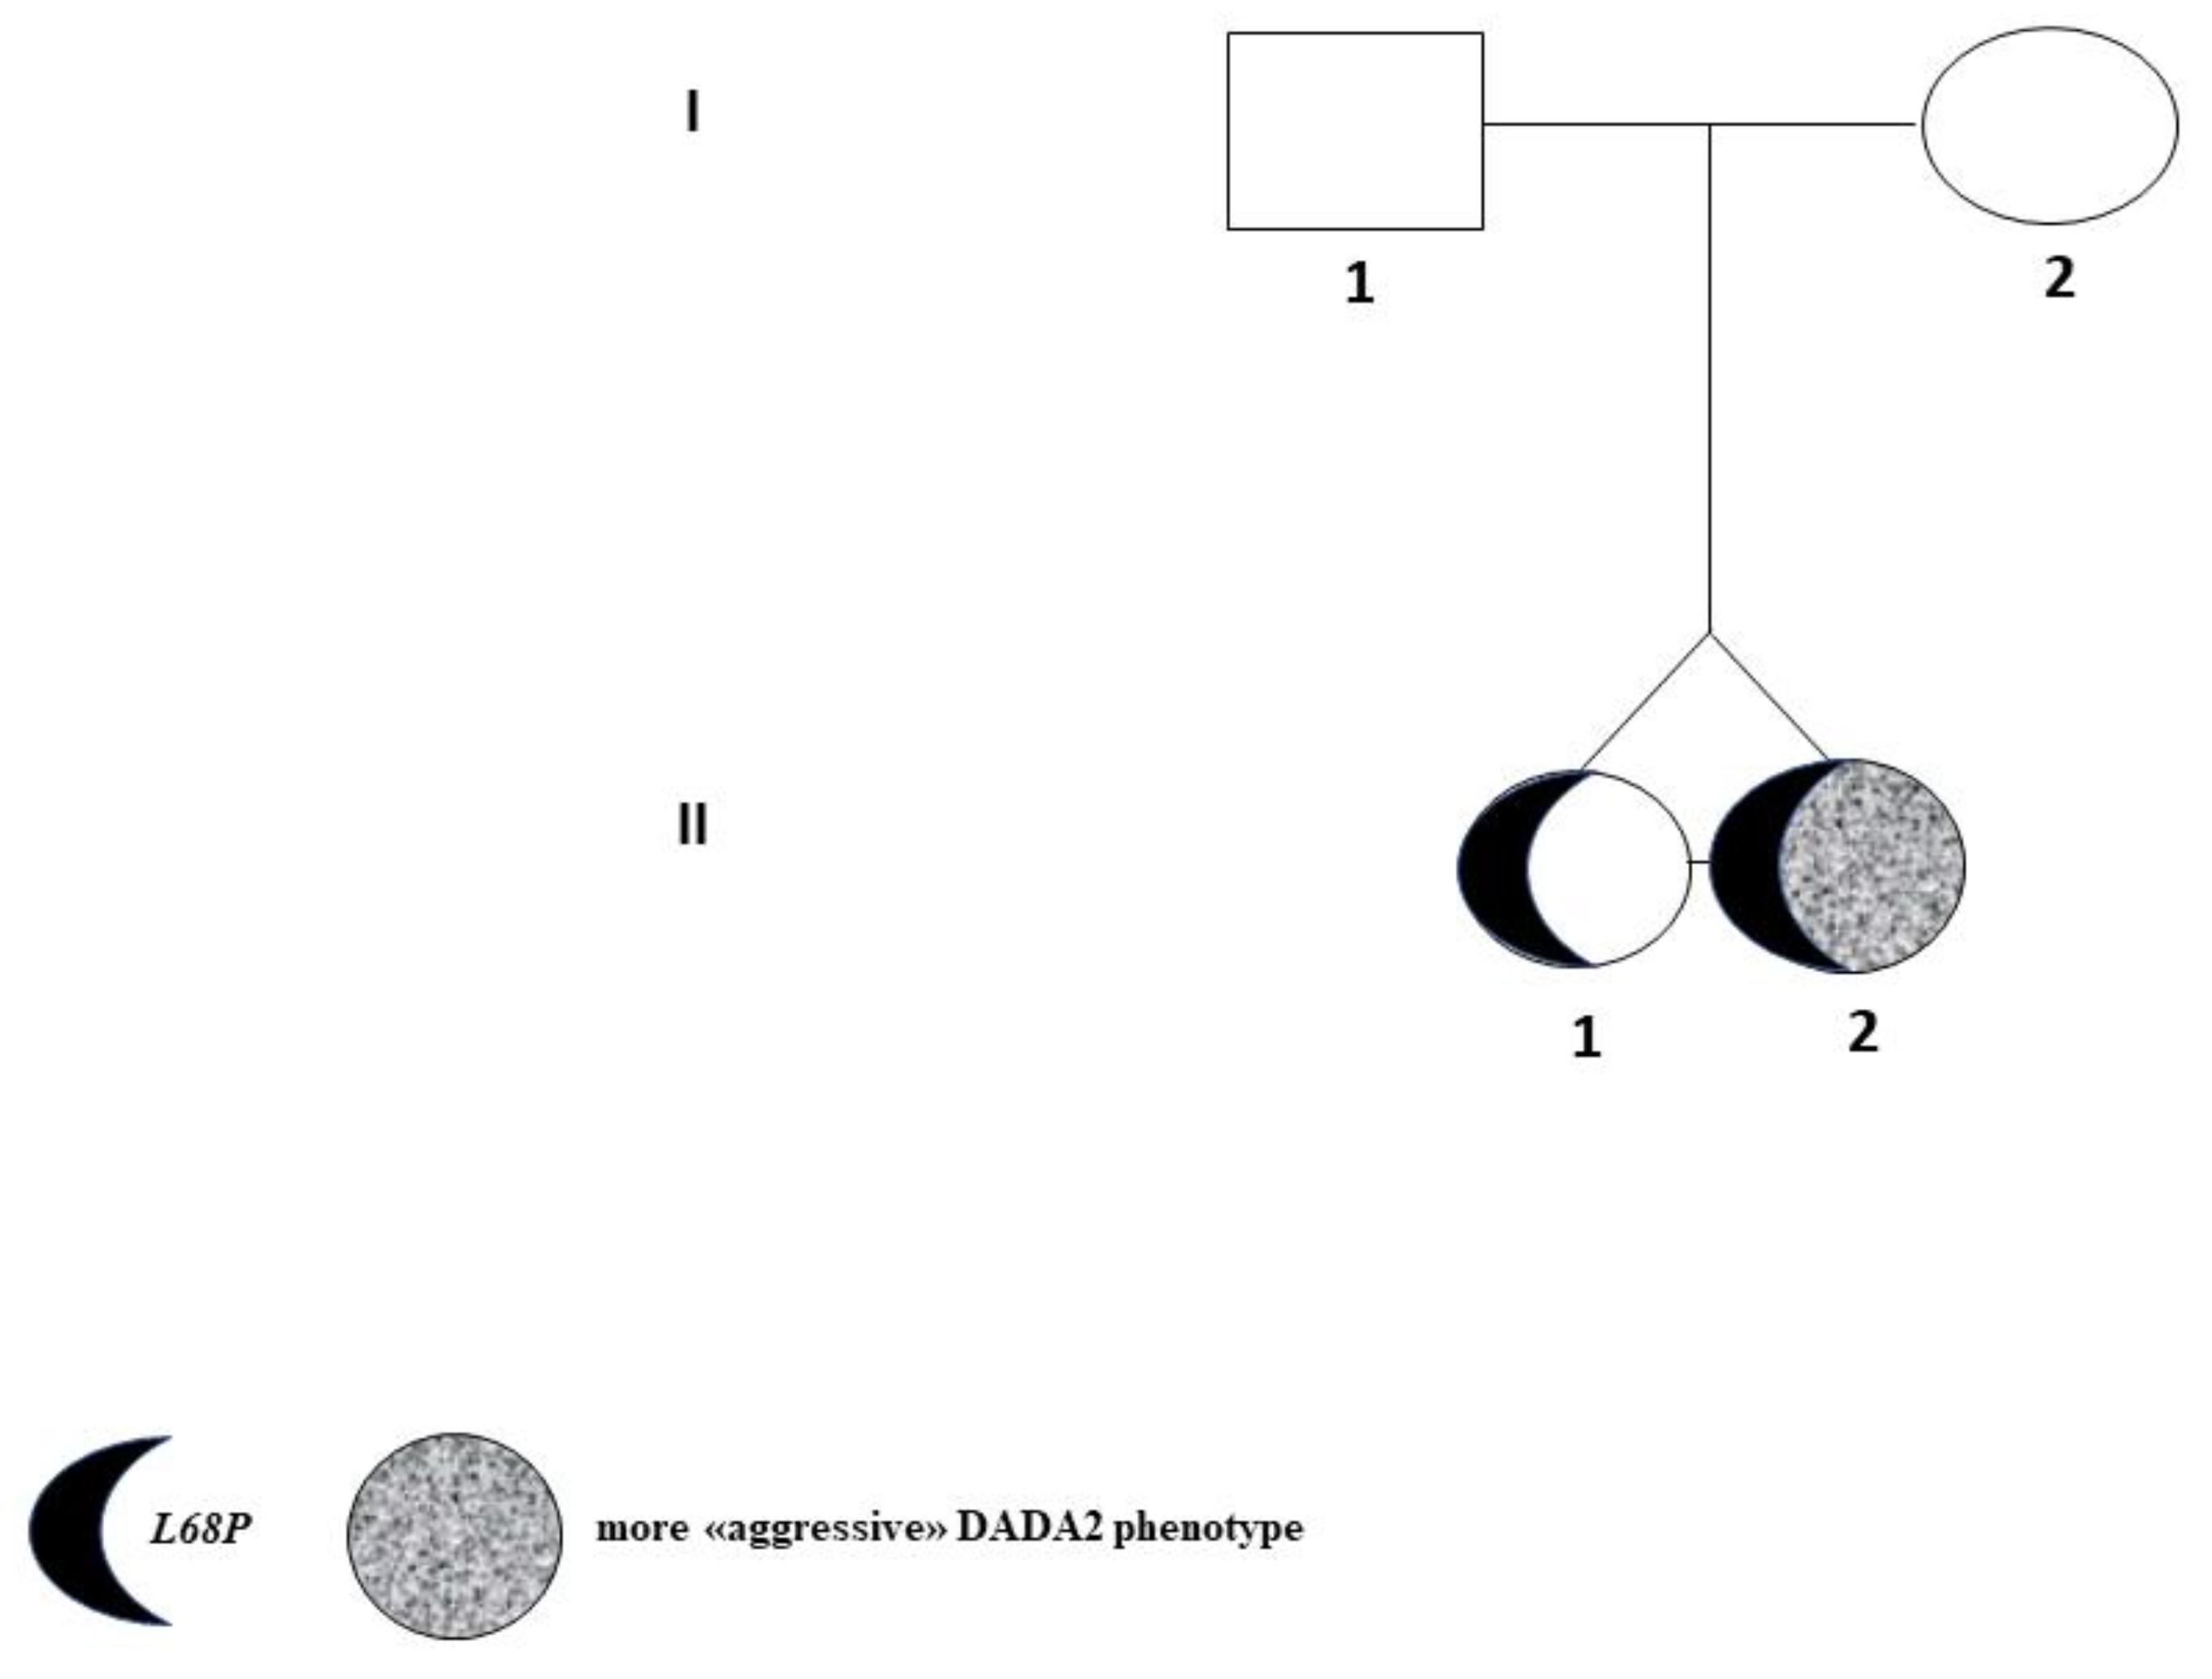
A Novel Germline Mutation of ADA2 Gene in Two “Discordant” Homozygous Female Twins Affected by Adenosine Deaminase 2 Deficiency: Description of the Bone-Related Phenotype


 , , , and
Abstract
:1. Introduction
1.1. General Information on Ada2 Enzyme
1.2. How Could the Role of Ada2 Protein in Bone Physiopathology Be Explained?
1.3. Ada2 Receptors in Bone Cells: Co-Starring Actors
2. Case Reports
3. Materials and Methods
3.1. Bone Phenotyping
3.1.1. Dual Energy X-ray Absorptiometry (DXA)
3.1.2. Spine X-rays
3.1.3. Bone-Mineral Metabolism, and Hormonal Biochemical Analyses
3.2. Mutational Analysis
3.3. ADA2 Enzymatic Activity
4. Results
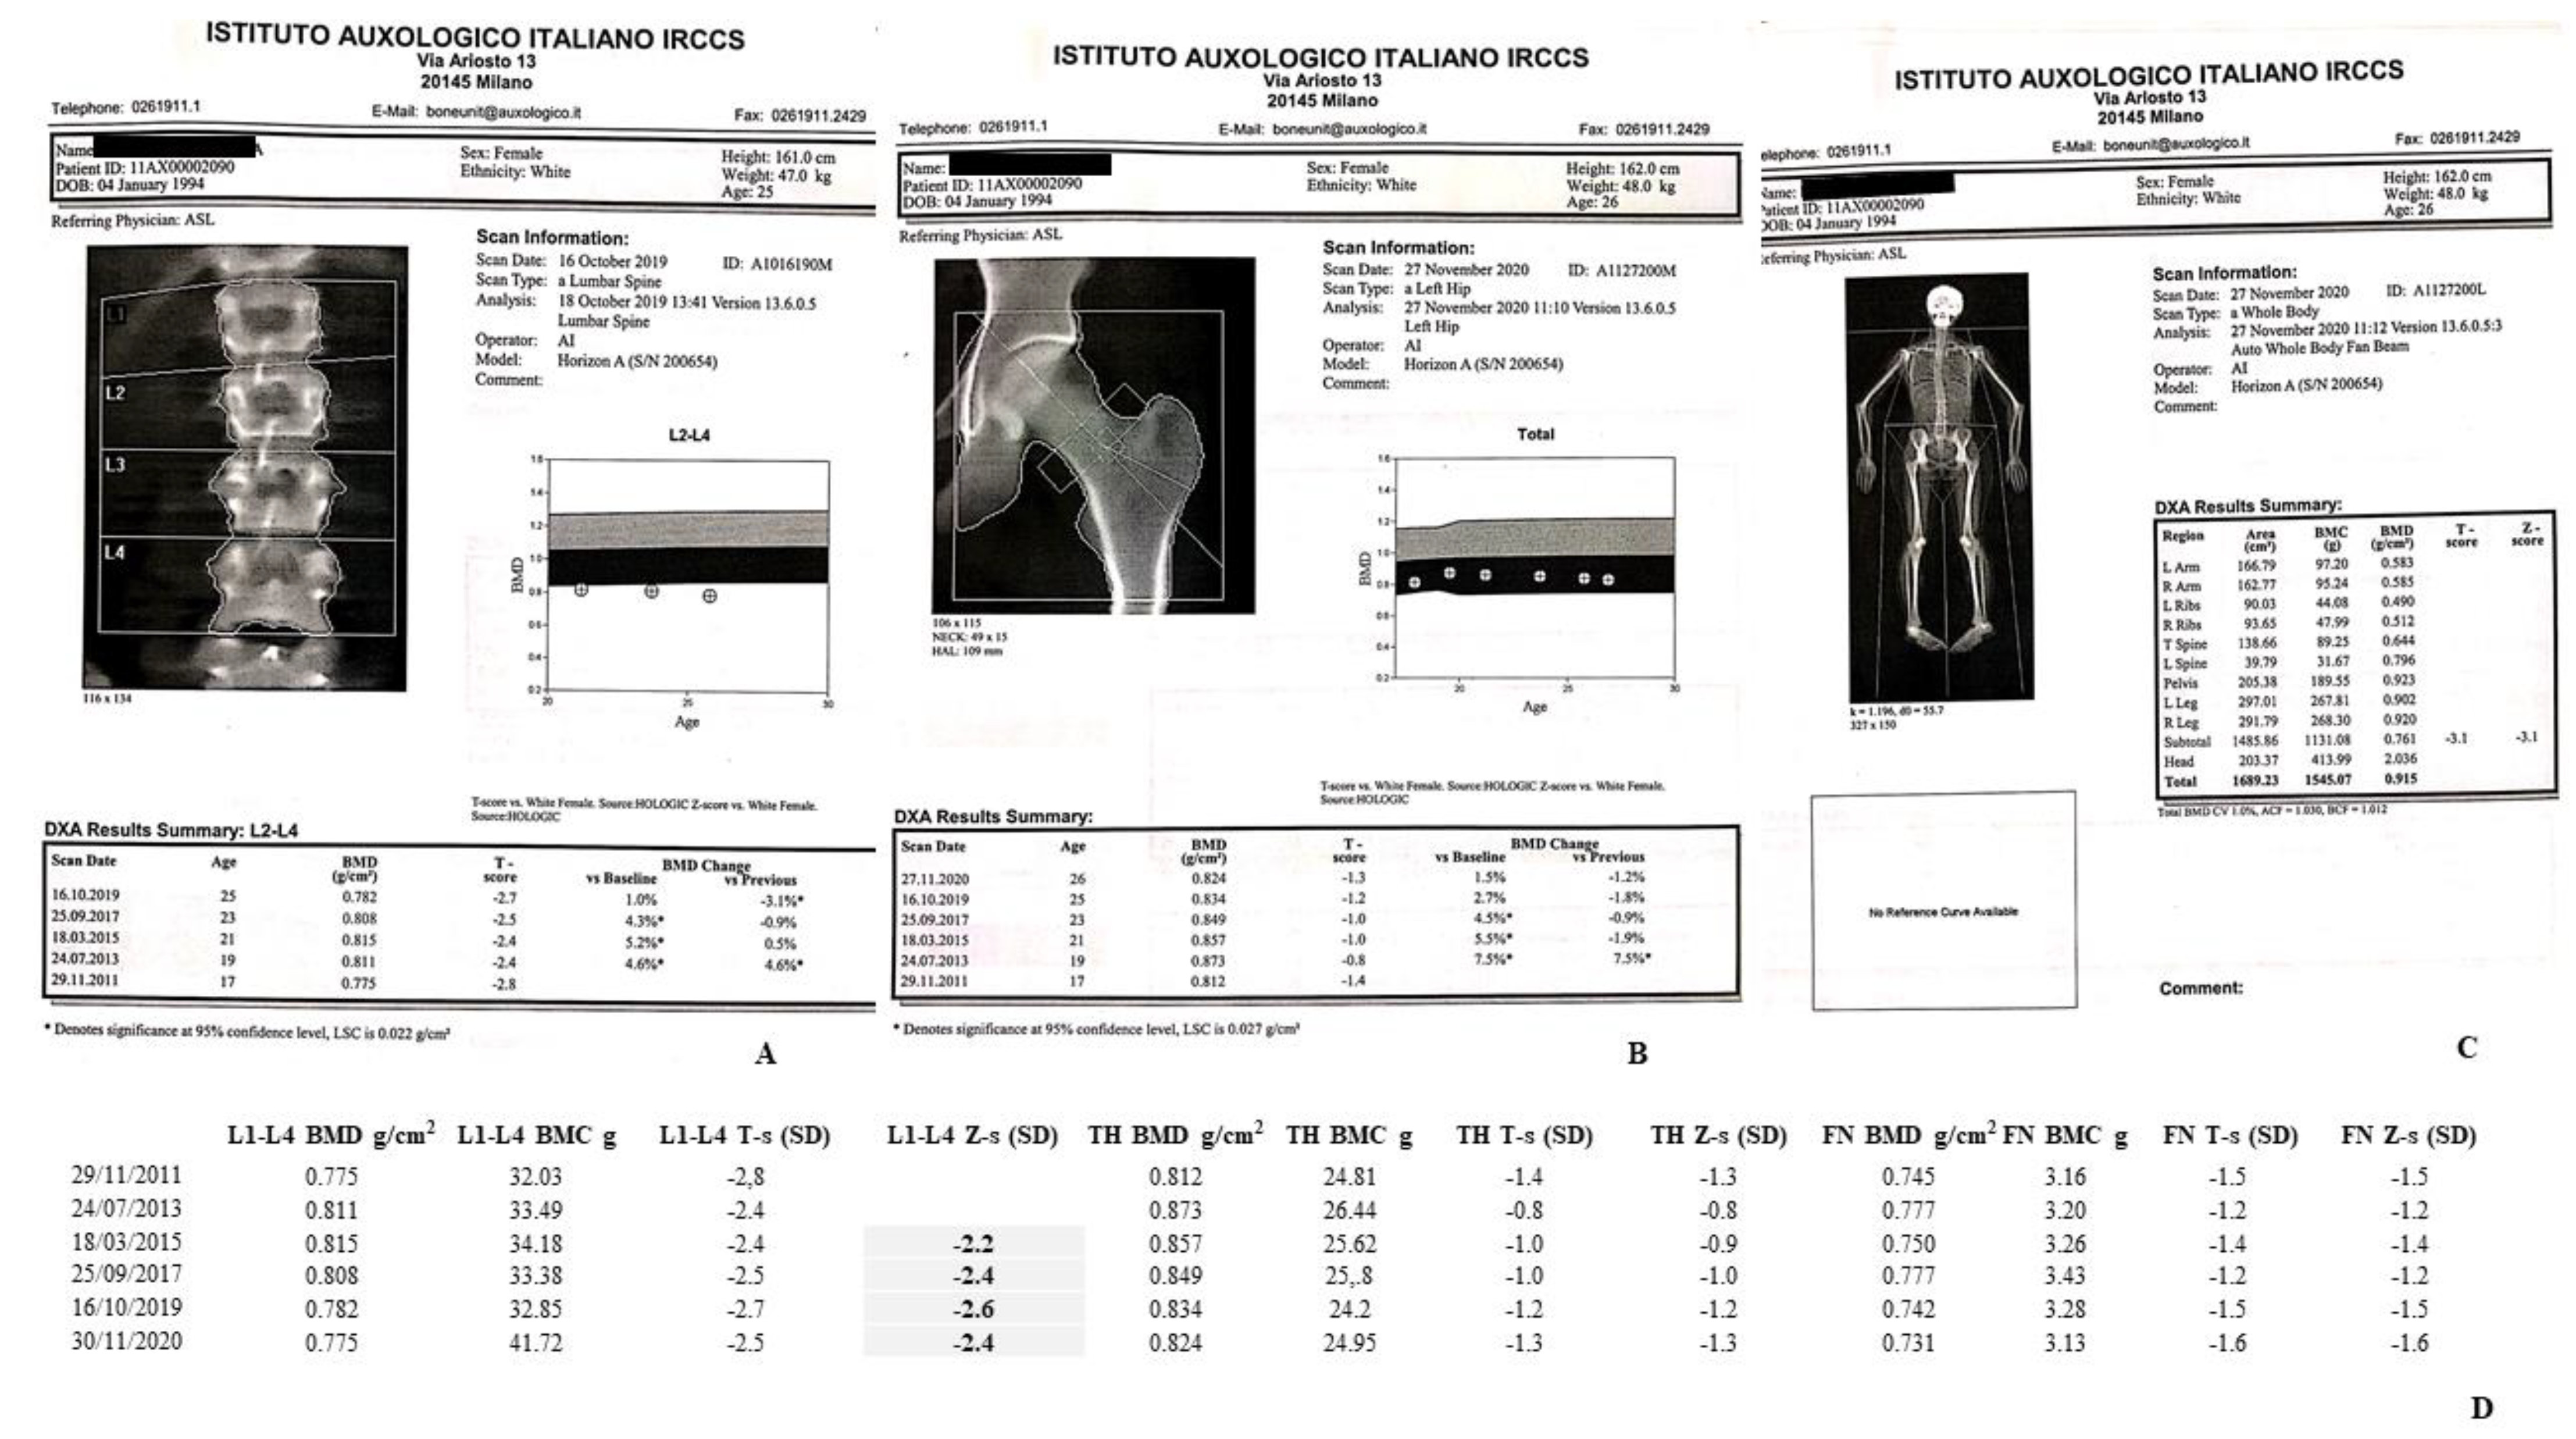
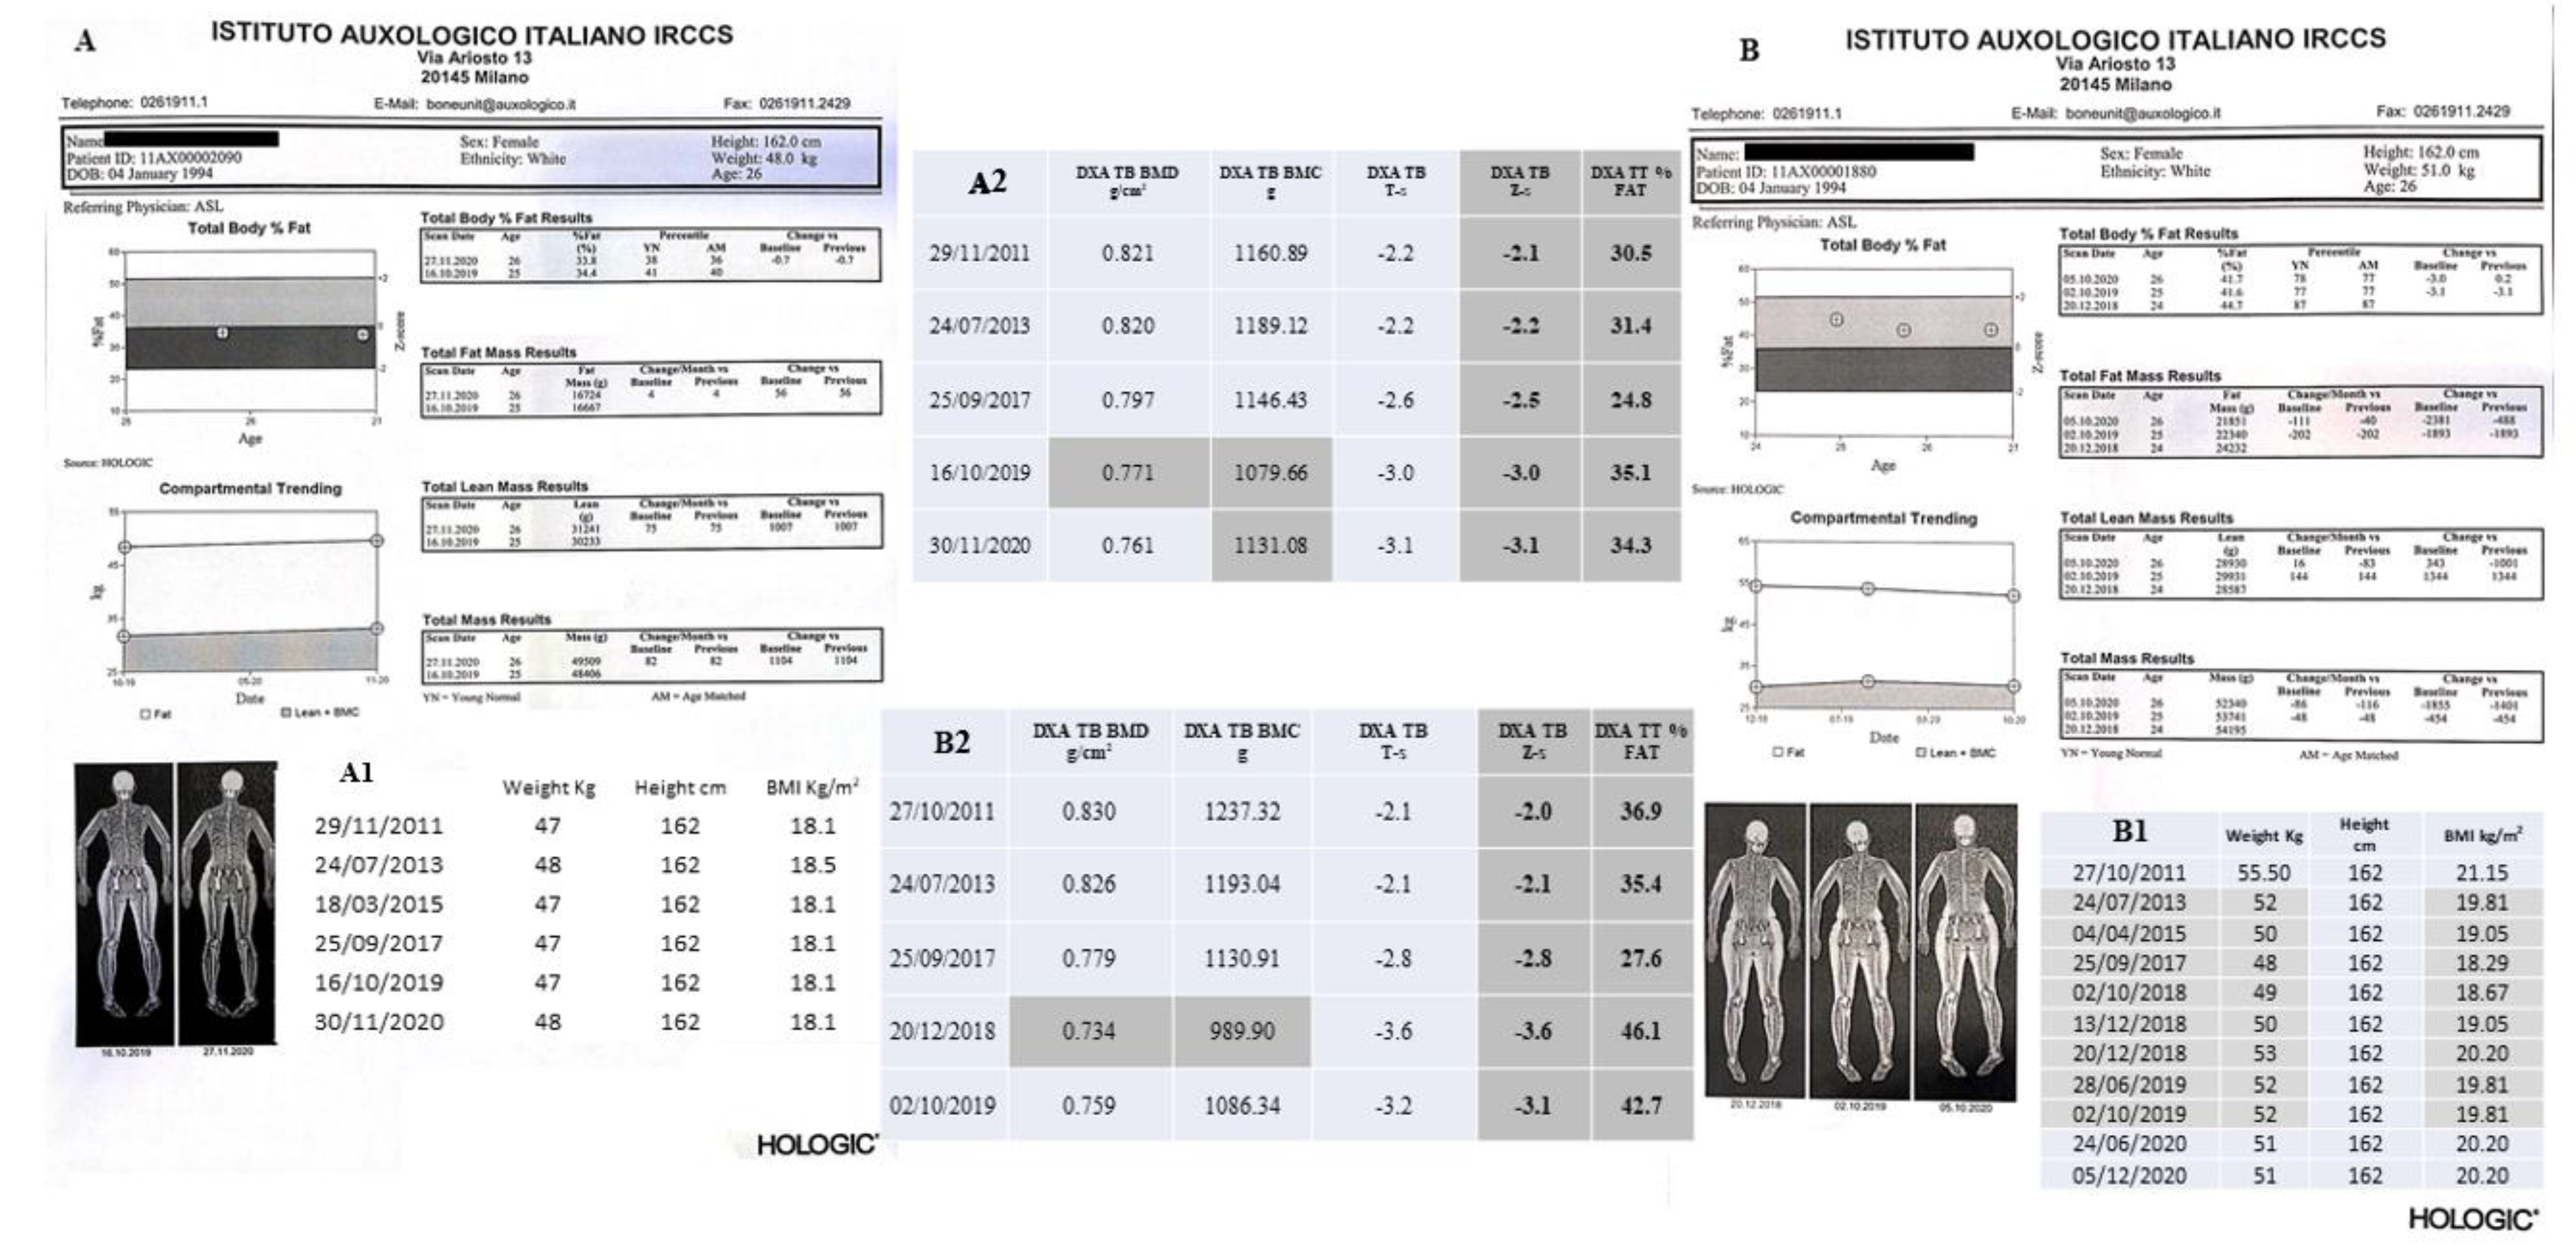
4.1. DXA Scans
4.1.1. II-1 Tw1
4.1.2. II-2 Tw2
4.2. Spine X-rays
4.2.1. II-1 Tw1
4.2.2. II-2 Tw2
4.3. Biochemical Analyses
4.3.1. II-1 Tw1
4.3.2. II-2 Tw2
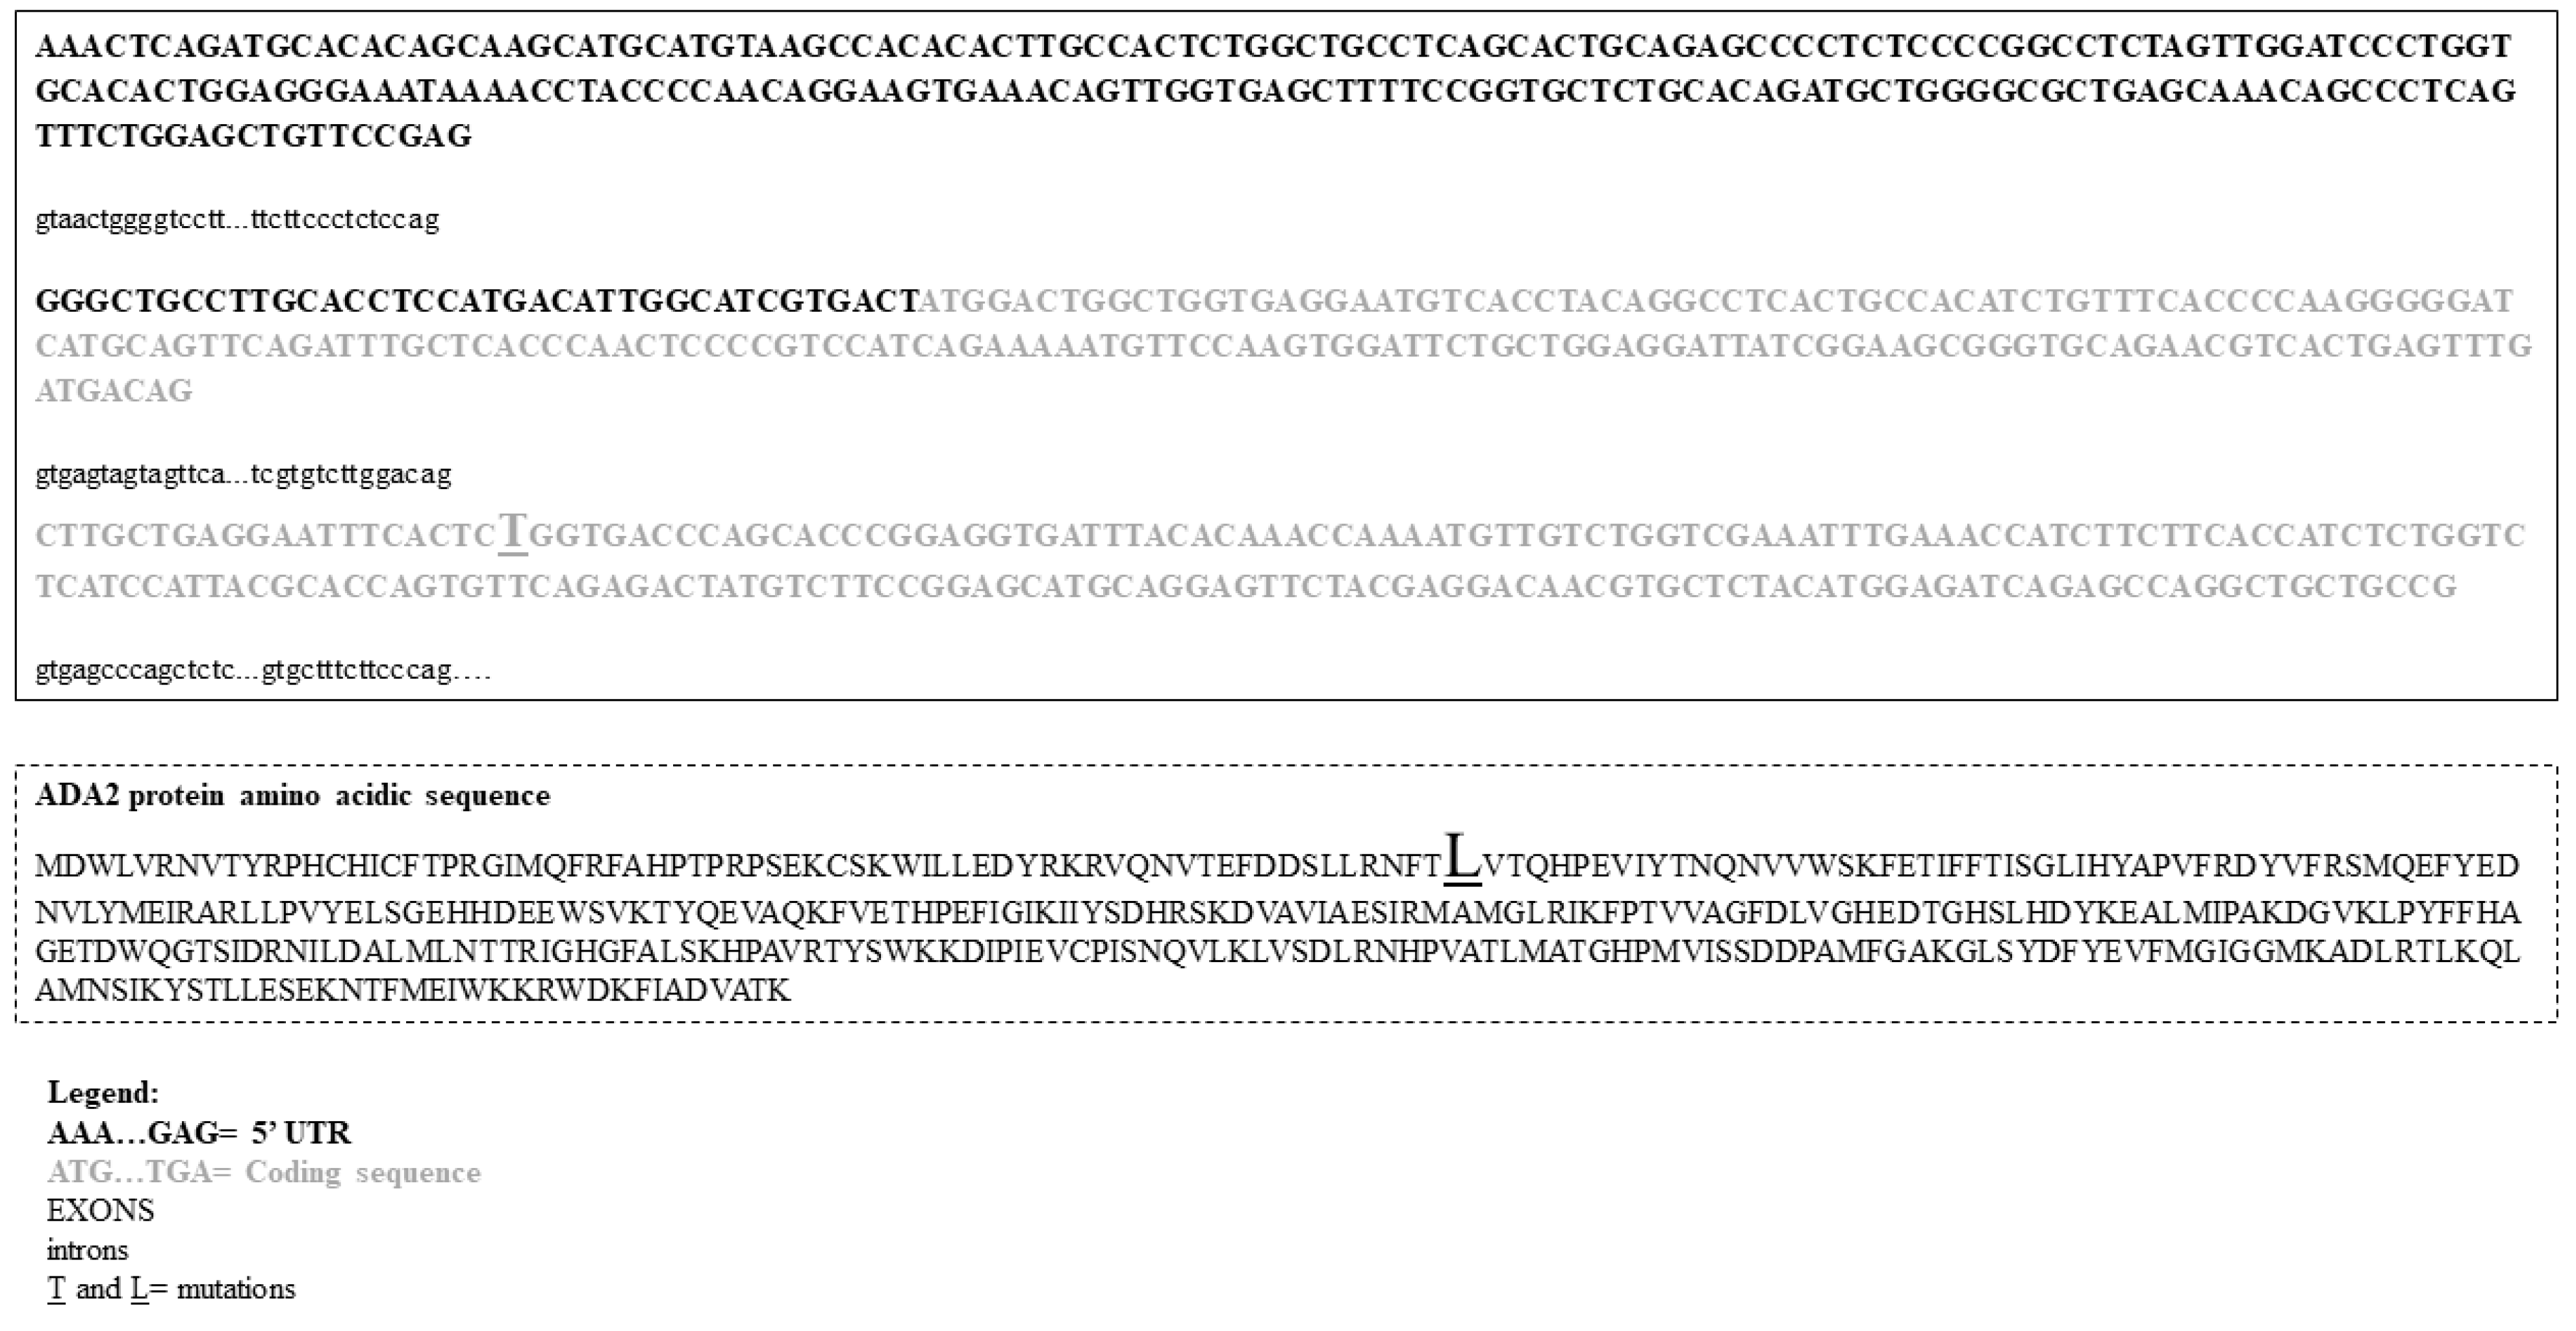
4.4. Mutational Analysis
4.5. ADA2 Functional Analysis
5. Discussion
6. Limitations and Conclusions
Author Contributions
Funding
Institutional Review Board Statement
Informed Consent Statement
Data Availability Statement
Conflicts of Interest
References
- Zhou, Q.; Yang, D.; Ombrello, A.; Zavialov, A.; Toro, C.; Zavialov, A.; Stone, D.L.; Chae, J.J.; Rosenzweig, S.D.; Bishop, K.; et al. Early-onset stroke and vasculopathy associated with mutations in ADA2. N. Engl. J. Med. 2014, 370, 911–920. [Google Scholar] [CrossRef] [PubMed] [Green Version]
- Elkan, P.N.; Pierce, S.B.; Segel, R.; Walsh, T.; Barash, J.; Padeh, S.; Zlotogorski, A.; Berkun, Y.; Press, J.J.; Mukamel, M.; et al. Mutant adenosine deaminase 2 in a polyarteritis nodosa vasculopathy. N. Engl. J. Med. 2014, 370, 921–931. [Google Scholar] [CrossRef]
- Lee, P.Y. Vasculopathy, Immunodeficiency, and Bone Marrow Failure: The Intriguing Syndrome Caused by Deficiency of Adenosine Deaminase 2. Front. Pediatr. 2018, 6, 282. [Google Scholar] [CrossRef] [Green Version]
- Sauer, A.V.; Mrak, E.; Hernandez, R.J.; Zacchi, E.; Cavani, F.; Casiraghi, M.; Grunebaum, E.; Roifman, C.M.; Cervi, M.C.; Ambrosi, A.; et al. ADA-deficient SCID is associated with a specific microenvironment and bone phenotype characterized by RANKL/OPG imbalance and osteoblast insufficiency. Blood 2009, 114, 3216–3226. [Google Scholar] [CrossRef]
- Eric, T. Rush. Childhood hypophosphatasia: To treat or not to treat. Orphanet J. Rare Dis. 2018, 13, 116. [Google Scholar] [CrossRef] [Green Version]
- Manson, D.; Diamond, L.; Oudjhane, K.; Hussain, F.B.; Roifman, C.; Grunebaum, E. Characteristic scapular and rib changes on chest radiographs of children with ADA-deficiency SCIDS in the first year of life. Pediatr. Radiol. 2013, 43, 589–592. [Google Scholar] [CrossRef] [PubMed]
- Sauer, A.V.; Brigida, I.; Carriglio, N.; Aiuti, A. Autoimmune dysregulation and purine metabolism in adenosine deaminase deficiency. Front. Immunol. 2012, 3, 265. [Google Scholar] [CrossRef] [PubMed] [Green Version]
- Lindley, E.R.; Pisoni, R.L. Demonstration of adenosine deaminase activity in human fibroblast lysosomes. Biochem. J. 1993, 290, 457–462. [Google Scholar] [CrossRef]
- Eltzschig, H.K.; Faigle, M.; Knapp, S.; Karhausen, J.; Ibla, J.; Rosenberger, P.; Odegard, K.C.; Laussen, P.C.; Thompson, L.F.; Colgan, S.P. Endothelial catabolism of extracellular adenosine during hypoxia: The role of surface adenosine deaminase and CD26. Blood 2006, 108, 1602–1610. [Google Scholar] [CrossRef]
- Benveniste, P.; Zhu, W.; Cohen, A. Interference with thymocyte differentiation by an inhibitor of S-adenosylhomocysteine hydrolase. J. Immunol. 1995, 155, 536–544. [Google Scholar] [PubMed]
- Blackburn, M.R.; Thompson, L.F. Adenosine deaminase deficiency: Unanticipated benefits from the study of a rare immunodeficiency. J. Immunol. 2012, 188, 933–935. [Google Scholar] [CrossRef] [Green Version]
- Van Montfrans, J.M.; Hartman, E.A.R.; Braun, K.P.J.; Hennekam, E.A.M.; Hak, E.A.; Nederkoorn, P.J.; Westendorp, W.F.; Bredius, R.G.M.; Kollen, W.J.W.; Schölvinck, E.H.; et al. variability in patients with ADA2 deficiency due to identical homozygous R169Q mutations. Rheumatology 2016, 55, 902–910. [Google Scholar] [CrossRef] [Green Version]
- Trotta, L.; Martelius, T.; Siitonen, T.; Hautala, T.; Hämäläinen, S.; Juntti, H.; Taskinen, M.; Ilander, M.; Andersson, E.I.; Zavialov, A.; et al. ADA2 deficiency: Clonal lymphoproliferation in a subset of patients. J. Allergy Clin. Immunol. 2018, 141, 1534–1537.e8. [Google Scholar] [CrossRef] [PubMed] [Green Version]
- Saettini, F.; Fazio, G.; Corti, P.; Quadri, M.; Bugarin, C.; Gaipa, G.; Penco, F.; Moratto, D.; Chiarini, M.; Baronio, M.; et al. Two siblings presenting with novel ADA2 variants, lymphoproliferation, persistence of large granular lymphocytes, and T-cell perturbations. Clin. Immunol. 2020, 218, 108525. [Google Scholar] [CrossRef] [PubMed]
- Ratech, H.; Martiniuk, F.; Borer, W.Z.; Rappaport, H. Differential expression of adenosine deaminase isozymes in acute leukemia. Blood 1988, 72, 1627–1632. [Google Scholar] [CrossRef] [PubMed] [Green Version]
- Iwaki-Egawa, S.; Yamamoto, T.; Watanabe, Y. Human plasma adenosine deaminase 2 is secreted by activated monocytes. Biol Chem. 2006, 387, 319–321. [Google Scholar] [CrossRef]
- Hawkes, C.P.; Roy, S.M.; Dekelbab, B.; Frazier, B.; Grover, M.; Haidet, J.; Listman, J.; Madsen, S.; Roan, M.; Rodd, C.; et al. Hypercalcemia in Children Using the Ketogenic Diet: A Multicenter Study. J. Clin. Endocrinol. Metab. 2021, 106, e485–e495. [Google Scholar] [CrossRef] [PubMed]
- Strazzulla, L.C.; Cronstein, B.N. Regulation of bone and cartilage by adenosine signaling. Purinergic Signal. 2016, 12, 583–593. [Google Scholar] [CrossRef] [Green Version]
- Mediero, A.; Cronstein, B.N. Adenosine and bone metabolism. Trends Endocrinol. Metab. 2013, 24, 290–300. [Google Scholar] [CrossRef] [Green Version]
- Kohn, D.B.; Hershfield, M.S.; Puck, J.M.; Aiuti, A.; Blincoe, A.; Gaspar, H.B.; Notarangelo, L.D.; Grunebaum, E. Consensus approach for the management of severe combined immune deficiency caused by adenosine deaminase deficiency. J. Allergy Clin. Immunol. 2019, 143, 852–863. [Google Scholar] [CrossRef]
- Owen, C.J.; Habeb, A.; Pearce, S.H.; Wright, M.; Ichikawa, S.; Sorenson, A.H.; Econs, M.J.; Cheetham, T.D. Discordance for X-linked hypophosphataemic rickets in identical twin girls. Horm. Res. 2009, 71, 237–244. [Google Scholar] [CrossRef] [PubMed]
- Shahbazi, Z.; Yazdani, R.; Shahkarami, S.; Shahbazi, S.; Hamid, M.; Sadeghi-Shabestari, M.; Momen, T.; Aleyasin, S.; Esmaeilzadeh, H.; Darougar, S.; et al. Genetic mutations, and immunological features of severe combined immunodeficiency patients in Iran. Immunol. Lett. 2019, 216, 70–78. [Google Scholar] [CrossRef] [PubMed]
- Shepherd, J.A.; Schousboe, J.T.; Broy, S.B.; Engelke, K.; Leslie, W.D. Executive Summary of the 2015 ISCD Position Development Conference on Advanced Measures from DXA and QCT: Fracture Prediction Beyond BMD. J. Clin. Densitom. 2015, 18, 274–286. [Google Scholar] [CrossRef] [PubMed]
- Boivin, G.; Meunier, P.J. Changes in bone remodeling rate influence the degree of mineralization of bone. Connect. Tissue Res. 2002, 43, 535–537. [Google Scholar] [CrossRef]
- Cesareo, R.; Attanasio, R.; Caputo, M.; Castello, R.; Chiodini, I.; Falchetti, A.; Guglielmi, R.; Papini, E.; Santonati, A.; Scillitani, A.; et al. AME and Italian AACE Chapter. Italian Association of Clinical Endocrinologists (AME) and Italian Chapter of the American Association of Clinical Endocrinologists (AACE) Position Statement: Clinical Management of Vitamin D Deficiency in Adults. Nutrients 2018, 10, 546. [Google Scholar] [CrossRef] [Green Version]
- Meyts, I.; Aksentijevich, I. Deficiency of adenosine deaminase 2 (DADA2): Updates. on the phenotype, genetics, pathogenesis, and treatment. J. Clin. Immunol. 2018, 38, 569–578. [Google Scholar] [CrossRef] [PubMed] [Green Version]
- Mc De Sousa, S.; Hardy, T.S.; Scott, H.S.; Torpy, D.J. Genetic Testing in Endocrinology. Clin. Biochem. Rev. 2018, 39, 17–28. [Google Scholar]
- Batu, E.D.; Karadag, O.; Taskiran, E.Z.; Kalyoncu, U.; Aksentijevich, I.; Alikasifoglu, M.; Ozen, S. A case series of adenosine deaminase 2-deficient patients emphasizing treatment and genotype-phenotype correlations. J. Rheumatol. 2015, 42, 1532–1534. [Google Scholar] [CrossRef] [Green Version]
- Kendler, D.L.; Body, J.J.; Brandi, M.L.; Broady, R.; Cannata-Andia, J.; Cannata-Ortiz, M.J.; El Maghraoui, A.; Guglielmi, G.; Hadji, P.; Pierroz, D.D.; et al. Osteoporosis management in hematologic stem cell transplant recipients: Executive summary. J. Bone. Oncol. 2021, 28, 100361. [Google Scholar] [CrossRef] [PubMed]
- Chae, Y.S.; Kim, J.G.; Moon, J.H.; Kim, S.N.; Lee, S.J.; Kim, Y.J.; Sohn, S.K. Pilot study on the use of zoledronic acid to prevent bone loss in allo-SCT recipients. Bone Marrow Transpl. 2009, 44, 35–41. [Google Scholar] [CrossRef]
- Grigg, A.P.; Shuttleworth, P.; Reynolds, J.; Schwarer, A.P.; Szer, J.; Bradstock, K.; Hui, C.; Herrmann, R.; Ebeling, P.R. Pamidronate reduces bone loss after allogeneic stem cell transplantation. J. Clin. Endocrinol. Metab. 2006, 91, 3835–3843. [Google Scholar] [CrossRef] [Green Version]
- Tauchmanova, L.; De Simone, G.; Musella, T.; Orio, F.; Ricci, P.; Nappi, C.; Lombardi, G.; Colao, A.; Rotoli, B.; Selleri, C. Effects of various antireabsorptive treatments on bone mineral density in hypogonadal young women after allogeneic stem cell transplantation. Bone Marrow Transpl. 2006, 37, 81–88. [Google Scholar] [CrossRef]
- Tauchmanova, L.; Ricci, P.; Serio, B.; Lombardi, G.; Colao, A.; Rotoli, B.; Selleri, C. Short-term zoledronic acid treatment increases bone mineral density and marrow clonogenic fibroblast progenitors after allogeneic stem cell transplantation. J. Clin. Endocrinol. Metab. 2005, 90, 627–634. [Google Scholar] [CrossRef] [Green Version]
- Gatti, D.; Antoniazzi, F.; Prizzi, R.; Braga, V.; Rossini, M.; Tato, L.; Viapiana, O.; Adami, S. Intravenous neridronate in children with Osteogenesis imperfecta: A randomized controlled study. J. Bone Miner. Res. 2005, 20, 758–763. [Google Scholar] [CrossRef] [PubMed]
- Prada, E.J.; Hassan, K.H.; Brandi, M.L.; Falchetti, A. Polyostotic form of fibrous dysplasia in a 13 years old Colombian girl showing clinical and biochemical response to neridronate intravenous therapy. Clin. Cases Miner Bone Metab. 2009, 6, 264–265. [Google Scholar]
- Baxter, I.; Rogers, A.; Eastell, R.; Peel, N. Evaluation of urinary N-telopeptide of type I collagen measurements in the management of osteoporosis in clinical practice. Osteoporos Int. 2013, 24, 941–947. [Google Scholar] [CrossRef] [PubMed]
- Bollinger, M.E.; Arredondo-Vega, F.X.; Santisteban, I.; Schwarz, K.; Hershfield, M.S.; Lederman, H.M. Brief report: Hepatic dysfunction as a complication of adenosine deaminase deficiency. N. Engl. J. Med. 1996, 334, 1367–1371. [Google Scholar] [CrossRef] [PubMed]
- Somech, R.; Lai, Y.H.; Grunebaum, E.; Le Saux, N.; Cutz, E.; Roifman, C.M. Polyethylene glycol-modified adenosine deaminase improved lung disease but not liver disease in partial adenosine deaminase deficiency. J. Allergy Clin. Immunol. 2009, 124, 848–850. [Google Scholar] [CrossRef] [PubMed]
- Grunebaum, E.; Cutz, E.; Roifman, C.M. Pulmonary alveolar proteinosis in patients with adenosine deaminase deficiency. J. Allergy Clin. Immunol. 2012, 129, 1588–1593. [Google Scholar] [CrossRef]
- Speckmann, C.; Neumann, C.; Borte, S.; La Marca, G.; Sass, J.O.; Wiech, E.; Fisch, P.; Schwarz, K.; Buchholz, B.; Schlesier, M.; et al. Delayed-onset adenosine deaminase deficiency: Strategies for an early diagnosis. J. Allergy Clin. Immunol. 2012, 130, 991–994. [Google Scholar] [CrossRef] [PubMed]


| (A) II-1 Tw1. |
| 1996 and 1997. She had the occurrence of two ischemic strokes. |
| 2016. She received the diagnosis of autoimmune primary hypothyroidism. |
| (B) II-2 Tw2. |
| 1996. At 3 years of age, she developed a CD19 deficiency (51 mm3, normal range values 200–2100 mm3) with hypogammaglobulinemia. |
| 2007. Occurrence of episodes of acrocyanosis and vasculitis phenomena in the lower limbs. |
| 2008. On January, hematological findings of leukopenia and neutropenia. Left knee pain, radiating to the leg (anteriorly). Knee X-ray performed on 25.08 was negative. The orthopedic visit indicated the need for analgesic therapy only. Subsequently, she referred the onset of burning pain and purplish erythematous lesions only partially vesicle/crusted, located only in the left limb, calf, tibial region and forefoot. |
| 2009. For suspected vasculitis, a skin biopsy was performed and the findings were compatible with leukocytoclastic vasculitis. |
| 2010. On December, immunological investigation revealed positivity of anticardiolipin and antiphospholipid antibodies. |
| 2011. A granulocyte colony-stimulating factor (G-CSF)-based treatment started from 6 April with benefit. |
| 2012. On December, she had cryopreservation of oocytes. |
| 2016–2017. On October 2016, she started therapy with hydroxychloroquine sulfate 1 tab/day, continued until June 2017. |
| July 2017: she started steroid therapy, prednisone at 2 mg/kg/day (firstly per i.v. and then per os), prolonged up to September 2017, when it was reduced in a scalar way together with the start of Etanercept (Enbrel) therapy. July–September 2017: evidence of large granular lymphocytes (LGL) aspect with associated immunophenotype of 55.3% CD57+ and T Lymphocytes-Large Granular (TLLG) aspect, suggesting the onset of LGL Leukemia (LGLL). Such a suspicion was then confirmed by bone marrow analysis and the presence of T cell receptor (TCR) α (TCR α) (about 45%) and TCRβ (approximately 35%) oligoclonality, together with neutropenia, associated with episodes of vasculitis in the lower limbs, refractory to G-CSF and occurrence of steroid dependence. |
| 2018. On 15 February, she underwent HSCT. The source of transplant was represented by bone marrow stem cells (BMSCs) from matched unrelated donor (MUD). A Treosulfan-Thiotepa-Fludarabine (Thio-Treo-Flu)-based conditioning regimen treatment was performed prior than allogenic transplantation. The graft consisted of 2.45 ×10⁸ total nucleated cells (TNC)/kg, 3.02 × 10⁶ CD34+/kg, 48.34 × 10⁶ CD3+/kg. The HLA matching resulted to be 9/10 in ratio. The acute graft versus host disease (GVHD) prophylaxis consisted of Rituximab, Methotrexate, and Cyclosporine. Cryopreserved hematopoietic stem cells (HSCs) of the allogeneic donor have been made available. Then, secondary amenorrhea, induced by HSCT and related treatment, occurred. In April, she suffered for the appearance of neuropathic pain for which she started oral gabapentin therapy followed by important symptomatologic improvement. |
| II-1 Tw1 | S-BSAP (5.0–31.0 mg/L) | S-CREAT (0.4–1.5 mg/dL) | S-Ca (8.1–10.4 mg/dL) | S-PO (2.5–5.0 mg/dL) | S-Mg (1.6–2.6 mg/dL) | P-OC (6–42 mg/L) | S-PTH (13–64 ng/L) | S-CTX (<540 ng/mL) | 25OHD (≥30 ng/mL) |
|---|---|---|---|---|---|---|---|---|---|
| November 2011 | 14.4 | 0.6 | 9.1 | 4.2 | 1.9 | 47 | 52.9 | 659 | 13 |
| July 2013 | 16.9 | - | 9.2 | 3.5 | - | 44 | 43.7 | 739 | 51.3 |
| March 2015 | 21.0 | 0.6 | 9.4 | 3.4 | 2.0 | 37 | 46.9 | 607 | 22.4 |
| October 2019 | 22.4 | 0.55 | 9.5 | 3.0 | 1.7 | 49 | 24.6 | 399 | 43.5 |
| November 2020 | 23.6 | 0.66 | 9.7 | 3.1 | 2.1 | 42 | 52.7 | 474 | 39.7 |
| 24h U-Ca (100–300 mg) | 24h U-CREAT. (600–1600 mg) | 24h U-PO (200–1500 mg) | 24 U-Mg (10–150 mg) | U-NTX (25–49 BCE */mmol CREAT.) | 24 h DIURESIS mL | ||||
| November 2011 | 152 | 638 | 458 | 53 | 43 | 750 | |||
| November 2020 | 168 | 745 | 553 | 82 | 56 | 1530 | |||
| II-2 Tw2 | S-BSAP (5.0–31.0 mg/L) | S-CREAT. (0.4–1.5 mg/dL) | S-Ca (8.1–10.4 mg/dL) | S-PO (2.5–5.0 mg/dL) | S-Mg (1.6–2.6 mg/dL) | P-OC (6–42 mg/L) | S-PTH (13–64 ng/L) | S-CTX (<540 ng/mL) | 25OHD (≥30 ng/mL) |
| October 2011 | 16.4 | 0.7 | 9.1 | 3.4 | 1.8 | 38 | 72.9 | 558 | 14 |
| October 2018 | - | - | 9.7 | - | - | - | 29.1 | - | 75.4 |
| 12 November 2018 | 28.5 | 0.65 | 9.1 | - | 1.7 | - | - | - | - |
| 20 November 2018 | - | 0.56 | 9.2 | - | 1.7 | - | - | - | - |
| 28 November 2018 | - | 0.72 | 9.3 | - | 1.68 | - | - | - | - |
| 3 December 2018 | - | 0.64 | 9.6 | - | 1.80 | - | - | - | - |
| 13 December 2018 | - | 0.69 | 9.4 | - | 1.94 | - | - | - | - |
| 20 December 2018 | 40.1 | 0.66 | 9.5 | 4.2 | 2.0 | 192 | 59.9 | 1596 | 34 |
| June 2019 | - | 0.60 | 9.2 | 3.9 | 2.1 | 106 | 86.2 | - | 38.3 |
| October 2019 | 33.2 | 0.67 | 9.6 | 5.0 | 1.7 | 30 | 56.4 | - | 54.8 |
| June 2020 | - | 0.63 | 8.9 | 3.1 | - | 34 | 76.2 | 434 | 48.0 |
| December 2020 | 28.6 | 0.76 | 9.2 | 4.0 | 1.9 | 24 | 76.8 | - | 58.1 |
| 24h U-Ca (100–300 mg) | 24h U-CREAT. (600–1600 mg) | 24h U-PO (200–1500 mg) | 24 U-Mg (10–150 mg) | U-NTX (25–49 BCE */mmol CREAT.) | 24 h DIURESIS mL | ||||
| October 2011 | 144 | 984 | 576 | 57 | 65 | 600 | |||
| June 2019 | 165 | 888 | 603 | 62 | 78 | 1500 | |||
| December 2020 | 203 | 786 | 597 | 71 | 86 | 1250 | |||
| II-1 Tw1. |
| Calcifediol, 4 drops/day |
| Etanercept 50 mg, 1 subcutaneous vial/week |
| Acetylsalicylic acid, 100 mg/day |
| Levothyroxine, 50 mcg/day |
| Acyclovir 400 mg, twice/day |
| Fluconazole 200 mg, 2 tabs/day |
| Subcutaneous Immunoglobulin G-CSF, 30 mcg/mL, 30 mcg/day |
| II-2 Tw2. |
| Calcifediol 4 drops/day |
| Flurazepam 15 mg/day |
| Quietapine 25 mg/day |
| Estradiol hemihydrate patch twice a week and dihydrogesterone, derivatives of pregnadiene, 10 mg, 1 tab/day in the last 14 days of each 28-day cycle, sequentially; |
| Levothyroxine 75 mcg day for 5 days and 50 mcg/day for 2 days per week. |
Publisher’s Note: MDPI stays neutral with regard to jurisdictional claims in published maps and institutional affiliations. |
© 2021 by the authors. Licensee MDPI, Basel, Switzerland. This article is an open access article distributed under the terms and conditions of the Creative Commons Attribution (CC BY) license (https://creativecommons.org/licenses/by/4.0/).
Share and Cite
Vai, S.; Marin, E.; Cosso, R.; Saettini, F.; Bonanomi, S.; Cattoni, A.; Chiodini, I.; Persani, L.; Falchetti, A. A Novel Germline Mutation of ADA2 Gene in Two “Discordant” Homozygous Female Twins Affected by Adenosine Deaminase 2 Deficiency: Description of the Bone-Related Phenotype. Int. J. Mol. Sci. 2021, 22, 8331. https://doi.org/10.3390/ijms22158331
Vai S, Marin E, Cosso R, Saettini F, Bonanomi S, Cattoni A, Chiodini I, Persani L, Falchetti A. A Novel Germline Mutation of ADA2 Gene in Two “Discordant” Homozygous Female Twins Affected by Adenosine Deaminase 2 Deficiency: Description of the Bone-Related Phenotype. International Journal of Molecular Sciences. 2021; 22(15):8331. https://doi.org/10.3390/ijms22158331
Chicago/Turabian StyleVai, Silvia, Erika Marin, Roberta Cosso, Francesco Saettini, Sonia Bonanomi, Alessandro Cattoni, Iacopo Chiodini, Luca Persani, and Alberto Falchetti. 2021. "A Novel Germline Mutation of ADA2 Gene in Two “Discordant” Homozygous Female Twins Affected by Adenosine Deaminase 2 Deficiency: Description of the Bone-Related Phenotype" International Journal of Molecular Sciences 22, no. 15: 8331. https://doi.org/10.3390/ijms22158331