Article

Longitudinal and Transverse Relaxivity Analysis of Native Ferritin and Magnetoferritin at 7 T MRI

1
Biomedical Center Martin, Jessenius Faculty of Medicine in Martin, Comenius University in Bratislava, Mala Hora 4, 036 01 Martin, Slovakia
2
Institute of Hydrology, Slovak Academy of Sciences, Dubravska Cesta 9, 841 04 Bratislava, Slovakia
3
Department of Medical Biochemistry, Jessenius Faculty of Medicine in Martin, Comenius University in Bratislava, Mala Hora 4, 036 01 Martin, Slovakia
4
Institute of Experimental Physics, Slovak Academy of Sciences, Watsonova 47, 040 01 Kosice, Slovakia
*
Author to whom correspondence should be addressed.
Int. J. Mol. Sci. 2021, 22(16), 8487; https://doi.org/10.3390/ijms22168487
Submission received: 3 June 2021 / Revised: 19 July 2021 / Accepted: 3 August 2021 / Published: 6 August 2021
(This article belongs to the Special Issue Nanoparticles: From Synthesis to Properties)

Abstract

:
Magnetite mineralization in human tissue is associated with various pathological processes, especially neurodegenerative disorders. Ferritin’s mineral core is believed to be a precursor of magnetite mineralization. Magnetoferritin (MF) was prepared with different iron loading factors (LFs) as a model system for pathological ferritin to analyze its MRI relaxivity properties compared to those of native ferritin (NF). The results revealed that MF differs statistically significantly from NF, with the same LF, for all studied relaxation parameters at 7 T: r1, r2, r2*, r2/r1, r2*/r1. Distinguishability of MF from NF may be useful in non-invasive MRI diagnosis of pathological processes associated with iron accumulation and magnetite mineralization (e.g., neurodegenerative disorders, cancer, and diseases of the heart, lung and liver). In addition, it was found that MF samples possess very strong correlation and MF’s relaxivity is linearly dependent on the LF, and the transverse and longitudinal ratios r2/r1 and r2*/r1 possess complementary information. This is useful in eliminating false-positive hypointensive artefacts and diagnosis of the different stages of pathology. These findings could contribute to the exploitation of MRI techniques in the non-invasive diagnosis of iron-related pathological processes in human tissue.

1. Introduction

Iron is an essential element for almost all living systems, including humans [1]. However, excess levels of biogenic iron are associated with a variety of human pathological processes, including inflammation [2], neurodegeneration [3], neuroinflammation [4], and even cancer [5]. Moreover, it is also connected with disorders of the liver [6], heart [7], and lung [8]. Iron accumulation in tissues and the formation of aggregates as nanosized iron oxide particles [3], especially magnetite [9,10], is often described for neurodegenerative disorders and is believed to be associated with disrupted iron homeostasis [11]. It is generally accepted that the toxicity of iron is a result of the ability of ferrous ions to produce hydroxyl radicals through the Fenton reaction [12]. This process is hazardous, resulting in hydrogen peroxide overproduction and damage to antioxidants, including iron scavengers, peroxidases, and iron storage proteins, such as ferritin [13], which can lead to cancer [14]. From these studies, together with recent work on reduction of the ferritin nucleus [15], it appears that iron accumulation and mineralization is at least an accomplice of pathology. However, at present, it is still not known whether the formation of iron oxide aggregates is the cause or the result of pathology.
It has been suggested that a precursor of iron accumulation and pathological mineralization is ferritin [16]. A ferritin particle is an iron storage molecule, composed of a protein envelope (12 nm) and a central cavity (8 nm) with a mineral core in the form of a crystalline ferrihydrite-like compound [17]. The primary role of ferritin in living systems is to remove toxic ferrous ions when they reach their critical cell concentration and to deposit them as non-toxic ferric ions for later usage by the organism.
Surprisingly, the mineral core composition of ferritin is changed by pathology. In 2004, Quintana et al. showed, by using electron nanodiffraction and electron microscopy, that the brain-tissue ferritin mineral core of patients with Alzheimer’s disease (referred to as “pathological” ferritin) is structurally different from native (“physiological”) ferritin [16]. In physiological ferritin, the mineral core consists mainly of hexagonal ferrihydrite, hematite, and a smaller phase of magnetite. In contrast, the core of pathological ferritin consists mainly of cubic structures, such as magnetite and wüstite, and to a lesser extent ferrihydrite, but no hematite. These conclusions have been confirmed by Bossoni et al. [18]. By using muon spin rotation they showed that ferritin particles from healthy subjects contain ferrihydrite, but particles from Alzheimer’s disease patients have a crystalline phase with large magnetocrystalline anisotropy compatible with magnetite or maghemite. In the following text, for simplicity, we will describe the mineral core of NF as a ferrihydrite-like core and the mineral core of MF as a magnetite-like core. Due to the predominance of these mineral phases in these particles, we consider this to be an acceptable approximation.
From this perspective, pathological brain-tissue ferritin can be described as magnetoferritin (MF), which is composed of apoferritin and an artificially added phase of magnetite or maghemite [19]. MF thus represents a suitable model system of pathological brain-tissue ferritin that enables the study of the relaxation properties of pathological ferritin in different concentrations and loading factors (LFs)—number of iron atoms per protein [20]. This is required for the correct interpretation of in vivo data, including endogenous iron oxides in different phases and concentrations. The effect of magnetite-containing minerals in pathological ferritin (MF) on longitudinal and transverse relaxivity is expected to be 100–1000 times larger compared to the impact of native ferritin (NF) [21]. This follows from the significantly larger magnetic moment of MF (≈13,000 µB [22]) compared to an NF core (≈300 µB [23]). This should allow differentiation between pathological ferritin (with a magnetite-like mineral core) and physiological ferritin (with a ferrihydrite-like mineral core).
Although this theory has not been confirmed directly by nuclear magnetic resonance (NMR) [24], clinical studies suggest a correlation between hypointensive artefacts in T2 and T2* weighted images and the presence of neurodegeneration [25,26]. This indirectly supports the idea of magnetite-like relaxation in pathological tissue because, at present, it cannot be explained by any other mechanism. The reason for the discrepancy with the NMR study [24] may be that they did not include magnetite particles independent of the protein envelope in their experiments, instead only considering particles with a maximum size of 7 nm. However, in Alzheimer’s disease tissue, magnetite particles with an average size of 33 ± 15 nm and with a maximum diameter up to 200 nm were found [9]. Thus, pathological ferritin could look like decayed MF, where the mineral core serves as a template for further crystal growth, or aggregation of magnetite nuclei due to their dipole interactions. In a recent study, it was confirmed that MF could be distinguished from NF, both in low-field (0.2 T) and high-field (4.7 T) magnetic resonance contrast imaging [20], by comparing the relative contrast and relaxation time values. In the present study, a quantitative and qualitative analysis of MF-induced relaxivity changes at 7 T magnetic resonance imaging will be provided. The main goal is to find out whether it is possible to distinguish in vitro NF from MF as a model system of pathological ferritin by comparison of the relaxivity values. This should have a direct impact on medical applications. The next goal is to determine the correlation and causality of the relaxivity of ferritin samples with respect to the LF, which would enable the diagnosis of the stage of the disease.

2. Results and Discussion

The basic physicochemical characteristics (LF, D<HYDR>, ζ potential, polydispersity index—PDI) of the NF (horse spleen ferritin) and MF samples are shown in Table 1. The LF, D<HYDR> and ζ potential, including magnetization curves, of the mineral core reduction of NF and MF, induced by vitamins B2 and C, have recently been published by this group [15]. Summarizing this earlier work, the hydrodynamic diameter D<HYDR>, determined by dynamic light scattering (DLS), has higher values of MF than NF, probably due to the aggregation of MFs as a consequence of their increased dipole–dipole interactions. This is supported by the observation that NF and MF3 possess almost the same LF but differ significantly in D<HYDR> and PDI. This suggests that the altered mineral core composition is a key factor in the MF size distribution. The PDI points to a broader particle size distribution in all MF samples, which was our intention, as pathological processes in vivo produce a similar formation of aggregates and protein degradation [9,10]. The highest PDI value is for the MF3 sample, which also possesses the highest LF. Thus, the LF (amount of loaded iron) seems to be a determining factor for the D<HYDR> and PDI in MF samples. This is supported by the visible time-dependent sedimentation of agglomerates and ζ potential decrease in MF samples. ζ potential refers to the negative total charge of proteins that provide electrostatic repulsion between particles and comes from the negatively charged amino-acid residues on the protein surface. The value of the ζ potential is related to the viscosity of the aqueous environment and is probably influenced by the LF and iron core type. However, the higher ζ potential and PDI in MF does not mean the samples are unstable. The presence of some monodisperse particles is not excluded; this was demonstrated by the pH variation (changing to lower values indicates the presence of core-shell structures) and by Small-Angle X-ray Scattering (SAXS) [27]. MF samples were prepared to mimic magnetite mineralization and aggregation, which have been found in various pathological processes. To achieve magnetite crystallization in the middle of the synthesis of MF, 2 M NaOH solution was added [28] to prevent the lepidocrocite crystallization that was observed in samples prepared by the standard MF synthetic procedure [29]. The change in pH increased the magnetization, but it also probably partially destroyed the protein coat, as proved in a recent study [27]. Uncoated mineral cores can thus interact with each other forming larger aggregates which were observed, for example, in neurodegenerative diseases [9,10]. The magnetite particles thus prepared formed an ideal model system to study the MRI relaxation properties of physiological and pathological ferritin.
To determine the relaxivity, NF and MF samples with different LFs (Table 1) were measured with three different MRI relaxation time mapping protocols: (i) T1 mapping RARE protocol (Figure S1); (ii) T2 mapping MSME protocol (Figure S2); (iii) T2* mapping MGE protocol (Figure S3). To determine the correlation and causality of different LFs (D<HYDR> and ζ potential) on basic MRI parameters in MF and NF the relative contrast (RC) (Figure S4), relaxation time T (Figure S5) and relaxation rate R (Figure S6) of both NF and MF samples were determined. For all determined values of the relaxation time, the “observed” relaxation time T2* is less than the “true” relaxation time T2, which is to be expected [30]. The reason for this difference is the different physical properties of the T2 and T2* weighted sequences. T2 correlates with the representation of the slow-moving fraction of water molecules. The more slow-moving water-binding macromolecules that are present in the sample, the lower the T2 value. In addition, the T2* value is also affected by the inhomogeneities of the static magnetic field that are caused primarily by the presence of paramagnetic substances in the sample.
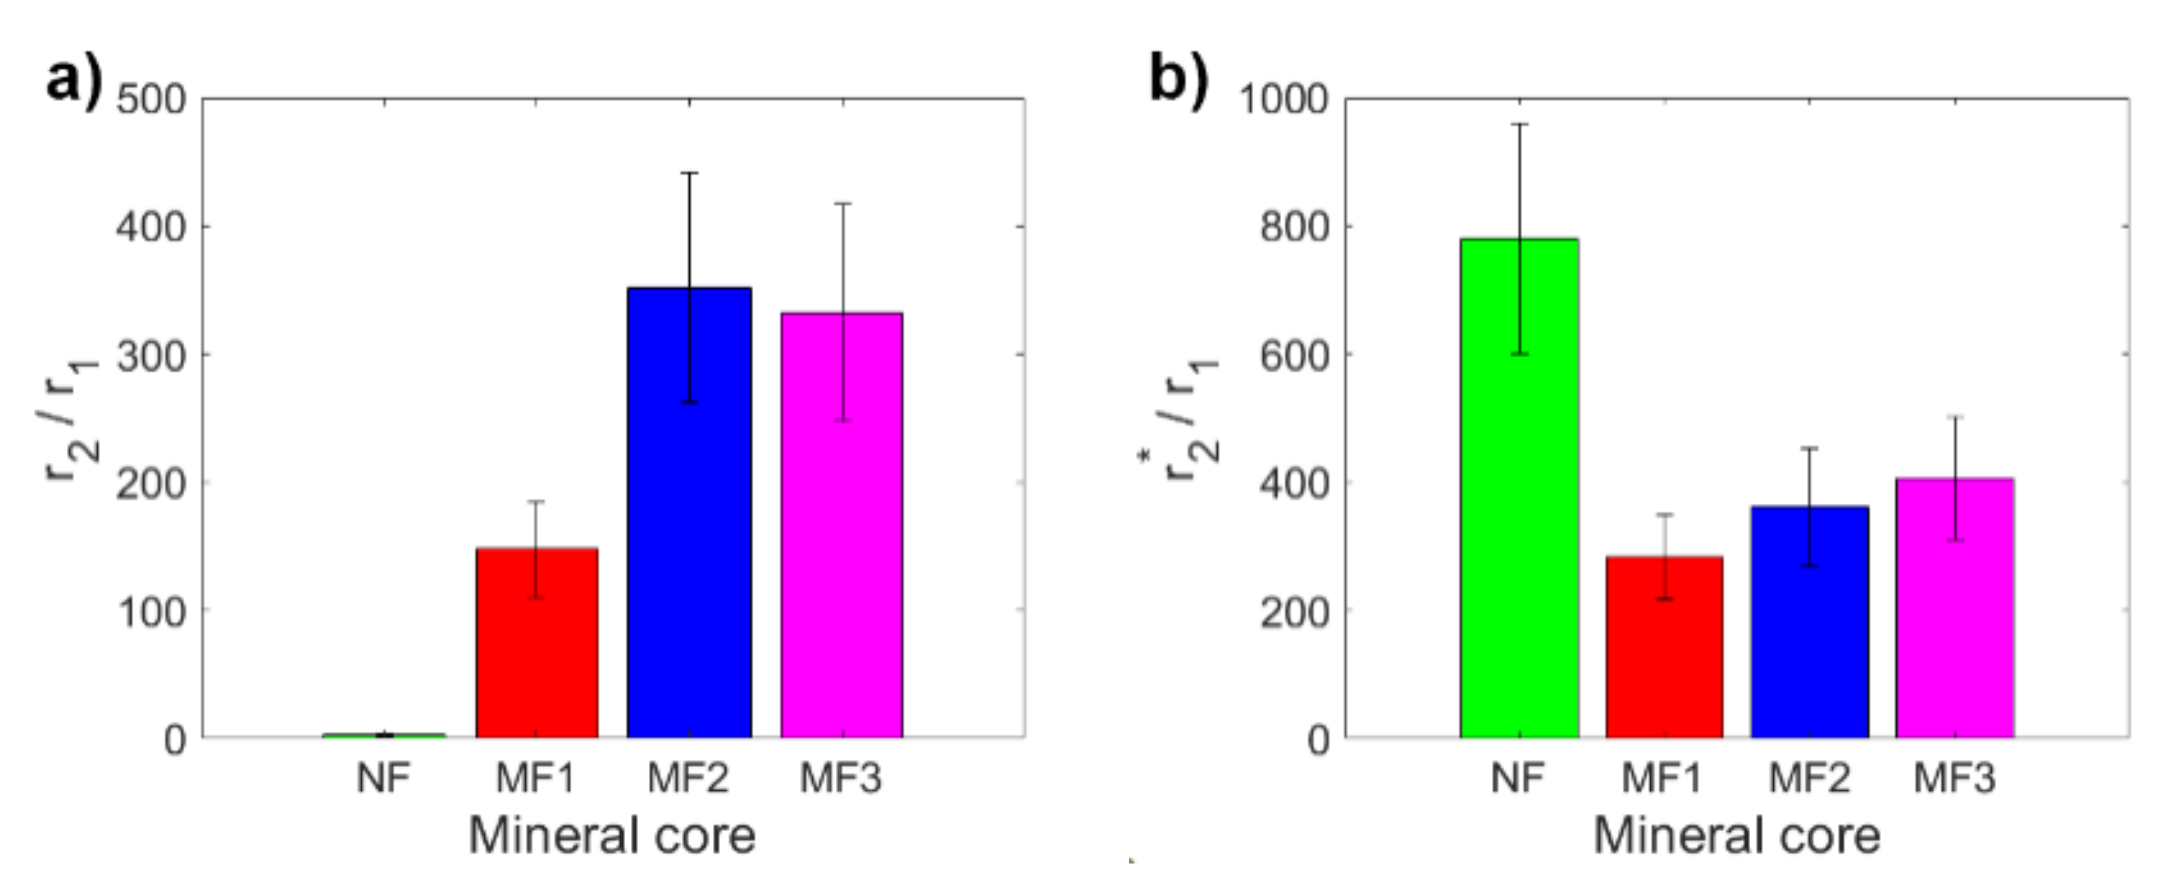
By fitting the longitudinal and transverse relaxation rates R (Figure S7), the relaxivity r was determined (Figure 1). In all cases (different LF values), it was possible to differentiate the relaxivity of NF from MF, as well as the different LF of MF. The difference between NF and MF is the biggest for r2. The transverse relaxivity r2 of NF is of the order of 1–10 mM−1s−1 at a typical magnetic field strength 1–10 T [31], which is consistent with these measurements (1.27 ± 0.23 mM−1s−1). In comparison with the findings of Jordan et al., whose MF preparation includes the incorporation of iron oxide molecules into the protein core via a step-wise Fe(II) chloride addition to the protein solution under low O2 conditions [32], their per-iron transverse relaxivity values r2 obtained by Spin echo sequencing are as follows: NF: r2 = 4 mM−1s−1 (this study: 1.27 ± 0.23 mM−1s−1), MF: r2 = 130 mM−1s−1 (this study: 402 ± 72 mM−1s−1). The per-iron longitudinal relaxivity r1 is 0.07 mM−1s−1 compared to the values found in this study, which are from 1.21 ± 0.22 to 2.17 ± 0.39 mM−1s−1 for different LF values. This difference is probably due to a different concentration range for the relaxivity calculation ([32]: 0.00–0.05 mM of iron, this study: 0.00–0.20 mM of iron) and different LF values, which they do not report. In general, typical superparamagnetic agents, composed of paramagnetic iron oxide ions, have low longitudinal relaxivity r1 (≈1 mM−1s−1) but high transverse relaxivity r2 (≈100 mM−1s−1) [32], which is in agreement with the findings of this study for the MF samples (Table 1).
NF has lower values than MF for r1 and r2*. For r1 and r2*, a decrease in MF relaxivity with increasing LF was observed, while in the case of r2, it was the opposite. From a theoretical point of view, the increase in LF should be accompanied by an increase in relaxivity, as is seen in the case of “true” relaxivity r2. The reason for the opposite course of “observed” relaxivity r2* (a decrease in r value with an increase in LF) is unknown and is outside the scope of this publication. The higher relaxivity of the MF2 sample compared to the MF3 sample (Figure 1b) could be caused by the higher sedimentation/aggregation of MFs in MF2, since the T2 mapping protocols require a much larger time for measurement, in comparison with T2* protocols. In any case, using all three observed values of the relaxivity (r1, r2, r2*), it is possible to differentiate NF from MF as a model system of pathological ferritin.
A key tool for comparing the MRI contrast of different samples is the ratio of transverse and longitudinal relaxivity r2/r1 (r2*/r1). Figure 2 shows a comparison of these ratios for the studied NF and MF samples. The r2/r1 ratio is for MF samples in a range from 148 ± 38 to 352 ± 90 (Figure 2a), which is lower than the findings of Jordan et al. (r2/r1 = 1114) [32]. In the case of the r2*/r1 ratio, it is from 284 ± 66 to 407 ± 96 (Figure 2b), which is higher than the r2/r1 ratio, as predicted. Except for MF2, the values of the ratios for MF show the expected pattern; they increase with an increase in LF. Of particular interest is the high value of the r2*/r1 ratio for NF, which is due to the very high value of the NF transverse relaxivity r2* and the low NF longitudinal relaxivity r1. This peculiarity is probably associated with the change of magnetic properties in nanosized ferrihydrite to superparamagnetic properties, although bulk ferrihydrite exhibits antiferromagnetic behavior [33]. Paramagnetic compounds affect the homogeneity of the magnetic field; the T2* relaxation time is very sensitive to this. However, as in the case of individual relaxivities and also for their ratios (r2/r1, r2*/r1), it is possible to clearly distinguish MF from NF, which is an important result for possible applications.
Based on the relaxivity findings, it was possible to determine the relationship between the different LF of NF and MF cores by calculating the correlation coefficients for all defined MRI parameters (Table 2, Figures S8–S10). Since the samples were prepared with increasing concentration gradients of iron oxide they vary from a normal distribution (analyzed using the Kolmogorov–Smirnov test at the 5% significance level, unpublished data). The Spearman method was used to calculate the correlation coefficients [34]. For interpreting correlation coefficient data, the following conventional approach was used: negligible correlation (0.00–0.10), weak correlation (0.10–0.39), moderate correlation (0.40–0.69), strong correlation (0.70–0.89) and very strong correlation (0.90–1.00) [34]. It was found that all calculated correlation coefficients are positive (Table 2, Figures S8–S10). Except for two values (strong correlation in MF2-MF3 T2 and R2), all MF samples show a very strong correlation for all observed MRI parameters. Based on the magnetite structure of the MF mineral core and its increasing LF, this is the expected result and proves the credibility of the MF samples preparation methodology.
The situation is more diverse in the case of the correlation between NF and MF, from very strong correlation (RC T2w), through strong correlation (RC T2*w, T1, R1) to moderate correlation (RC T1w, T2*, R2*). However, in the case of transverse relaxation time T2 and relaxation rate R2, only a weak correlation was observed for NF-MF2, which is probably associated with the sedimentation/aggregation of MFs in MF2, as discussed above.
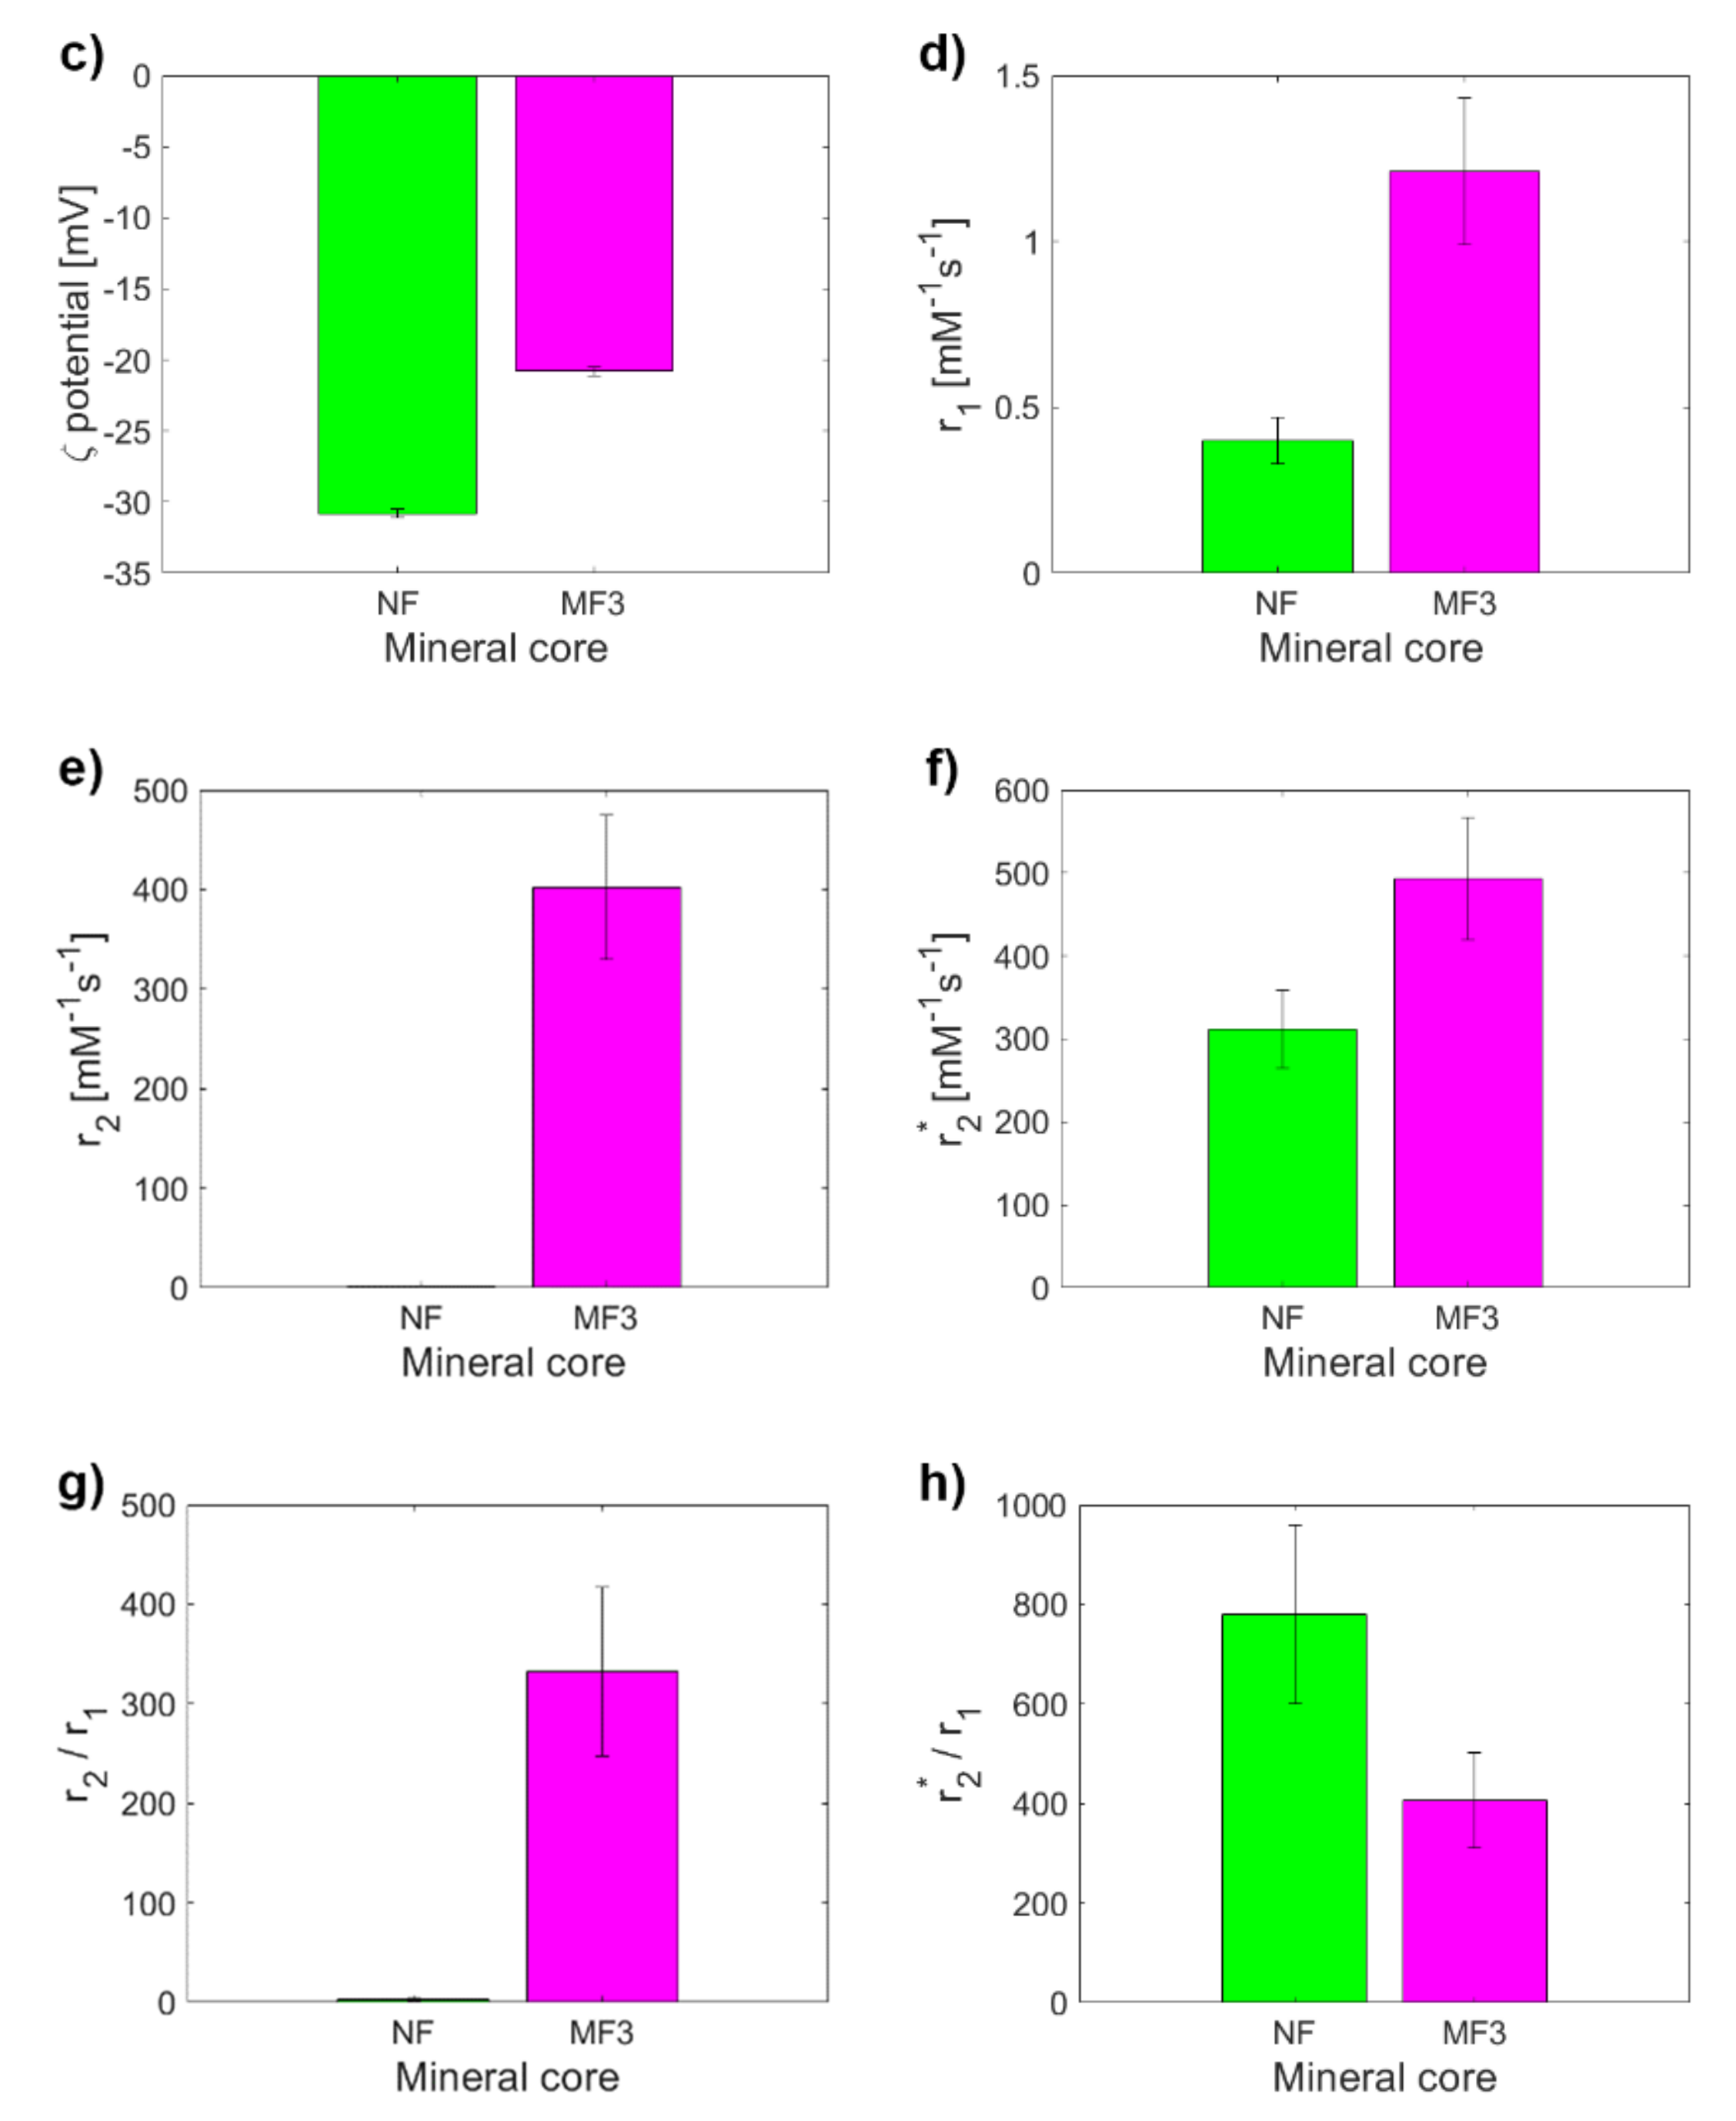
To assess the clinical application of these results it is essential to determine to what extent it is possible to distinguish the physiological mineral core of ferritin (ferrihydrite-like) from the pathological mineral core (magnetite-like). Therefore, the MRI relaxivities of NF and MF3, which have almost the same LF (Figure 3a) but different hydrodynamic diameters (Figure 3b) and ζ potential (Figure 3c), were compared. However, both samples also differ statistically significantly in all of the relaxivities compared: r1, r2, r2*, r2/r1, r2*/r1 (Figure 3d–h). The largest difference (an almost 320-fold increase) between NF and MF3 is observed for transverse relaxivity r2 (Figure 3e), followed by relaxivity ratios r2/r1 (an almost 105-fold increase, Figure 3g). Transverse relaxivity r2 values for all MF samples (Table 1) are higher than the transverse relaxivity of commercially used iron oxide-based contrast agents: Feridex r2 = 120 mM−1s−1, Resovist r2 = 186 mM−1s−1 and Combidex r2 = 65 mM−1 s−1 [35]. The transverse and longitudinal relaxivity ratio r2/r1 is a key feature when comparing the MRI contrast efficacy of the T2 comparison compounds, such as iron oxide-based nanoparticles. The higher the ratio, the better the contrast efficacy and the visibility of the agent [36]. In this case, the ratio r2/r1 is 3.18 ± 0.80 mM−1s−1 for NF compared to r2/r1 = 332 ± 85 mM−1s−1 for MF3, which is even higher than the value for developed magnetite-based contrast agents with the same concentration and in the same magnetic field [37]. Thus, pathologically mineralized magnetite in ferritins should behave like an intrinsic, biogenic iron oxide-based contrast agent. In the case of longitudinal relaxivity r1, a threefold increase in favor of the magnetite mineral core in the MF3 sample was observed. This is not surprising since iron oxides shorten both T1 and T2 relaxation times, although for T2 it is much more pronounced, as was observed in this study (Table 1). The “observed” relaxivity r2* in the case of both NF and MF3 is higher than the “true” relaxivity r2, which agrees with the theory. However, even though ferrihydrite is antiferromagnetic [38] and should have no effect on the main magnetic field, a dramatic increase in the r2* value for NF in comparison with r2 was observed. This was probably caused by a change in magnetic properties of nanosized ferrihydrite to superparamagnetic behavior [33], which has a clear effect on the homogeneity of the magnetic field. An inverted result for the relaxivity ratios r2*/r1 compared to r2/r1 could be used to exclude other artefacts (e.g., tissue calcification) in in vivo diagnostics of pathological iron mineralization from the physiological state.
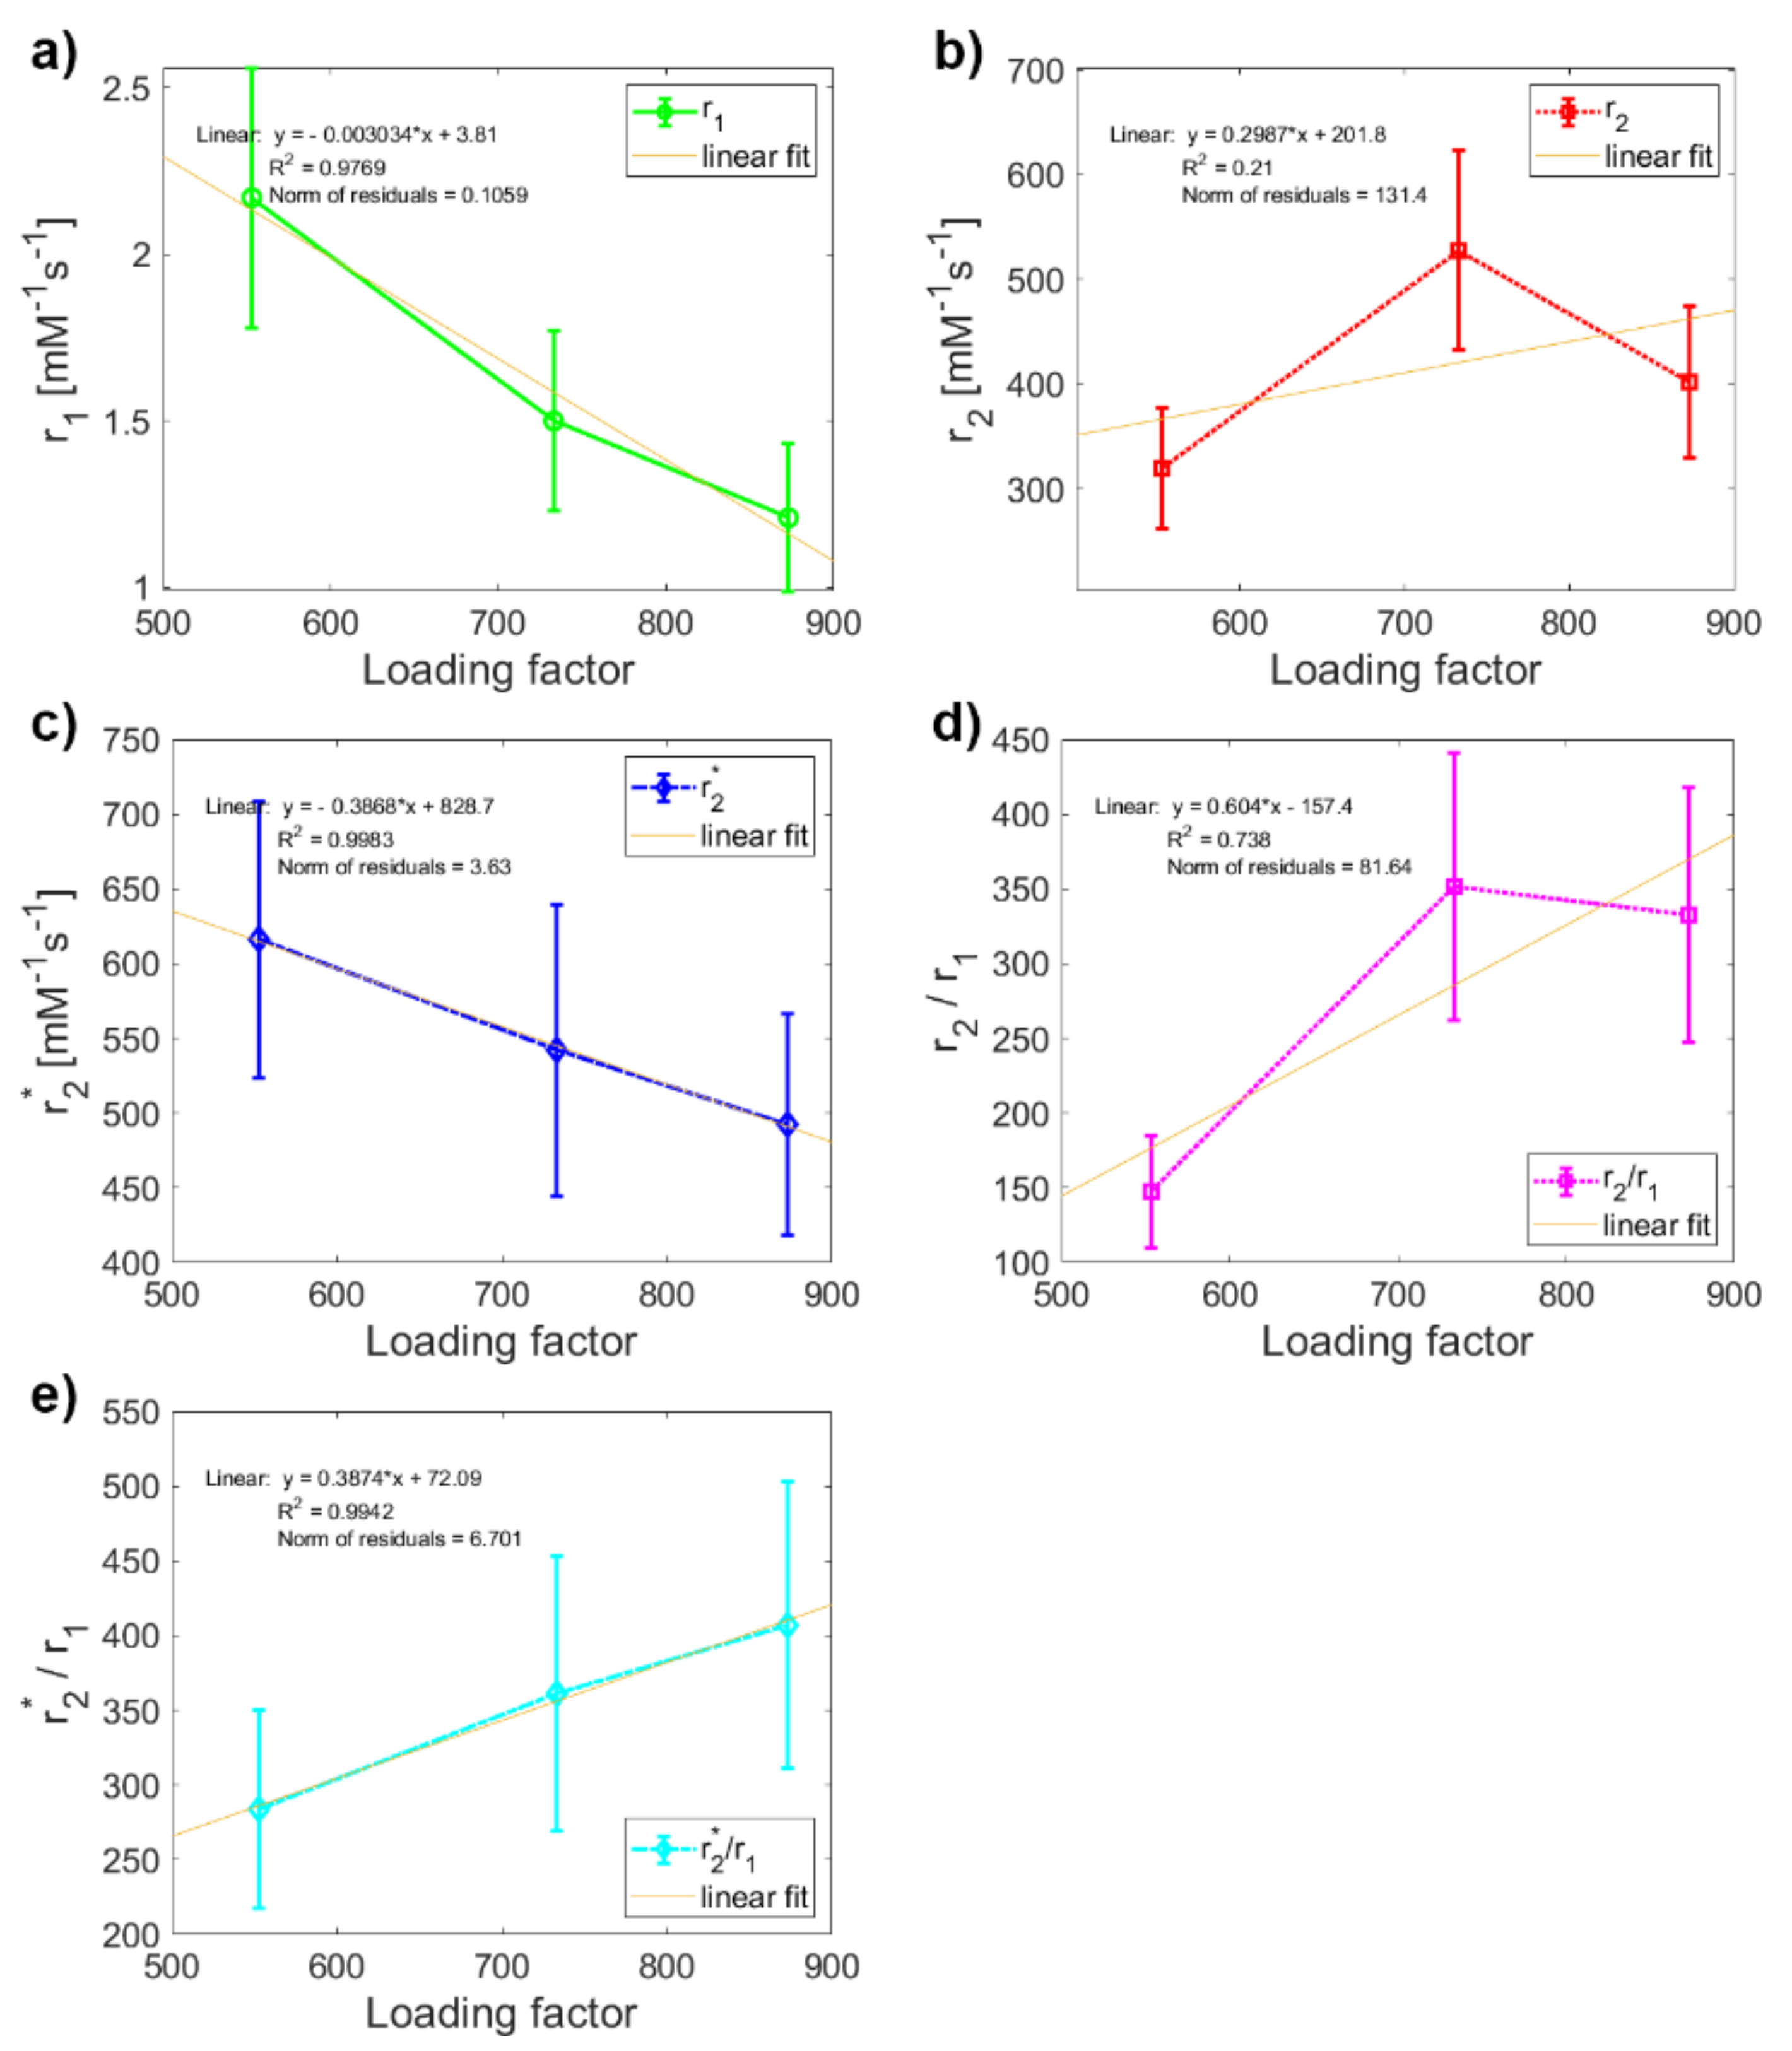
In the last step, regression analysis was used to reveal how the LF affects the relaxivity of MF mineral core and whether it would be possible to use this relationship to predict the rate of pathological magnetite-like iron accumulation and mineralization in tissue. Linear regression analysis showed a clear linear dependence (R2 ≈ 1) of MF sample relaxivity on the value of LF, except for transverse relaxivity r2 (Figure 4). As discussed above, since this anomaly does not occur in the case of longitudinal relaxivity r1 and transverse relaxivity r2*, we believe that it is caused only by higher sedimentation of MFs in the MF2 sample during the longer data acquisition in T2 weighted pulse sequence compared to T1 and T2*-weighted protocols. Therefore, it affects only the “true” relaxation time T2 and not the “observed” relaxation time T2* and longitudinal time T1. The theoretical value of the MF2 transverse relaxivity r2 obtained by extrapolation is 366 mM−1s−1, compared to the value of 528 mM−1s−1 obtained in this study. However, this inaccuracy does not affect the conclusion that the relaxivity of MF is linearly dependent on the LF and it would therefore be possible to determine the amount of accumulated pathological magnetite-like iron in tissue from relaxivity values.

3. Materials and Methods

3.1. Chemicals

Ammonium ferrous sulfate hexahydrate ((NH4)2Fe(SO4)2·6H2O), equine spleen apoferritin in 0.15 M NaCl, ethanol (C2H5sOH), horse spleen ferritin in 0.15 M NaCl, hydrogen peroxide (H2O2), 3-[(1,1-dimethyl-2-hydroxyethyl)amino]-2-hydroxypropanesulfonic acid (AMPSO), sodium hydroxide (NaOH), and trimethylamine N-oxide (Me3NO) were obtained from SIGMA-Aldrich (Saint-Louis, MO, USA); Coomassie brilliant blue from Fluka (Buchs, Switzerland); hydrochloric acid (HCl) from ITES (Vranov nad Toplou, Slovakia); potassium thiocyanate (KSCN) from Slavus (Bratislava, Slovakia); phosphoric acid (H3PO4) from Centralchem (Bratislava, Slovakia), and demineralized water.

3.2. Synthesis of Magnetoferritin

We used horse spleen ferritin as a model system of native ferritin. MF was prepared by the procedure described elsewhere [20]. Ferrous ions were added to the empty protein shell of a native apoferritin (NA) solution with a protein concentration of ≈3 mg/mL. First, the apoferritin solution was added to a 0.05 M AMPSO buffer with the pH adjusted to 8.6 using 2 M NaOH solution, utilizing a pH meter (Mettler Toledo SevenEasy S20-KS) and a pH electrode (Mettler Toledo Inlab®Science Pro). The reaction bottle containing apoferritin solution was hermetically closed. The demineralized water for the solutions’ preparation was deaerated using nitrogen for 1 h to provide anaerobic conditions and controlled oxidation. For the ferrous ion source, we used a 0.1 M solution of Mohr’s salt ((NH4)2Fe(SO4)2·6H2O) and a stoichiometric amount of a 0.07 M solution of trimethylamine N-oxide. The synthesis was carried out by the gradual addition of the reactants in 10 steps over 100 min using syringes at 65 °C under constant stirring via a magnetic stirrer with heating (IKA C-MAG HS 7). MF was prepared with three different LFs: 553, 733, and 872. The LF of NF was 868.

3.3. Quantitative Determination of the Loading Factor

We quantitatively analyzed the LF by Ultraviolet–Visible (UV-VIS) spectrophotometer (SPECORD 40, Analytik Jena, Jena, Germany) at 25 °C with a precision of approximately 1%. The mass concentration of iron atoms c m F e was determined after oxidation of Fe2+ to Fe3+ ions with 3% H2O2 in an acid medium of 35% HCl at 50 °C for 30 min. After the addition of 1 M KSCN, a red thiocyanate complex of Fe[Fe(SCN)6] was produced and its absorbance was measured at 450 nm. From the calibration curve, using the regression equation, the corresponding mass concentration of iron atoms was calculated. The standard Bradford method was used to determine the mass concentration of NA, c m N A . The absorbance of the blue protein complex of the Bradford agent was detected at 595 nm after 5 min incubation at 25 °C. From the calculated ratio of c m F e a: c m N A in a given volume of the sample using the known molecular weights of apoferritin and iron, respectively, the LF of MF was calculated according to the equation:
L F = c m F e · M N A c m N A · M F e

3.4. Measurement of the Hydrodynamic Diameter

The hydrodynamic diameter D<HYDR>of the samples in aqueous solutions was measured using a Zetasizer NanoZS 3600 (Malvern Instruments, Malvern, UK) at 25 °C based on the principle of DLS, also known as photon correlation spectroscopy or quasi-elastic light scattering. DLS analyzes the intensity fluctuations of the scattered light from particles performing Brownian motion and measures the rate of the particles’ diffusion in the solution, which is related to their size as described by the Stokes–Einstein equation:
D T = k · T 6 · π · η · R h
where DT is the diffusion coefficient, k is the Boltzman constant, T is the temperature, η is the solvent viscosity and Rh is the Stokes (or hydrodynamic) radius of the spherical particles (in nm).
The final D<HYDR>values were obtained from triplicate measurement of aqueous protein samples in disposable polystyrene cuvettes using the protein data analysis mode. D<HYDR> was calculated by averaging sizes, displayed as the maximum of the size distribution curve from the number function (PSD). In addition, the size distribution and the PDI were evaluated and compared. The PDI ranges from 0 for uniformly sized particles to 1 for highly polydisperse particles.

3.5. Magnetometry

The magnetic properties of the iron oxide mineral cores inside the protein shell were studied using a SQUID magnetometer MPMS 5XL (Quantum Design, San Diego, CA, USA). The magnetization curves of the MF samples were measured at 290 K and magnetic strength up to 5 T.

3.6. Magnetic Resonance Imaging

The MRI measurements were performed using a 7 T BioSpec Bruker system. Three different protocols were used for T1, T2 and T2* parametric mapping:
  • T1 mapping—Rapid Acquisition with Refocused Echoes (RARE) pulse sequence, with repetition time TR = 5500, 3000, 1500, 800, 400 and 200 ms, and echo time TE = 7 ms.
  • T2 mapping—Multi-Slice Multi-Echo (MSME) pulse sequence, with repetition time TR = 2000 ms, starting echo time TE = 8 ms, spacing = 8 ms, and 25 images.
  • T2* mapping—Multi Gradient Echo (MGE) pulse sequence, with repetition time TR = 1200 ms, starting echo time TE = 5.1 ms, spacing = 5 ms, and 10 images.
The concentration gradient (2.5 × 10⁻³–0.02 mg/mL) of ferrihydrite in ferritin and magnetite in MF was prepared to perform relaxivity measurements. First, the signal intensity values (I0—without iron oxide core and I—with iron oxide core) were acquired and evaluated as the relative contrast (RC). The RC of iron oxides that are characterized as a negative contrast agent (I0 > I) is defined as follows:
RC = (II0)/I0
where I0 is the signal intensity without iron oxide particles and I is the signal intensity with iron oxide particles.
Subsequently, the longitudinal and transverse relaxation times (T1, T2 and T2*) were determined by fitting with the following functions:
M(t) = A + M0 × (1 − exp(t/T1))
y = A + C × exp(−t/T2)
where M0 is the equilibrium magnetization, A is the absolute bias, T1 is the longitudinal recovery time, C is the signal intensity and T2 is the transverse relaxation time.
The value of T2 is only influenced by atomic molecular interactions, while the T2* value reflects atomic molecular interactions, as well as inhomogeneities in the main magnetic field (B0). Finally, the transverse and longitudinal relaxation rates (R1, R2 and R2*) and relaxivity (r1, r2, r2*) values were calculated and evaluated. The transverse relaxation rate (Rn) is the inverse of the relaxation time (Tn):
Rn = 1/Tn (n = 1 or 2)
The change in Rn characterizes the efficiency of the magnetic particle MRI contrast properties and is defined as the relaxivity of the particle (contrast agent):
rn = (RnRn0)/CIO (n = 1 or 2)
where Rn0 is the relaxation rate in the absence of magnetic (iron oxide) particles, Rn represents the relaxation rate in the presence of magnetic particles and CIO is the particle (iron oxide) concentration. The relaxivity value rn using a linear fit of the relaxation rate Rn dependence on the molar concentration of iron in ferrihydrite and magnetite was determined.
A Paravision “Image Sequence Analysis” tool (Bruker, Billerica, MA, USA) and a Matlab R2021a software tool (Mathworks Inc., Natic, MA, USA) were used for MRI data processing and visualization.

3.7. Statistics

Basic statistics (mean, standard deviation, fitting parameters), including the Kolmogorov–Smirnov test for normality, the calculation of Spearman correlation coefficients and linear regression analysis, were performed using a Matlab R2021a software tool (Mathworks Inc., Natic, MA, USA).

4. Conclusions

The MRI relaxivity at 7 T in NF and MF with different LF was analyzed to show the differences in longitudinal and transverse relaxivity as a model system for pathological ferritin. The relaxivities r1, r2, and r2* were obtained by comparing the relaxation rates (R1, R2, and R2*), which show that NF differs significantly from MF with various LF for all studied relaxation parameters: r1, r2, r2*, r2/r1, r2*/r1. This may be useful in non-invasive MRI diagnosis of the pathological processes associated with iron accumulation and magnetite mineralization in ferritin (e.g., neurodegenerative disorders, cancer, and diseases of the heart, lungs and liver). In addition, it was found that MF samples possess very strong correlation and MF relaxivity is linearly dependent on the LF for all the studied relaxation parameters (r1, r2, r2*, r2/r1, r2*/r1). The transverse and longitudinal ratios r2/r1 and r2*/r1, as basic MRI contrast variables, exhibit complementary information. This can be useful in eliminating false-positive hypointensive artefacts and the diagnosis of the stage of pathology (related to the stage of mineralization and LF). These findings contribute to the understanding of iron oxide accumulation in early non-invasive MRI diagnosis of the pathological processes related to disrupted iron homeostasis and magnetite mineralization in tissue.

Supplementary Materials

The following are available online at https://www.mdpi.com/article/10.3390/ijms22168487/s1.

Author Contributions

Conceptualization, O.S. and L.B.; methodology, L.B. and O.S.; software, O.S.; validation, O.S., L.B. and P.K.; formal analysis, O.S. and L.B.; investigation, O.S., L.B., M.K., J.G. and J.K.; resources, P.K., D.D. and O.S.; data curation, O.S. and L.B.; writing—original draft preparation, O.S. and L.B.; writing—review and editing, O.S. and L.B.; visualization, O.S. and L.B.; supervision, D.D. and P.K.; project administration, O.S., D.D. and P.K.; funding acquisition, P.K., D.D. and O.S. All authors have read and agreed to the published version of the manuscript.

Funding

This research was funded by the Ministry of Health of the Slovak Republic (2018/11-UKMT-7), the Competence Centre Martin (ITMS code: 26220220153), the Slovak Research and Development Agency (APVV-19-0324), VEGA project no. 1/0266/18 and 2/0044/20, the MAGBBRIS project (Euronanomed III 8th joint call), and as a result of the project implementation: MODEX (ITMS 313011T548) supported by the Operational Programme Integrated Infrastructure (OPII) funded by the ERDF and MVTS SAV MOST SkTW AMAZON.

Institutional Review Board Statement

Not applicable.

Informed Consent Statement

Not applicable.

Data Availability Statement

The data presented in this study are available on request from the corresponding author. The data are not publicly available due to institutional restrictions.

Conflicts of Interest

The authors declare no conflict of interest.

References

  1. Ilbert, M.; Bonnefoy, V. Insight into the evolution of the iron oxidation pathways. Biochim. Biophys. Acta 2013, 1827, 161–175. [Google Scholar] [CrossRef] [Green Version]
  2. Wessling-Resnick, M. Iron homeostasis and the inflammatory response. Annu. Rev. Nutr. 2010, 30, 105–122. [Google Scholar] [CrossRef] [Green Version]
  3. Hagemeier, J.; Geurts, J.J.G.; Zivadinov, R. Brain iron accumulation in aging and neurodegenerative disorders. Expert Rev. Neuro. 2012, 12, 1467–1480. [Google Scholar] [CrossRef]
  4. Frank-Cannon, T.C.; McAlpine, A.L.T.; Tansey, M.G. Does neuroinflammation fan the flame in neurodegenerative diseases? Mol. Neurodegener. 2009, 4, 47. [Google Scholar] [CrossRef] [Green Version]
  5. Jung, M.; Mertens, C.; Tomat, E.; Brune, B. Iron as a central player and promising target in cancer progression. Int. J. Mol. Sci. 2019, 20, 273. [Google Scholar] [CrossRef] [PubMed] [Green Version]
  6. Milic, S.; Mikolasevic, I.; Orlic, L.; Devic, E.; Starcevic-Cizmarevic, N.; Stimac, D.; Kapovic, M.; Ristic, S. The role of iron and iron overload in chronic liver disease. Med. Sci. Monit. 2016, 22, 2144–2151. [Google Scholar] [CrossRef] [PubMed] [Green Version]
  7. Kobayashi, M.; Suhara, T.; Baba, Y.; Kawasaki, N.K.; Higa, J.; Matsui, T. Pathological roles of iron in cardiovascular disease. Curr. Drug Targets 2018, 19, 1068–1076. [Google Scholar] [CrossRef] [PubMed]
  8. Ganz, T. Does pathological iron overload impair the function of human lungs? EBioMedicine 2017, 20, 13–14. [Google Scholar] [CrossRef] [Green Version]
  9. Kirschvink, J.L.; Kobayashi-Kirschvink, A.; Woodford, B.J. Magnetite biomineralization in the human brain. Proc. Natl. Acad. Sci. USA 1992, 89, 7683–7687. [Google Scholar] [CrossRef] [PubMed] [Green Version]
  10. Hautot, D.; Pankhurst, Q.A.; Khan, N.; Dobson, J. Preliminary evaluation of nanoscale biogenic magnetite in Alzheimer’s disease brain tissue. Proc. R. Soc. Lond. B 2003, 270, S62–S64. [Google Scholar] [CrossRef] [PubMed] [Green Version]
  11. Dobson, J. Nanoscale biogenic iron oxides and neurodegenerative disease. FEBS Lett. 2001, 496, 1–5. [Google Scholar] [CrossRef] [Green Version]
  12. Wang, J.; Pantopoulos, K. Regulation of cellular iron metabolism. Biochem. J. 2011, 434, 365–381. [Google Scholar] [CrossRef] [Green Version]
  13. Tabner, B.J. Protein aggregation, metals and oxidative stress in neurodegenerative diseases. Biochem. Soc. Trans. 2005, 33, 1082–1086. [Google Scholar] [CrossRef]
  14. Klaunig, J.E.; Kamendulis, L.M.; Hocevar, B.A. Oxidative stress and oxidative damage in carcinogenesis. Toxicol. Pathol. 2010, 38, 96–109. [Google Scholar] [CrossRef] [PubMed] [Green Version]
  15. Strbak, O.; Balejcikova, L.; Kmetova, M.; Gomobos, J.; Trancikova, A.; Pokusa, M.; Kopcansky, P. Quantification of iron release from native ferritin and magnetoferritin induced by vitamins B2 and C. Int. J. Mol. Sci. 2020, 21, 6332. [Google Scholar] [CrossRef] [PubMed]
  16. Quintana, C.; Cowley, J.M.; Marhic, C. Electron nanodiffraction and high-resolution electron microscopy studies of the structure and composition of physiological and pathological ferritin. J. Struct. Biol. 2004, 147, 166–178. [Google Scholar] [CrossRef] [PubMed]
  17. Chasteen, N.D.; Harrison, P.M. Mineralization in ferritin: An efficient means of iron storage. J. Struct. Biol. 1999, 126, 182–194. [Google Scholar] [CrossRef] [PubMed] [Green Version]
  18. Bossoni, L.; Moursel, L.G.; Bulk, M.; Simon, B.G.; Webb, A.; Weerd, L.; Huber, M.; Carreta, P.; Lascalfari, A.; Oosterkamp, T.H. Human-brain ferritin studied by muon spin rotation: A pilot study. J. Phys. Condens. Matter 2017, 29, 415801. [Google Scholar] [CrossRef] [PubMed]
  19. Xue, L.; Deng, D.; Sun, J. Magnetoferritin: Process, prospects, and their biomedical applications. Int. J. Mol. Sci. 2019, 20, 2426. [Google Scholar] [CrossRef] [Green Version]
  20. Strbak, O.; Balejcikova, L.; Baciak, L.; Kovac, J.; Masarova-Kozelova, M.; Krafcik, A.; Dobrota, D.; Kopcansky, P. Low-field and high-field magnetic resonance contrast imaging of magnetoferritin as a pathological model system of iron accumulation. J. Phys. D Appl. Phys. 2017, 50, 365401. [Google Scholar] [CrossRef]
  21. Bulte, J.W.M.; Vymazal, J.; Brooks, R.A.; Pierpaoli, C.; Frank, J.A. Frequency dependence of MR relaxation times II. Iron oxides. J. Magn. Reson. Imaging 1993, 3, 641–648. [Google Scholar] [CrossRef]
  22. Bulte, J.W.M.; Douglas, T.; Mann, S.; Frankel, R.B.; Moskowitz, B.M.; Brooks, R.A.; Baumgarner, C.D.; Vymazal, J.; Strub, M.P.; Frank, J.A. Magnetoferritin: Characterization of a novel superparamagnetic MR contrast agent. J. Magn. Reson. Imaging 1994, 4, 497–505. [Google Scholar] [CrossRef] [PubMed]
  23. Papaefthymiou, G.C. The Mossbauer and magnetic properties of ferritin cores. Biochim. Biophys. Acta 2010, 1800, 886–897. [Google Scholar] [CrossRef]
  24. Gossuin, Y.; Hautot, D.; Muller, R.N.; Pankhurst, Q.; Dobson, J.; Morris, C.; Gillis, P.; Collingwood, J. Looking for biogenic magnetite in brain ferritin using NMR relaxometry. NMR Biomed. 2005, 18, 469–472. [Google Scholar] [CrossRef] [PubMed]
  25. Dusek, P.; Dezortova, M.; Wuerfel, J. Imaging of iron. Int. Rev. Neurobiol. 2013, 110, 195–239. [Google Scholar]
  26. Masarova, M.; Krafcik, A.; Teplan, M.; Strbak, O.; Gogola, D.; Boruta, P.; Dobrota, D.; Frollo, I. Comparison of iron oxide-related MRI artifacts in healthy and neuropathological human brain tissue. Acta Phys. Pol. A 2017, 131, 1108–1110. [Google Scholar] [CrossRef]
  27. Balejcikova, L.; Garamus, V.M.; Avdeev, M.V.; Petrenko, V.I.; Almasy, L.; Kopcansky, P. The Effect of Solution pH on the Structural Stability of Magnetoferritin. Colloids Surf. B Biointerfaces 2017, 156, 375–381. [Google Scholar] [CrossRef]
  28. Baumgartner, J.; Bertinetti, L.; Widdrat, M.; Hirt, A.M.; Faivre, D. Formation of Magnetite Nanoparticles at Low Temperature: From Superparamagnetic to Stable Single Domain Particles. PLoS ONE 2013, 8, e57070. [Google Scholar]
  29. Balejcikova, L.; Molcan, M.; Kovac, J.; Kubovcikova, M.; Saksl, K.; Mitroova, Z.; Timko, M.; Kopcansky, P. Hyperthermic effect in magnetoferritin aqueous colloidal solution. J. Mol. Liq. 2019, 283, 39–44. [Google Scholar] [CrossRef]
  30. Antal, I.; Strbak, O.; Khmara, I.; Koneracka, M.; Kubovcikova, M.; Zavisova, V.; Kmetova, M.; Baranovicova, E.; Dobrota, D. MRI relaxivity changes of the magnetic nanoparticles induced by different amino acid coatings. Nanomaterials 2020, 10, 394. [Google Scholar] [CrossRef] [Green Version]
  31. Bennett, K.M.; Shapiro, E.M.; Sotak, C.H.; Koretsky, A.P. Controlled aggregation of ferritin to modulate MRI relaxivity. Biophys. J. 2008, 95, 342–351. [Google Scholar] [CrossRef] [Green Version]
  32. Jordan, V.C.; Caplan, M.R.; Bennett, K.M. Simplified synthesis and relaxometry of magnetoferritin for magnetic resonance imaging. Magn. Reson. Med. 2010, 64, 1260–1266. [Google Scholar] [CrossRef] [PubMed]
  33. Hiemstra, T. Surface structure controlling nanoparticle behavior: Magnetism of ferrihydrite, magnetite, and maghemite. Environ. Sci.: Nano 2018, 5, 752–764. [Google Scholar] [CrossRef]
  34. Schober, P.; Boer, C.; Schwarte, L.A. Correlation coefficients: Appropriate use and interpretation. Anesth. Analg. 2018, 126, 1763–1768. [Google Scholar] [CrossRef]
  35. Estelrich, J.; Sanchez-Martin, M.J.; Busquets, M.A. Nanoparticles in magnetic resonance imaging: From simple to dual contrast agents. Int. J. Nanomed. 2015, 10, 1727–1741. [Google Scholar]
  36. Qin, J.; Laurent, S.; Jo, Y.S.; Roch, A.; Mikhaylova, M.; Bhujwalla, Z.M.; Muller, R.N.; Muhammed, M. A high-performance magnetic resonance imaging T2 contrast agent. Adv. Mater. 2007, 19, 1874–1878. [Google Scholar] [CrossRef]
  37. Strbak, O.; Antal, I.; Khmara, I.; Koneracka, M.; Kubovcikova, M.; Zavisova, V.; Molcan, M.; Jurikova, A.; Hnilicova, P.; Gombos, J.; et al. Influence of dextran molecular weight on the physical properties of magnetic nanoparticles for hyperthermia and MRI applications. Nanomaterials 2020, 10, 2468. [Google Scholar] [CrossRef]
  38. Michel, F.M.; Barrón, V.; Torrent, J.; Morales, M.P.; Serna, C.J.; Boily, J.F.; Liu, Q.; Ambrosini, A.; Cismasu, A.C.; Brown, G.E., Jr. Ordered ferrimagnetic form of ferrihydrite reveals links among structure, composition, and magnetism. Proc. Natl. Acad. Sci. USA 2010, 107, 2787–2792. [Google Scholar] [CrossRef] [PubMed] [Green Version]
Figure 1. Comparison of relaxivity values of NF and MF samples: (a) longitudinal relaxivity r1; (b) transverse relaxivity r2; (c) transverse relaxivity r2*.
Ijms 22 08487 g001
Figure 2. Comparison of relaxivity ratios of NF and MF samples: (a) r2/r1; (b) r2*/r1.
Ijms 22 08487 g002
Figure 3. Comparison of the observed variables for NF and MF3, which have almost the same LF (868.00 vs. 873.00): (a) LF; (b) D<HYDR>; (c) ζ potential; (d) longitudinal relaxivity r1; (e) transverse relaxivity r2; (f) transverse relaxivity r2*; (g) relaxivity ratio r2/r1; (h) relaxivity ratio r2*/r1.
Ijms 22 08487 g003aIjms 22 08487 g003b
Figure 4. Linear regression analysis of the dependence of relaxivity on LF: comparison of variables Figure 3. samples: (a) longitudinal relaxivity r1; (b) transverse relaxivity r2; (c) transverse relaxivity r2*; (d) relaxivity ratio r2/r1; (e) relaxivity ratio r2*/r1.
Ijms 22 08487 g004
Table 1. The physico-chemical properties and relaxivity values of NF and MF: (i) loading factor (LF); (ii) hydrodynamic diameter (D<HYDR>); (iii) ζ potential; (iv) polydispersity index (PDI); (v) longitudinal relaxivity r1; (vi) transverse (“true”) relaxivity r2; (vii) transverse (“observed”) relaxivity r2*; (viii) relaxivity ratio r2/r1; (ix) relaxivity ratio r2*/r1.
NFMF1MF2MF3
LF868.00 ± 0.03553.00 ± 0.08 733.00 ± 0.42873.00 ± 0.11
D<HYDR> (nm)15.600 ± 0.00246.000 ± 0.00346.500 ± 0.05642.200 ± 0.012
ζ potential (mV)–30.8 ± 0.3–29.3 ± 0.5–26.9 ± 0.1–20.8 ± 0.3
PDI0.30 ± 0.02 0.40 ± 0.020.40 ± 0.030.60 ± 0.01
r1 (mM−1s−1)0.40 ± 0.072.17 ± 0.391.50 ± 0.271.21 ± 0.22
r2 (mM−1s−1)1.27 ± 0.23320 ± 58528 ± 95402 ± 72
r2* (mM−1s−1)311 ± 47616 ± 92542 ± 98492 ± 74
r2/r13.18 ± 0.80148 ± 38352 ± 90332 ± 85
r2*/r1779 ± 180 284 ± 66361 ± 92407 ± 96
Errors are standard deviation.
Table 2. Calculated Spearman correlation coefficients (CC) between the different LFs of NF and MF cores for all defined MRI parameters (RC, T, R).
CCRC T1wRC T2wRC T2*wT1T2T2*R1R2R2*
NF-MF10.480.970.750.670.450.600.670.450.60
NF-MF20.480.870.730.670.170.620.670.170.62
NF-MF30.480.950.750.780.720.600.780.720.60
MF1-MF21.000.930.981.000.920.981.000.920.98
MF1-MF31.000.981.000.970.921.000.970.921.00
MF2-MF31.000.950.980.970.750.980.970.750.98
Publisher’s Note: MDPI stays neutral with regard to jurisdictional claims in published maps and institutional affiliations.