
Worsening of the Toxic Effects of (±)Cis-4,4′-DMAR Following Its Co-Administration with (±)Trans-4,4′-DMAR: Neuro-Behavioural, Physiological, Immunohistochemical and Metabolic Studies in Mice

 ,
,  ,
,  , ,
, ,  and
and 
Abstract
1. Introduction
2. Results
2.1. Behavioural Studies
2.1.1. Physiological and Neuro-Behavioural Responses with (±)Cis-4,4′-DMAR
2.1.2. Physiological and Neuro-Behavioural Responses to (±)Trans-4,4′-DMAR
2.1.3. Physiological and Neuro-Behavioural Responses to the Concurrent (±)Cis-4,4′-DMAR + (±)Trans-4,4′-DMAR Administration
2.2. Results of Tissue Samples Collection
2.2.1. Histological Results
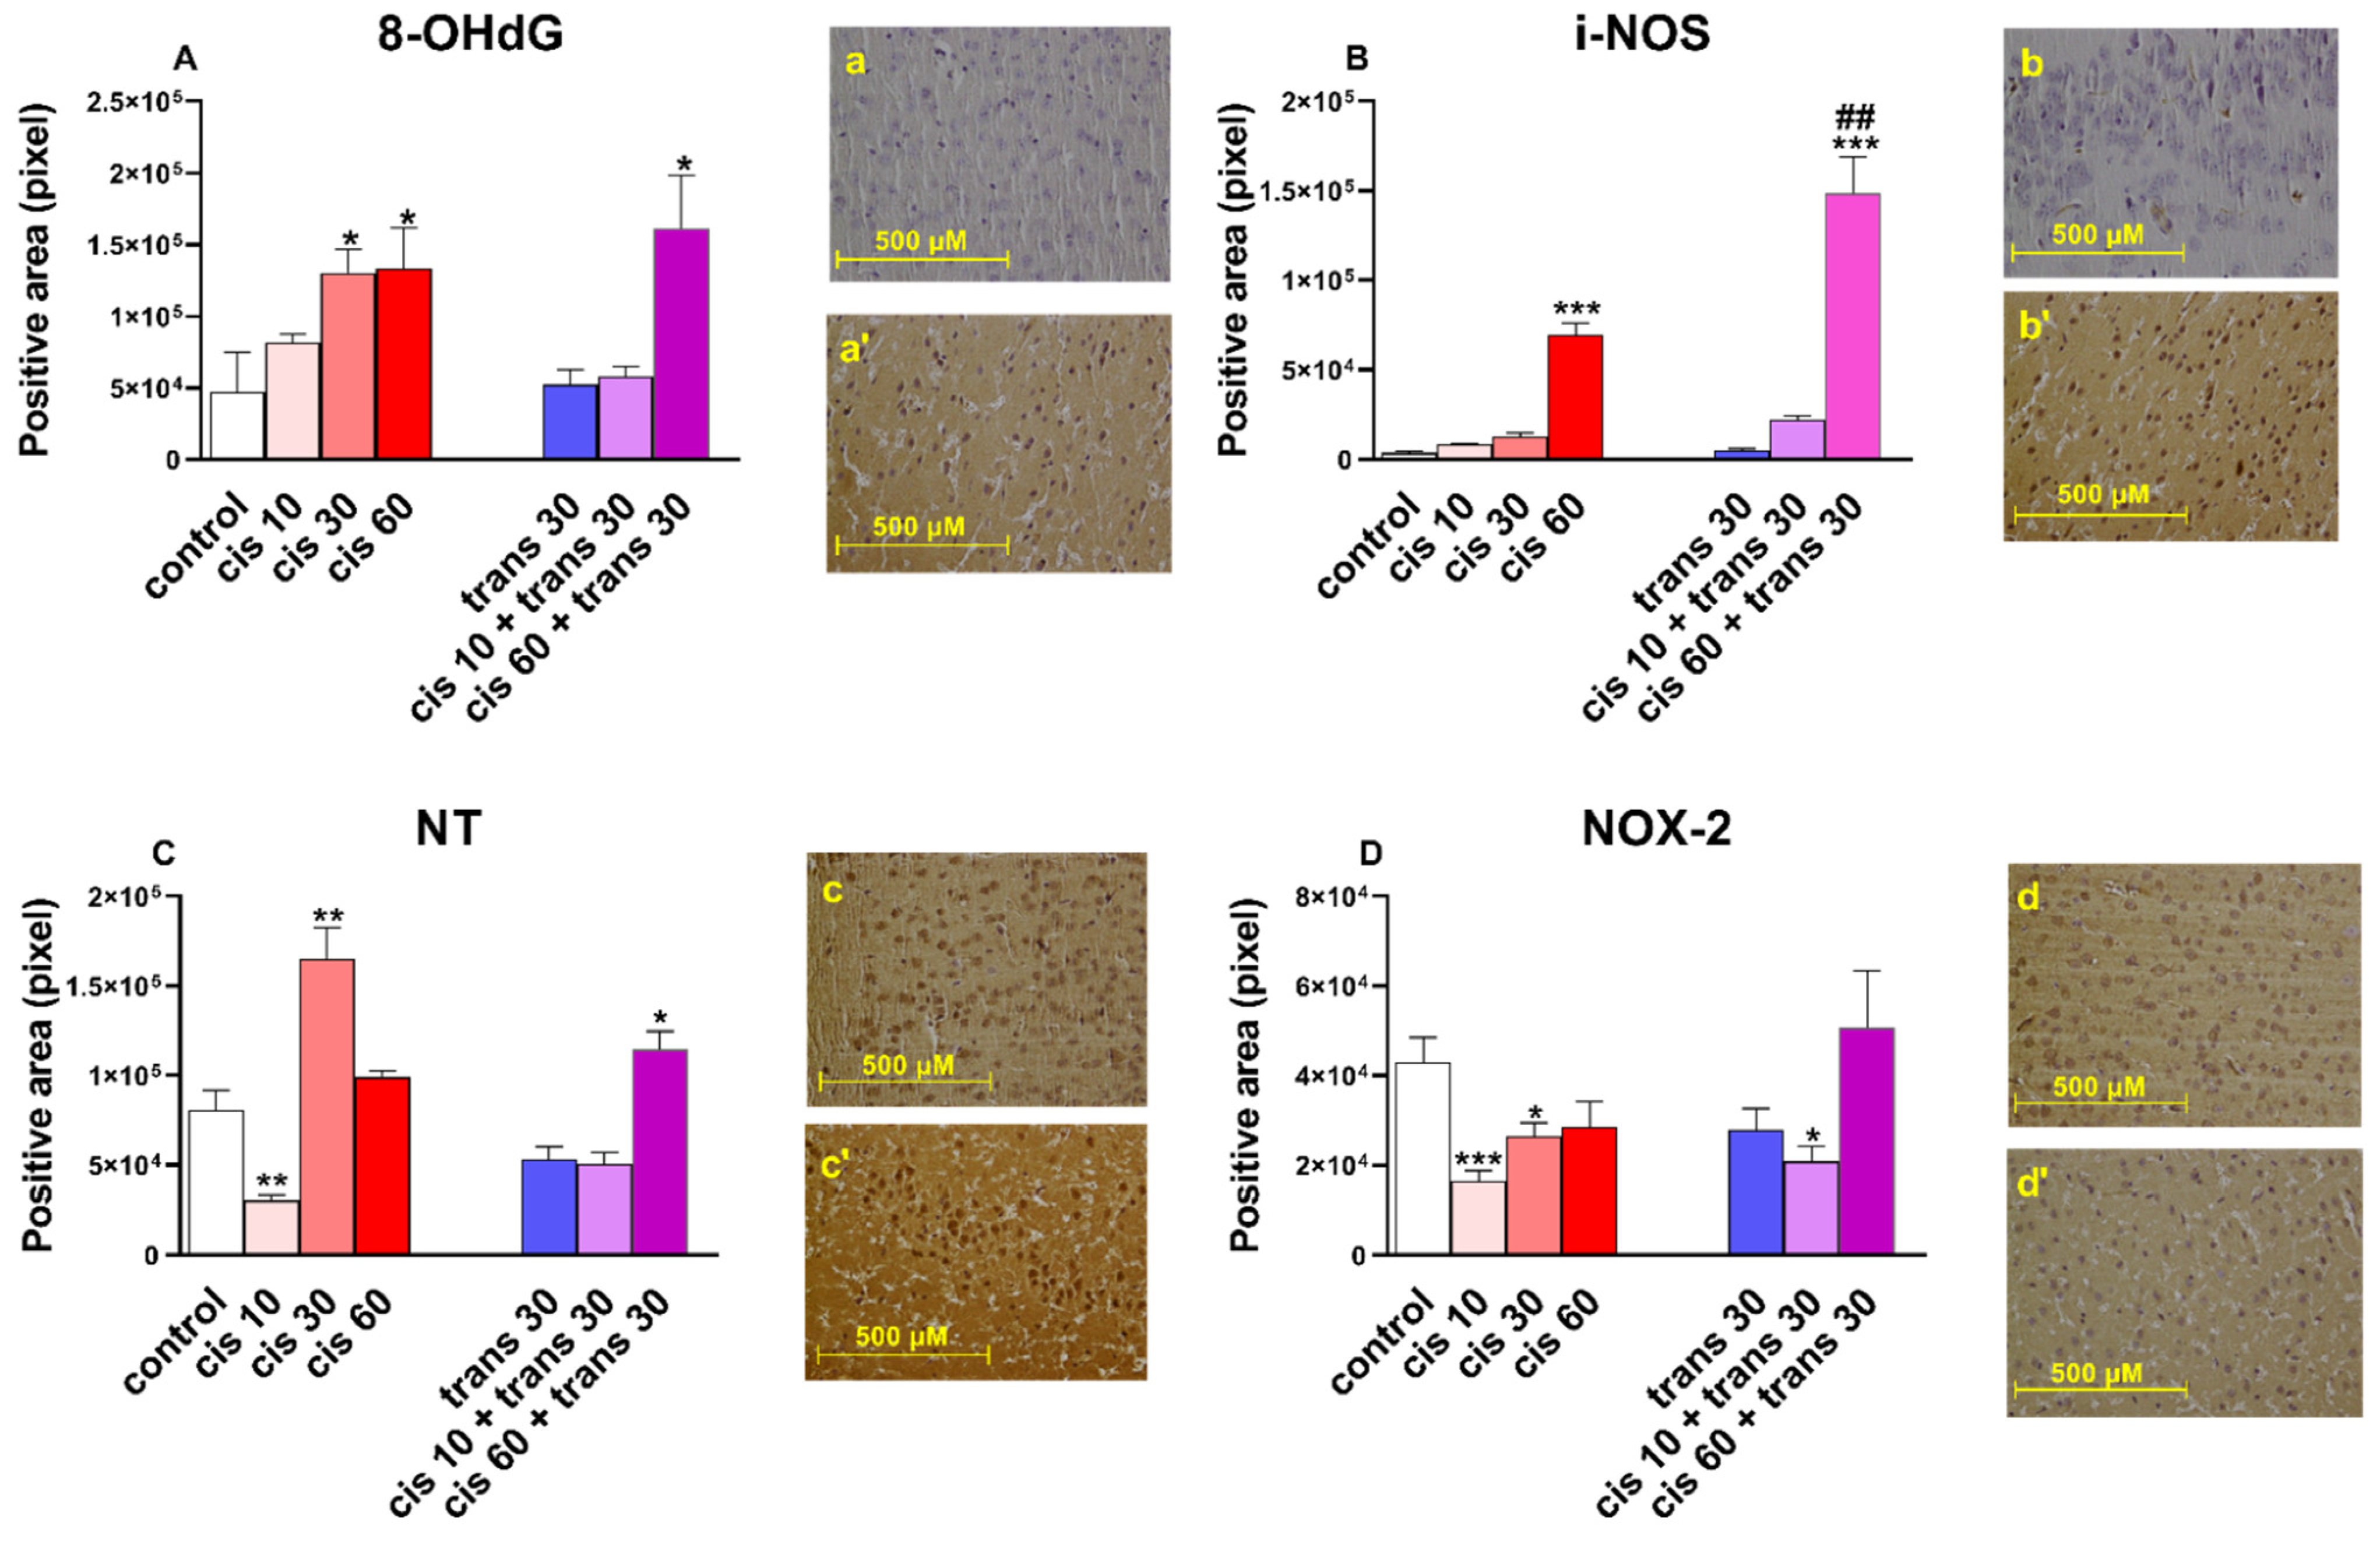
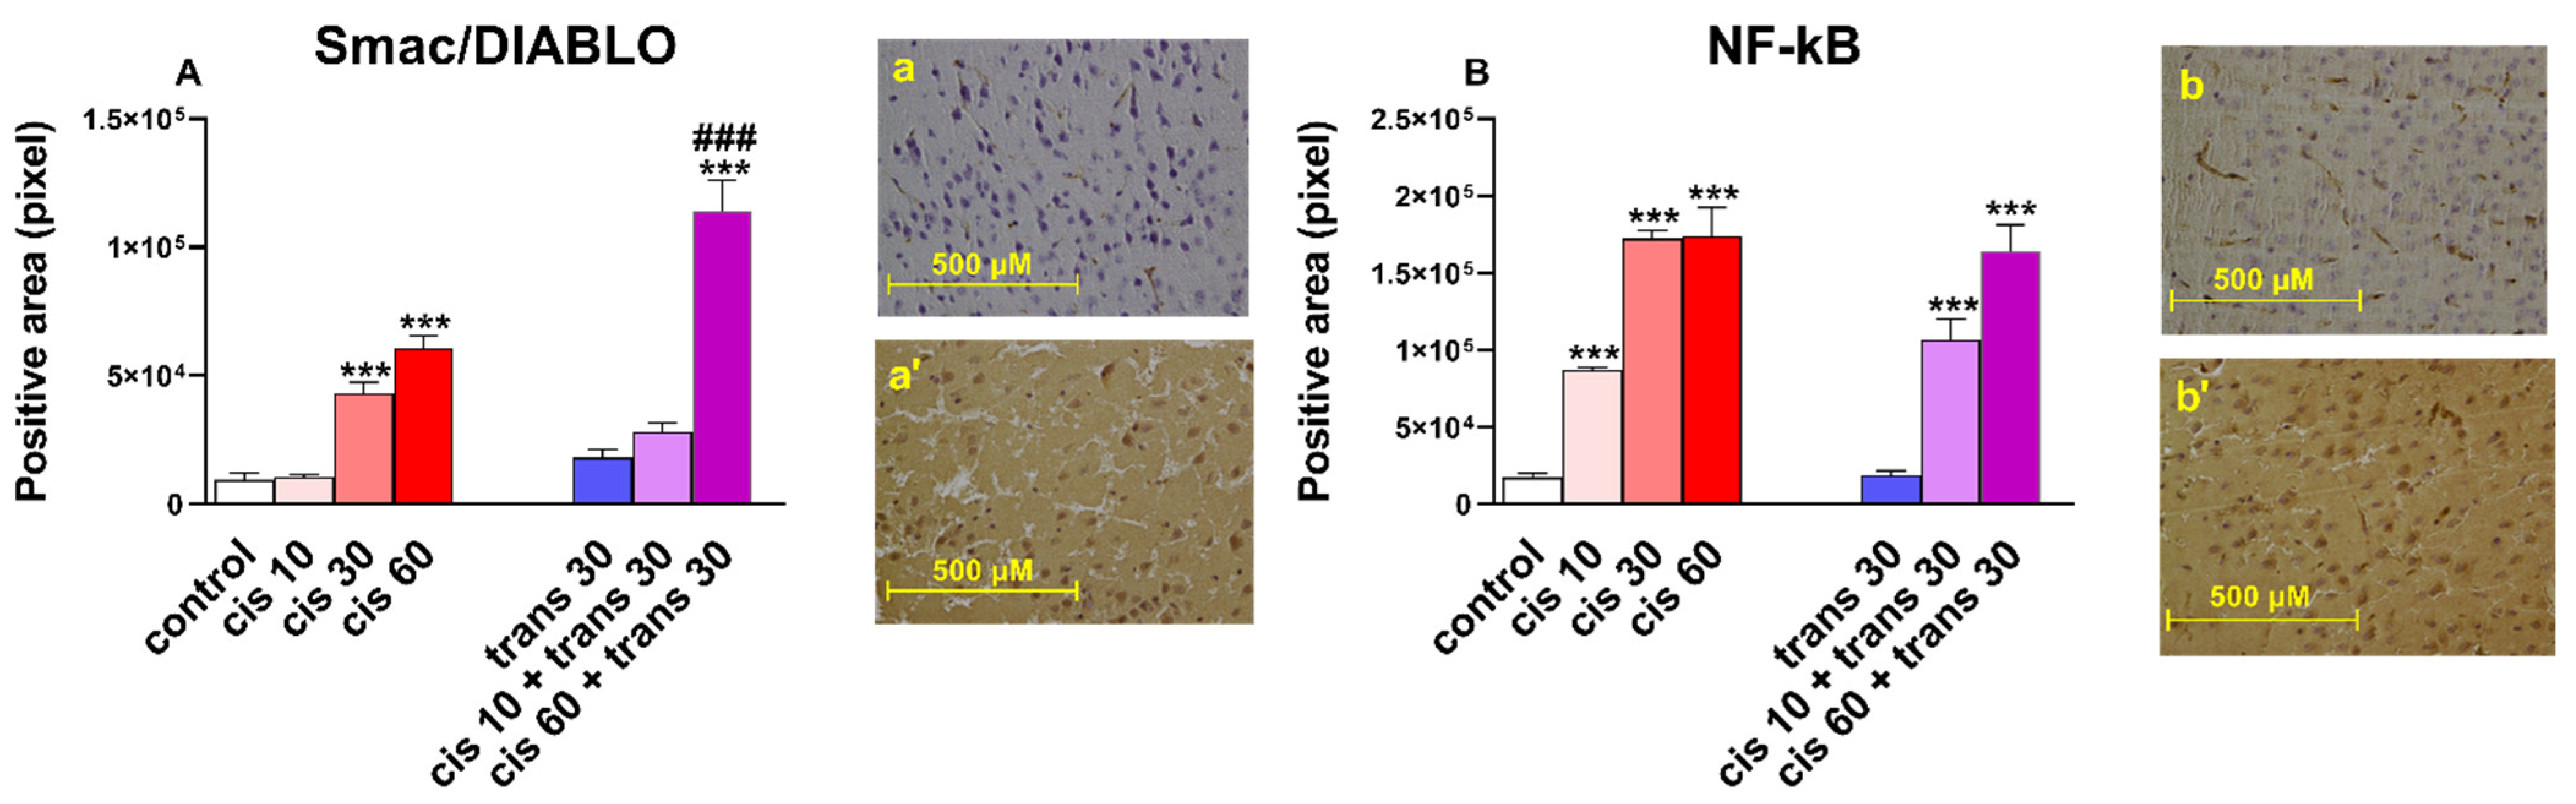
2.2.2. Immunohistochemical Results
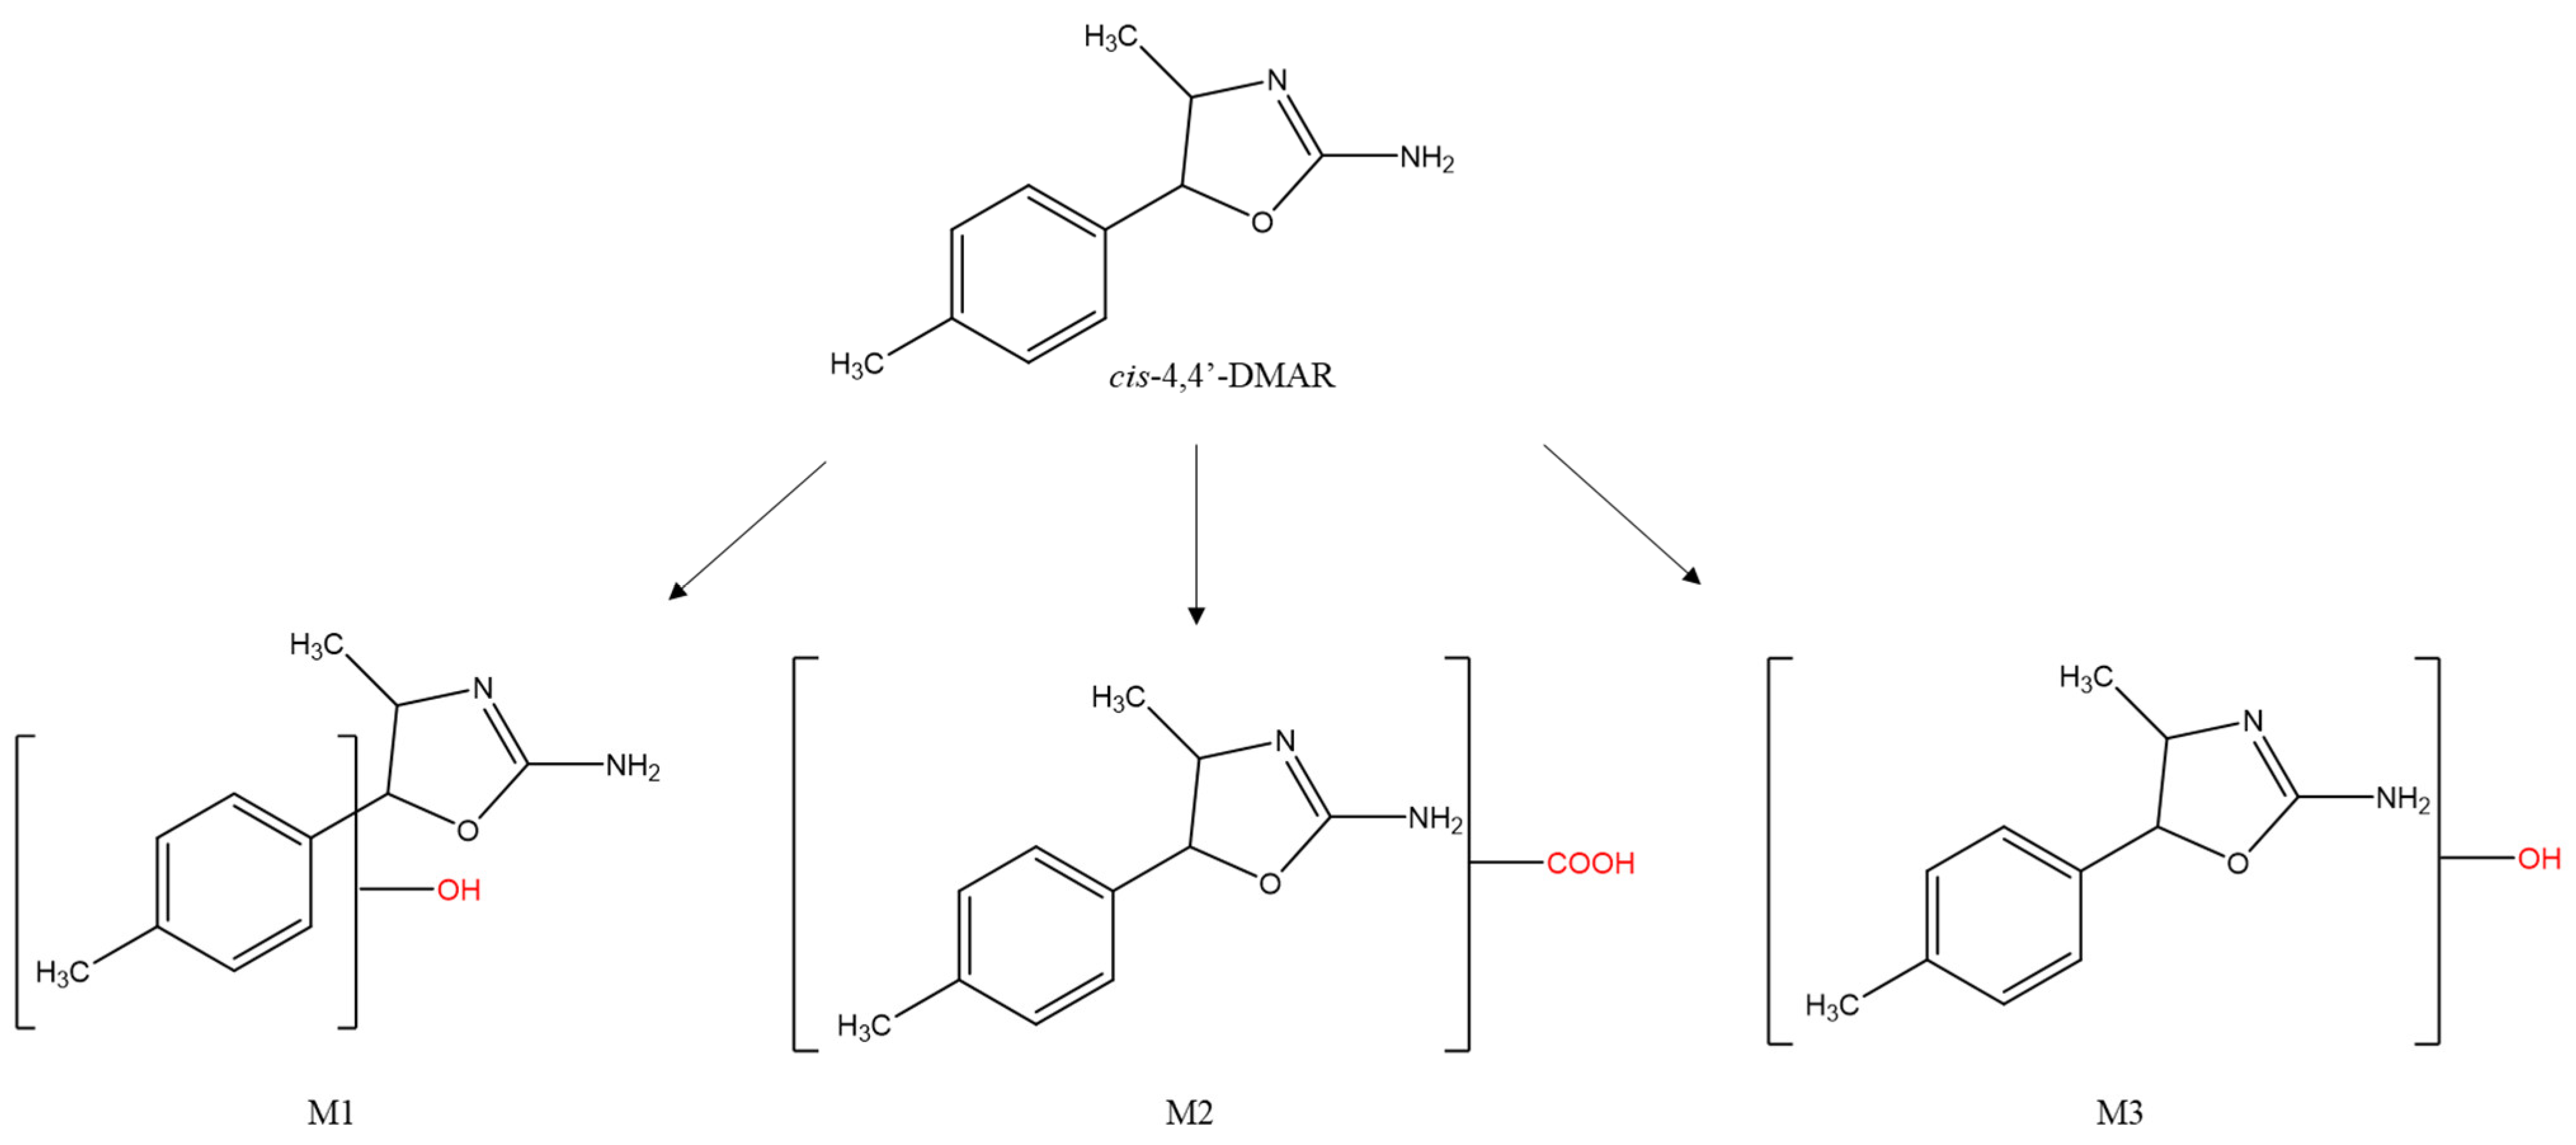
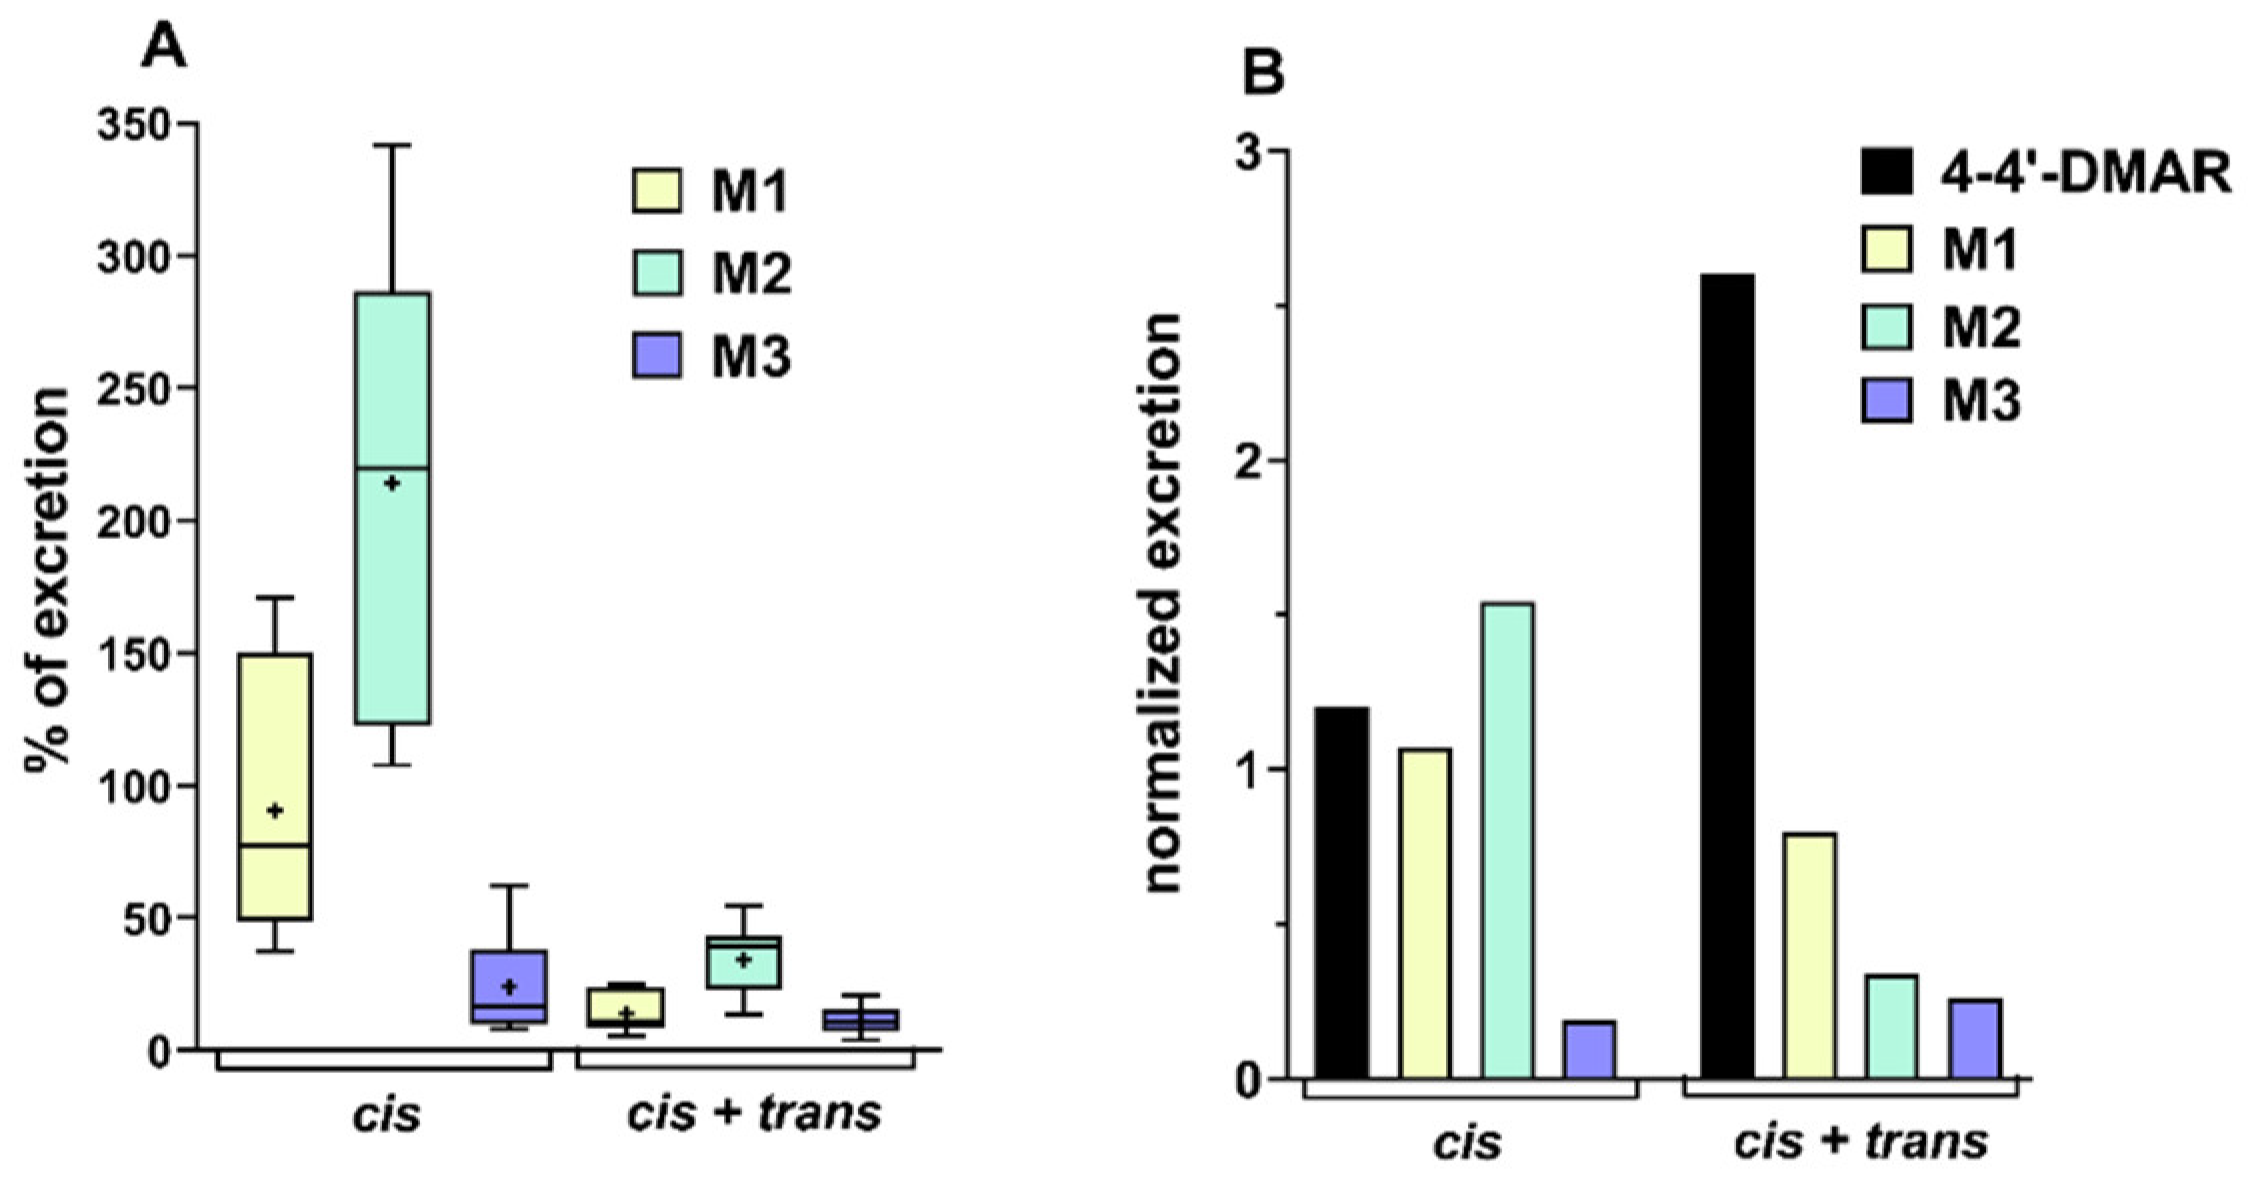
2.3. Excretion Studies on Urine Samples
2.4. Physiological and Neuro-Behavioural Responses with (±)Cis-4,4′-DMAR + (±)Trans-4,4′-DMAR Co-Administration
3. Discussion
3.1. Psychomotor Agitation
3.2. Aggression
3.3. Hyperthermia, Sweating, Salivation
3.4. Convulsions and Lethality
3.5. Immunoistochemical Studies
4. Materials and Methods
4.1. Animals
4.2. Drug Preparation and Dose selection
4.3. Behavioural Studies: Physiological and Neuro-Behavioural Responses
4.4. Collection of Tissue Samples
4.4.1. Histological Procedure
4.4.2. Immunohistochemical Procedure
4.5. Excretion Studies on Urine Samples
4.5.1. Chemicals and Reagents
4.5.2. Dose and Sample Collection
4.5.3. Excretion Studies
4.6. Data and Statistical Analysis
5. Conclusions
Author Contributions
Funding
Institutional Review Board Statement
Informed Consent Statement
Data Availability Statement
Conflicts of Interest
Ethical Statements
Abbreviations
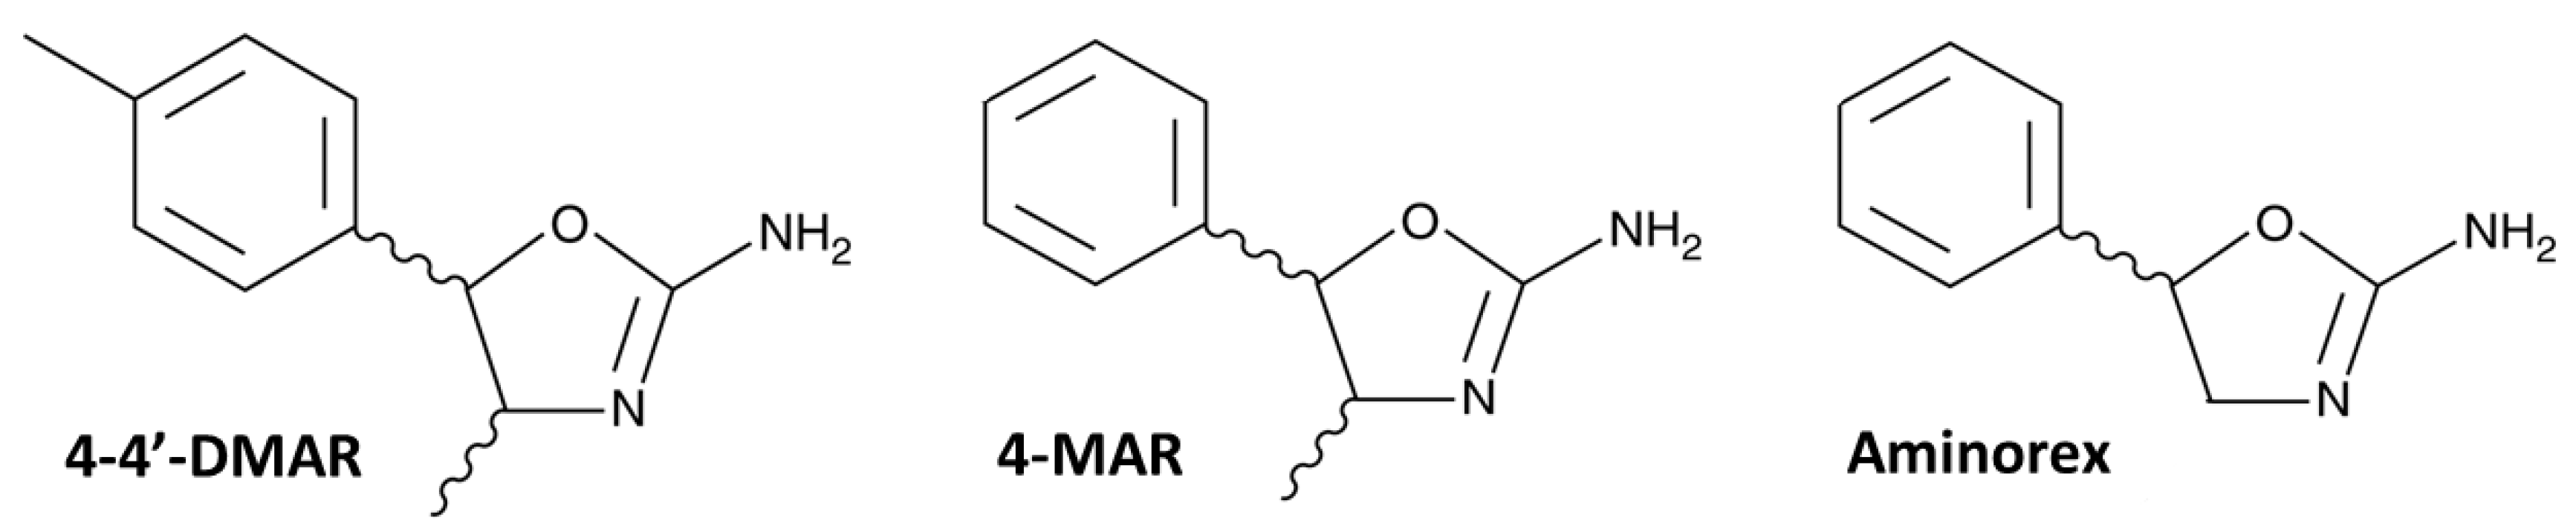
| 4:4′-DMAR | 4,4′-Dimethylaminorex; 4-Methyl-5-(4-methylphenyl)-4,5-dihydrooxazol-2-amine |
| 4-MAR | 4-Methylaminorex; 4-Methyl-5-phenyl-4,5-dihydrooxazol-2-amine |
| Aminorex | 5-phenyl-4,5-dihydro-1,3-oxazol-2-amine |
| Smac | Second mitochondria-derived activator of caspases |
| DIABLO | Direct IAP-binding protein with low PI |
| NF-kB | Nuclear factor-kappa B |
| 8-OHdG | 8-Hydroxy-2′-deoxyguanosine |
| iNOS | Inducible nitric oxide synthase |
| NOX-2 | NADPH oxidases-2 |
| NT | 3-nitrotyrosine |
| HSP27 | Heat shock protein 27 |
| HSP70 | Heat shock protein 70 |
| HSP90 | Heat shock protein 90 |
References
- European Monitoring Centre for Drugs and Drug Addiction (EMCDDA). European Drug Report 2020: Trends and Developments; Publications Office of the European Union: Lisbon, Portugal, 2020. [Google Scholar]
- Cosbey, S.; Kirk, S.; McNaul, M.; Peters, L.; Prentice, B.; Quinn, A.; Elliott, S.; Brandt, S.; Archer, R. Multiple Fatalities Involving a New Designer Drug: Para-Methyl-4-Methylaminorex. J. Anal. Toxicol. 2014, 38, 383–384. [Google Scholar] [CrossRef][Green Version]
- Brandt, S.D.; Baumann, M.; Partilla, J.S.; Kavanagh, P.V.; Power, J.D.; Talbot, B.; Twamley, B.; Mahony, O.; O’Brien, J.; Elliott, S.P.; et al. Characterization of a novel and potentially lethal designer drug(±)-cis-para-methyl-4-methylaminorex (4,4′-DMAR, or ‘Serotoni’). Drug Test. Anal. 2014, 6, 684–695. [Google Scholar] [CrossRef]
- European Monitoring Centre for Drugs and Drug Addiction (EMCDDA). Risk Assessment Report of a New Psychoactive Substance: 4-Methyl-5-(4-methylphenyl)-4,5-dihydrooxazol-2-amine; Publications Office of the European Union: Luxembourg, 2015. [Google Scholar]
- Loi, B.; Zloh, M.; De Luca, M.A.; Pintori, N.; Corkery, J.M.; Schifano, F. 4,4′-Dimethylaminorex (“4,4′-DMAR”; “Serotoni”) misuse: A Web-based study. Hum. Psychopharmacol. Clin. Exp. 2017, 32, e2575. [Google Scholar] [CrossRef] [PubMed]
- Maier, J.; Mayer, F.P.; Brandt, S.D.; Sitte, H.H. DARK Classics in Chemical Neuroscience: Aminorex Analogues. ACS Chem. Neurosci. 2018, 9, 2484–2502. [Google Scholar] [CrossRef] [PubMed]
- Poos, G.I.; Carson, J.R.; Rosenau, J.D.; Roszkowski, A.P.; Kelley, N.M.; McGowin, J. 2-amino-5-Aryl-2-oxazolines. Potent New Anorectic Agents. J. Med. Chem. 1963, 6, 266–272. [Google Scholar] [CrossRef] [PubMed]
- Rickli, A.; Kolaczynska, K.; Hoener, M.C.; Liechti, M.E. Pharmacological characterization of the aminorex analogs 4-MAR, 4,4′-DMAR, and 3,4-DMAR. NeuroToxicology 2019, 72, 95–100. [Google Scholar] [CrossRef]
- European Monitoring Centre for Drugs and Drug Addiction (EMCDDA). EMCDDA–Europol Joint Report on a New Psychoactivesubstance: 4,4′-DMAR (4-Methyl-5-(4-methylphenyl)-4,5-dihydrooxazol-2-amine); EMCDDA—Europol Joint Publications: Lisbon, Portugal, 2014. [Google Scholar]
- Glanville, J.; Dargan, P.; Wood, D.M. 4-Methyl-5-(4-methylphenyl)-4,5-dihydrooxazol-2-amine (4,4′-DMAR, 4,4′-dimethylaminorex): Availability, prevalence of use, desired effects and acute toxicity. Hum. Psychopharmacol. Clin. Exp. 2015, 30, 193–198. [Google Scholar] [CrossRef]
- Nizar, H.; Dargan, P.; Wood, D.M. Using Internet Snapshot Surveys to Enhance Our Understanding of the Availability of the Novel Psychoactive Substance 4-Methylaminorex and 4,4′-Dimethylaminorex. J. Med Toxicol. 2014, 11, 80–84. [Google Scholar] [CrossRef]
- Drug Enforcement Administration (DEA). Schedules of Controlled Statement: Placement of 4,4’-DMAR in Schedule I; DEA: Springfield, VA, USA, 2020.
- Bluelight 4,4-Dimethylaminorex (4,5-Dihydro-4-methyl-5-(4-methylphenyl)-2-Oxazolamine). Available online: https://www.bluelight.org/xf/threads/4-4-dimethylaminorex-4-5-dihydro-4-methyl-5-4-methylphenyl-2-oxazolamine.676724/ (accessed on 21 May 2021).
- McLaughlin, G.; Morris, N.; Kavanagh, P.V.; Power, J.D.; Twamley, B.; O’Brien, J.; Talbot, B.; Dowling, G.; Mahony, O.; Brandt, S.; et al. Synthesis, characterization, and monoamine transporter activity of the new psychoactive substance 3′,4′-methylenedioxy-4-methylaminorex (MDMAR). Drug Test. Anal. 2014, 7, 555–564. [Google Scholar] [CrossRef] [PubMed]
- Maier, J.; Mayer, F.; Luethi, D.; Holy, M.; Jäntsch, K.; Reither, H.; Hirtler, L.; Hoener, M.C.; Liechti, M.E.; Pifl, C.; et al. The psychostimulant (±)-cis-4,4′-dimethylaminorex (4,4′-DMAR) interacts with human plasmalemmal and vesicular monoamine transporters. Neuropharmacology 2018, 138, 282–291. [Google Scholar] [CrossRef]
- Greenier, E.; Lukyanova, V.; Reede, L. Serotonin syndrome: Fentanyl and selective serotonin reuptake inhibitor interactions. AANA J. 2014, 82, 340. [Google Scholar]
- Rothman, R.B.; Baumann, M. Serotonergic drugs and valvular heart disease. Expert Opin. Drug Saf. 2009, 8, 317–329. [Google Scholar] [CrossRef]
- European Monitoring Centre for Drugs and Drug Addiction (EMCDDA). European Drug Report 2016: Trends and Developments; Publications Office of the European Union: Lisbon, Portugal, 2016. [Google Scholar]
- Patrick, K.S.; Caldwell, R.W.; Ferris, R.M.; Breese, G.R. Pharmacology of the enantiomers of threo-methylphenidate. J. Pharmacol. Exp. Ther. 1987, 241, 152–158. [Google Scholar]
- Kolanos, R.; Partilla, J.S.; Baumann, M.; Hutsell, B.A.; Banks, M.L.; Negus, S.S.; Glennon, R.A. Stereoselective Actions of Methylenedioxypyrovalerone (MDPV) To Inhibit Dopamine and Norepinephrine Transporters and Facilitate Intracranial Self-Stimulation in Rats. ACS Chem. Neurosci. 2015, 6, 771–777. [Google Scholar] [CrossRef]
- Gannon, B.M.; Williamson, A.; Suzuki, M.; Rice, K.C.; Fantegrossi, W.E. Stereoselective Effects of Abused “Bath Salt” Constituent 3,4-Methylenedioxypyrovalerone in Mice: Drug Discrimination, Locomotor Activity, and Thermoregulation. J. Pharmacol. Exp. Ther. 2016, 356, 615–623. [Google Scholar] [CrossRef]
- Pitts, E.; Curry, D.W.; Hampshire, K.N.; Young, M.B.; Howell, L.L. (±)-MDMA and its enantiomers: Potential therapeutic advantages of R(−)-MDMA. Psychopharmacology 2018, 235, 377–392. [Google Scholar] [CrossRef]
- Schiavone, S.; Neri, M.; Maffione, A.B.; Frisoni, P.; Morgese, M.G.; Trabace, L.; Turillazzi, E. Increased iNOS and Nitrosative Stress in Dopaminergic Neurons of MDMA-Exposed Rats. Int. J. Mol. Sci. 2019, 20, 1242. [Google Scholar] [CrossRef] [PubMed]
- Tang, S.; Buriro, R.; Liu, Z.; Zhang, M.; Ali, I.; Adam, A.; Hartung, J.; Bao, E. Localization and Expression of Hsp27 and αB-Crystallin in Rat Primary Myocardial Cells during Heat Stress In Vitro. PLoS ONE 2013, 8, e69066. [Google Scholar] [CrossRef]
- Doberentz, E.; Genneper, L.; Böker, D.; Lignitz, E.; Madea, B. Expression of heat shock proteins (hsp) 27 and 70 in various organ systems in cases of death due to fire. Int. J. Leg. Med. 2014, 128, 967–978. [Google Scholar] [CrossRef] [PubMed]
- Luo, M.; Meng, Z.; Moroishi, T.; Lin, K.C.; Shen, G.; Mo, F.; Shao, B.; Wei, X.; Zhang, P.; Wei, Y.; et al. Heat stress activates YAP/TAZ to induce the heat shock transcriptome. Nat. Cell Biol. 2020, 22, 1447–1459. [Google Scholar] [CrossRef] [PubMed]
- Lucchetti, J.; Marzo, C.M.; Passoni, A.; Di Clemente, A.; Moro, F.; Bagnati, R.; Gobbi, M.; Cervo, L. Brain Disposition of cis-para-Methyl-4-Methylaminorex (cis-4,4′-DMAR) and Its Potential Metabolites after Acute and Chronic Treatment in Rats: Correlation with Central Behavioral Effects. J. Pharmacol. Exp. Ther. 2017, 361, 492–500. [Google Scholar] [CrossRef] [PubMed]
- Batsche, K.; Ashby, C.R., Jr.; Lee, C.; Schwartz, J.; Wang, R.Y. The behavioral effects of the stereoisomers of 4-methylaminorex, a psychostimulant, in the rat. J. Pharmacol. Exp. Ther. 1994, 269, 1029–1039. [Google Scholar] [PubMed]
- Baumann, M.H.; Partilla, J.S.; Lehner, K.R.; Thorndike, E.B.; Hoffman, A.; Holy, M.; Rothman, R.B.; Goldberg, S.R.; Lupica, C.; Sitte, H.; et al. Powerful Cocaine-Like Actions of 3,4-Methylenedioxypyrovalerone (MDPV), a Principal Constituent of Psychoactive ‘Bath Salts’ Products. Neuropsychopharmacology 2013, 38, 552–562. [Google Scholar] [CrossRef]
- Glennon, R.A.; Young, R. Neurobiology of 3,4-methylenedioxypyrovalerone (MDPV) and α-pyrrolidinovalerophenone (α-PVP). Brain Res. Bull. 2016, 126 Pt 1, 111–126. [Google Scholar] [CrossRef]
- Wise, R.A.; Bozarth, M.A. A psychomotor stimulant theory of addiction. Psychol. Rev. 1987, 94, 469–492. [Google Scholar] [CrossRef]
- Le Moal, M.; Simonnet, G. Neurobiologie de la dépendance [Neurobiology of dependence]. Rev. Prat. 1995, 45, 1351–1358. [Google Scholar] [PubMed]
- Ossato, A.; Uccelli, L.; Bilel, S.; Canazza, I.; Di Domenico, G.; Pasquali, M.; Pupillo, G.; De Luca, M.A.; Boschi, A.; Vincenzi, F.; et al. Psychostimulant Effect of the Synthetic Cannabinoid JWH-018 and AKB48: Behavioral, Neurochemical, and Dopamine Transporter Scan Imaging Studies in Mice. Front. Psychiatry 2017, 8, 130. [Google Scholar] [CrossRef] [PubMed]
- Badiani, A.; Oates, M.M.; Day, H.E.W.; Watson, S.J.; Akil, H.; Robinson, T.E. Amphetamine-Induced Behavior, Dopamine Release, and c-fosmRNA Expression: Modulation by Environmental Novelty. J. Neurosci. 1998, 18, 10579–10593. [Google Scholar] [CrossRef]
- Marusich, J.A.; Grant, K.R.; Blough, B.E.; Wiley, J. Effects of synthetic cathinones contained in “bath salts” on motor behavior and a functional observational battery in mice. NeuroToxicology 2012, 33, 1305–1313. [Google Scholar] [CrossRef]
- Marusich, J.A.; Antonazzo, K.R.; Wiley, J.; Blough, B.E.; Partilla, J.S.; Baumann, M. Pharmacology of novel synthetic stimulants structurally related to the “bath salts” constituent 3,4-methylenedioxypyrovalerone (MDPV). Neuropharmacology 2014, 87, 206–213. [Google Scholar] [CrossRef]
- Saha, K.; Partilla, J.S.; Lehner, K.R.; Seddik, A.; Stockner, T.; Holy, M.; Sandtner, W.; Ecker, G.F.; Sitte, H.H.; Baumann, M.H. ‘Second-Generation’ Mephedrone Analogs, 4-MEC and 4-MePPP, Differentially Affect Monoamine Transporter Function. Neuropsychopharmacology 2015, 40, 1321–1331. [Google Scholar] [CrossRef]
- Giannotti, G.; Canazza, I.; Caffino, L.; Bilel, S.; Ossato, A.; Fumagalli, F.; Marti, M. The cathinones MDPVand alpha-PVP elicit different behavioral and molecular effects following acute exposure. Neurotox. Res. 2017, 32, 594–602. [Google Scholar] [CrossRef]
- Pail, P.B.; Costa, K.M.; Leite, C.E.; Campos, M.M. Comparative pharmacological evaluation of the cathinone derivatives, mephedrone and methedrone, in mice. NeuroToxicology 2015, 50, 71–80. [Google Scholar] [CrossRef]
- Marti, M.; Neri, M.; Bilel, S.; Di Paolo, M.; LA Russa, R.; Ossato, A.; Turillazzi, E. MDMA alone affects sensorimotor and prepulse inhibition responses in mice and rats: Tips in the debate on potential MDMA unsafety in human activity. Forensic Toxicol. 2019, 37, 132–144. [Google Scholar] [CrossRef]
- De-Giorgio, F.; Bilel, S.; Tirri, M.; Arfè, R.; Trapella, C.; Camuto, C.; Foti, F.; Frisoni, P.; Neri, M.; Botrè, F.; et al. Methiopropamine and its acute behavioral effects in mice: Is there a gray zone in new psychoactive substances users? Int. J. Leg. Med. 2020, 134, 1695–1711. [Google Scholar] [CrossRef]
- De-Giorgio, F.; Bilel, S.; Ossato, A.; Tirri, M.; Arfè, R.; Foti, F.; Serpelloni, G.; Frisoni, P.; Neri, M.; Marti, M. Acute and repeated administration of MDPV increases aggressive behavior in mice: Forensic implications. Int. J. Leg. Med. 2019, 133, 1797–1808. [Google Scholar] [CrossRef]
- De-Giorgio, F.; Bilel, S.; Ossato, A.; Tirri, M.; Arfè, R.; Foti, F.; Serpelloni, G.; Frisoni, P.; Neri, M.; Marti, M. Reply to “MDPV-induced aggression in humans not established”. Int. J. Leg. Med. 2020, 134, 263–265. [Google Scholar] [CrossRef] [PubMed]
- Foti, F.; Bilel, S.; Tirri, M.; Arfè, R.; Boccuto, F.; Bernardi, T.; Serpelloni, G.; De-Giorgio, F.; Marti, M. Low-normal doses of methiopropamine induce aggressive behaviour in mice. Psychopharmacology 2021, 238, 1847–1856. [Google Scholar] [CrossRef] [PubMed]
- Penders, T.M.; Gestring, R.E.; Vilensky, D.A. Intoxication Delirium following Use of Synthetic Cathinone Derivatives. Am. J. Drug Alcohol Abus. 2012, 38, 616–617. [Google Scholar] [CrossRef]
- Kasick, D.P.; McKnight, C.A.; Klisovic, E. “Bath Salt” Ingestion Leading to Severe Intoxication Delirium: Two Cases and a Brief Review of the Emergence of Mephedrone Use. Am. J. Drug Alcohol Abus. 2012, 38, 176–180. [Google Scholar] [CrossRef]
- Reay, D.T.; Eisele, J.W. Death from law enforcement neck holds. Am. J. Forensic Med. Pathol. 1982, 3, 253–258. [Google Scholar] [CrossRef] [PubMed]
- Kunz, S.; Þórðardóttir, S.; Rúnarsdóttir, R. Restraint-related asphyxia on the basis of a drug-induced excited delirium. Forensic Sci. Int. 2018, 288, e5–e9. [Google Scholar] [CrossRef] [PubMed]
- Pollanen, M.S.; Chiasson, D.A.; Cairns, J.T.; Young, J.G. Unexpected death related to restraint for excited delirium: A retro-spective study of deaths in police custody and in the community. CMAJ 1998, 158, 1603–1607. [Google Scholar]
- Kiyatkin, E.A. Brain hyperthermia as physiological and pathological phenomena. Brain Res. Rev. 2005, 50, 27–56. [Google Scholar] [CrossRef] [PubMed]
- Kiyatkin, E.A. Brain temperature and its role in physiology and pathophysiology: Lessons from 20 years of thermorecording. Temperature 2019, 6, 271–333. [Google Scholar] [CrossRef]
- Miliano, C.; Marti, M.; Pintori, N.; Castelli, M.P.; Tirri, M.; Arfè, R.; De Luca, M.A. Neurochemical and Behavioral Profiling in Male and Female Rats of the Psychedelic Agent 25I-NBOMe. Front. Pharmacol. 2019, 10, 1406. [Google Scholar] [CrossRef] [PubMed]
- Albers, D.S.; Sonsalla, P.K. Methamphetamine-induced hyperthermia and dopaminergic neurotoxicity in mice: Pharmaco-logical profile of protective and nonprotective agents. J. Pharmacol. Exp. Ther. 1995, 275, 1104–1114. [Google Scholar]
- Mechan, A.O.; Esteban, B.; O’Shea, E.; Elliott, J.M.; Colado, M.I.; Green, A.R. The pharmacology of the acute hyperthermic response that follows administration of 3,4-methylenedioxymethamphetamine (MDMA, ‘ecstasy’) to rats. Br. J. Pharmacol. 2002, 135, 170–180. [Google Scholar] [CrossRef]
- Fantegrossi, W.E.; Gannon, B.M.; Zimmerman, S.M.; Rice, K.C. In vivo Effects of Abused ‘Bath Salt’ Constituent 3,4-methylenedioxypyrovalerone (MDPV) in Mice: Drug Discrimination, Thermoregulation, and Locomotor Activity. Neuropsychopharmacology 2012, 38, 563–573. [Google Scholar] [CrossRef]
- Kiyatkin, E.A.; Kim, A.H.; Wakabayashi, K.T.; Baumann, M.; Shaham, Y. Effects of Social Interaction and Warm Ambient Temperature on Brain Hyperthermia Induced by the Designer Drugs Methylone and MDPV. Neuropsychopharmacology 2014, 40, 436–445. [Google Scholar] [CrossRef] [PubMed]
- Wakabayashi, K.T.; Ren, S.E.; Kiyatkin, E.A. Methylenedioxypyrovalerone (MDPV) mimics cocaine in its physiological and behavioral effects but induces distinct changes in NAc glucose. Front. Neurosci. 2015, 9, 324. [Google Scholar] [CrossRef] [PubMed]
- Beck, O.; Franzén, L.; Bäckberg, M.; Signell, P.; Helander, A. Toxicity evaluation of α-pyrrolidinovalerophenone (α-PVP): Results from intoxication cases within the STRIDA project. Clin. Toxicol. 2016, 54, 568–575. [Google Scholar] [CrossRef]
- Páleníček, T.; Balíková, M.; Rohanová, M.; Novák, T.; Horacek, J.; Fujáková, M.; Höschl, C. Behavioral, hyperthermic and pharmacokinetic profile of para-methoxymethamphetamine (PMMA) in rats. Pharmacol. Biochem. Behav. 2011, 98, 130–139. [Google Scholar] [CrossRef]
- Páleníček, T.; Lhotková, E.; Židková, M.; Balíková, M.; Kuchař, M.; Himl, M.; Mikšátková, P.; Čegan, M.; Valeš, K.; Tylš, F.; et al. Emerging toxicity of 5,6-methylenedioxy-2-aminoindane (MDAI): Pharmacokinetics, behaviour, thermoregulation and LD50 in rats. Prog. Neuro-Psychopharmacol. Biol. Psychiatry 2016, 69, 49–59. [Google Scholar] [CrossRef]
- Boyer, E.W.; Shannon, M. The Serotonin Syndrome. N. Engl. J. Med. 2005, 352, 1112–1120. [Google Scholar] [CrossRef] [PubMed]
- Pedersen, N.P.; Blessing, W.W. Cutaneous Vasoconstriction Contributes to Hyperthermia Induced by 3,4-Methylenedioxymethamphetamine (Ecstasy) in Conscious Rabbits. J. Neurosci. 2001, 21, 8648–8654. [Google Scholar] [CrossRef] [PubMed]
- Kiyatkin, E.A.; Kim, A.H.; Wakabayashi, K.; Baumann, M.; Shaham, Y. Critical Role of Peripheral Vasoconstriction in Fatal Brain Hyperthermia Induced by MDMA (Ecstasy) under Conditions That Mimic Human Drug Use. J. Neurosci. 2014, 34, 7754–7762. [Google Scholar] [CrossRef] [PubMed]
- Nakamura, M.; Shintani-Ishida, K.; Ikegaya, H. 5-HT2A Receptor Agonist-Induced Hyperthermia Is Induced via Vasoconstriction by Peripheral 5-HT2A Receptors and Brown Adipose Tissue Thermogenesis by Peripheral Serotonin Loss at a High Ambient Temperature. J. Pharmacol. Exp. Ther. 2018, 367, 356–362. [Google Scholar] [CrossRef]
- Mills, E.M.; Banks, M.L.; Sprague, J.E.; Finkel, T. Uncoupling the agony from ecstasy. Nature 2003, 426, 403–404. [Google Scholar] [CrossRef]
- Mills, E.M.; Rusyniak, D.E.; Sprague, J.E. The role of the sympathetic nervous system and uncoupling proteins in the thermogenesis induced by 3,4-methylenedioxymethamphetamine. J. Mol. Med. 2004, 82, 787–799. [Google Scholar] [CrossRef]
- Liechti, M.E. Effects of MDMA on body temperature in humans. Temperature 2014, 1, 192–200. [Google Scholar] [CrossRef]
- Callaway, C.; Clark, R.F. Hyperthermia in Psychostimulant Overdose. Ann. Emerg. Med. 1994, 24, 68–76. [Google Scholar] [CrossRef]
- Halpern, J.H.; Sherwood, A.R.; Hudson, J.I.; Gruber, S.; Kozin, D.; Pope, H.G., Jr. Residual neurocognitive features of long-term ecstasy users with minimal exposure to other drugs. Addiction 2010, 106, 777–786. [Google Scholar] [CrossRef]
- Bowyer, J.F.; Hanig, J.P. Amphetamine- and methamphetamine-induced hyperthermia: Implications of the effects produced in brain vasculature and peripheral organs to forebrain neurotoxicity. Temperature 2014, 1, 172–182. [Google Scholar] [CrossRef]
- Sjoquist, P.-O.; Ali, S.F. Drugs of Abuse-Induced Hyperthermia, Blood-Brain Barrier Dysfunction and Neurotoxicity: Neuroprotective Effects of a New Antioxidant Compound H-290/51. Curr. Pharm. Des. 2007, 13, 1903–1923. [Google Scholar] [CrossRef]
- Zhou, X.; Bouitbir, J.; Liechti, M.E.; Krähenbühl, S.; Mancuso, R.V. Hyperthermia Increases Neurotoxicity Associated with Novel Methcathinones. Cells 2020, 9, 965. [Google Scholar] [CrossRef] [PubMed]
- Hwang, E.C.; Van Woert, M.H. Behavioral and biochemical effects of para-methoxyphenylethylamine. Res. Commun. Chem. Pathol. Pharmacol. 1979, 23, 419–431. [Google Scholar] [PubMed]
- Brust, J.C.M. Seizures, illicit drugs, and ethanol. Curr. Neurol. Neurosci. Rep. 2008, 8, 333–338. [Google Scholar] [CrossRef]
- Lappin, J.M.; Sara, G.E. Psychostimulant use and the brain. Addiction 2019, 114, 2065–2077. [Google Scholar] [CrossRef]
- Miller, K.A.; Witkin, J.M.; Ungard, J.T.; Gasior, M. Pharmacological and behavioral characterization of cocaine-kindled seizures in mice. Psychopharmacology 2000, 148, 74–82. [Google Scholar] [CrossRef]
- Matsumoto, R.R.; Gilmore, D.L.; Pouw, B.; Bowen, W.D.; Williams, W.; Kausar, A.; Coop, A. Novel analogs of the σ receptor ligand BD1008 attenuate cocaine-induced toxicity in mice. Eur. J. Pharmacol. 2004, 492, 21–26. [Google Scholar] [CrossRef] [PubMed]
- Chen, Y.-H.; Ivanic, B.; Chuang, C.-M.; Lu, D.-Y.; Lin, J.-G. Electroacupuncture Reduces Cocaine-Induced Seizures and Mortality in Mice. Evid. Based Complement. Altern. Med. 2013, 2013, 1–13. [Google Scholar] [CrossRef]
- Gasior, M.; Carter, R.B.; Goldberg, S.R.; Witkin, J.M. Anticonvulsant and behavioral effects of neuroactive steroids alone and in conjunction with diazepam. J. Pharmacol. Exp. Ther. 1997, 282, 543–553. [Google Scholar]
- Brackett, R.L.; Pouw, B.; Blyden, J.F.; Nour, M.; Matsumoto, R.R. Prevention of cocaine-induced convulsions and lethality in mice: Effectiveness of targeting different sites on the NMDA receptor complex. Neuropharmacology 2000, 39, 407–418. [Google Scholar] [CrossRef]
- Giorgi, F.S.; Pizzanelli, C.; Ferrucci, M.; Lazzeri, G.; Faetti, M.; Giusiani, M.; Pontarelli, F.; Busceti, C.; Murri, L.; Fornai, F. Previous exposure to (+/−±) 3,4-methylenedioxymethamphetamine produces long-lasting alteration in limbic brain excitability measured by electroencephalogram spectrum analysis, brain metabolism and seizure susceptibility. Neuroscience 2005, 136, 43–53. [Google Scholar] [CrossRef]
- Hanson, G.R.; Jensen, M.; Johnson, M.; White, H.S. Distinct features of seizures induced by cocaine and amphetamine analogs. Eur. J. Pharmacol. 1999, 377, 167–173. [Google Scholar] [CrossRef]
- Simmler, L.; Buser, T.A.; Donzelli, M.; Schramm, Y.; Dieu, L.H.; Huwyler, J.; Chaboz, S.; Hoener, M.; Liechti, M.E. Pharmacological characterization of designer cathinonesin vitro. Br. J. Pharmacol. 2013, 168, 458–470. [Google Scholar] [CrossRef]
- Chieffi, C.; Camuto, C.; De-Giorgio, F.; de la Torre, X.; Diamanti, F.; Mazzarino, M.; Trapella, C.; Marti, M.; Botrè, F. Metabolic profile of the synthetic drug 4,4′-dimethylaminorex in urine by LC–MS-based techniques: Selection of the most suitable markers of its intake. Forensic Toxicol. 2020, 39, 89–100. [Google Scholar] [CrossRef]
- Testa, B. Types of stereoselectivity in drug metabolism: A heuristic approach. Drug Metab. Rev. 2015, 47, 239–251. [Google Scholar] [CrossRef]
- Lu, H. Stereoselectivity in drug metabolism. Expert Opin. Drug Metab. Toxicol. 2007, 3, 149–158. [Google Scholar] [CrossRef]
- Chester, N.; Mottram, D.R.; Reilly, T.; Powell, M. Elimination of ephedrines in urine following multiple dosing: The consequences for athletes, in relation to doping control. Br. J. Clin. Pharmacol. 2004, 57, 62–67. [Google Scholar] [CrossRef]
- Xu, J.; Yan, R. Determination of the Metabolite of Ephedrine, 4-Hydroxyephedrine, by LC–MS-MS in Rat Urine and Its Application in Excretion Profiles After Oral Administration of Ephedra sinica Stapfand Processing Ephedra sinica Stapf. J. Chromatogr. Sci. 2016, 55, 162–165. [Google Scholar] [CrossRef]
- Brocks, D.R. Drug disposition in three dimensions: An update on stereoselectivity in pharmacokinetics. Biopharm. Drug Dispos. 2006, 27, 387–406. [Google Scholar] [CrossRef]
- Kroemer, H.K.; Fromm, M.F.; Bühl, K.; Terefe, H.; Blaschke, G.; Eichelbaum, M. An enantiomer-enantiomer interaction of (S)- and (R)-propafenone modifies the effect of racemic drug therapy. Circulation 1994, 89, 2396–2400. [Google Scholar] [CrossRef] [PubMed][Green Version]
- Lu, H.; Wang, J.J.; Chan, K.K. Enantiomer–enantiomer interaction of ifosfamide in the rat. Xenobiotica 2006, 36, 535–549. [Google Scholar] [CrossRef] [PubMed]
- Ossato, A.; Canazza, I.; Trapella, C.; Vincenzi, F.; De Luca, M.A.; Rimondo, C.; Varani, K.; Borea, P.A.; Serpelloni, G.; Marti, M. Effect of JWH-250, JWH-073 and their interaction on “tetrad”, sensorimotor, neurological and neurochemical responses in mice. Prog. Neuro-Psychopharmacol. Biol. Psychiatry 2016, 67, 31–50. [Google Scholar] [CrossRef] [PubMed]
- Poon, H.F.; Abdullah, L.; Mullan, M.A.; Mullan, M.J.; Crawford, F.C. Cocaine-induced oxidative stress precedes cell death in human neuronal progenitor cells. Neurochem. Int. 2007, 50, 69–73. [Google Scholar] [CrossRef]
- Valavanidis, A.; Vlachogianni, T.; Fiotakis, C. 8-hydroxy-2′ -deoxyguanosine (8-OHdG): A Critical Biomarker of Oxidative Stress and Carcinogenesis. J. Environ. Sci. Health Part C 2009, 27, 120–139. [Google Scholar] [CrossRef]
- Tejero, J.; Shiva, S.; Gladwin, M.T. Sources of Vascular Nitric Oxide and Reactive Oxygen Species and Their Regulation. Physiol. Rev. 2019, 99, 311–379. [Google Scholar] [CrossRef]
- Ischiropoulos, H. Biological Tyrosine Nitration: A Pathophysiological Function of Nitric Oxide and Reactive Oxygen Species. Arch. Biochem. Biophys. 1998, 356, 1–11. [Google Scholar] [CrossRef]
- Eppink, B.; Krawczyk, P.M.; Stap, J.; Kanaar, R. Hyperthermia-induced DNA repair deficiency suggests novel therapeutic anti-cancer strategies. Int. J. Hyperth. 2012, 28, 509–517. [Google Scholar] [CrossRef] [PubMed]
- Beere, H.M. ‘The stress of dying’: The role of heat shock proteins in the regulation of apoptosis. J. Cell Sci. 2004, 117(PT 13), 2641–2651. [Google Scholar] [CrossRef] [PubMed]
- Chauhan, D.; Li, G.; Hideshima, T.; Podar, K.; Mitsiades, C.; Mitsiades, N.; Munshi, N.; Kharbanda, S.; Anderson, K.C. JNK-dependent Release of Mitochondrial Protein, Smac, during Apoptosis in Multiple Myeloma (MM) Cells. J. Biol. Chem. 2003, 278, 17593–17596. [Google Scholar] [CrossRef] [PubMed]
- Chauhan, D.; Li, G.; Hideshima, T.; Podar, K.; Mitsiades, C.; Mitsiades, N.; Catley, L.; Tai, Y.T.; Hayashi, T.; Shringarpure, R.; et al. Hsp27 inhibits release of mitochondrial protein Smac in multiple myeloma cells and confers dexamethasone resistance. Blood 2003, 102, 3379–3386. [Google Scholar] [CrossRef]
- Morrish, E.; Brumatti, G.; Silke, J. Future Therapeutic Directions for Smac-Mimetics. Cells 2020, 9, 406. [Google Scholar] [CrossRef]
- Aravindan, N.; Mohan, S.; Herman, T.S.; Natarajan, M. Nitric oxide-mediated inhibition of NFκB regulates hyperthermia-induced apoptosis. J. Cell. Biochem. 2009, 106, 999–1009. [Google Scholar] [CrossRef]
- Kabe, Y.; Ando, K.; Hirao, S.; Yoshida, M.; Handa, H. Redox Regulation of NF-κB Activation: Distinct Redox Regulation between the Cytoplasm and the Nucleus. Antioxid. Redox Signal. 2005, 7, 395–403. [Google Scholar] [CrossRef]
- Morgan, M.J.; Liu, Z.-G. Crosstalk of reactive oxygen species and NF-κB signaling. Cell Res. 2010, 21, 103–115. [Google Scholar] [CrossRef]
- Reagan-Shaw, S.; Nihal, M.; Ahmad, N. Dose translation from animal to human studies revisited. FASEB J. 2008, 22, 659–661. [Google Scholar] [CrossRef]
- Vigolo, A.; Ossato, A.; Trapella, C.; Vincenzi, F.; Rimondo, C.; Seri, C.; Varani, K.; Serpelloni, G.; Marti, M. Novel halogenated derivates of JWH-018: Behavioral and binding studies in mice. Neuropharmacology 2015, 95, 68–82. [Google Scholar] [CrossRef]
- Ossato, A.; Bilel, S.; Gregori, A.; Talarico, A.; Trapella, C.; Gaudio, R.M.; De Giorgio, F.; Tagliaro, F.; Neri, M.; Fattore, L.; et al. Neurological, sensorimotor and cardiorespiratory alterations induced by methoxetamine, ketamine and phencyclidine in mice. Neuropharmacology 2018, 141, 167–180. [Google Scholar] [CrossRef] [PubMed]
- Tirri, M.; Ponzoni, L.; Bilel, S.; Arfè, R.; Braida, D.; Sala, M.; Marti, M. Acute DOB and PMA Administration Impairs Motor and Sensorimotor Responses in Mice and Causes Hallucinogenic Effects in Adult Zebrafish. Brain Sci. 2020, 10, 586. [Google Scholar] [CrossRef]
- Bilel, S.; Azevedo, N.; Arfè, R.; Tirri, M.; Gregori, A.; Serpelloni, G.; De-Giorgio, F.; Frisoni, P.; Neri, M.; Calò, G.; et al. In vitro and in vivo pharmacological characterization of the synthetic opioid MT-45. Neuropharmacology 2020, 171, 108110. [Google Scholar] [CrossRef] [PubMed]
- Matsumoto, R.R.; Brackett, R.L.; Kanthasamy, A. Novel NMDA/glycine site antagonists attenuate cocaine-induced behavioral toxicity. Eur. J. Pharmacol. 1997, 338, 233–242. [Google Scholar] [CrossRef]
- Witkin, J.M.; Tortella, F.C. Modulators of N-methyl-D-aspartate protect against diazepam- or phenobarbital-resistant cocaine convulsions. Life Sci. 1991, 48, PL51–PL56. [Google Scholar] [CrossRef]
- Camuto, C.; Pellegrini, S.; De-Giorgio, F.; de la Torre, X.; Marti, M.; Mazzarino, M.; Botrè, F. Urinary excretion profile of methiopropamine in mice following intraperitoneal administration: A liquid chromatography–tandem mass spectrometry investigation. Drug Test. Anal. 2020, 13, 91–100. [Google Scholar] [CrossRef] [PubMed]
- Corkery, J.M.; Orsolini, L.; Papanti, D.; Schifano, F. From concept(ion) to life after death/the grave: The ‘natural’ history and life cycle(s) of novel psychoactive substances (NPS). Hum. Psychopharmacol. Clin. Exp. 2017, 32, e2566. [Google Scholar] [CrossRef] [PubMed]
- Catalani, V.; Corkery, J.M.; Guirguis, A.; Napoletano, F.; Arillotta, D.; Zangani, C.; Vento, A.; Schifano, F. Psychonauts’ psychedelics: A systematic, multilingual, web-crawling exercise. Eur. Neuropsychopharmacol. 2021, 49, 69–92. [Google Scholar] [CrossRef]
- Schifano, F.; Napoletano, F.; Chiappini, S.; Guirguis, A.; Corkery, J.M.; Bonaccorso, S.; Ricciardi, A.; Scherbaum, N.; Vento, A. New/emerging psychoactive substances and associated psychopathological consequences. Psychol. Med. 2021, 51, 30–42. [Google Scholar] [CrossRef]


| COMPOUND | cis-4,4’-DMAR | ||||||||
|---|---|---|---|---|---|---|---|---|---|
| Doses (mg/kg) | vehicle | 0.1 | 1 | 3 | 10 | 30 | 60 | ||
| Psychomotor agitation | Frequency % (n° of mice) | - | - | - | 100% (6) | 100% (6) | 100% (6) | 100% (6) | |
| Duration (min) | - | - | - | 54.2 ± 10.30 | 121.0 ± 12.35 a | 235.1 ± 15.25 ab | 280.1 ± 12.35 ab | ||
| Latency (min) | - | - | - | 61.2 ± 6.30 | 28.2 ± 7.20 a | 3.2 ± 0.25 ab | 2.2 ± 0.15 ab | ||
| Sweating | Frequency % (n° of mice) | - | - | - | - | - | 100% (6) | 100% (6) | |
| Salivation | Frequency % (n° of mice) | - | - | - | - | - | 100% (6) | 50% (3) | |
| Hyperthermia | Variation (Δ°C) | −0.28 ± 0.12 | −0.18 ± 0.14 | −0.22 ± 0.17 | −0.34 ± 0.22 | −0.41 ± 0.13 | 1.52 ± 0.11 c | 2.22 ± 0.12 c | |
| Latency (min) | - | - | - | - | - | 25 ± 0.25 | 7.12 ± 0.23 d | ||
| Aggressiveness | Spontaneus | Frequency % (n° of mice) | - | - | - | - | - | - | nd |
| Stimulated | Frequency % (n° of mice) | - | - | - | - | 100% (6) | 100% (6) | nd | |
| Score (n° of bites) | - | - | - | - | 6 ± 0.23 | 10 ± 0.23 b | nd | ||
| Convulsion | Frequency % (n° of mice) | - | - | - | - | - | 50% (3) | 100% (6) | |
| Episodes (n°) | - | - | - | - | - | 3.5 ± 0.5 | 2.0 ± 0.41 d | ||
| Latency of first episode (sec) | - | - | - | - | - | 10.5 ± 1.5 | 8.25 ± 1.1 | ||
| Duration of each episode (sec) | - | - | - | - | - | 4.86 ± 1.26 | 16.14 ± 3.2 d | ||
| Lethality | Frequency % (n° of mice) | - | - | - | - | - | 50% (3) | 100% (6) | |
| Time of death (min) | - | - | - | - | - | 59.3 ± 2.3 | 31.9 ± 5.6 d | ||
| Surviving mice % (n° of mice) | - | - | - | - | - | 50% (3) | 0% (0) | ||
| COMPOUND | trans-4,4’-DMAR | ||||
|---|---|---|---|---|---|
| Doses (mg/kg) | vehicle | 30 | 60 | ||
| Psychomotor agitation | Frequency % (n° of mice) | - | - | - | |
| Duration (min) | - | - | - | ||
| Latency (min) | - | - | - | ||
| Sweating | Frequency % (n° of mice) | - | - | - | |
| Salivation | Frequency % (n° of mice) | - | - | - | |
| Hyperthermia | Variation (Δ°C) | −0.28 ± 0.12 | −0.37 ± 0.13 | −0.35 ± 0.16 | |
| Latency (min) | - | - | - | ||
| Aggressiveness | Spontaneus | Frequency % (n° of mice) | - | - | - |
| Stimulated | Frequency % (n° of mice) | - | - | - | |
| Score (n° of bites) | - | - | - | ||
| Convulsion | Frequency % (n° of mice) | - | - | - | |
| Episodes (n°) | - | - | - | ||
| Latency of first episode (sec) | - | - | - | ||
| Duration of each episode (sec) | - | - | - | ||
| Lethality | Frequency % (n° of mice) | - | - | - | |
| Time of death (min) | - | - | - | ||
| COMPOUND | cis-4,4’-DMAR | trans | (cis + trans)-4-4’DMAR | |||||||
|---|---|---|---|---|---|---|---|---|---|---|
| Doses (mg/kg) | vehicle | 1 | 10 | 60 | 30 | 1 + 30 | 10 + 30 | 60 + 30 | ||
| Psychomotor agitation | Frequency % (n° of mice) | - | - | 100% (6) | 100% (6) | - | 50% (3) | 100% (6) | 100% (6) | |
| Duration (min) | - | - | 121.0 ± 12.35 | 220.1 ± 12.35 | - | 55.0 ± 5.0 | 185.5 ± 11.0 e | nd | ||
| Latency (min) | - | - | 28.2 ± 7.20 | 2.2 ± 0.15 | - | 45.2 ± 5.20 | 6.2 ± 2.20 e | 0.45 ± 0.10 f | ||
| Sweating | Frequency % (n° of mice) | - | - | - | 100% (6) | - | - | 33% (2) | 100% (6) | |
| Salivation | Frequency % (n° of mice) | - | - | - | 50% (3) | - | - | 33% (2) | 50% (3) | |
| Hyperthermia | Variation (Δ°C) | −0.28 ± 0.12 | −0.22 ± 0.17 | −0.41 ± 0.13 | 2.22 ± 0.12 | −0.37 ± 0.13 | −0.70 ± 0.15 | 1.6 ± 0.11 e | 2.25 ± 0.09 | |
| Latency (min) | - | - | - | 7.12 ± 0.23 | - | - | 28.0 ± 0.21 | 5.0 ± 0.23 f | ||
| Aggressiveness | Spontaneus | Frequency % (n° of mice) | - | - | - | nd | - | - | - | nd |
| Stimulated | Frequency % (n° of mice) | - | - | 100% (6) | nd | - | - | 100% (6) | nd | |
| Score (n° of bites) | - | - | 6 ± 0.23 | nd | - | - | 10 ± 0.05 e | nd | ||
| Convulsion | Frequency % (n° of mice) | - | - | - | 100% (6) | - | - | - | 100% (6) | |
| Episodes (n°) | - | - | - | 2.0 ± 0.41 | - | - | - | 1.0 ± 0.0 f | ||
| Latency of first episode (sec) | - | - | - | 8.25 ± 1.1 | - | - | - | 6.67 ± 2.73 | ||
| Duration of each episode (sec) | - | - | - | 16.14 ± 6.2 | - | - | - | 40.0 ± 5.0 f | ||
| Lethality | Frequency % (n° of mice) | - | - | - | 100% (6) | - | - | - | 100% (6) | |
| Time of death (min) | - | - | - | 31.9 ± 5.6 | - | - | - | 11.0 ± 3.9 f | ||
| Surviving mice % (n° of mice) | - | - | - | 0% (0) | - | - | - | 0% (0) | ||
| COMPOUND | cis-4,4’-DMAR | trans-4,4’-DMAR | (cis + trans)-4-4’DMAR | ||
|---|---|---|---|---|---|
| Doses (mg/kg) | 10 | 10 | 10+10 | ||
| Psychomotoragitation | Frequency % (n° of mice) | 100% (4) | - | 100% (4) | |
| Duration (min) | 125.0 ± 10.12 | - | 171.0 ± 9.25 e | ||
| Latency (min) | 26.4 ± 6.25 | - | 8.0 ± 4.25 e | ||
| Sweating | Frequency % (n° of mice) | - | - | - | |
| Salivation | Frequency % (n° of mice) | - | - | - | |
| Hyperthermia | Variation (Δ°C) | −0.21 ± 0.15 | −0.32 ± 0.1 | 1.58 ± 0.23 e | |
| Latency (min) | - | - | 32.0 ± 2.45 | ||
| Aggressiveness | Spontaneus | Frequency % (n° of mice) | - | - | - |
| Stimulated | Frequency % (n° of mice) | 100% (4) | - | 100% (4) | |
| Score (n° of bites) | 5 ± 0.23 | - | 8 ± 0.13 e | ||
| Convulsion | Frequency % (n° of mice) | - | - | - | |
| Episodes (n°) | - | - | - | ||
| Latency of first episode (sec) | - | - | - | ||
| Duration of each episode (sec) | - | - | - | ||
| Lethality | Frequency % (n° of mice) | - | - | - | |
| Time of death (min) | - | - | - | ||
| Mouse Dose (mg/kg) | HED | Human Dose | Human Dosage | Effects |
|---|---|---|---|---|
| (mg/kg) | (mg) | |||
| 0.1 | 0.0081 | 0.486 | Low | high state of vigilance, euphoria, decreased appetite, increased frequency of heartbeat and motor activity |
| 1 | 0.081 | 4.86 | ||
| 3 | 0.243 | 14.58 | ||
| 10 | 0.81 | 48.6 | Intermediate | restlessness, agitation and insomnia |
| 30 | 2.43 | 145.8 | high | involve severe anorexia, mild paranoia (sometimes hallucinations), hyperthermia, bruxism, facial spasms, an increase in aggression and desire for violence, seizures, an increased heart rate that will be involved in a cardiac arrest |
| 60 | 4.86 | 291.6 |
| Marker | Dilution | Retrieval | |
|---|---|---|---|
| HSP27 | Santa Cruz Biotechnology, Inc. | 1:50 | HIER (0.25 mM EDTA buffer ) |
| HSP70 | Santa Cruz Biotechnology, Inc. | 1:50 | HIER (0.25 mM EDTA buffer ) |
| HSP90 | Santa Cruz Biotechnology, Inc. | 1:50 | HIER (0.25 mM EDTA buffer ) |
| SMAC | Santa Cruz Biotechnology, Inc. | 1:100 | HIER (0.01 M citrate buffer) |
| NF-kB | Santa Cruz Biotechnology, Inc. | 1:50 | HIER (0.25 mM EDTA buffer ) |
| iNOS | Santa Cruz Biotechnology, Inc. | 1:100 | HIER (0.01 M citrate buffer) |
| NOX-2 | Proteintech | 1:100 | HIER (0.01 M citrate buffer) |
| NT | Santa Cruz Biotechnology, Inc. | 1:600 | HIER (0.01 M citrate buffer) |
| 8OHDG | Santa Cruz Biotechnology, Inc. | 1:500 | HIER (0.01 M citrate buffer) |
Publisher’s Note: MDPI stays neutral with regard to jurisdictional claims in published maps and institutional affiliations. |
© 2021 by the authors. Licensee MDPI, Basel, Switzerland. This article is an open access article distributed under the terms and conditions of the Creative Commons Attribution (CC BY) license (https://creativecommons.org/licenses/by/4.0/).
Share and Cite
Tirri, M.; Frisoni, P.; Bilel, S.; Arfè, R.; Trapella, C.; Fantinati, A.; Corli, G.; Marchetti, B.; De-Giorgio, F.; Camuto, C.; et al. Worsening of the Toxic Effects of (±)Cis-4,4′-DMAR Following Its Co-Administration with (±)Trans-4,4′-DMAR: Neuro-Behavioural, Physiological, Immunohistochemical and Metabolic Studies in Mice. Int. J. Mol. Sci. 2021, 22, 8771. https://doi.org/10.3390/ijms22168771
Tirri M, Frisoni P, Bilel S, Arfè R, Trapella C, Fantinati A, Corli G, Marchetti B, De-Giorgio F, Camuto C, et al. Worsening of the Toxic Effects of (±)Cis-4,4′-DMAR Following Its Co-Administration with (±)Trans-4,4′-DMAR: Neuro-Behavioural, Physiological, Immunohistochemical and Metabolic Studies in Mice. International Journal of Molecular Sciences. 2021; 22(16):8771. https://doi.org/10.3390/ijms22168771
Chicago/Turabian StyleTirri, Micaela, Paolo Frisoni, Sabrine Bilel, Raffaella Arfè, Claudio Trapella, Anna Fantinati, Giorgia Corli, Beatrice Marchetti, Fabio De-Giorgio, Cristian Camuto, and et al. 2021. "Worsening of the Toxic Effects of (±)Cis-4,4′-DMAR Following Its Co-Administration with (±)Trans-4,4′-DMAR: Neuro-Behavioural, Physiological, Immunohistochemical and Metabolic Studies in Mice" International Journal of Molecular Sciences 22, no. 16: 8771. https://doi.org/10.3390/ijms22168771
APA StyleTirri, M., Frisoni, P., Bilel, S., Arfè, R., Trapella, C., Fantinati, A., Corli, G., Marchetti, B., De-Giorgio, F., Camuto, C., Mazzarino, M., Gaudio, R. M., Serpelloni, G., Schifano, F., Botrè, F., & Marti, M. (2021). Worsening of the Toxic Effects of (±)Cis-4,4′-DMAR Following Its Co-Administration with (±)Trans-4,4′-DMAR: Neuro-Behavioural, Physiological, Immunohistochemical and Metabolic Studies in Mice. International Journal of Molecular Sciences, 22(16), 8771. https://doi.org/10.3390/ijms22168771