
Effects on Metabolism in Astrocytes Caused by cGAMP, Which Imitates the Initial Stage of Brain Metastasis


 ,
,
Abstract
: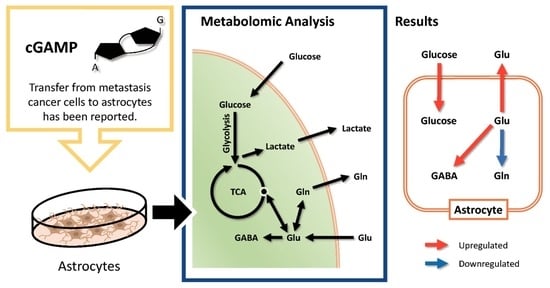
1. Introduction
2. Results
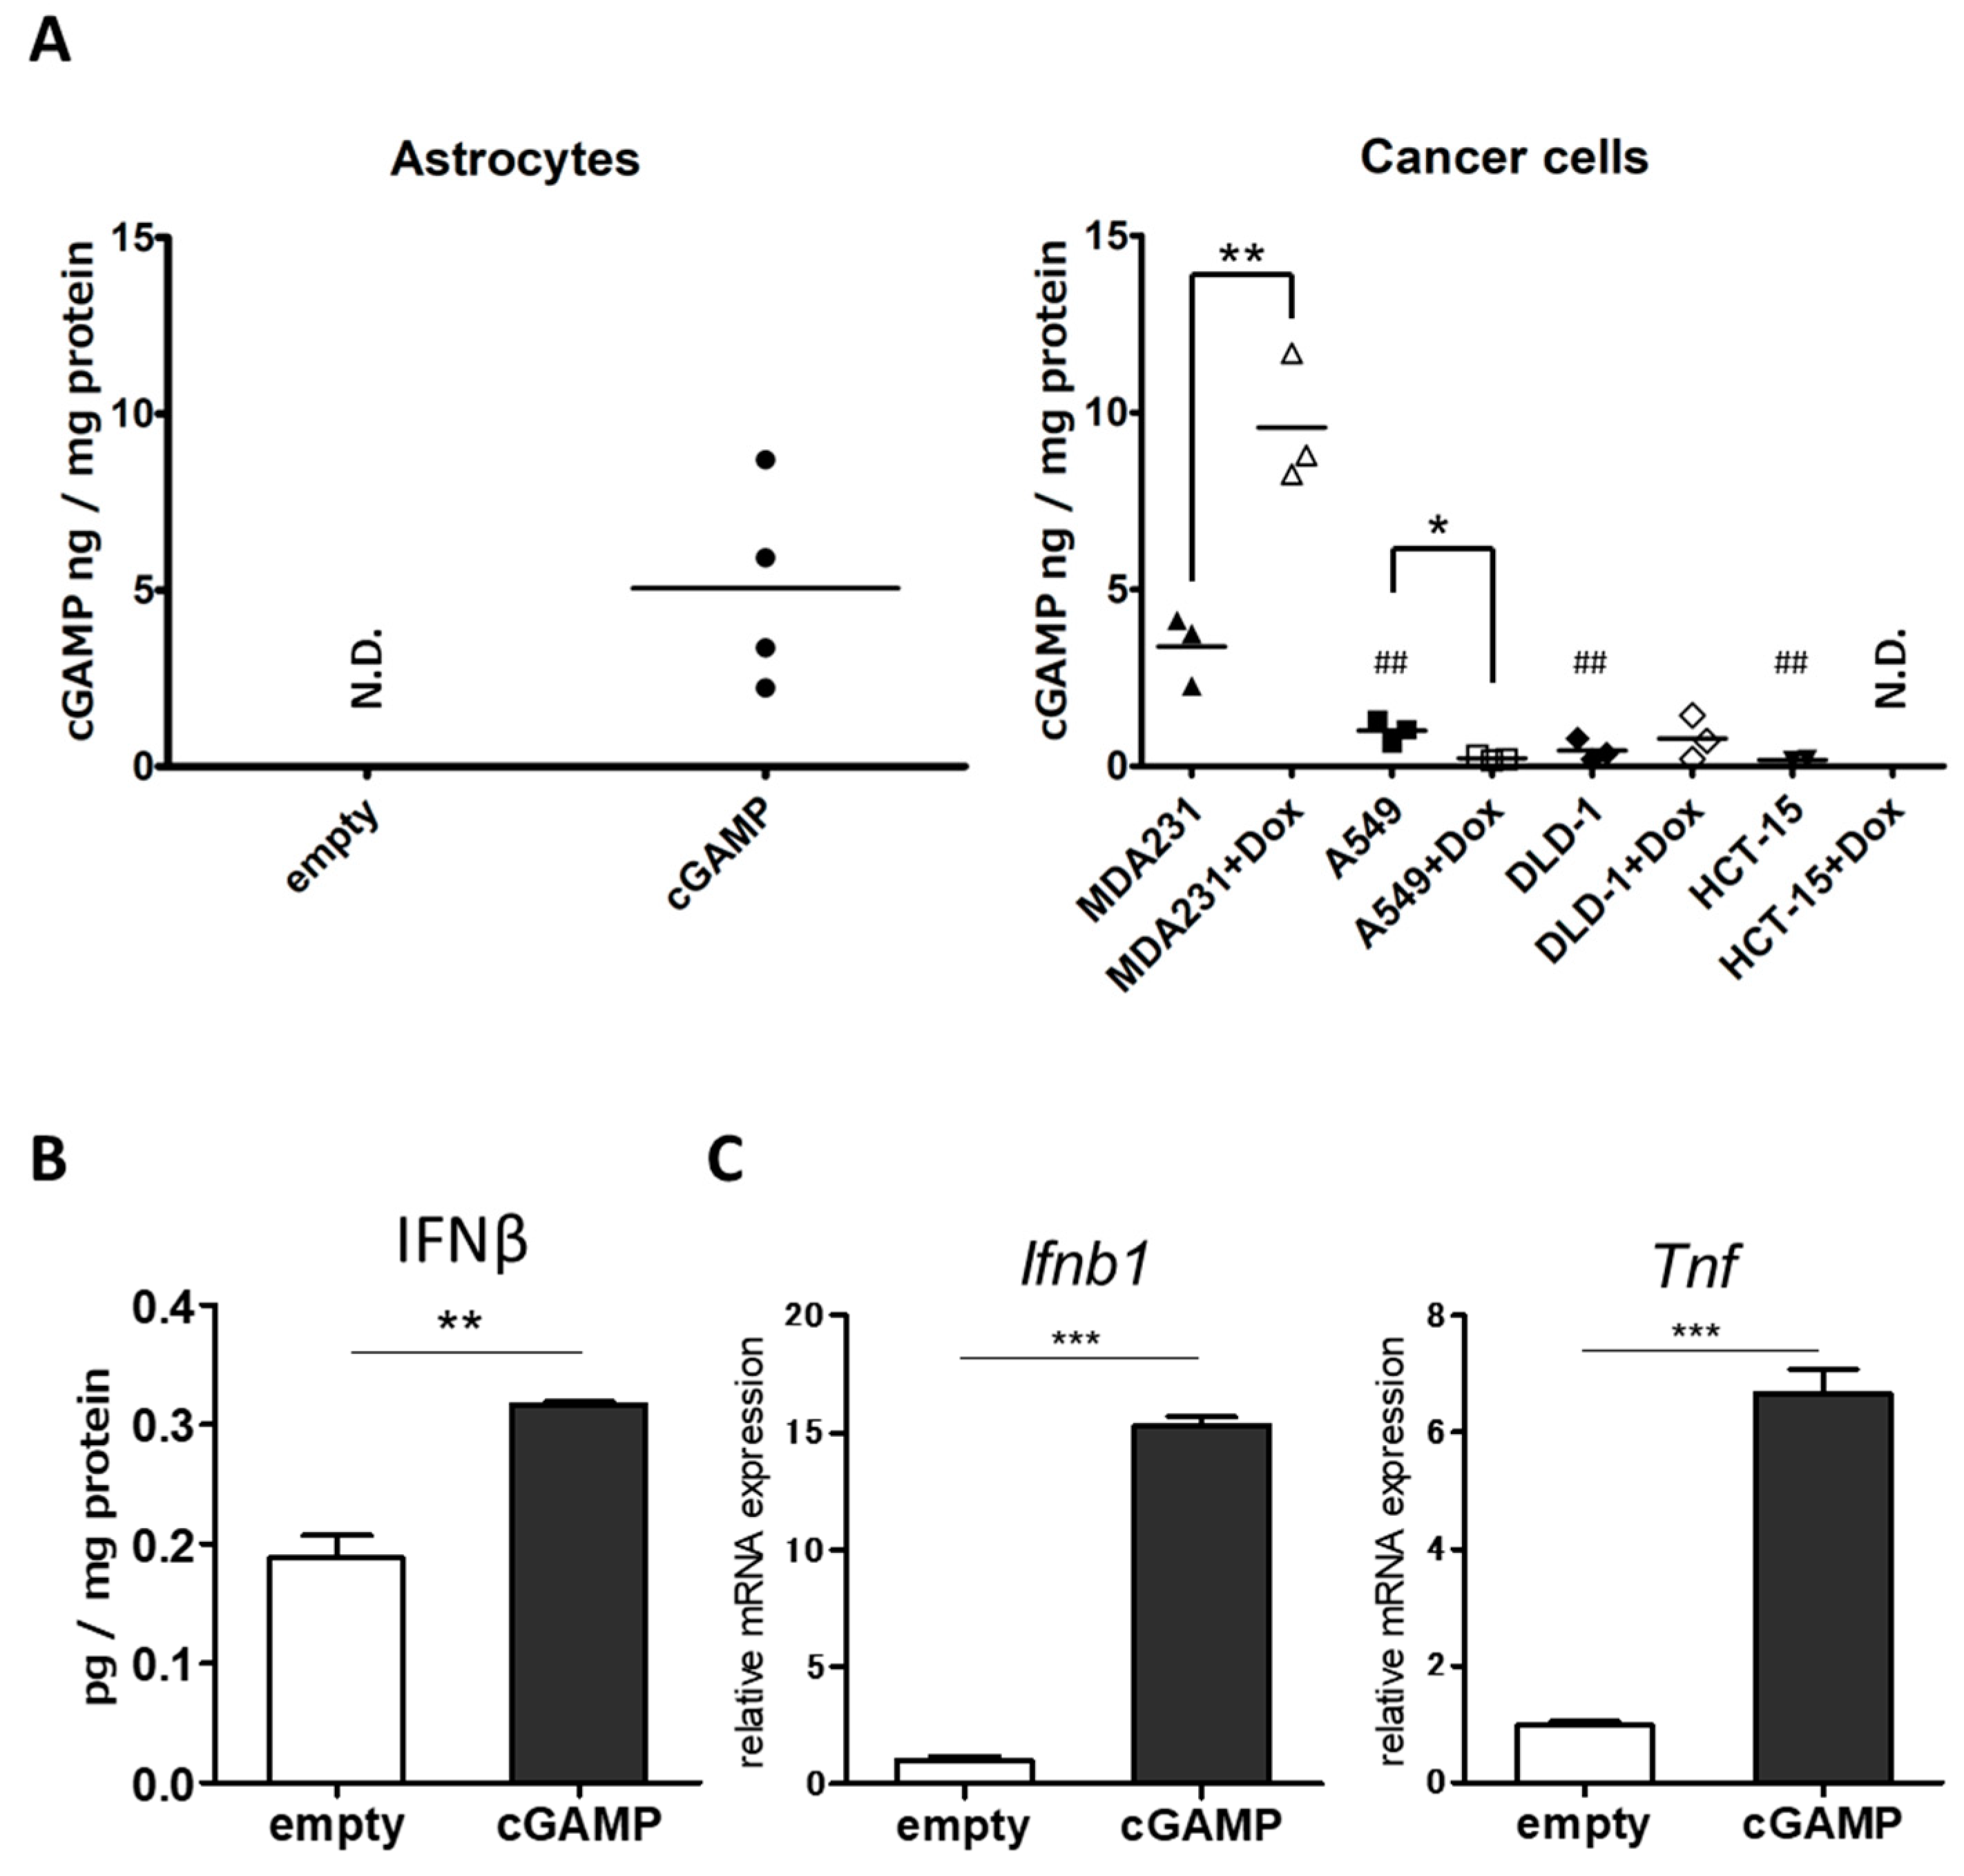
2.1. Delivery of cGAMP to Astrocytes
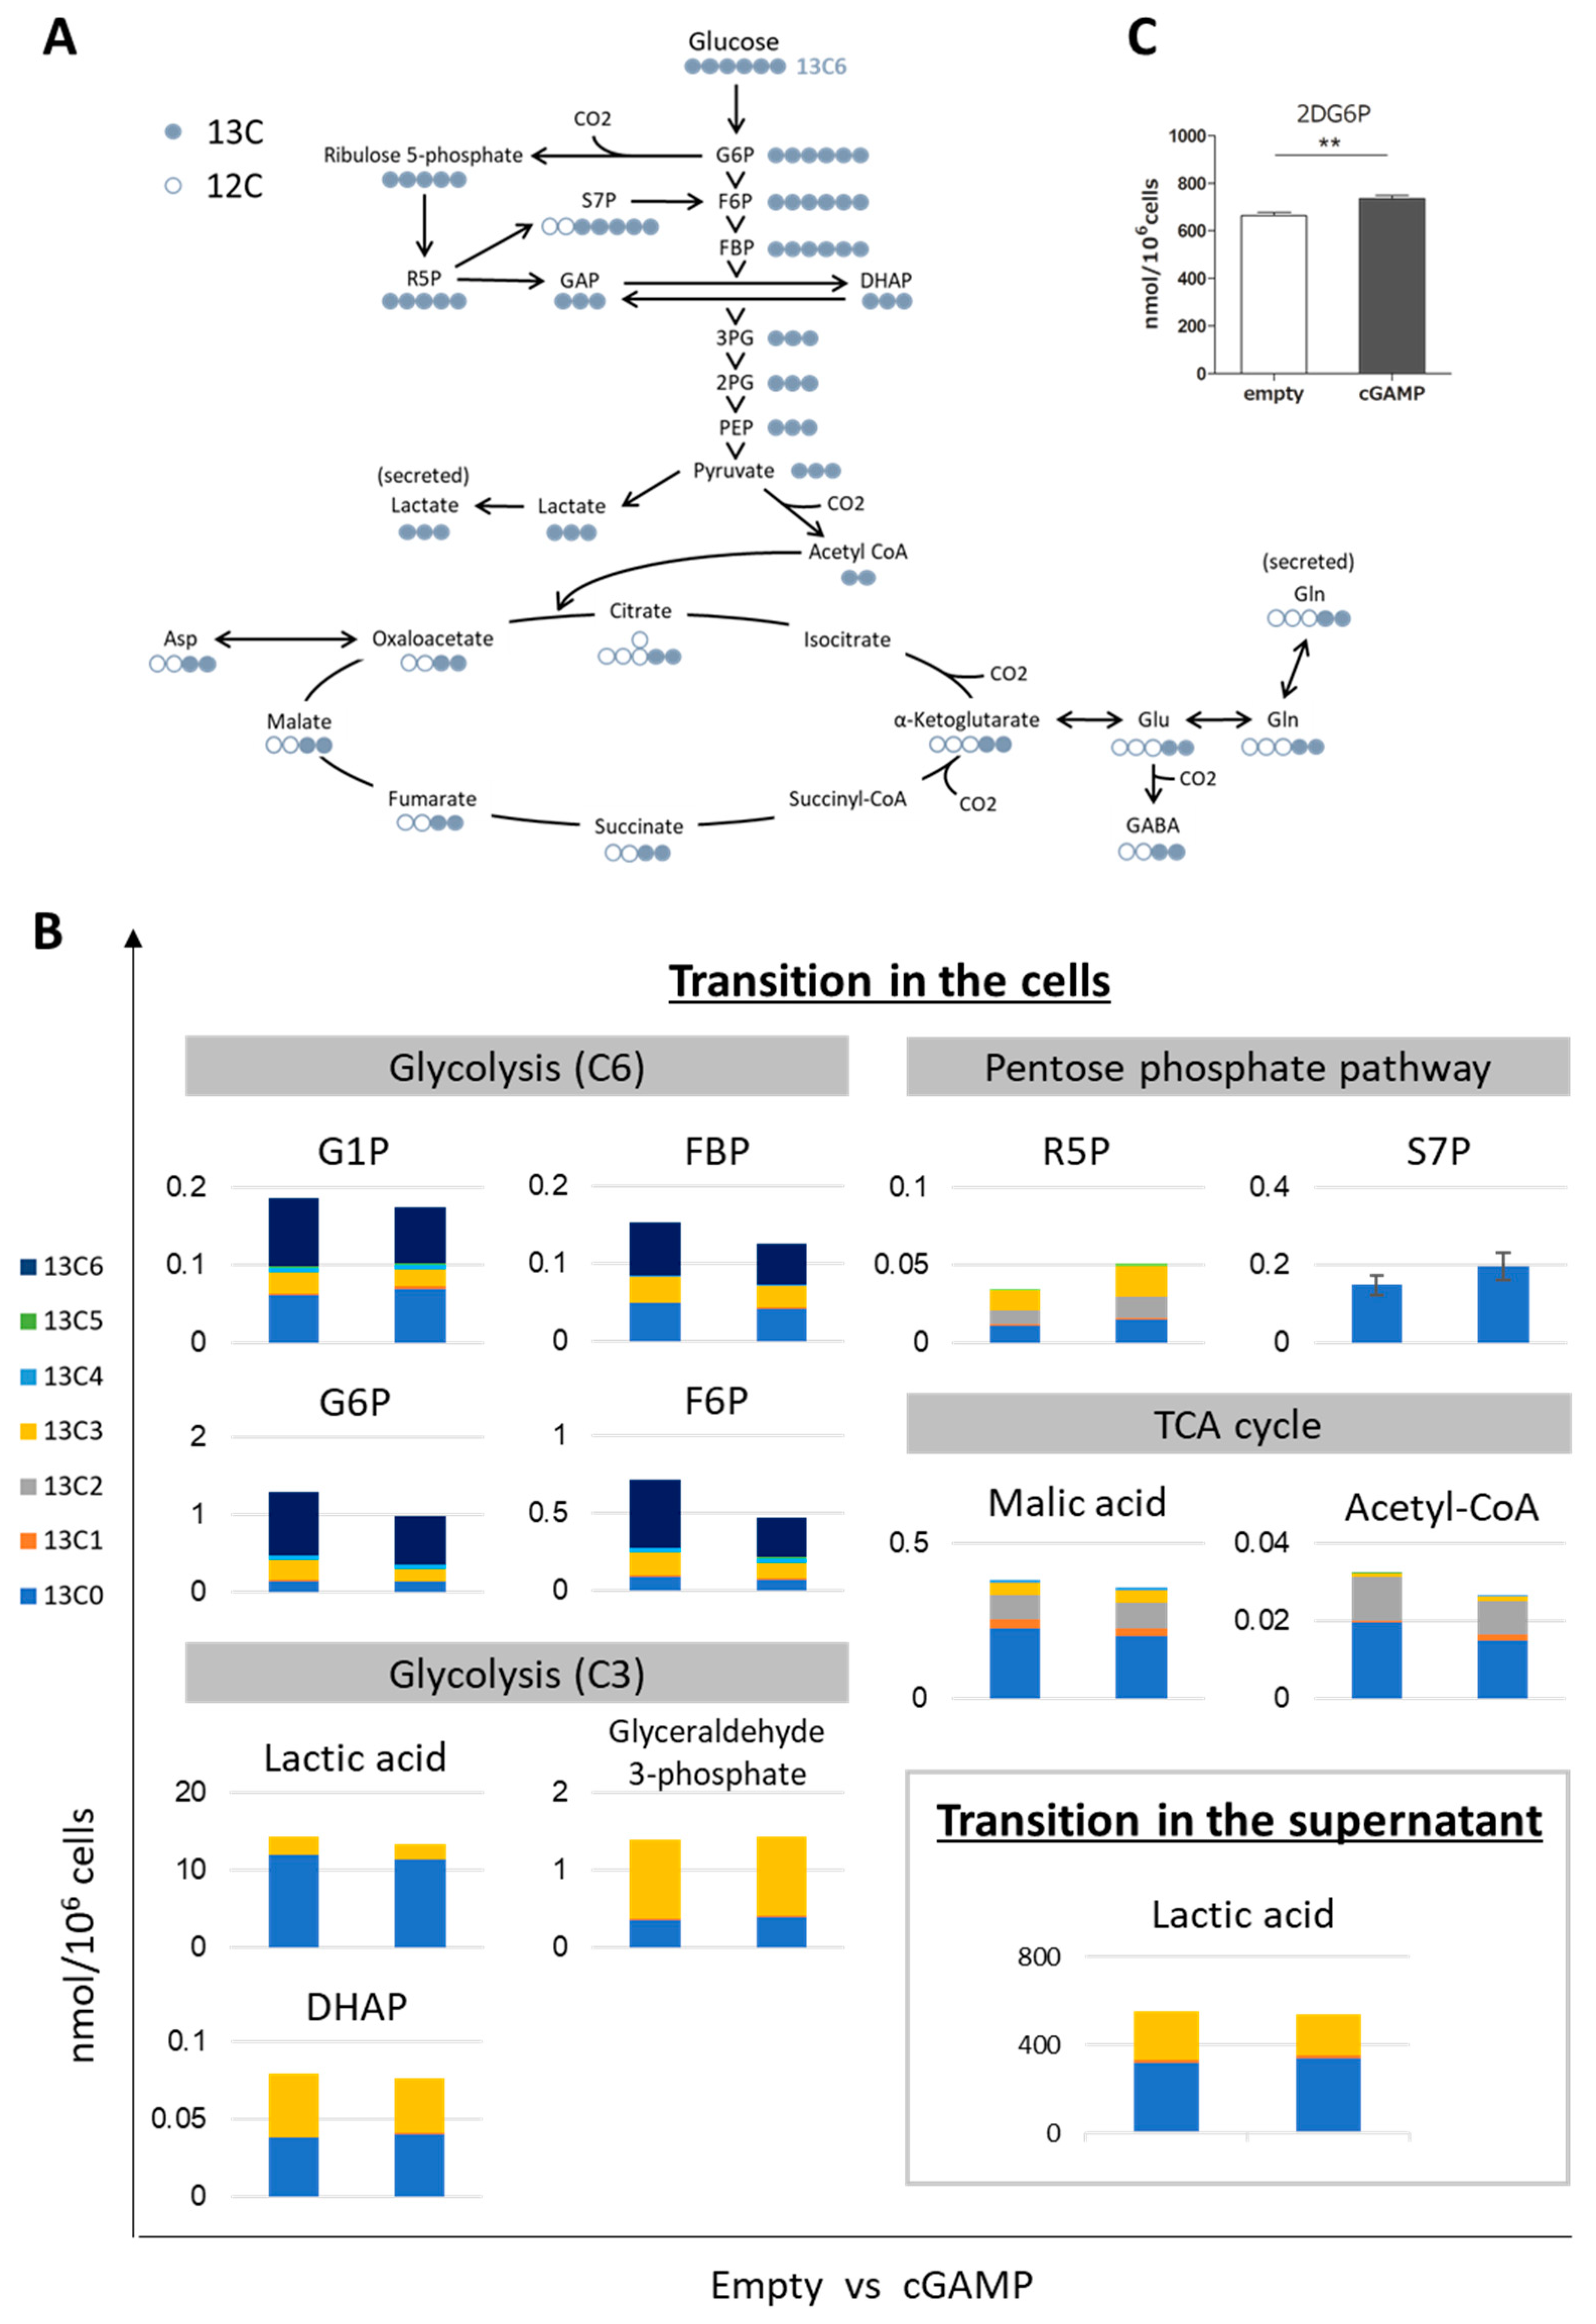
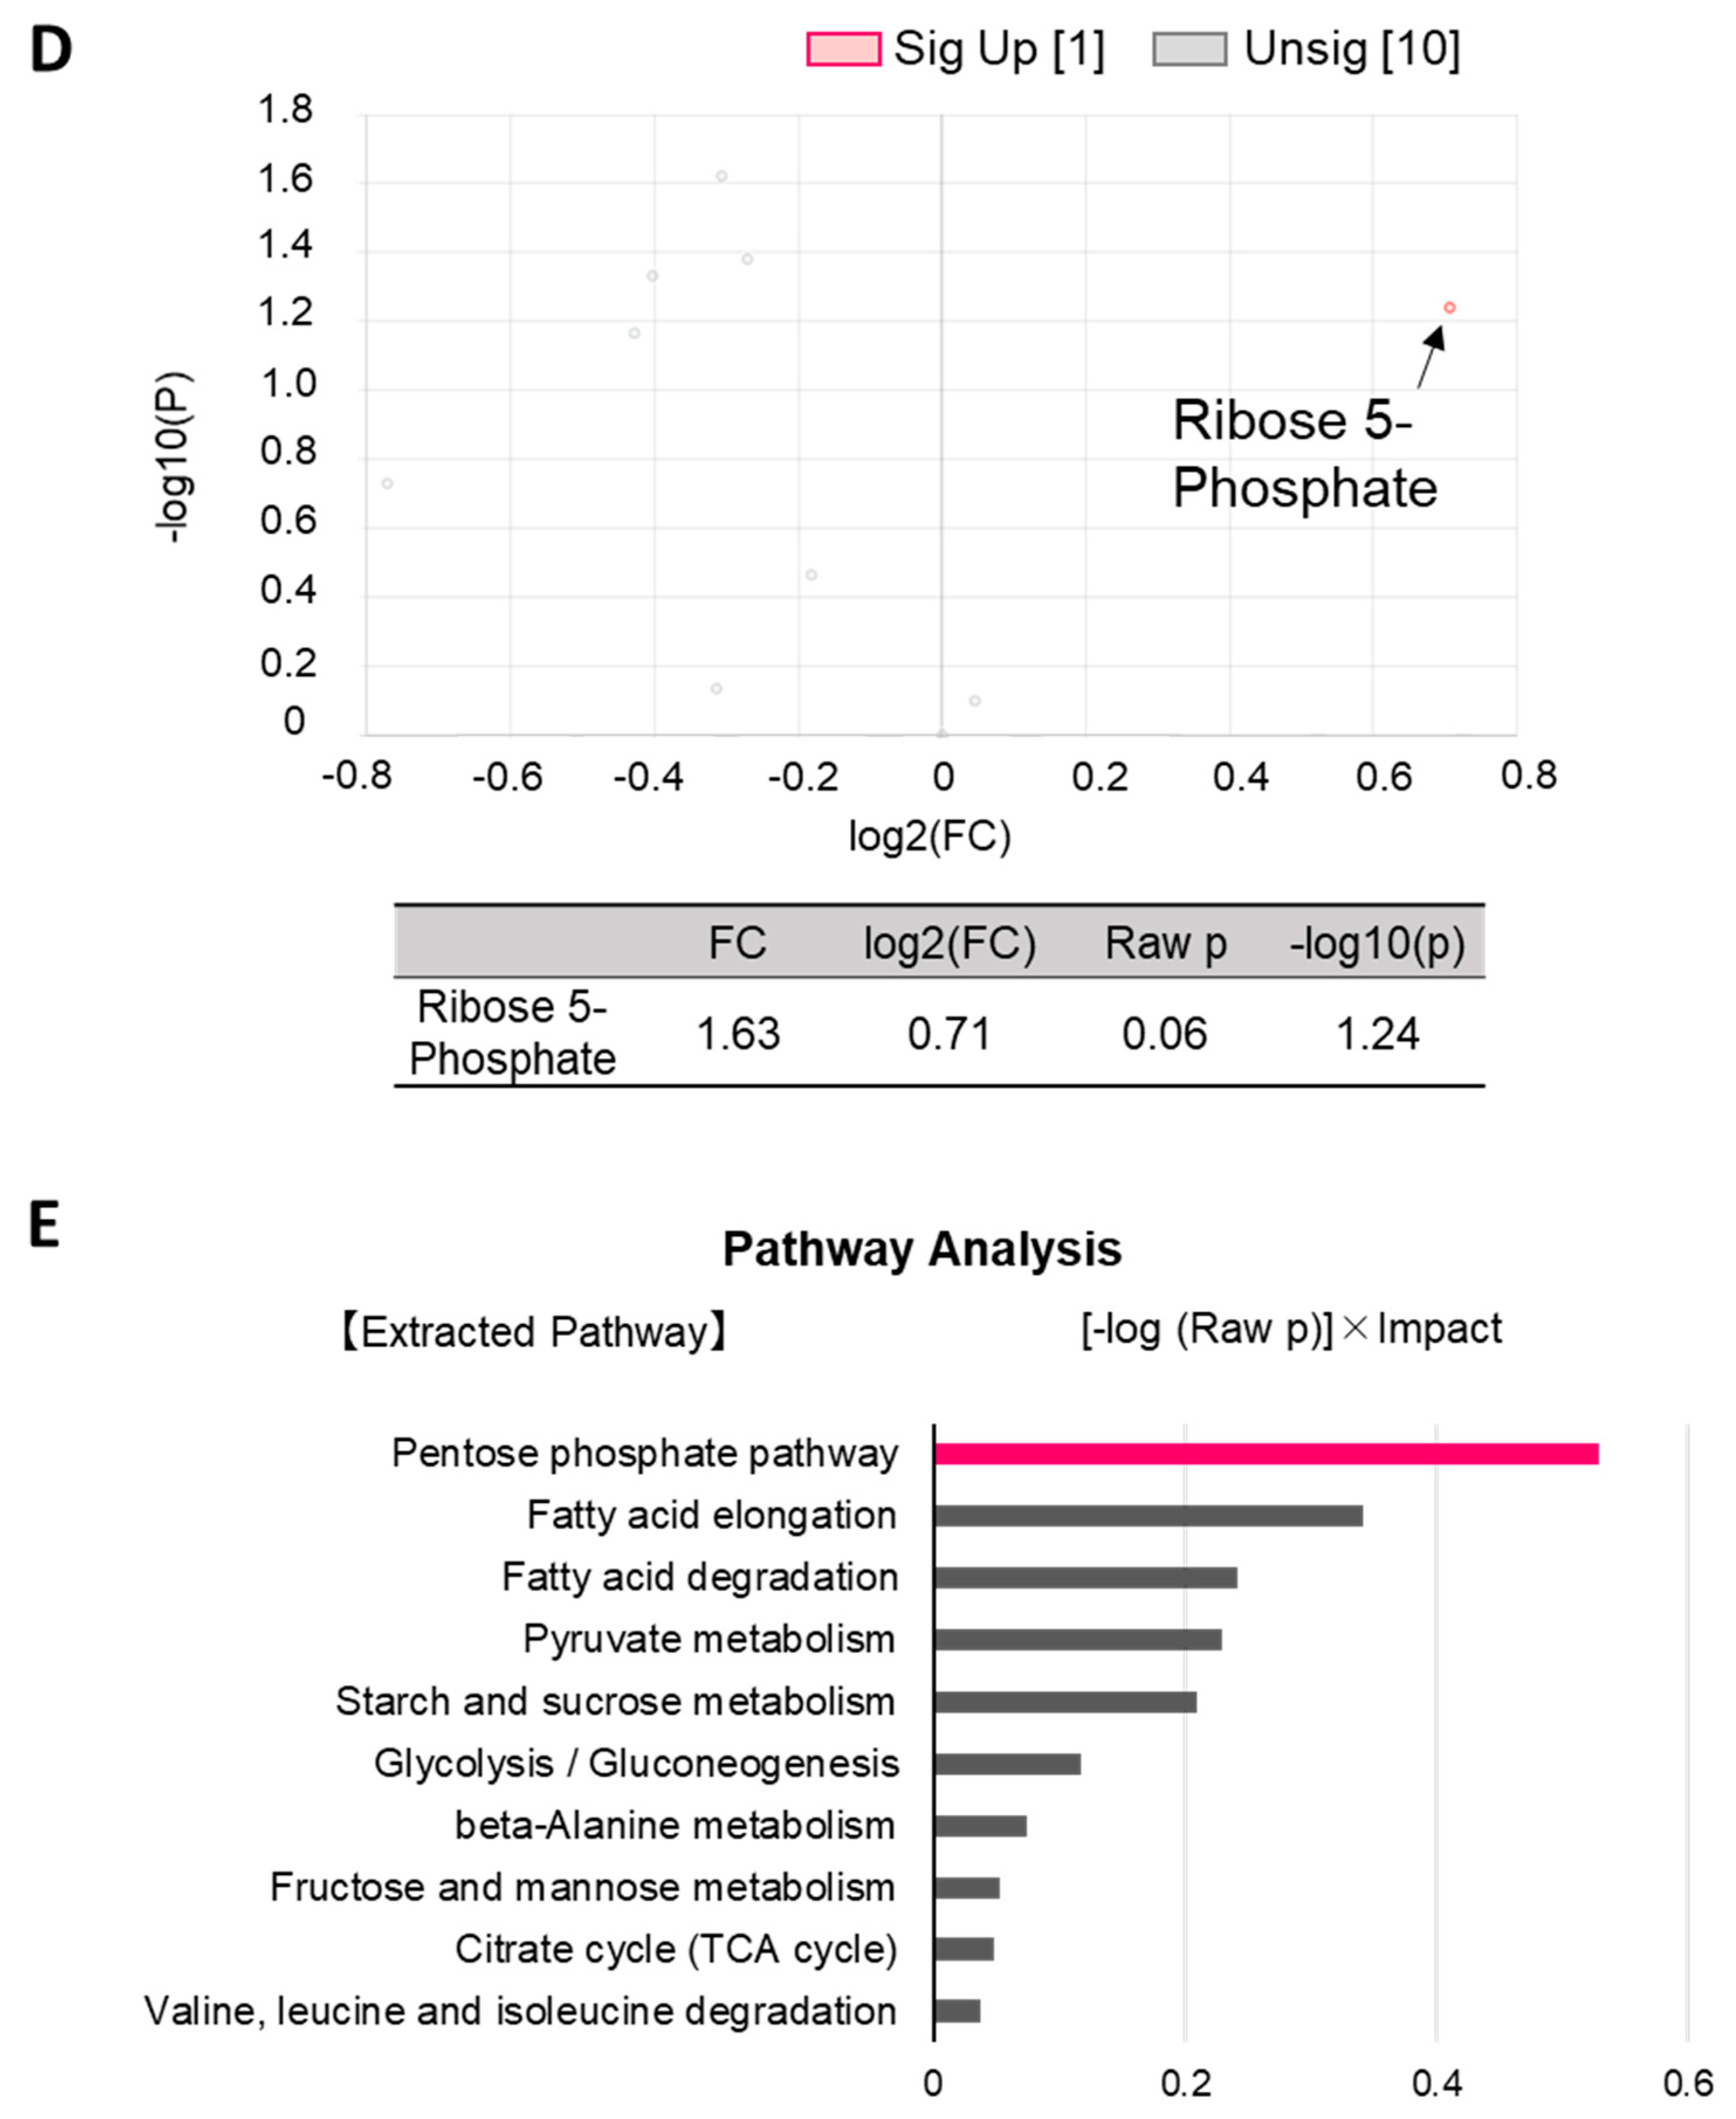
2.2. Alteration of Glucose Metabolism by cGAMP
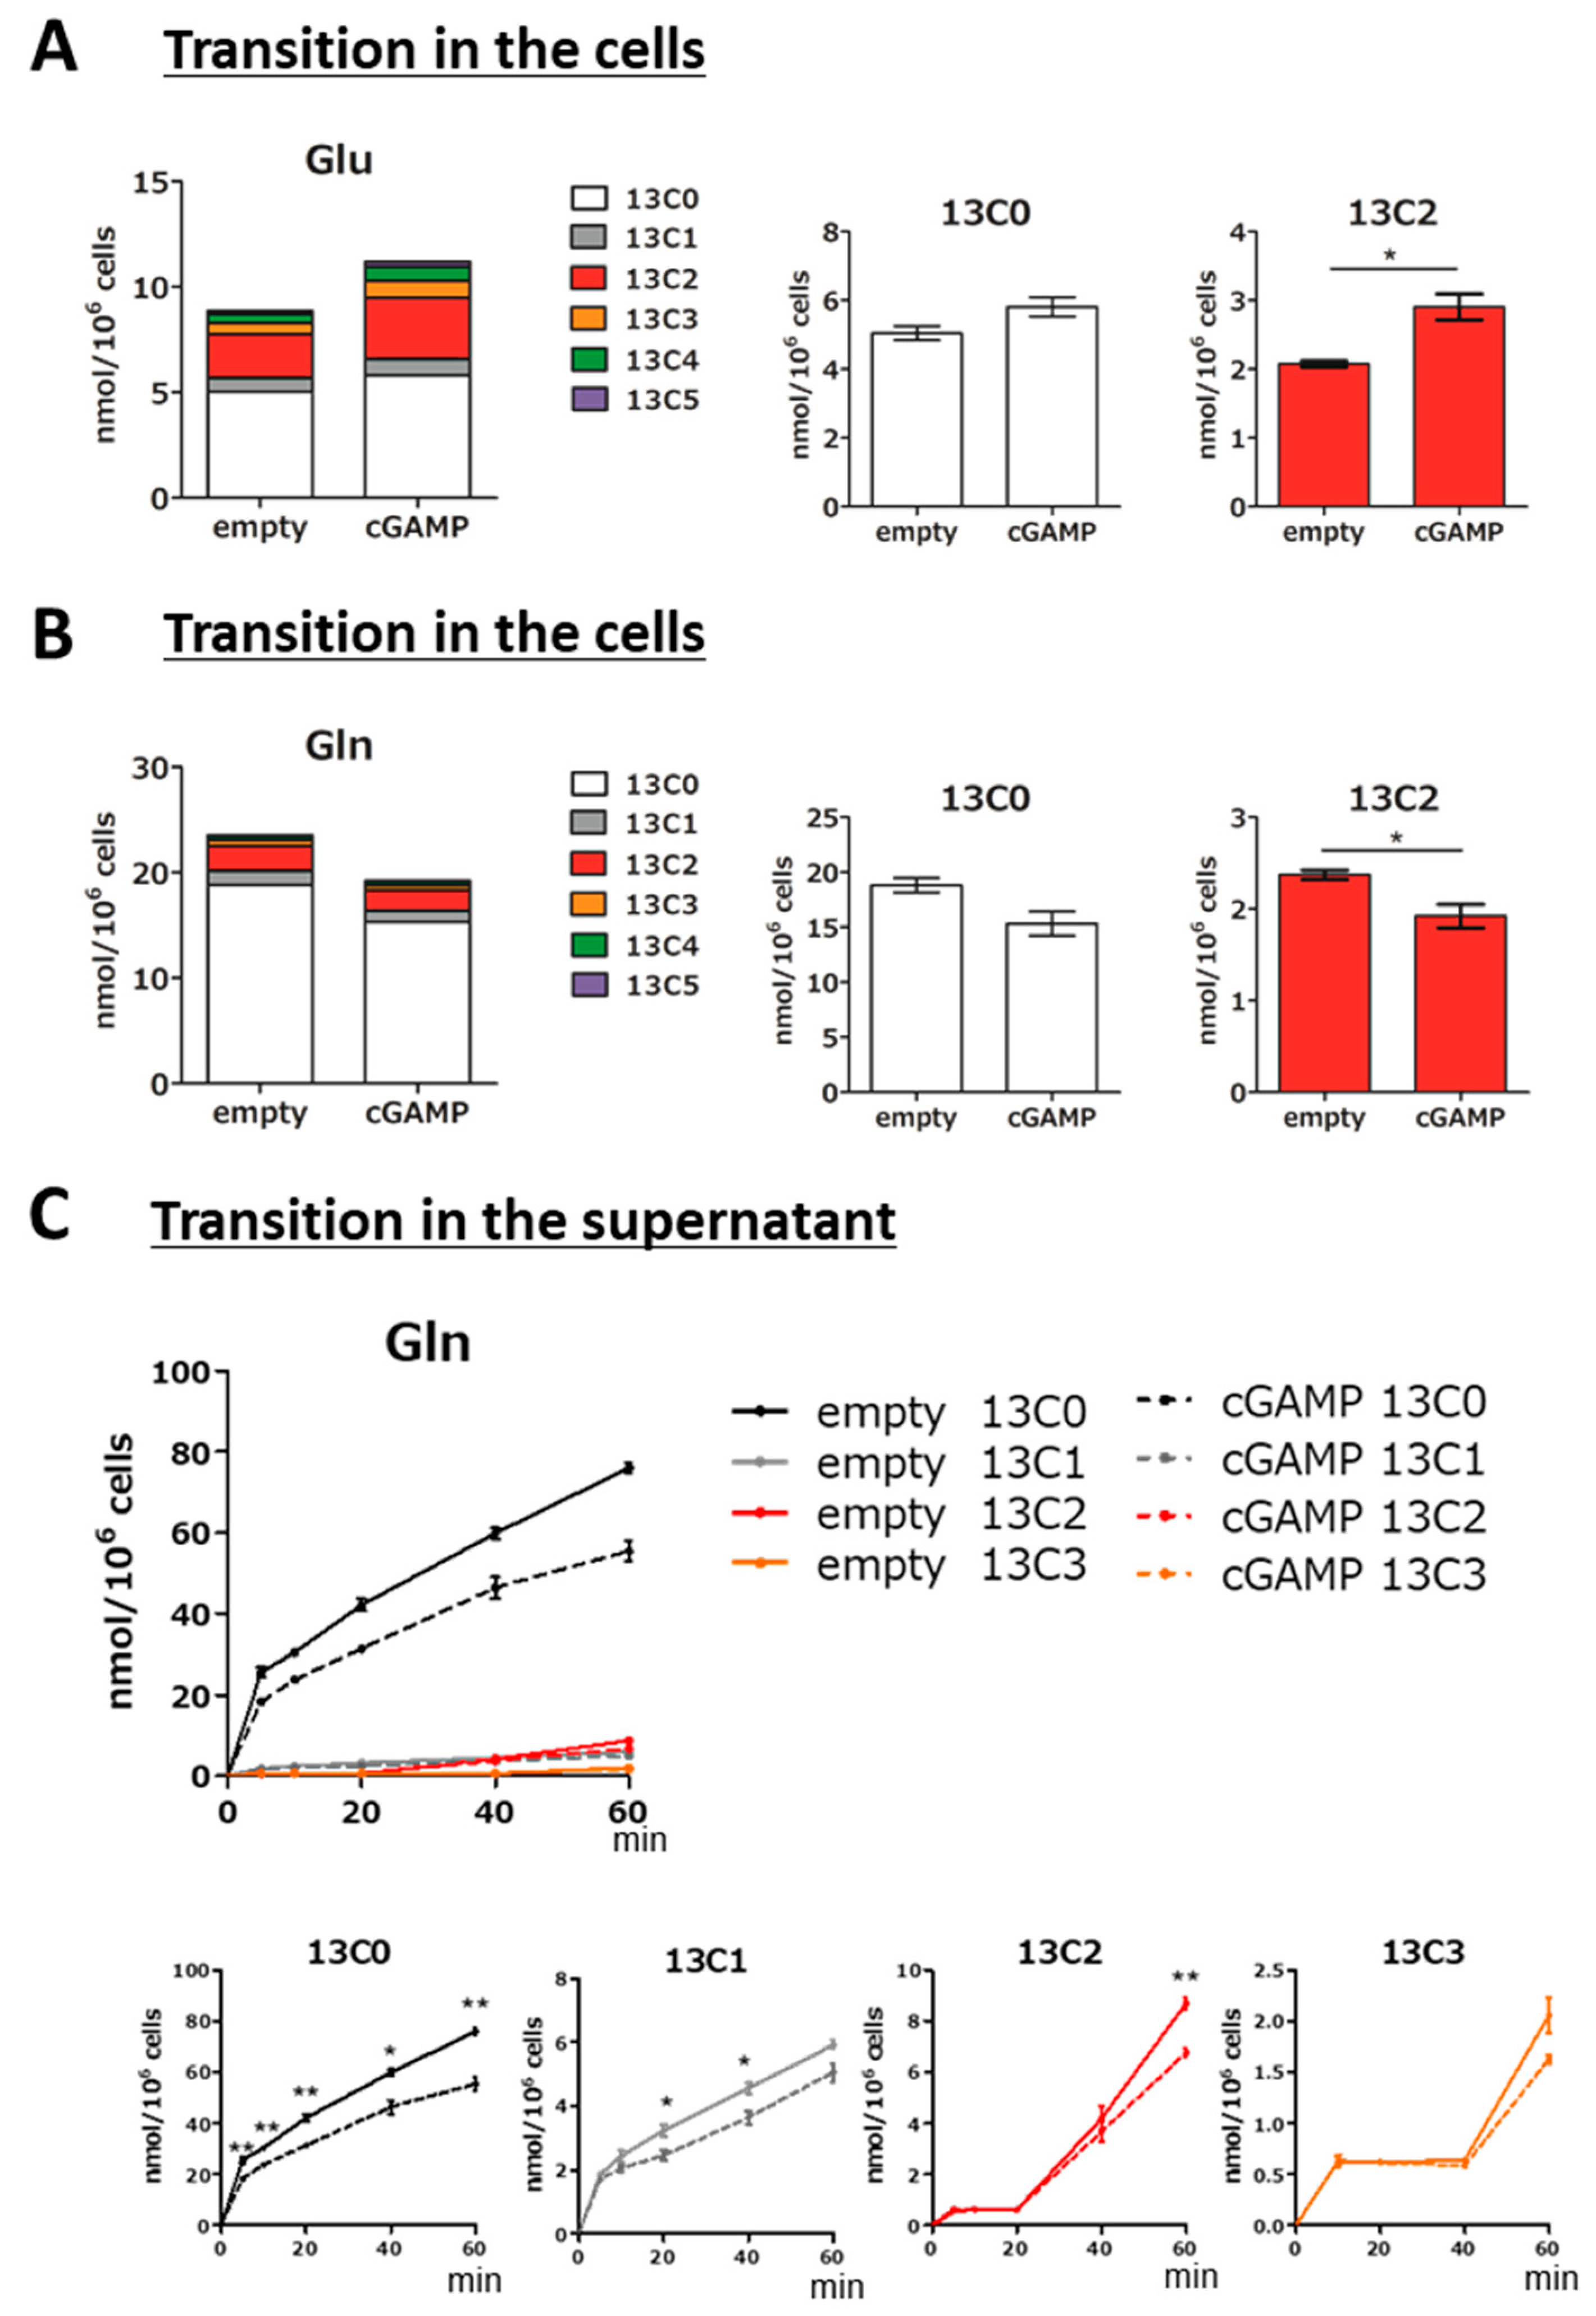
2.3. Alteration of Glutamine–Glutamate (Gln-Glu) Metabolism by cGAMP
2.4. Effect of cGAMP on GABA Production
3. Discussion
4. Materials and Methods
4.1. Reagents
4.2. Preparation of ssPalm-cGAMP
4.3. Cell Culture
4.4. RT-PCR
4.5. ELISA for cGAMP Detection
4.6. 13C6-Glucose Uptake
4.7. 13C5,15N-Glutamate (Glu) Uptake
4.8. Metabolite Extraction and Metabolome Analysis Using Capillary Electrophoresis Time-of-Flight Mass Spectrometry (CE-TOF-MS)
4.9. Statistical Analysis
5. Conclusions
Supplementary Materials
Author Contributions
Funding
Institutional Review Board Statement
Acknowledgments
Conflicts of Interest
References
- Verkhratsky, A.; Matteoli, M.; Parpura, V.; Mothet, J.P.; Zorec, R. Astrocytes as secretory cells of the central nervous system: Idiosyncrasies of vesicular secretion. EMBO J. 2016, 35, 239–257. [Google Scholar] [CrossRef] [Green Version]
- Pellerin, L.; Magistretti, P.J. Glutamate uptake into astrocytes stimulates aerobic glycolysis: A mechanism coupling neuronal activity to glucose utilization. Proc. Natl. Acad. Sci. USA 1994, 91, 10625–10629. [Google Scholar] [CrossRef] [Green Version]
- Pellerin, L.; Bouzier-Sore, A.K.; Aubert, A.; Serres, S.; Merle, M.; Costalat, R.; Magistretti, P.J. Activity-dependent regulation of energy metabolism by astrocytes: An update. Glia 2007, 55, 1251–1262. [Google Scholar] [CrossRef]
- Magistretti, P.J.; Allaman, I. A cellular perspective on brain energy metabolism and functional imaging. Neuron 2015, 86, 883–901. [Google Scholar] [CrossRef] [Green Version]
- Navarrete, M.; Araque, A. The Cajal school and the physiological role of astrocytes: A way of thinking. Front. Neuroanat. 2014, 8, 33. [Google Scholar] [CrossRef] [PubMed] [Green Version]
- Anderson, C.M.; Swanson, R.A. Astrocyte glutamate transport: Review of properties, regulation, and physiological functions. Glia 2000, 32, 1–14. [Google Scholar] [CrossRef]
- Waniewski, R.A.; Martin, D.L. Exogenous glutamate is metabolized to glutamine and exported by rat primary astrocyte cultures. J. Neurochem. 1986, 47, 304–313. [Google Scholar] [CrossRef] [PubMed]
- Bélanger, M.; Allaman, I.; Magistretti, P.J. Brain energy metabolism: Focus on astrocyte-neuron metabolic cooperation. Cell Metab. 2011, 14, 724–738. [Google Scholar] [CrossRef] [Green Version]
- Ben Haim, L.; Carrillo-De Sauvage, M.A.; Ceyzériat, K.; Escartin, C. Elusive roles for reactive astrocytes in neurodegenerative diseases. Front. Cell Neurosci. 2015, 9, 278. [Google Scholar] [CrossRef] [Green Version]
- Liddelow, S.A.; Barres, B.A. Reactive Astrocytes: Production, Function, and Therapeutic Potential. Immunity 2017, 46, 957–967. [Google Scholar] [CrossRef] [Green Version]
- Lin, Q.; Balasubramanian, K.; Fan, D.; Kim, S.J.; Guo, L.; Wang, H.; Bar-Eli, M.; Aldape, K.D.; Fidler, I.J. Reactive astrocytes protect melanoma cells from chemotherapy by sequestering intracellular calcium through gap junction communication channels. Neoplasia 2010, 12, 748–754. [Google Scholar] [CrossRef] [Green Version]
- Chen, Q.; Boire, A.; Jin, X.; Valiente, M.; Er, E.E.; Lopez-Soto, A.; Jacob, L.; Patwa, R.; Shah, H.; Xu, K.; et al. Carcinoma-astrocyte gap junctions promote brain metastasis by cGAMP transfer. Nature 2016, 533, 493–498. [Google Scholar] [CrossRef] [Green Version]
- Cai, X.; Chiu, Y.H.; Chen, Z.J. The cGAS-cGAMP-STING pathway of cytosolic DNA sensing and signaling. Mol. Cell 2014, 54, 289–296. [Google Scholar] [CrossRef] [Green Version]
- Kato, K.; Omura, H.; Ishitani, R.; Nureki, O. Cyclic GMP-AMP as an Endogenous Second Messenger in Innate Immune Signaling by Cytosolic DNA. Annu. Rev. Biochem. 2017, 86, 541–566. [Google Scholar] [CrossRef]
- Woo, S.R.; Fuertes, M.B.; Corrales, L.; Spranger, S.; Furdyna, M.J.; Leung, M.Y.; Duggan, R.; Wang, Y.; Barber, G.N.; Fitzgerald, K.A.; et al. STING-dependent cytosolic DNA sensing mediates innate immune recognition of immunogenic tumors. Immunity 2014, 41, 830–842. [Google Scholar] [CrossRef] [PubMed] [Green Version]
- Marcus, A.; Mao, A.J.; Lensink-Vasan, M.; Wang, L.; Vance, R.E.; Raulet, D.H. Tumor-Derived cGAMP Triggers a STING-Mediated Interferon Response in Non-tumor Cells to Activate the NK Cell Response. Immunity 2018, 49, 754–763.e4. [Google Scholar] [CrossRef] [PubMed] [Green Version]
- Ghaffari, A.; Peterson, N.; Khalaj, K.; Vitkin, N.; Robinson, A.; Francis, J.A.; Koti, M. STING agonist therapy in combination with PD-1 immune checkpoint blockade enhances response to carboplatin chemotherapy in high-grade serous ovarian cancer. Br. J. Cancer 2018, 119, 440–449. [Google Scholar] [CrossRef] [PubMed]
- Li, T.; Cheng, H.; Yuan, H.; Xu, Q.; Shu, C.; Zhang, Y.; Xu, P.; Tan, J.; Rui, Y.; Li, P.; et al. Antitumor Activity of cGAMP via Stimulation of cGAS-cGAMP-STING-IRF3 Mediated Innate Immune Response. Sci. Rep. 2016, 6, 19049. [Google Scholar] [CrossRef] [Green Version]
- Zhao, L.; Ching, L.M.; Kestell, P.; Baguley, B.C. The antitumour activity of 5,6-dimethylxanthenone-4-acetic acid (DMXAA) in TNF receptor-1 knockout mice. Br. J. Cancer 2002, 87, 465–470. [Google Scholar] [CrossRef] [Green Version]
- Nakamura, T.; Miyabe, H.; Hyodo, M.; Sato, Y.; Hayakawa, Y.; Harashima, H. Liposomes loaded with a STING pathway ligand, cyclic di-GMP, enhance cancer immunotherapy against metastatic melanoma. J. Control. Release 2015, 216, 149–157. [Google Scholar] [CrossRef] [Green Version]
- Hong, C.; Tijhuis, A.E.; Foijer, F. The cGAS Paradox: Contrasting Roles for cGAS-STING Pathway in Chromosomal Instability. Cells 2019, 8, 1228. [Google Scholar] [CrossRef] [Green Version]
- Bose, D. cGAS/STING Pathway in Cancer: Jekyll and Hyde Story of Cancer Immune Response. Int J. Mol. Sci. 2017, 18, 2456. [Google Scholar] [CrossRef] [Green Version]
- Xia, T.; Konno, H.; Ahn, J.; Barber, G.N. Deregulation of STING Signaling in Colorectal Carcinoma Constrains DNA Damage Responses and Correlates With Tumorigenesis. Cell Rep. 2016, 14, 282–297. [Google Scholar] [CrossRef] [PubMed] [Green Version]
- Xia, T.; Konno, H.; Barber, G.N. Recurrent Loss of STING Signaling in Melanoma Correlates with Susceptibility to Viral Oncolysis. Cancer Res. 2016, 76, 6747–6759. [Google Scholar] [CrossRef] [PubMed] [Green Version]
- De Queiroz, N.; Xia, T.; Konno, H.; Barber, G.N. Ovarian Cancer Cells Commonly Exhibit Defective STING Signaling Which Affects Sensitivity to Viral Oncolysis. Mol. Cancer Res. 2019, 17, 974–986. [Google Scholar] [CrossRef]
- Kitajima, S.; Ivanova, E.; Guo, S.; Yoshida, R.; Campisi, M.; Sundararaman, S.K.; Tange, S.; Mitsuishi, Y.; Thai, T.C.; Masuda, S.; et al. Suppression of STING Associated with LKB1 Loss in KRAS-Driven Lung Cancer. Cancer Discov. 2019, 9, 34–45. [Google Scholar] [CrossRef] [PubMed] [Green Version]
- Ahn, J.; Xia, T.; Konno, H.; Konno, K.; Ruiz, P.; Barber, G.N. Inflammation-driven carcinogenesis is mediated through STING. Nat. Commun. 2014, 5, 1–9. [Google Scholar] [CrossRef] [PubMed] [Green Version]
- Lemos, H.; Mohamed, E.; Huang, L.; Ou, R.; Pacholczyk, G.; Arbab, A.S.; Munn, D.; Mellor, A.L. STING Promotes the Growth of Tumors Characterized by Low Antigenicity via IDO Activation. Cancer Res. 2016, 76, 2076–2081. [Google Scholar] [CrossRef] [Green Version]
- Chen, J.; Lee, H.J.; Wu, X.; Huo, L.; Kim, S.J.; Xu, L.; Wang, Y.; He, J.; Bollu, L.R.; Gao, G.; et al. Gain of glucose-independent growth upon metastasis of breast cancer cells to the brain. Cancer Res. 2015, 75, 554–565. [Google Scholar] [CrossRef] [Green Version]
- Neman, J.; Termini, J.; Wilczynski, S.; Vaidehi, N.; Choy, C.; Kowolik, C.M.; Li, H.; Hambrecht, A.C.; Roberts, E.; Jandial, R. Human breast cancer metastases to the brain display GABAergic properties in the neural niche. Proc. Natl. Acad. Sci. USA 2014, 111, 984–989. [Google Scholar] [CrossRef] [Green Version]
- Mashimo, T.; Pichumani, K.; Vemireddy, V.; Hatanpaa, K.J.; Singh, D.K.; Sirasanagandla, S.; Nannepaga, S.; Piccirillo, S.G.; Kovacs, Z.; Foong, C.; et al. Acetate is a bioenergetic substrate for human glioblastoma and brain metastases. Cell 2014, 159, 1603–1614. [Google Scholar] [CrossRef] [PubMed] [Green Version]
- Sato, H.; Shimizu, A.; Okawa, T.; Uzu, M.; Goto, M.; Hisaka, A. Metabolome Shift in Both Metastatic Breast Cancer Cells and Astrocytes Which May Contribute to the Tumor Microenvironment. Int. J. Mol. Sci. 2021, 22, 7430. [Google Scholar] [CrossRef] [PubMed]
- Akita, H.; Ishiba, R.; Hatakeyama, H.; Tanaka, H.; Sato, Y.; Tange, K.; Arai, M.; Kubo, K.; Harashima, H. A neutral envelope-type nanoparticle containing pH-responsive and SS-cleavable lipid-like material as a carrier for plasmid DNA. Adv. Healthc. Mater. 2013, 2, 1120–1125. [Google Scholar] [CrossRef] [PubMed]
- Hyodo, M.; Sakurai, Y.; Akita, H.; Harashima, H. “Programmed packaging” for gene delivery. J. Control. Release 2014, 193, 316–323. [Google Scholar] [CrossRef] [PubMed] [Green Version]
- Tanaka, H.; Sato, Y.; Harashima, H.; Akita, H. Cellular environment-responsive nanomaterials for use in gene and siRNA delivery: Molecular design for biomembrane destabilization and intracellular collapse. Expert Opin. Drug Deliv. 2016, 13, 1015–1027. [Google Scholar] [CrossRef] [PubMed]
- Akita, H. Development of an SS-Cleavable pH-Activated Lipid-Like Material (ssPalm) as a Nucleic Acid Delivery Device. Biol. Pharm. Bull. 2020, 43, 1617–1625. [Google Scholar] [CrossRef]
- Tanaka, H.; Takahashi, T.; Konishi, M.; Takata, N.; Gomi, M.; Shirane, D.; Miyama, R.; Hagiwara, S.; Yamasaki, Y.; Sakurai, Y.; et al. Self-Degradable Lipid-Like Materials Based on “Hydrolysis accelerated by the intra-Particle Enrichment of Reactant (HyPER)” for Messenger RNA Delivery. Adv. Funct. Mater. 2020, 30, 1910575. [Google Scholar] [CrossRef]
- Tanaka, H.; Sakurai, Y.; Anindita, J.; Akita, H. Development of lipid-like materials for RNA delivery based on intracellular environment-responsive membrane destabilization and spontaneous collapse. Adv. Drug Deliv. Rev. 2020, 154–155, 210–226. [Google Scholar] [CrossRef]
- Pépin, G.; Gantier, M.P. Assessing the cGAS-cGAMP-STING Activity of Cancer Cells. Methods Mol. Biol. 2018, 1725, 257–266. [Google Scholar]
- Koepsell, H. Glucose transporters in brain in health and disease. Pflugers Arch. 2020, 472, 1299–1343. [Google Scholar] [CrossRef]
- Iwabuchi, S.; Kawahara, K. Inducible astrocytic glucose transporter-3 contributes to the enhanced storage of intracellular glycogen during reperfusion after ischemia. Neurochem. Int. 2011, 59, 319–325. [Google Scholar] [CrossRef] [Green Version]
- Zhang, W.; Huang, H.; Cai, H.; Tan, W.S. Enhanced metabolic activities for ATP production and elevated metabolic flux via pentose phosphate pathway contribute for better CIK cells expansion. Cell Prolif. 2019, 52, e12594. [Google Scholar] [CrossRef] [PubMed]
- Sofroniew, M.V.; Vinters, H.V. Astrocytes: Biology and pathology. Acta Neuropathol. 2010, 119, 7–35. [Google Scholar] [CrossRef] [PubMed] [Green Version]
- Shank, R.P.; Bennett, G.S.; Freytag, S.O.; Campbell, G.L. Pyruvate carboxylase: An astrocyte-specific enzyme implicated in the replenishment of amino acid neurotransmitter pools. Brain Res. 1985, 329, 364–367. [Google Scholar] [CrossRef]
- Martinez-Hernandez, A.; Bell, K.P.; Norenberg, M.D. Glutamine synthetase: Glial localization in brain. Science 1977, 195, 1356–1358. [Google Scholar] [CrossRef] [PubMed]
- Eid, T.; Tu, N.; Lee, T.S.; Lai, J.C. Regulation of astrocyte glutamine synthetase in epilepsy. Neurochem. Int. 2013, 63, 670–681. [Google Scholar] [CrossRef] [Green Version]
- Eid, T.; Thomas, M.J.; Spencer, D.D.; Rundén-Pran, E.; Lai, J.C.; Malthankar, G.V.; Kim, J.H.; Danbolt, N.C.; Ottersen, O.P.; De Lanerolle, N.C. Loss of glutamine synthetase in the human epileptogenic hippocampus: Possible mechanism for raised extracellular glutamate in mesial temporal lobe epilepsy. Lancet 2004, 363, 28–37. [Google Scholar] [CrossRef]
- Eid, T.; Williamson, A.; Lee, T.S.; Petroff, O.A.; De Lanerolle, N.C. Glutamate and astrocytes—Key players in human mesial temporal lobe epilepsy? Epilepsia 2008, 49 (Suppl. 2), 42–52. [Google Scholar] [CrossRef]
- Tardito, S.; Oudin, A.; Ahmed, S.U.; Fack, F.; Keunen, O.; Zheng, L.; Miletic, H.; Sakariassen, P.Ø.; Weinstock, A.; Wagner, A.; et al. Glutamine synthetase activity fuels nucleotide biosynthesis and supports growth of glutamine-restricted glioblastoma. Nat. Cell Biol. 2015, 17, 1556–1568. [Google Scholar] [CrossRef] [Green Version]
- Dong, X.X.; Wang, Y.; Qin, Z.H. Molecular mechanisms of excitotoxicity and their relevance to pathogenesis of neurodegenerative diseases. Acta Pharmacol. Sin. 2009, 30, 379–387. [Google Scholar] [CrossRef] [Green Version]
- Persson, L.; Hillered, L. Chemical monitoring of neurosurgical intensive care patients using intracerebral microdialysis. J. Neurosurg. 1992, 76, 72–80. [Google Scholar] [CrossRef]
- Mahmoud, S.; Gharagozloo, M.; Simard, C.; Gris, D. Astrocytes Maintain Glutamate Homeostasis in the CNS by Controlling the Balance between Glutamate Uptake and Release. Cells 2019, 8, 184. [Google Scholar] [CrossRef] [Green Version]
- Hamilton, N.B.; Attwell, D. Do astrocytes really exocytose neurotransmitters? Nat. Rev. Neurosci. 2010, 11, 227–238. [Google Scholar] [CrossRef]
- Bezzi, P.; Carmignoto, G.; Pasti, L.; Vesce, S.; Rossi, D.; Rizzini, B.L.; Pozzan, T.; Volterra, A. Prostaglandins stimulate calcium-dependent glutamate release in astrocytes. Nature 1998, 391, 281–285. [Google Scholar] [CrossRef]
- Bezzi, P.; Domercq, M.; Brambilla, L.; Galli, R.; Schols, D.; De Clercq, E.; Vescovi, A.; Bagetta, G.; Kollias, G.; Meldolesi, J.; et al. CXCR4-activated astrocyte glutamate release via TNFalpha: Amplification by microglia triggers neurotoxicity. Nat. Neurosci. 2001, 4, 702–710. [Google Scholar] [CrossRef]
- Venkatesh, H.S.; Morishita, W.; Geraghty, A.C.; Silverbush, D.; Gillespie, S.M.; Arzt, M.; Tam, L.T.; Espenel, C.; Ponnuswami, A.; Ni, L.; et al. Electrical and synaptic integration of glioma into neural circuits. Nature 2019, 573, 539–545. [Google Scholar] [CrossRef]
- Venkataramani, V.; Tanev, D.I.; Strahle, C.; Studier-Fischer, A.; Fankhauser, L.; Kessler, T.; Körber, C.; Kardorff, M.; Ratliff, M.; Xie, R.; et al. Glutamatergic synaptic input to glioma cells drives brain tumour progression. Nature 2019, 573, 532–538. [Google Scholar] [CrossRef] [PubMed]
- Strong, A.D.; Indart, M.C.; Hill, N.R.; Daniels, R.L. GL261 glioma tumor cells respond to ATP with an intracellular calcium rise and glutamate release. Mol. Cell Biochem. 2018, 446, 53–62. [Google Scholar] [CrossRef] [PubMed]
- Zeng, Q.; Michael, I.P.; Zhang, P.; Saghafinia, S.; Knott, G.; Jiao, W.; Mccabe, B.D.; Galván, J.A.; Robinson, H.P.C.; Zlobec, I.; et al. Synaptic proximity enables NMDAR signalling to promote brain metastasis. Nature 2019, 573, 526–531. [Google Scholar] [CrossRef] [PubMed]
- Ran, L.; Hong, T.; Xiao, X.; Xie, L.; Zhou, J.; Wen, G. GABARAPL1 acts as a potential marker and promotes tumor proliferation and metastasis in triple negative breast cancer. Oncotarget 2017, 8, 74519–74526. [Google Scholar] [CrossRef] [PubMed] [Green Version]
- Wang, S.; Shu, J.Z.; Cai, Y.; Bao, Z.; Liang, Q.M. Establishment and characterization of MTDH knockdown by artificial MicroRNA interference—Functions as a potential tumor suppressor in breast cancer. Asian Pac. J. Cancer Prev. 2012, 13, 2813–2818. [Google Scholar] [CrossRef] [Green Version]
- Ye, X.; Zhang, Y.; Xu, Q.; Zheng, H.; Wu, X.; Qiu, J.; Zhang, Z.; Wang, W.; Shao, Y.; Xing, H.Q. HIV-1 Tat inhibits EAAT-2 through AEG-1 upregulation in models of HIV-associated neurocognitive disorder. Oncotarget 2017, 8, 39922–39934. [Google Scholar] [CrossRef] [Green Version]
- Zhou, Y.; Fei, M.; Zhang, G.; Liang, W.C.; Lin, W.; Wu, Y.; Piskol, R.; Ridgway, J.; Mcnamara, E.; Huang, H.; et al. Blockade of the Phagocytic Receptor MerTK on Tumor-Associated Macrophages Enhances P2X7R-Dependent STING Activation by Tumor-Derived cGAMP. Immunity 2020, 52, 357–373.e9. [Google Scholar] [CrossRef]
- Luteijn, R.D.; Zaver, S.A.; Gowen, B.G.; Wyman, S.K.; Garelis, N.E.; Onia, L.; Mcwhirter, S.M.; Katibah, G.E.; Corn, J.E.; Woodward, J.J.; et al. SLC19A1 transports immunoreactive cyclic dinucleotides. Nature 2019, 573, 434–438. [Google Scholar] [CrossRef]
- Shirane, D.; Tanaka, H.; Nakai, Y.; Yoshioka, H.; Akita, H. Development of an Alcohol Dilution-Lyophilization Method for Preparing Lipid Nanoparticles Containing Encapsulated siRNA. Biol. Pharm. Bull. 2018, 41, 1291–1294. [Google Scholar] [CrossRef] [Green Version]
- Kajitani, N.; Hisaoka-Nakashima, K.; Morioka, N.; Okada-Tsuchioka, M.; Kaneko, M.; Kasai, M.; Shibasaki, C.; Nakata, Y.; Takebayashi, M. Antidepressant acts on astrocytes leading to an increase in the expression of neurotrophic/growth factors: Differential regulation of FGF-2 by noradrenaline. PLoS ONE 2012, 7, e51197. [Google Scholar] [CrossRef] [PubMed] [Green Version]
- Sato, H.; Uzu, M.; Kashiba, T.; Fujiwara, T.; Hatakeyama, H.; Ueno, K.; Hisaka, A. Trichostatin A modulates cellular metabolism in renal cell carcinoma to enhance sunitinib sensitivity. Eur. J. Pharmacol. 2019, 847, 143–157. [Google Scholar] [CrossRef] [PubMed]
- Hatakeyama, H.; Fujiwara, T.; Sato, H.; Terui, A.; Hisaka, A. Investigation of Metabolomic Changes in Sunitinib-Resistant Human Renal Carcinoma 786-O Cells by Capillary Electrophoresis-Time of Flight Mass Spectrometry. Biol. Pharm. Bull. 2018, 41, 619–627. [Google Scholar] [CrossRef] [PubMed] [Green Version]


| Target Gene | Product Size | Direction | Sequences |
|---|---|---|---|
| Rat-Actb1 (beta-actin) | 104 bp | Sense | 5′-CTGACAGGATGCAGAAGGAGA-3′ |
| Antisense | 5′-AGAGCCACCAATCCACACA-3′ | ||
| Rat-Ifna1 | 98 bp | Sense | 5′-GGTGGTGGTGAGCTACTGGT-3′ |
| Antisense | 5′-TTTGTGCCAGGAGTGTGAAG-3′ | ||
| Rat-Ifnb1 | 89 bp | Sense | 5′-TGCCCTCTCCATCGACTACA-3′ |
| Antisense | 5′-TTCCATTCAGCTGCCTCAGG-3′ | ||
| Rat-Tnf | 96 bp | Sense | 5′-ATGTGGAACTGGCAGAGGAG-3′ |
| Antisense | 5′-CGAGCAGGAATGAGAAGAGG-3′ |
Publisher’s Note: MDPI stays neutral with regard to jurisdictional claims in published maps and institutional affiliations. |
© 2021 by the authors. Licensee MDPI, Basel, Switzerland. This article is an open access article distributed under the terms and conditions of the Creative Commons Attribution (CC BY) license (https://creativecommons.org/licenses/by/4.0/).
Share and Cite
Okawa, T.; Hara, K.; Goto, M.; Kikuchi, M.; Kogane, M.; Hatakeyama, H.; Tanaka, H.; Shirane, D.; Akita, H.; Hisaka, A.; et al. Effects on Metabolism in Astrocytes Caused by cGAMP, Which Imitates the Initial Stage of Brain Metastasis. Int. J. Mol. Sci. 2021, 22, 9028. https://doi.org/10.3390/ijms22169028
Okawa T, Hara K, Goto M, Kikuchi M, Kogane M, Hatakeyama H, Tanaka H, Shirane D, Akita H, Hisaka A, et al. Effects on Metabolism in Astrocytes Caused by cGAMP, Which Imitates the Initial Stage of Brain Metastasis. International Journal of Molecular Sciences. 2021; 22(16):9028. https://doi.org/10.3390/ijms22169028
Chicago/Turabian StyleOkawa, Toya, Kurumi Hara, Momoko Goto, Moe Kikuchi, Masataka Kogane, Hiroto Hatakeyama, Hiroki Tanaka, Daiki Shirane, Hidetaka Akita, Akihiro Hisaka, and et al. 2021. "Effects on Metabolism in Astrocytes Caused by cGAMP, Which Imitates the Initial Stage of Brain Metastasis" International Journal of Molecular Sciences 22, no. 16: 9028. https://doi.org/10.3390/ijms22169028
APA StyleOkawa, T., Hara, K., Goto, M., Kikuchi, M., Kogane, M., Hatakeyama, H., Tanaka, H., Shirane, D., Akita, H., Hisaka, A., & Sato, H. (2021). Effects on Metabolism in Astrocytes Caused by cGAMP, Which Imitates the Initial Stage of Brain Metastasis. International Journal of Molecular Sciences, 22(16), 9028. https://doi.org/10.3390/ijms22169028