Abstract
Whey-protein-isolate-based composite hydrogels with encapsulated black carrot (Daucus carota) extract were prepared by heat-induced gelation. The hydrogels were blended with gum tragacanth, pectin and xanthan gum polysaccharides for modulating their properties. 1H spin-lattice relaxation experiments were performed in a broad frequency range, from 4 kHz to 30 MHz, to obtain insight into the influence of the different polysaccharides and of the presence of black carrot on dynamical properties of water molecules in the hydrogel network. The 1H spin-lattice relaxation data were decomposed into relaxation contributions associated with confined and free water fractions. The population of the confined water fraction and the value of the translation diffusion coefficient of water molecules in the vicinity of the macromolecular network were quantitatively determined on the basis of the relaxation data. Moreover, it was demonstrated that the translation diffusion is highly anisotropic (two-dimensional, 2D).
1. Introduction
Hydrogels are polymeric networks capable of absorbing a high amount of water [1]. The swelling properties of hydrogels are related to chemical or physical crosslinking of water-soluble polymers [2,3,4]. Physical cross-linking occurs as a result of hydrogen bonds and hydrophobic forces that can be affected by factors such as temperature or pH—consequently, physical cross-linking is referred to as reversible [2,4]. In case of covalent bonding, the cross-linking becomes stable and the materials are referred to as chemical hydrogels [1,4,5].
Although hydrogels can include both synthetic and natural biodegradable polymers [1], in food industry there is a growing interest in the production and application of natural biodegradable hydrogels rather than synthetic ones [6]. Polysaccharides, e.g., alginate [7], pectin [8] and chitosan [9], and proteins, e.g., whey [10], soy [11] and pea proteins [12], have been widely used in food-grade hydrogel production. Moreover, two or more different polymers can be blended to obtain hydrogels with distinct characteristics [13].
Blended protein-based composite hydrogels are used for active agent encapsulation and controlled release purposes [13]. Protein-based hydrogels are typically produced by heating protein solutions above the denaturation temperature. The heating facilitates changes in the protein structure (unfolding followed by aggregation) leading to cross-linking. The hydrogels protect encapsulated bioactive agents, ensuring their delivery with minimum damage to a specific location with a desired rate [14]. Encapsulation of nutraceuticals including polyphenol-containing materials in protein-based hydrogels has recently gained interest [15]. An example of materials rich in plant polyphenols is black carrot concentrate (BC); that is, the juice of black carrot plant (Daucus carota). BC has high phenolic content and antioxidant capacity [16]. However, degradation of these compounds during controlled release is inevitable, since they are susceptible to changes in environmental conditions [17,18]. In order to prevent the loss of bioactivity and bioavailability of such compounds during processing, digestion or any other food application, BC can be encapsulated in hydrogels [10].
The mechanism and time-scale of the dynamics of water present in hydrogels, being dependent on interactions of water molecules with the surrounding network, affect the physicochemical properties of the hydrogels [19]. These dynamical properties of water can be probed by NMR relaxometry that provides information not available by means of conventional methods such as mass spectroscopy [20], Fourier transform infrared spectroscopy [21] or water activity measurements [22].
The amount and dynamics of water in a food product affect the overall quality and acceptability of that product [23]. NMR relaxometry has been applied to describe water dynamics in complex food systems [24], biopolymer suspensions and hydrogels [25]. Water is expected to form pools of different dynamical properties within the polymer matrices constituting the hydrogel network [26]. A fraction of water molecules interacts with the polymer network and, consequently, the motion of the molecules is affected by these interactions. This effect is reflected by changes in the 1H spin-lattice relaxation compared to bulk water [27].
Fast Field Cycling (FFC)-NMR relaxometry enables performing relaxation experiments over a wide range of resonance frequencies [28]. Relaxation processes monitored at low frequencies provide information about the slow molecule dynamics that cannot be probed by classical NMR relaxation measurements performed at a single, high frequency [29]. FFC-NMR relaxometry is a more recent technique with respect to classical NMR experiments. Therefore, there is a limited number of studies in the food science area which facilitated the FFC-NMR technique. Rachocki et al. (2012) applied this method to dry cress seeds [30]. Spin-lattice relaxation measurements by means of FFC relaxometry were also conducted for rape oil [31]. Steele et al. (2016) monitored the aging of banana and spoilage of milk during storage by FFC-NMR relaxometry [32]. Phenolic analysis of the fresh and withered blueberries [33], characterisation of dry cured ham [34] and differentiation of pistachio oils [35] are also among the rare studies that used FFC techniques for food science applications. One should also mention the recent works [36,37,38] devoted to cheese, eggs and gelatin products, respectively, as they include a thorough, quantitative analysis of NMR relaxometry data, showing the potential of this method for food science.
The broad frequency range (4 kHz–40 MHz) of the FFC-NMR method allows a thorough analysis of the relaxation features, making it possible to link macroscopic behavior of the analysed substances with their dynamical properties at the molecular level [39,40,41]. A prominent area of applications of FFC-NMR relaxometry is colloidal dispersions and hydrogels [42]. The type of the used polymers and their concentration, the presence of ions or additional stabilisers and encapsulation of active agents are among the factors that influence water dynamics in hydrogel systems [43].
The main objective of this study is to observe the effects of different hydrogel formulations on the dynamics of water molecules enclosed into those systems. For this purpose, whey-protein-isolate (WPI)-based hydrogels were produced by blending polysaccharides including gum tragacanth (GT), pectin (PC) and xanthan gum (XG). BC was encapsulated in these protein–polysaccharide hydrogels. FFC-NMR relaxometry was applied to enquire into the influence of the hydrogel composition and the presence of BC on water mobility.
2. Results
2.1. Theoretical Model of 1H Spin-Lattice Relaxation
In macromolecular systems (food products being an example of them) one can distinguish two water molecule fractions, often defined as the free-water fraction and confined-water fraction. The two pools of water molecules differ in terms of their dynamical properties: the dynamics of water molecules representing the free-water fraction is similar to the dynamics of water in bulk, while the motion of the molecules of the confined-water pool is slower and often restricted (anisotropic) by the macromolecular network forming the confinement. Consequently, the overall 1H spin-lattice relaxation rate, ( displays 1H resonance frequency), is given as a sum of two contributions [44]:
The relaxation contribution associated with the free-water fraction, , could be represented by a frequency-independent term, , as a result of the fast motion of water molecules belonging to that fraction. 1H spin-lattice relaxation is predominantly caused by magnetic dipole–dipole interactions that can be of inter-molecular and intra-molecular origin. Thus, the relaxation contribution, , includes relaxation terms and :
The inter-molecular dipole–dipole interactions are modulated in time due to translation diffusion of the water molecules. The form of the relaxation contribution depends on the dimensionality of the translation motion. In bulk water, molecules can freely (isotropically) move in all directions, so the diffusion process is three-dimensional (3D). An indication of 3D character of the translation dynamics is a linear dependence of the relaxation rate, , on the square root of the resonance frequency, , observed at low frequencies [45]. Isotropic (3D) translation diffusion can also be observed in confinement, but then the linear dependence can be, to some extent, masked by other relaxation contributions ( in this case). In confinement, one can, however, also expect that the translation motion of molecules belonging to the confined-water fraction is of rather two-dimensional (2D) character—the molecules move on the surface (in the vicinity) of the macromolecular network. An indication of the 2D mechanism of the translation diffusion is a linear dependence of on in the low frequency range [46]. Again, this effect can be masked by other contributions, so one might not be able to see it directly, but for the relaxation data obtained for the hydrogel system one can identify a frequency range in which the relaxation rate, , depends linearly on . For 2D translation diffusion, the relaxation contribution can be expressed as:
where is referred to as an inter-molecular dipolar relaxation constant, while the correlation time is defined as: and denotes the translation diffusion coefficient of water molecules constituting the confined-water fraction. Additionally, is the diameter of the water molecule. In fact, the model includes a parameter referred to as “the distance of closest approach”. This parameter is well-defined for spherical molecules with 1H nuclei placed in their center—then the minimum 1H-1H distance is equal to the molecular diameter. For “real” molecules, this approximation is also realistic. In the low frequency range, in which the condition < 1 is fulfilled, Equation (3) can be approximated as:
Equation (4) explains the statement above about a linear dependence of on for 2D translation diffusion. The relaxation constant is proportional to the number of water molecules per unit volume in the confined-water fraction. The relaxation contribution is associated with rotational dynamics and it can be described as [47]:
The intra-molecular dipolar relaxation constant, , representing the water molecules bound to macromolecules, is proportional to the product Pq. Here, q and P stand for the coordination number and the mole fraction of water protons in the bound position, respectively [48]. Water molecules form a kind of hydration shell (similarly to, for instance, protein solutions). This effect is likely related to hydrogen bounds involving OH groups of the polysaccharides. The rotational correlation time of a macromolecule having water molecules in bound position, , determines the correlation time . Then, the exchange lifetime of water molecules in the bound position can be denoted as : .
2.2. Relaxation Data
The hydrogel formulations are summarised in Table 1. In Figure 1, 1H spin-lattice relaxation data for all systems are collected for comparison. The data have been reproduced in terms of the theoretical model of 1H spin-lattice relaxation presented in Section 2.1. Below, we compare and discuss the relaxation data step-by-step, beginning with the control hydrogel (C) systems.

Table 1.
Formulations of hydrogels in the presence and absence of BC. (“C”, “PC”, “GT” and “XG” denote control, pectin, gum tragacanth and xanthan gum, respectively).
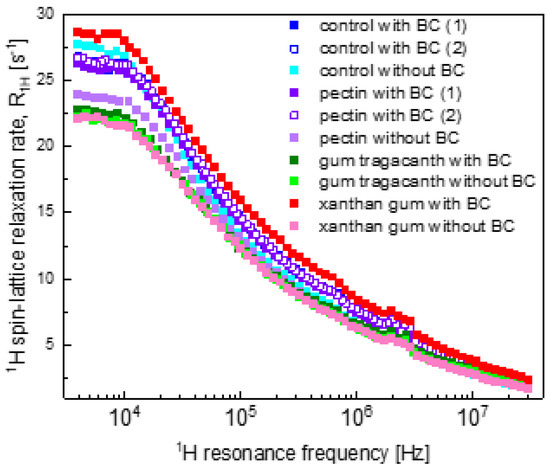
Figure 1.
1H spin-lattice relaxation data for all hydrogel systems. The largest uncertainty of the values is 5.6%; for the majority of the relaxation rates the uncertainty is of the order of 3%.
In Figure 1, one sees two data sets for the control samples containing BC (referred to as “control with BC(1) and BC(2)”) and the pectin samples containing BC (referred to as “pectin with BC(1) and BC(2)”). The data were collected for two samples of the same formulation to show reproducibility of the results.
Figure 2 shows a 1H spin-lattice relaxation curve for the control hydrogels without BC and with BC. As expected, the parameters for the control systems do not differ much (Table 2). The translation diffusion coefficients are of the order of 1 × 10⁻¹¹ m2/s, which makes the translation diffusion by about 500 times slower compared to water in bulk. The correlation time is of the order of 2 × 10⁻⁶ s. The similar values of the dipolar relaxation constant indicate that the mole fractions of water molecules bound to the macromolecular network are very similar in both cases, while the slightly different values of indicate that the number of water molecules per unit volume in the confined-water fraction is somewhat different.
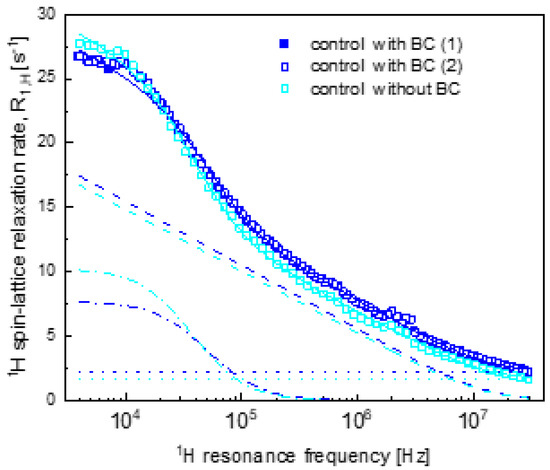
Figure 2.
1H spin-lattice relaxation rates for control hydrogels (control) with BC and without BC. Solid lines—corresponding fits ( for the control samples decomposed into —dashed lines, —dashed–dotted lines and —dotted lines.
Table 2.
Parameters obtained from the analysis of 1H spin-lattice relaxation data of the hydrogel samples. For the control sample with BC, only one set of parameters is given as the data for BC(1) and BC(2) overlap within the experimental error.
The results of the analysis of the relaxation data for PC hydrogels with and without BC (the overall fit decomposed into the individual contributions) are shown in Figure 3. The relaxation data for PC with BC hydrogels are in good agreement with each other (the sample preparation and the relaxation measurements are reproducible) and they are very close to the relaxation data for the control system with BC. Consequently, the obtained parameters (included in Table 2) are very similar to those for the control system—the corresponding fits are shown in Figure 3. At the same time, the relaxation data for PC without BC hydrogel considerably differ from the case when BC is present and, consequently, from the relaxation data for the control hydrogel system without BC. The results of the analysis of the relaxation data for PC without BC hydrogel (the overall fit decomposed into the individual contributions) are also shown in Figure 3.
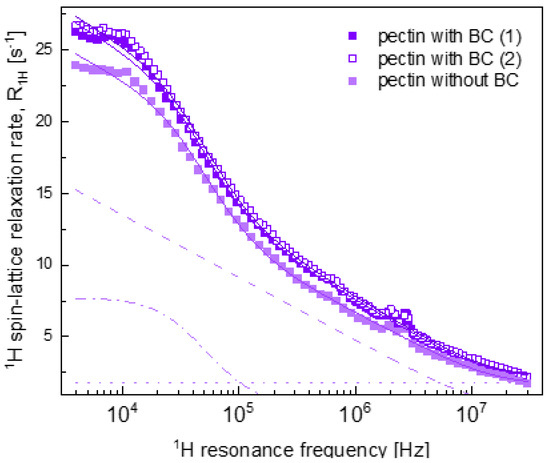
Figure 3.
1H spin-lattice relaxation data for pectin hydrogels with and without BC. Solid and double solid violet lines—Figure 1. of the data for pectin with BC (1) and (2) data sets, respectively, solid light violet line—fit ( of the data for pectin without BC decomposed into —dashed line, —dashed–dotted line and —dotted line.
Figure 4 shows the analysis for the GT hydrogels with and without BC—the relaxation data for these systems are very similar.
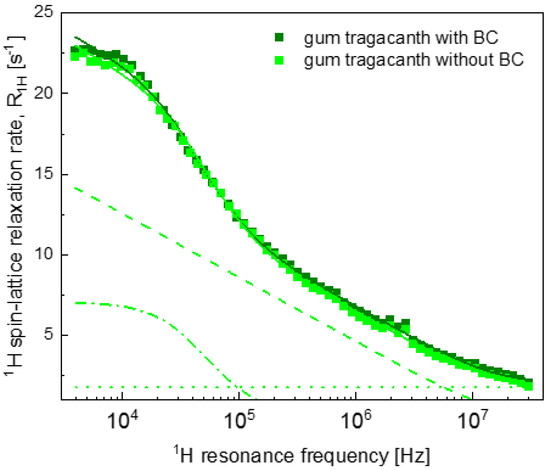
Figure 4.
1H spin-lattice relaxation data for gum tragacanth hydrogels with and without BC. Solid lines—fits (of Table 1. dashed line, —dashed–dotted line and —dotted line.
Figure 5 displays the overall relaxation data for the XG hydrogel systems. The XG hydrogel without BC exhibits similar parameters to the GT systems (as expected from Figure 1). At the same time, the relaxation rates for the XG with BC hydrogels are considerably different from the data for the rest of the samples.
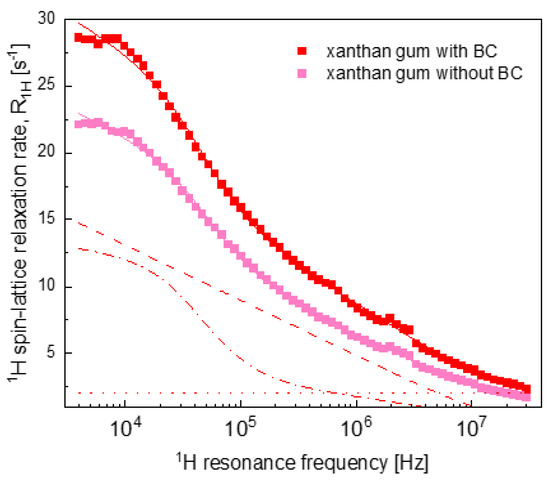
Figure 5.
1H spin-lattice relaxation data for xanthan gum hydrogels with and without BC. Solid lines—fits (of the data decomposed (for xanthan system with BC) into: —dashed line, —dashed–dotted line and —dotted line.
3. Discussion
Comparing the obtained parameters, one can observe that the difference in the relaxation properties between the PC without BC hydrogel system and the other systems (Figure 1) was caused by a lower value for the PC without BC system. This result indicates a smaller number of water molecules per unit volume in the confined-water fraction in the absence of BC. BC is a rich source of anthocyanins [49] that can form hydrogen bonds with the polymers constituting the hydrogel structure [50]. It seems that in the presence of BC, a larger fraction of the confined water molecules gained the freedom of translation motion. One should note that with the exception of the control system (Figure 2), the other systems (PC, GT and XG) without BC are characterised by a lower value of than for their counterparts with BC; for the control hydrogel system, the relationship is the opposite. Since the control hydrogels are solely composed of WPI, the lack of an additional polysaccharide that would contribute to the polymer–water interactions [51] likely decreases the effect of BC on the formation of the gel network.
The obtained parameters for GT hydrogel systems indicate that in the case of GT hydrogel, relatively small relaxation rates in the low frequency range (Figure 1) rather originate from faster translation diffusion of water molecules in the confined-water fraction than from lower values of the number of water molecules per unit volume in this fraction (although, as already pointed out, the value is lower in the absence of BC). Additionally, the number of water molecules in the bound position (reflected by the value) is somewhat smaller. GT is a physical mixture of bassorin and tragacanthin, water-swellable and water-soluble fractions, respectively [52]. The presence of a tragacanthin fraction imparts upon GT a liquid character. Tragacanthin includes sugar moieties, increasing the hydrophilic character of the polysaccharide. Consequently, one can suppose that the dynamical features of water, affected by interactions of water molecules with tragacanthin, make the effects of adding BC considerably less significant. It is likely that the faster translation movement is related to the texture of the GT hydrogels. Ozel et al. (2018) demonstrated that GT hydrogels had lower hardness values with respect to the control hydrogel systems [53].
The distinct relaxation features of XG with BC hydrogels (Figure 5) are reflected by the set of parameters for this system presented in Table 2. The dipolar relaxation constant for the XG with BC system was significantly larger than for the other systems, indicating a higher population of the sub-fraction of the confined-water pool that performs translation diffusion—this effect manifested itself by the high 1H spin-lattice relaxation rates for the XG system with BC at low frequencies. This different behaviour of XG with BC hydrogels may originate from the highly branched complex structure of XG molecules [54]. The molecular weight (Mw) of XG (2000 kDa) [55] is also higher than the Mw of the other polysaccharides, PC (100 kDa) [56] and GT (850 kDa) [57], used in the study. The branched side chains of XG molecules may have created hydrogen bonds with the anthocyanins of the BC, which resulted in better incorporation of BC into the gel network. As a result, the availability of translation diffusion paths for the water molecules may increase. It is worth mentioning that even at low concentrations (<1%), XG substantially increases the solution viscosity [58]. Moreover, BC was also reported to increase the viscosity of protein solutions. Ozel et al. (2018) stated that for the same set of hydrogels, only XG with BC hydrogel solutions exerted pseudoplastic behaviour whereas all other hydrogel solutions (C, PC and GT, all with BC) had Newtonian flow behaviour [53]. Such a behaviour was not observed for the XG without BC hydrogels and the viscosity increasing effect of BC was not present for these samples. This observation is in agreement with the results of the other polysaccharide blended hydrogels with no BC.
Besides the differences in the 1H spin-lattice relaxation rates of the samples, all the relaxation data show relaxation maxima (weakly pronounced) in the frequency range of 2–3 MHz (Figure 1). These relaxation maxima originate from the Quadrupole Relaxation Enhancement (QRE) effect, and the maxima are called quadrupole peaks [37,59]. They stem from 1H-14N dipole–dipole interactions and can be observed for systems undergoing relatively slow dynamics [37]. In fact, for 14N one can observe three quadrupole peaks, the first one at a frequency being a difference between the frequencies at which the other two are present [60]. Therefore, we suppose that the QRE effect somewhat affects the relaxation data at low frequencies. As it is difficult to exactly specify the 1H–14N relaxation contribution (in principle one could model this effect [37,61], but this would require involving several parameters that can hardly be verified), the QRE effect is likely the reason of some discrepancies between the fits and the experimental data at low frequencies.
Finally, one should point out the two-dimensional character of the translation motion of water in the hydrogel network, although the network itself is three-dimensional. This finding gives an important insight into the scenario of the translation movement of water molecules confined in food hydrogels.
4. Materials and Methods
4.1. Materials
Whey protein isolate (WPI) with 88.5% (w/w) protein content (Kavi Food Ltd. Co., Istanbul, Turkey), high methoxy citrus pectin (PC) (FMC SRL, San Colombano al Lambro, Italy) with an esterification degree around 64–68%, gum tragacanth (GT) from Astragalus gummifier Labillardiere having 40% bassorin and 60% tragacanthin composition (w/w) (Thew Arnott & Co. Ltd., Deeside, UK) and xanthan gum (XG) from Xanthomonas campestris (Smart Kimya Tic. ve Danismanlik Ltd. Sti., Izmir, Turkey) were the agents used for gelation and hydrogel production. Black carrot extract (BC) (Targid Agriculture Co. Inc., Icel, Turkey) was the bioactive agent encapsulated in the hydrogels. Sodium azide (Merck KgaA, Darmstadt, Germany) was included in the all-hydrogel formulations to prevent microbial activity.
4.2. Sample Preparation
Initially, 15% (w/w) WPI solutions were prepared and PC, GT or XG polysaccharides were added to these protein solutions so that the final polysaccharide concentration reached 0.5% (w/w). Polysaccharide-containing WPI hydrogels were denoted as PC, GT and XG hydrogels depending on the polysaccharide used in the formulation. Sole WPI-containing samples (C hydrogels) were also prepared with no additional polysaccharide. As a bioactive agent, 4% (w/w) BC was added to hydrogel-forming solutions. The same set of hydrogels was also prepared in the absence of BC. Water was added to these BC-free samples to compensate for the amount of BC in these formulations.
Polysaccharide solutions were mixed with BC and stirred at 15,000 rpm for 2 min by an Ultra Turrax T-18 (IKA Corp., Staufen, Germany). WPI–sodium azide solutions were also stirred in the same way, separately. Then, protein and polysaccharide–BC solutions were mixed in a flask and stirred overnight at room temperature for the complete hydration of the polymers. BC-containing solutions had lower pH values (5.7–5.9) than the ones without BC (6.8–7.0) at room temperature. The next day, hydrogel solutions were placed into cylindrical gelling tubes (1.5 cm outer diameter, 1.3 cm inner diameter, 5 cm length) and put into a water bath (Wisd, Wertheim, Germany) operating at 90 °C for 30 min to achieve gelation. After gelling in the water bath, cylindrical tubes were immersed in ice for 15 min and then hydrogels were extracted from the tubes.
4.3. Fast Field Cycling (FFC) NMR Relaxometry Measurements
Small cylindrical pieces from the hydrogels (2 cm length × 0.65 cm diameter) were cut and put into tubes that were used for the NMR relaxometry measurements. 1H spin-lattice relaxation rates of the hydrogel samples were measured with an FFC Spinmaster 2000 Relaxometer (Stelar, Mede, Italy) and the range of 1H resonance frequencies covered in the experiment was from 4 kHz to 30 MHz. During the measurements, a Eurotherm controller with an additional thermocouple temperature sensor inserted into the probe-head was used to control the temperature with the accuracy of 0.5 °C. The relaxation process turned out to be single-exponential. Examples of 1H magnetisation curves (1H magnetisation value versus time) accompanied with single-exponential fits are shown in the Supplementary Materials.
5. Conclusions
1H spin-lattice relaxation data for a series of composite WPI hydrogels collected in a wide frequency range (4 kHz to 30 MHz) were quantitatively analysed. On this basis, two-dimesional translation motion of water molecules in the hydrogel network was revealed, although the network itself is three-dimensional, and parameters characterising translation diffusion of water molecules ( and ) were obtained. It turned out that the translation diffusion of water molecules belonging to the confined-water fraction was slowed down in all hydrogels by about 500 times with respect to that of bulk water. The translation diffusion coefficients for all systems turned out to be in the order of 1 × 10⁻¹¹ m2/s, while the correlation time was in the order of 2 × 10⁻⁶ s. This long correlation time indicates that the water molecules undergo a tumbling (rotation) together with the macromolecules to which they are bound. The similar values of the intra-molecular dipolar relaxation constant imply that, whether BC is present or not, the product Pq is similar. One should here clearly distinguish between the and quantities—the first one carries information about the sub-fraction of water molecules within the confined-water fraction that are bound to the macromolecular structure, while the second one gives inside information into the population of the sub-fraction of the confined-water pool that performs translation diffusion. The similar parameters characterising water dynamics point towards generic features of different food hydrogels in terms of the water mobility. The motion of water molecules in the macromolecular network is an important factor determining the macroscopic properties of hydrogels, such as their viscosity, elasticity, hardness or ability to hold and release their cargo.
In this work, we provide insight into the dynamical properties of water dynamics in food hydrogels, exploiting the unique potential of NMR relaxometry. Thinking about exploiting this kind of information for tailoring properties of food hydrogels, the closest systems of interest are confectionary gels, candies and some hydrocolloid solutions.
Supplementary Materials
The following are available online at https://www.mdpi.com/article/10.3390/ijms22189672/s1.
Author Contributions
Conceptualisation, B.O., M.H.O.; Methodology, B.O., D.K., M.W.; Software, D.K., M.O.; Validation, D.K., M.O., B.O.; Formal Analysis, D.K., M.O.; Investigation, B.O., M.H.O.; Resources, D.K., M.H.O.; Data curation, B.O., M.W.; Writing—Original Draft Preparation, B.O., M.H.O.; Writing—Review and Editing, D.K., B.O.; Visualisation, D.K., M.O.; Supervision, D.K., M.H.O.; Project Administration, D.K., M.H.O.; Funding Acquisition, D.K., M.H.O. All authors have read and agreed to the published version of the manuscript.
Funding
The work has been supported by the National Science Centre, Poland, project number: 2015/19/B/NZ9/03348. From Turkey, the funding came from Middle East Technical University, Scientific Research Projects Coordination Unit, project # DKT-314-2018-3596.
Conflicts of Interest
The authors declare no conflict of interest.
References
- Argin, S.; Kofinas, P.; Lo, Y.M. The cell release kinetics and the swelling behavior of physically crosslinked xanthan-chitosan hydrogels in simulated gastrointestinal conditions. Food Hydrocoll. 2014, 40, 138–144. [Google Scholar] [CrossRef]
- Ćorković, I.; Pichler, A.; Šimunović, J.; Kopjar, M. Hydrogels: Characteristics and application as delivery systems of Phenolic and aroma compounds. Foods 2021, 10, 1252. [Google Scholar] [CrossRef] [PubMed]
- Gulrez, K.H.; Al-Assaf, S.; Phillips, G.O. Hydrogels: Methods of Preparation, Characterization and Applications. In Progress in Molecular and Environmental Bioengineering-From Analysis and Modeling to Technology Applications; Carpi, A., Ed.; IntechOpen Limited: London, UK, 2011; pp. 117–150. [Google Scholar]
- Garg, S.; Garg, A. Hydrogel: Classification, Properties, Preparation and Technical Features. Asian J. Biomater. Res. 2016, 2, 163–170. [Google Scholar]
- Ahmed, E.M. Hydrogel: Preparation, characterization, and applications: A review. J. Adv. Res. 2015, 6, 105–121. [Google Scholar] [CrossRef] [PubMed]
- Ullah, F.; Othman, M.B.H.; Javed, F.; Ahmad, Z.; Akil, H.M. Classification, processing and application of hydrogels: A review. Mater. Sci. Eng. C 2015, 57, 414–433. [Google Scholar] [CrossRef]
- Wichchukit, S.; Oztop, M.H.; McCarthy, M.J.; McCarthy, K.L. Whey protein/alginate beads as carriers of a bioactive component. Food Hydrocoll. 2013, 33, 66–73. [Google Scholar] [CrossRef]
- Si, L.; Zhao, Y.; Huang, J.; Li, S.; Zhai, X.; Li, G. Calcium pectinate gel bead intended for oral protein delivery: Preparation improvement and formulation development. Chem. Pharm. Bull. 2009, 57, 663–667. [Google Scholar] [CrossRef][Green Version]
- Lu, M.; Li, Z.; Liang, H.; Shi, M.; Zhao, L.; Li, W.; Chen, Y.; Wu, J.; Wang, S.; Chen, X.; et al. Controlled release of anthocyanins from oxidized konjac glucomannan microspheres stabilized by chitosan oligosaccharides. Food Hydrocoll. 2015, 51, 476–485. [Google Scholar] [CrossRef]
- Betz, M.; Kulozik, U. Whey protein gels for the entrapment of bioactive anthocyanins from bilberry extract. Int. Dairy J. 2011, 21, 703–710. [Google Scholar] [CrossRef]
- Maltais, A.; Remondetto, G.E.; Subirade, M. Soy protein cold-set hydrogels as controlled delivery devices for nutraceutical compounds. Food Hydrocoll. 2009, 23, 1647–1653. [Google Scholar] [CrossRef]
- Mession, J.L.; Blanchard, C.; Mint-Dah, F.V.; Lafarge, C.; Assifaoui, A.; Saurel, R. The effects of sodium alginate and calcium levels on pea proteins cold-set gelation. Food Hydrocoll. 2013, 31, 446–457. [Google Scholar] [CrossRef]
- Fathi, M.; Donsi, F.; McClements, D.J. Protein-Based Delivery Systems for the Nanoencapsulation of Food Ingredients. Compr. Rev. Food Sci. Food Saf. 2018, 17, 920–936. [Google Scholar] [CrossRef]
- Abaee, A.; Mohammadian, M.; Jafari, S.M. Whey and soy protein-based hydrogels and nano-hydrogels as bioactive delivery systems. Trends Food Sci. Technol. 2017, 70, 69–81. [Google Scholar] [CrossRef]
- Betz, M.; Kulozik, U. Microencapsulation of bioactive bilberry anthocyanins by means of whey protein gels. Procedia Food Sci. 2011, 1, 2047–2056. [Google Scholar] [CrossRef]
- Akhtar, S.; Rauf, A.; Imran, M.; Qamar, M.; Riaz, M.; Mubarak, M.S. Black carrot (Daucus carota L.), dietary and health promoting perspectives of its polyphenols: A review. Trends Food Sci. Technol. 2017, 66, 36–47. [Google Scholar] [CrossRef]
- Bouayed, J.; Hoffmann, L.; Bohn, T. Total phenolics, flavonoids, anthocyanins and antioxidant activity following simulated gastro-intestinal digestion and dialysis of apple varieties: Bioaccessibility and potential uptake. Food Chem. 2011, 128, 14–21. [Google Scholar] [CrossRef]
- Kirca, A.; Cemeroǧlu, B. Degradation kinetics of anthocyanins in blood orange juice and concentrate. Food Chem. 2003, 81, 583–587. [Google Scholar] [CrossRef]
- Le, X.T.; Rioux, L.E.; Turgeon, S.L. Formation and functional properties of protein–polysaccharide electrostatic hydrogels in comparison to protein or polysaccharide hydrogels. Adv. Colloid Interface Sci. 2017, 239, 127–135. [Google Scholar] [CrossRef]
- Gupta, S.; D’Mello, R.; Chance, M.R. Structure and dynamics of protein waters revealed by radiolysis and mass spectrometry. Proc. Natl. Acad. Sci. USA 2012, 109, 14882–14887. [Google Scholar] [CrossRef] [PubMed]
- Eneh, C.I.; Bolen, M.J.; Suarez-Martinez, P.C.; Bachmann, A.L.; Zimudzi, T.J.; Hickner, M.A.; Batys, P.; Sammalkorpi, M.; Lutkenhaus, J.L. Fourier transform infrared spectroscopy investigation of water microenvironments in polyelectrolyte multilayers at varying temperatures. Soft Matter 2020, 16, 2291–2300. [Google Scholar] [CrossRef] [PubMed]
- Williams, P.D.; Oztop, M.H.; Mccarthy, M.J.; Mccarthy, K.L.; Lo, Y.M. Characterization of water distribution in xanthan-curdlan hydrogel complex using magnetic resonance imaging, nuclear magnetic resonance relaxometry, rheology, and scanning electron microscopy. J. Food Sci. 2011, 76, 472–478. [Google Scholar] [CrossRef] [PubMed]
- Hashemi, R.H.; Bradley, W.G.; Lisanti, C.J. MRI: The Basics, 3rd ed.; Lippincott Williams and Wilkins: Baltimore, MD, USA, 2010; ISBN 978-1-60831-115-6. [Google Scholar]
- Kirtil, E.; Oztop, M.H. 1H Nuclear Magnetic Resonance Relaxometry and Magnetic Resonance Imaging and Applications in Food Science and Processing. Food Eng. Rev. 2016, 8, 1–22. [Google Scholar] [CrossRef]
- Ozel, B.; Cikrikci, S.; Aydin, O.; Oztop, M.H. Polysaccharide blended whey protein isolate-(WPI) hydrogels: A physicochemical and controlled release study. Food Hydrocoll. 2017, 71, 35–46. [Google Scholar] [CrossRef]
- Mariette, F. Investigations of food colloids by NMR and MRI. Curr. Opin. Colloid Interface Sci. 2009, 14, 203–211. [Google Scholar] [CrossRef]
- Ozel, B.; Uguz, S.S.; Kilercioglu, M.; Grunin, L.; Oztop, M.H. Effect of different polysaccharides on swelling of composite whey protein hydrogels: A low field (LF) NMR relaxometry study. J. Food Process Eng. 2017, 40, 1–9. [Google Scholar] [CrossRef]
- Kimmich, R.; Anoardo, E. Field-cycling NMR relaxometry. Prog. Nucl. Magn. Reson. Spectrosc. 2004, 44, 257–320. [Google Scholar] [CrossRef]
- Kruk, D.; Meier, R.; Rachocki, A.; Korpała, A.; Singh, R.K.; Rössler, E.A. Determining diffusion coefficients of ionic liquids by means of field cycling nuclear magnetic resonance relaxometry. J. Chem. Phys. 2014, 140, 244509. [Google Scholar] [CrossRef] [PubMed]
- Rachocki, A.; Latanowicz, L.; Tritt-Goc, J. Dynamic processes and chemical composition of Lepidium sativum seeds determined by means of field-cycling NMR elaxometry and NMR spectroscopy. Anal. Bioanal. Chem. 2012, 404, 3155–3164. [Google Scholar] [CrossRef]
- Rachocki, A.; Tritt-Goc, J. Novel application of NMR relaxometry in studies of diffusion in virgin rape oil. Food Chem. 2014, 152, 94–99. [Google Scholar] [CrossRef]
- Steele, R.M.; Korb, J.P.; Ferrante, G.; Bubici, S. New applications and perspectives of fast field cycling NMR relaxometry. Magn. Reson. Chem. 2016, 54, 502–509. [Google Scholar] [CrossRef] [PubMed]
- Capitani, D.; Sobolev, A.P.; Delfini, M.; Vista, S.; Antiochia, R.; Proietti, N.; Bubici, S.; Ferrante, G.; Carradori, S.; De Salvador, F.R.; et al. NMR methodologies in the analysis of blueberries. Electrophoresis 2014, 35, 1615–1626. [Google Scholar] [CrossRef] [PubMed]
- Bajd, F.; Gradišek, A.; Apih, T.; Serša, I. Dry-cured ham tissue characterization by fast field cycling nmr relaxometry and quantitative magnetization transfer. Magn. Reson. Chem. 2016, 54, 827–834. [Google Scholar] [CrossRef] [PubMed]
- Conte, P.; Mineo, V.; Bubici, S.; De Pasquale, C.; Aboud, F.; MacCotta, A.; Planeta, D.; Alonzo, G. Dynamics of pistachio oils by proton nuclear magnetic resonance relaxation dispersion. Anal. Bioanal. Chem. 2011, 400, 1443–1450. [Google Scholar] [CrossRef]
- Kruk, D.; Florek-Wojciechowska, M.; Masiewicz, E.; Oztop, M.; Ploch-Jankowska, A.; Duda, P.; Wilczynski, S. Water mobility in cheese by means of Nuclear Magnetic Resonance relaxometry. J. Food Eng. 2021, 298, 110483. [Google Scholar] [CrossRef]
- Kruk, D.; Masiewicz, E.; Wojciechowski, M.; Florek-Wojciechowska, M.; Broche, L.M.; Lurie, D.J. Slow dynamics of solid proteins—Nuclear magnetic resonance relaxometry versus dielectric spectroscopy. J. Magn. Reson. 2020, 314, 106721. [Google Scholar] [CrossRef]
- Pocan, P.; Ilhan, E.; Florek-Wojciechowska, M.; Masiewicz, E.; Kruk, D.; Oztop, M.H. Exploring the water mobility in gelatin based soft candies by means of Fast Field Cycling (FFC) Nuclear Magnetic Resonance relaxometry. J. Food Eng. 2021, 294, 110422. [Google Scholar] [CrossRef]
- Hofmann, M.; Gainaru, C.; Cetinkaya, B.; Valiullin, R.; Fatkullin, N.; Rössler, E.A. Field-Cycling Relaxometry as a Molecular Rheology Technique: Common Analysis of NMR, Shear Modulus and Dielectric Loss Data of Polymers vs Dendrimers. Macromolecules 2015, 48, 7521–7534. [Google Scholar] [CrossRef]
- Meier, R.; Herrmann, A.; Hofmann, M.; Schmidtke, B.; Kresse, B.; Privalov, A.F.; Kruk, D.; Fujara, F.; Rössler, E.A. Iso-frictional mass dependence of diffusion of polymer melts revealed by 1H NMR relaxometry. Macromolecules 2013, 46, 5538–5548. [Google Scholar] [CrossRef]
- Meier, R.; Herrmann, A.; Kresse, B.; Privalov, A.F.; Kruk, D.; Fujara, F.; Rössler, E.A. Long-time diffusion in polymer melts revealed by 1H NMR relaxometry. ACS Macro Lett. 2013, 2, 96–99. [Google Scholar] [CrossRef]
- Kruk, D.; Rochowski, P.; Masiewicz, E.; Wilczynski, S.; Wojciechowski, M.; Broche, L.M.; Lurie, D.J. Mechanism of Water Dynamics in Hyaluronic Dermal Fillers Revealed by Nuclear Magnetic Resonance Relaxometry. Chem. Phys. Chem. 2019, 20, 2816–2822. [Google Scholar] [CrossRef]
- Alacik Develioglu, I.; Ozel, B.; Sahin, S.; Oztop, M.H. NMR Relaxometry and magnetic resonance imaging as tools to determine the emulsifying characteristics of quince seed powder in emulsions and hydrogels. Int. J. Biol. Macromol. 2020, 164, 2051–2061. [Google Scholar] [CrossRef] [PubMed]
- Fries, P.H. Dipolar nuclear spin relaxation in liquids and plane fluids undergoing chemical reactions. Mol. Phys. 1983, 48, 503–526. [Google Scholar] [CrossRef]
- Kruk, D.; Meier, R.; Rössler, E.A. Nuclear magnetic resonance relaxometry as a method of measuring translational diffusion coefficients in liquids. Phys. Rev. E-Stat. Nonlinear Soft Matter Phys. 2012, 85, 1–5. [Google Scholar] [CrossRef] [PubMed]
- Kruk, D.; Herrmann, A.; Rössler, E.A. Field-cycling NMR relaxometry of viscous liquids and polymers. Prog. Nucl. Magn. Reson. Spectrosc. 2012, 63, 33–64. [Google Scholar] [CrossRef] [PubMed]
- Kowalewski, J.; Maler, L. Nuclear Spin Relaxation in Liquids: Theory, Experiments, and Applications, 1st ed.; Moore, J.H., Spencer, N.D., Eds.; Taylor & Francis: New York, NY, USA, 2006; ISBN 0750309644. [Google Scholar]
- Kowalewski, J.; Egorov, A.; Kruk, D.; Laaksonen, A.; Nikkhou Aski, S.; Parigi, G.; Westlund, P.O. Extensive NMRD studies of Ni(II) salt solutions in water and water-glycerol mixtures. J. Magn. Reson. 2008, 195, 103–111. [Google Scholar] [CrossRef] [PubMed]
- Kirca, A.; Ozkan, M.; Cemeroglu, B. Stability of black carrot anthocyanins in various fruit juices and nectars. Food Chem. 2006, 97, 598–605. [Google Scholar] [CrossRef]
- Ferreira, D.S.; Faria, A.F.; Grosso, C.R.F.; Mercadante, A.Z. Encapsulation of Blackberry Anthocyanins by Thermal Gelation of Curdlan. J. Braz. Chem. Soc. 2009, 20, 1908–1915. [Google Scholar] [CrossRef]
- Yang, H.; Li, J.G.; Wu, N.F.; Fan, M.M.; Shen, X.L.; Chen, M.T.; Jiang, A.M.; Lai, L.S. Effect of hsian-tsao gum (HG) content upon rheological properties offilm-forming solutions (FFS) and physical properties of soy protein/hsian-tsao gum films. Food Hydrocoll. 2015, 50, 211–218. [Google Scholar] [CrossRef]
- Aspinall, G.O.; Baillie, J. Gum tragacanth. Part I. Fractionation of the gum and the structure of tragacanthic acid. J. Chem. Soc. 1963, 1702–1714. [Google Scholar] [CrossRef]
- Ozel, B.; Aydin, O.; Grunin, L.; Oztop, M.H. Physico-Chemical Changes of Composite Whey Protein Hydrogels in Simulated Gastric Fluid Conditions. J. Agric. Food Chem. 2018, 66, 9542–9555. [Google Scholar] [CrossRef] [PubMed]
- García-Ochoa, F.; Santos, V.E.; Casas, J.A.; Gómez, E. Xanthan gum: Production, recovery, and properties. Biotechnol. Adv. 2000, 18, 549–579. [Google Scholar] [CrossRef]
- Mikac, U.; Sepe, A.; Kristl, J.; Baumgartner, S. A new approach combining different MRI methods to provide detailed view on swelling dynamics of xanthan tablets influencing drug release at different pH and ionic strength. J. Control. Release 2010, 145, 247–256. [Google Scholar] [CrossRef] [PubMed]
- Mohnen, D. Pectin structure and biosynthesis. Curr. Opin. Plant Biol. 2008, 11, 266–277. [Google Scholar] [CrossRef] [PubMed]
- Mohammadifar, M.A.; Musavi, S.M.; Kiumarsi, A.; Williams, P.A. Solution properties of targacanthin (water-soluble part of gum tragacanth exudate from Astragalus gossypinus). Int. J. Biol. Macromol. 2006, 38, 31–39. [Google Scholar] [CrossRef]
- Fabek, H.; Messerschmidt, S.; Brulport, V.; Goff, H.D. The effect of invitro digestive processes on the viscosity of dietary fibres and their influence on glucose diffusion. Food Hydrocoll. 2014, 35, 718–726. [Google Scholar] [CrossRef]
- Masierak, W.; Florek-Wojciechowska, M.; Oglodek, I.; Jakubas, R.; Privalov, A.F.; Kresse, B.; Fujara, F.; Kruk, D. Dynamics of [C3H5N2]6[Bi4Br18] by means of 1H NMR relaxometry and quadrupole relaxation enhancement. J. Chem. Phys. 2015, 142, 204503. [Google Scholar] [CrossRef] [PubMed]
- Sunde, E.P.; Halle, B. Mechanism of 1H-14N cross-relaxation in immobilized proteins. J. Magn. Reson. 2010, 203, 257–273. [Google Scholar] [CrossRef] [PubMed]
- Fries, P.H.; Belorizky, E. Simple expressions of the nuclear relaxation rate enhancement due to quadrupole nuclei in slowly tumbling molecules. J. Chem. Phys. 2015, 143, 044202. [Google Scholar] [CrossRef]


Publisher’s Note: MDPI stays neutral with regard to jurisdictional claims in published maps and institutional affiliations. |
© 2021 by the authors. Licensee MDPI, Basel, Switzerland. This article is an open access article distributed under the terms and conditions of the Creative Commons Attribution (CC BY) license (https://creativecommons.org/licenses/by/4.0/).