Article

Role of Iron-Containing Alcohol Dehydrogenases in Acinetobacter baumannii ATCC 19606 Stress Resistance and Virulence

1
Master Program of Microbiology and Immunology, School of Medicine, Tzu Chi University, Hualien 97004, Taiwan
2
Department of Microbiology, School of Medicine, Tzu Chi University, Hualien 97004, Taiwan
3
International College, Tzu Chi University, Hualien 97004, Taiwan
4
Department of Bioscience Technology, Chang Jung Christian University, Tainan 71101, Taiwan
*
Author to whom correspondence should be addressed.
Int. J. Mol. Sci. 2021, 22(18), 9921; https://doi.org/10.3390/ijms22189921
Submission received: 3 August 2021 / Revised: 11 September 2021 / Accepted: 13 September 2021 / Published: 14 September 2021
(This article belongs to the Special Issue Microbial Virulence Factors 2.0)

Abstract

:
Most bacteria possess alcohol dehydrogenase (ADH) genes (Adh genes) to mitigate alcohol toxicity, but these genes have functions beyond alcohol degradation. Previous research has shown that ADH can modulate quorum sensing in Acinetobacter baumannii, a rising opportunistic pathogen. However, the number and nature of Adh genes in A. baumannii have not yet been fully characterized. We identified seven alcohol dehydrogenases (NAD+-ADHs) from A. baumannii ATCC 19606, and examined the roles of three iron-containing ADHs, ADH3, ADH4, and ADH6. Marker-less mutation was used to generate Adh3, Adh4, and Adh6 single, double, and triple mutants. Disrupted Adh4 mutants failed to grow in ethanol-, 1-butanol-, or 1-propanol-containing mediums, and recombinant ADH4 exhibited strongest activity against ethanol. Stress resistance assays with inorganic and organic hydroperoxides showed that Adh3 and Adh6 were key to oxidative stress resistance. Virulence assays performed on the Galleria mellonella model organism revealed that Adh4 mutants had comparable virulence to wild-type, while Adh3 and Adh6 mutants had reduced virulence. The results suggest that ADH4 is primarily involved in alcohol metabolism, while ADH3 and ADH6 are key to stress resistance and virulence. Further investigation into the roles of other ADHs in A. baumannii is warranted.

1. Introduction

Alcohol dehydrogenases (ADHs; EC 1.1.1.1 and EC 1.1.1.2) are widely present in most bacteria [1] and can mitigate the cytotoxicity of aliphatic alcohols such as ethanol, propanol, or 1-butanol [2]. ADHs can be classified by coenzyme into three main types: nicotinamide adenine dinucleotide (NAD+)-dependent, NAD+-independent, and flavin adenine dinucleotide (FAD+)-dependent. The NAD+-dependent ADHs (NAD+-ADHs) can be further subdivided into zinc-containing, iron-containing, and short chain ADHs [3,4,5,6]. Interestingly, not all bacteria with ADHs have ethanol-degrading capabilities [7,8,9], and previous research has shown that bacterial ADHs may have important functions beyond alcohol metabolism, being involved in such diverse mechanisms as stress resistance [10], biofilm formation [11], and bacterial virulence [12].
In addition, several studies have shown that the presence of ethanol can induce stress responses in bacteria that lead to increased virulence [13,14,15], and this has particularly been noted for Acinetobacter baumannii, a rising opportunistic pathogen that is increasingly seen in nosocomial and community-acquired infections [14,15]. In the presence of ethanol, A. baumannii upregulated the expression of several proteins involved in stress responses, iron assimilation, phosphate transport, and lipid and carbohydrate anabolism; while at the same time, increased secretion of phospholipase C, acidification of bacterial cultures, and formation of biofilms was also noted [14,15]. The main A. baumannii Adh gene (A1S_2098) was strongly induced in the presence of ethanol, but other genes potentially encoding ADHs, including two iron-containing ADHs (FeADHs), were not induced or only slightly upregulated [14], and this suggests that these ADHs may have functions beyond ethanol degradation. Importantly, it was found that ethanol-exposed A. baumannii demonstrated stronger virulence in a Galleria mellonella model of infection [15]. A recent study has also shown that the A1S_2098 gene is significantly upregulated during the A. baumannii biofilm formation process, and may play a role in quorum sensing, bacterial growth, and motility [11]. However, the number and nature of other A. baumannii genes potentially encoding ADHs, particularly FeADHs, has not yet been explored in detail.
In this study, we sought to elucidate the roles of three A. baumannii genes identified through in silico methods as potentially encoding FeADHs, and assessed the impact of their expression products on ethanol metabolism, stress responses, and virulence. These results can help to bridge the gaps in our current understanding of ADH function in A. baumannii, and may serve as the basis for future research into other as yet uncharacterized Adh genes. In the long term, the results of such research could potentially advise more effective sanitizing procedures and infection control measures, in order to prevent the survival and spread of A. baumannii in both clinical and community settings.

2. Results

2.1. In Silico Identification of Putative ADH Genes in A. baumannii

A search of the GenBank database revealed seven genes annotated as possible Adh genes in A. baumannii (Table S1). Genomic analysis revealed that three of these are iron-containing ADHs (ADH3, ADH4, and ADH6), another three are zinc-dependent ADHs (ADH1, ADH2, and ADH7), and the remaining one is a short-chain ADH (ADH5). The iron-containing ADHs were respectively encoded by DJ41_189 (ADH3; 1,158 bp), DJ41_136 (ADH4; 1,173 bp), and DJ41_1604 (ADH6; 1,185 bp). Interestingly, the number of annotated Adh genes is relatively low in terms of the genome size of A. baumannii (genome size 3.97 Mb, 7 Adh genes annotated in GenBank), as other Gram-negative soil bacteria that are also opportunistic pathogens have significantly more annotated Adh genes, with 44 Adh genes found for Burkholderia psedomallei K96243 (7.42 Mb genome) and 42 Adh genes annotated for Pseudomonas aeruginosa PAO1 (6.26 Mb genome). However, this may be indicative of limited research conducted in A. baumannii, and further studies are needed to better examine this phenomenon.
Phylogenetic analysis was conducted with 26 annotated ADH amino acid sequences from 14 microorganisms that were identified in a comprehensive search of the GenBank database, and MEGA 7 software (https://www.megasoftware.net/, accessed on 31 July 2021) was used to construct a phylogenetic tree. The resulting dendrogram revealed two discrete iron-containing and zinc-containing clades (Figure 1). Of the iron-containing ADHs identified in A. baumannii, ADH4 was found to distribute in the same clade as ADH from ethanologenic microorganisms, including Saccharomyces cerevisiae (Figure 1A). ADH3 and ADH6 shared higher identity with bifunctional aldehyde-alcohol dehydrogenases (Figure 1A). Proteomic analysis showed that ADH3 shared 31.7% identity with ADH4, and 30.6% identity with ADH6, while ADH4 and ADH6 shared 33.1% identity (Figure 1B). The cofactor binding motif, GGGSXXD, four key iron-binding sites (D, H, H, H), and a highly conserved aspartic acid residue (D; located at position 39 in ADH3, position 46 in ADH4, and position 41 in ADH6) were found in all three FeADHs, and indicate the preference for NAD+ as a cofactor for these enzymes (Figure 1B).

2.2. Biochemical Properties of ADH4

To understand the biochemical properties of these three FeADHs, we cloned their encoding genes into plasmid pQE80L, then transformed plasmids into E. coli for protein overexpression and subsequent purification. Overexpression was successfully induced for all FeADHs (Figure S1, lanes 2, 5, 8), and soluble proteins were purified by Ni-affinity chromatography, with protein sizes of about 43.7 kDa, 44.2 kDa and 44.7 kDa, respectively (Figure S1, lanes 3, 6, 9).
The enzymatic activity of ADH4 was tested in different buffers, as well as varying temperature conditions, in order to establish the optimal conditions for enzymatic activity assays against different alcohol substrates. We tested 0.5 µM of ADH4 in 80 µM of three different buffers (Figure 2A), and the highest activity was noted with the CB buffer at a pH value of 10.1 (Figure 2A). In addition, maximal ADH4 activity was detected at 37 °C (Figure 2B). Using these conditions, we proceeded to assess the substrate specificity of recombinant ADH4 against ethanol, 1-propanol, and 1-butanol, and subsequently found that the Michaelis–Menten constant (KM) was lowest for ethanol (Table 1; Figure S2), indicative of stronger affinity to ethanol for ADH4 over other aliphatic alcohols.

2.3. Biological Function of ADH3, ADH4, and ADH6

To elucidate the biological roles of Adh3, Adh4 and Adh6, we generated three single mutants (Δ3, Δ4, Δ6), three double mutants (Δ34, Δ36, Δ46), and one triple mutant (Δ346) using marker-less mutation. Mutants were confirmed by colony PCR (Figures S3 and S4) with gene-specific primers (Table 2). Growth rates of these seven mutants in LB medium did not differ from wild-type, suggesting that FeADHs did not play a major role in growth and survival under culturing conditions with rich medium (Figure 3A). However, strains with mutated Adh4 failed to proliferate in M9 medium containing 1% ethanol (Figure 3B), in line with the findings in Table 1 that point to a role for ADH4 in ethanol metabolism. Moreover, all strains with mutated Adh4 failed to proliferate in medium containing 1% of 1-propanol, while Δ3 and Δ36 mutants experienced reduced growth rates compared to wild-type (Figure 3C). Interestingly, the Δ6 mutant had comparable growth rates as wild-type, suggesting that both ADH3 and ADH4 may have roles in 1-propanol metabolism. All mutant strains had reduced growth compared to wild-type in medium containing 1% of 1-butanol (Figure 3D).

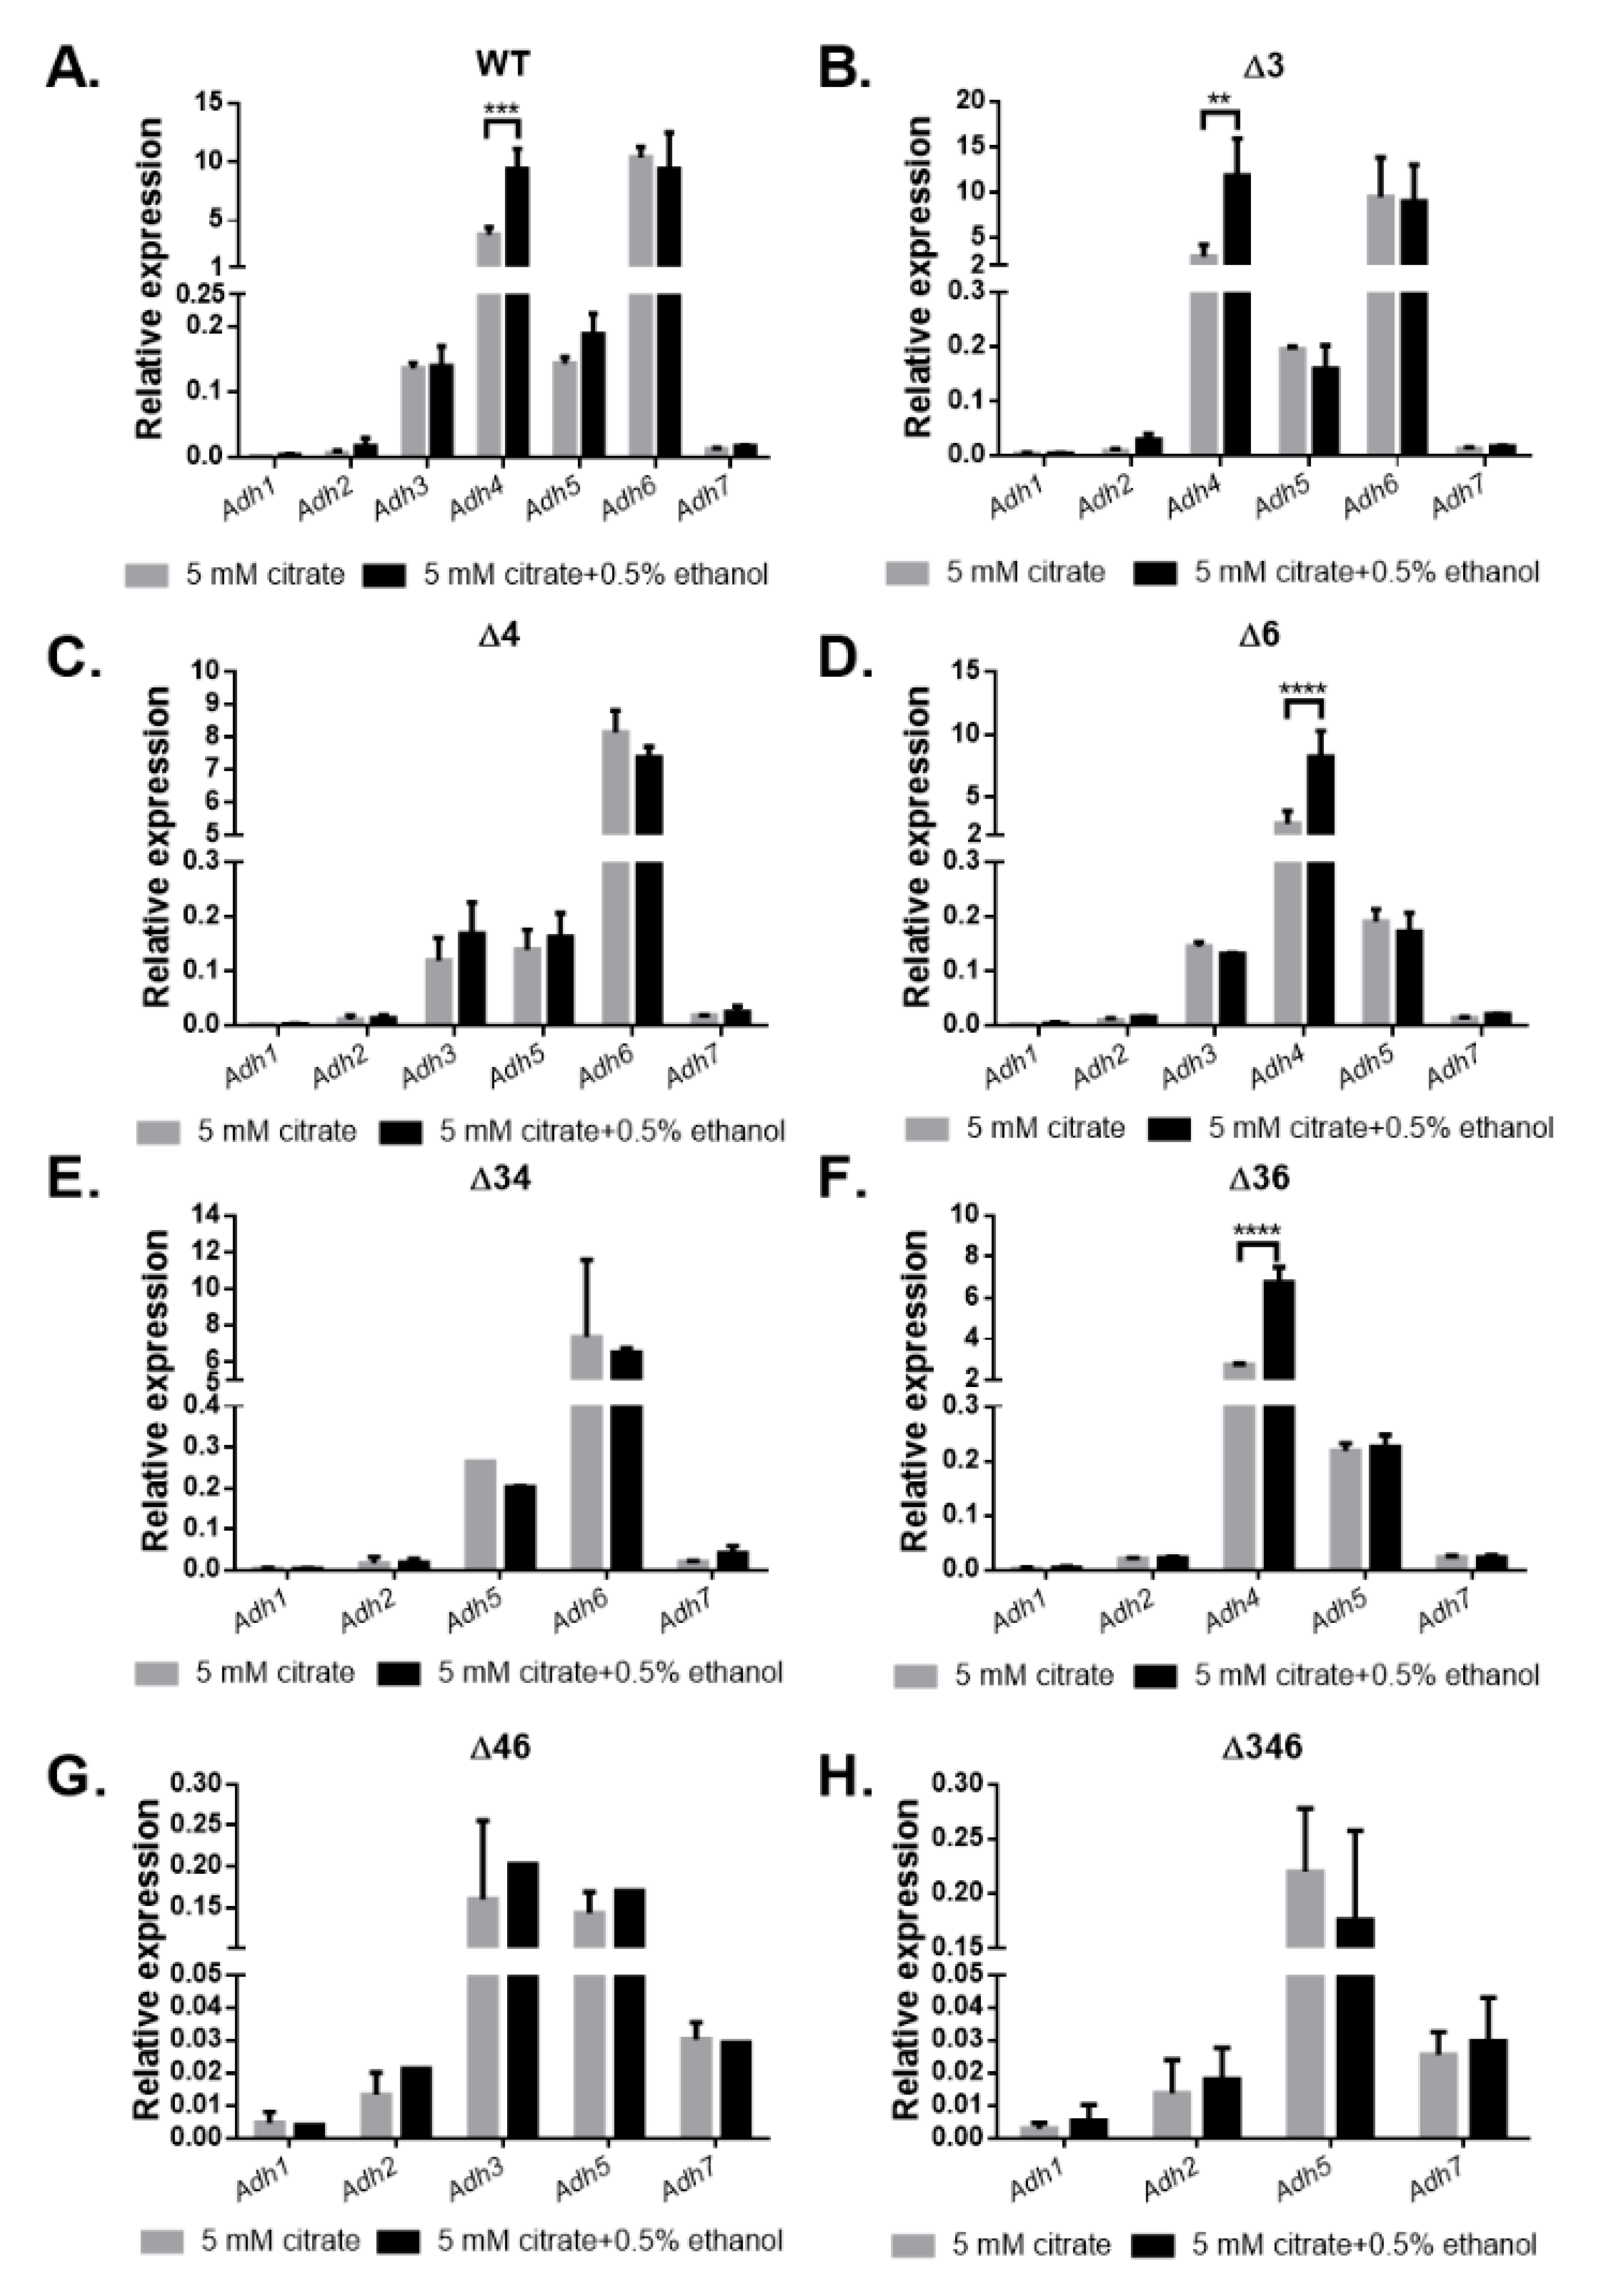
2.4. Gene Expression Patterns of Wild-Type and Mutant Strains in the Presence of Ethanol

Gene expression patterns of wild-type and mutant strains cultivated in 5 mM citrate medium or 5 mM citrate medium with 0.5% ethanol were compared through transcript analysis, with the gyrase gene (A4U85_RS04125) as a control to calculate relative expression levels (Figure 4). In the wild-type strain, it can be seen that genes encoding FeADHs were more highly expressed than the other Adh genes, with the exception of Adh5 (Figure 4A). Expression levels of Adh3 and Adh6 did not change in the presence of ethanol, but Adh4 expression significantly increased by 3.79- to 9.39-fold (p < 0.001) in the ethanol-containing medium (Figure 4A). In mutant strains, genes encoding FeADHs were also more highly expressed than the other Adh genes, with the exception of Adh5 (Figure 4B–H). In the Δ3 (Figure 4B), Δ6 (Figure 4D), and Δ36 (Figure 4F) mutant strains, Adh4 expression also significantly increased in the presence of ethanol (p < 0.01). These results suggest that ADH4 plays a significant role in ethanol metabolism, while ADH3, ADH5, and ADH6 may have other key functions that necessitate a high level of expression, regardless of the presence of ethanol.

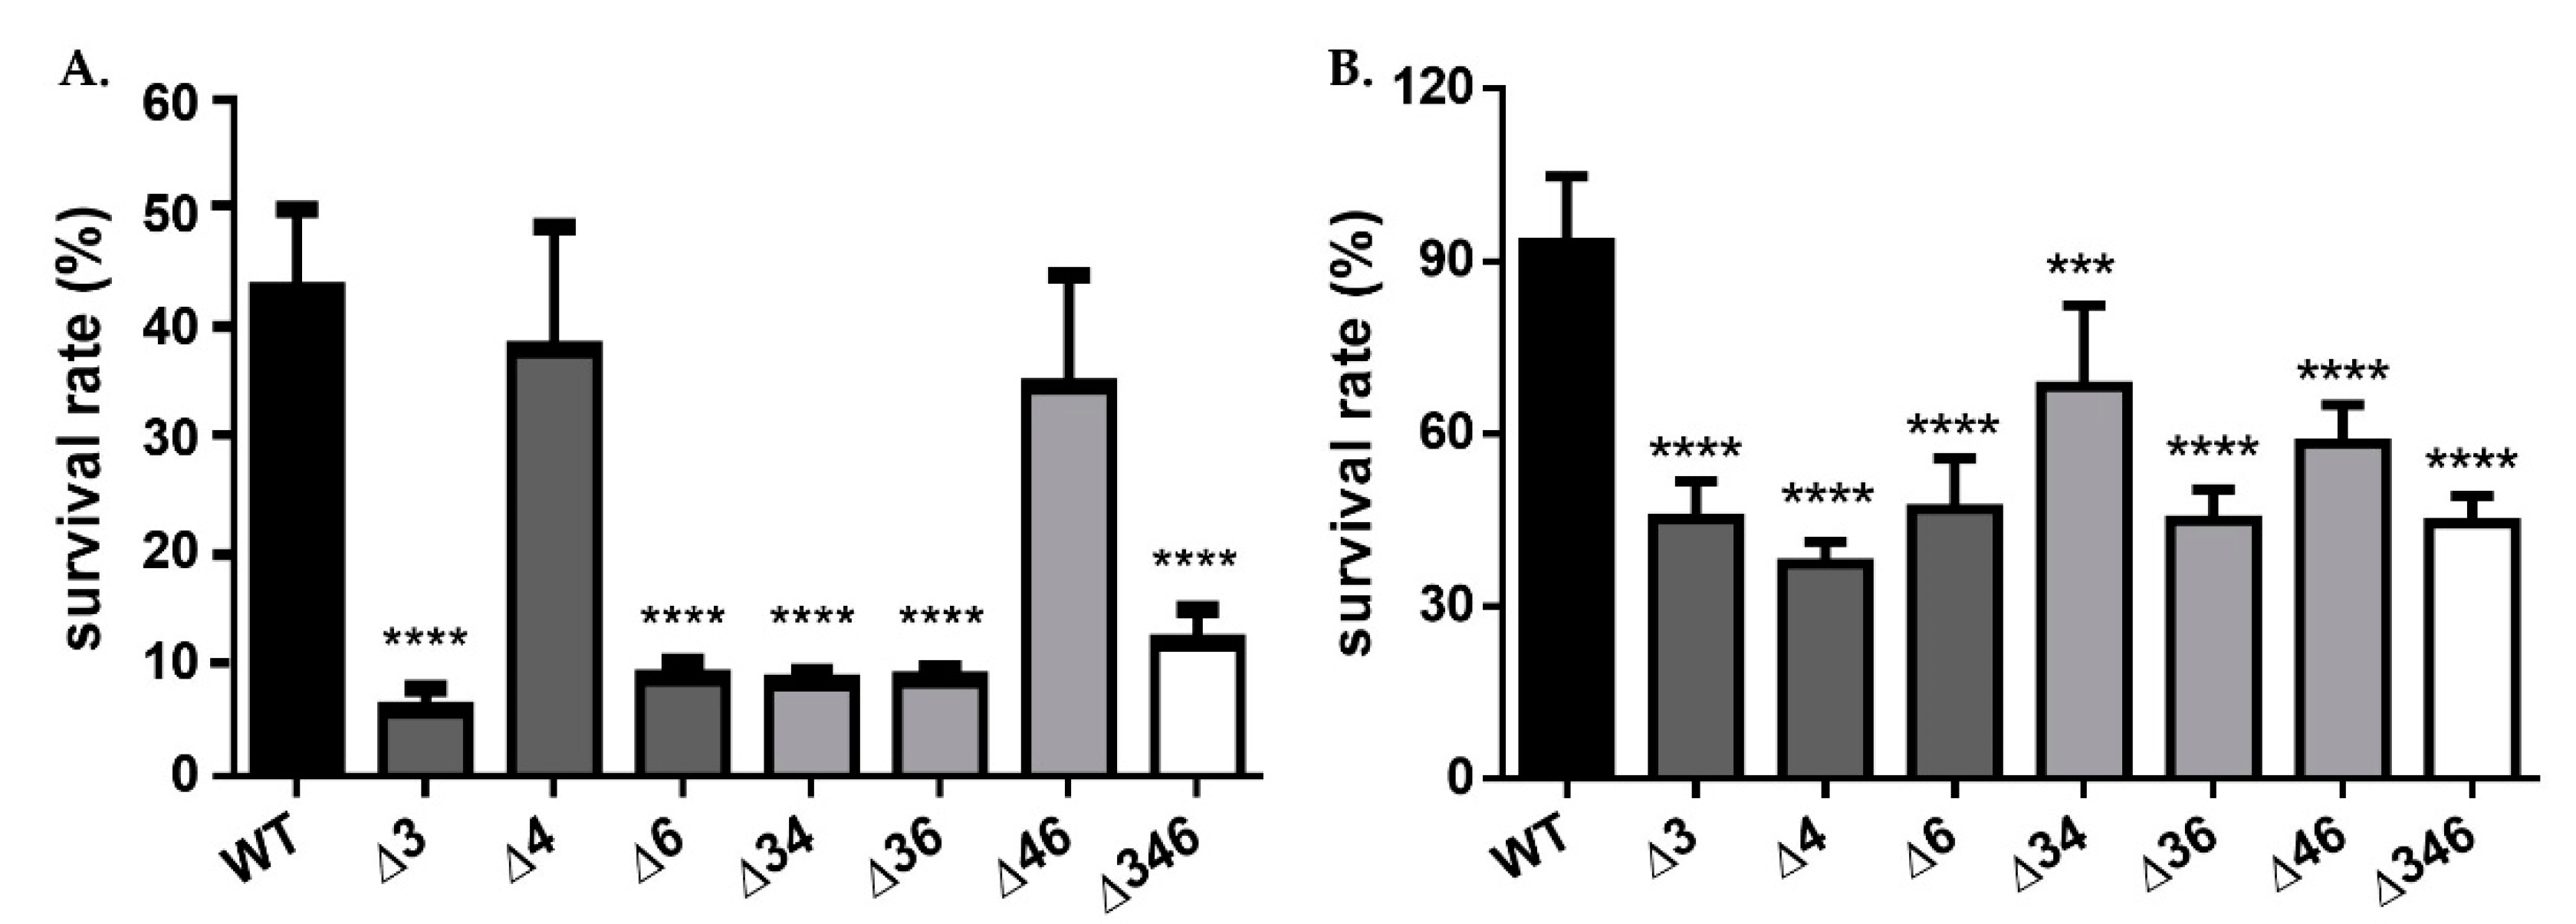
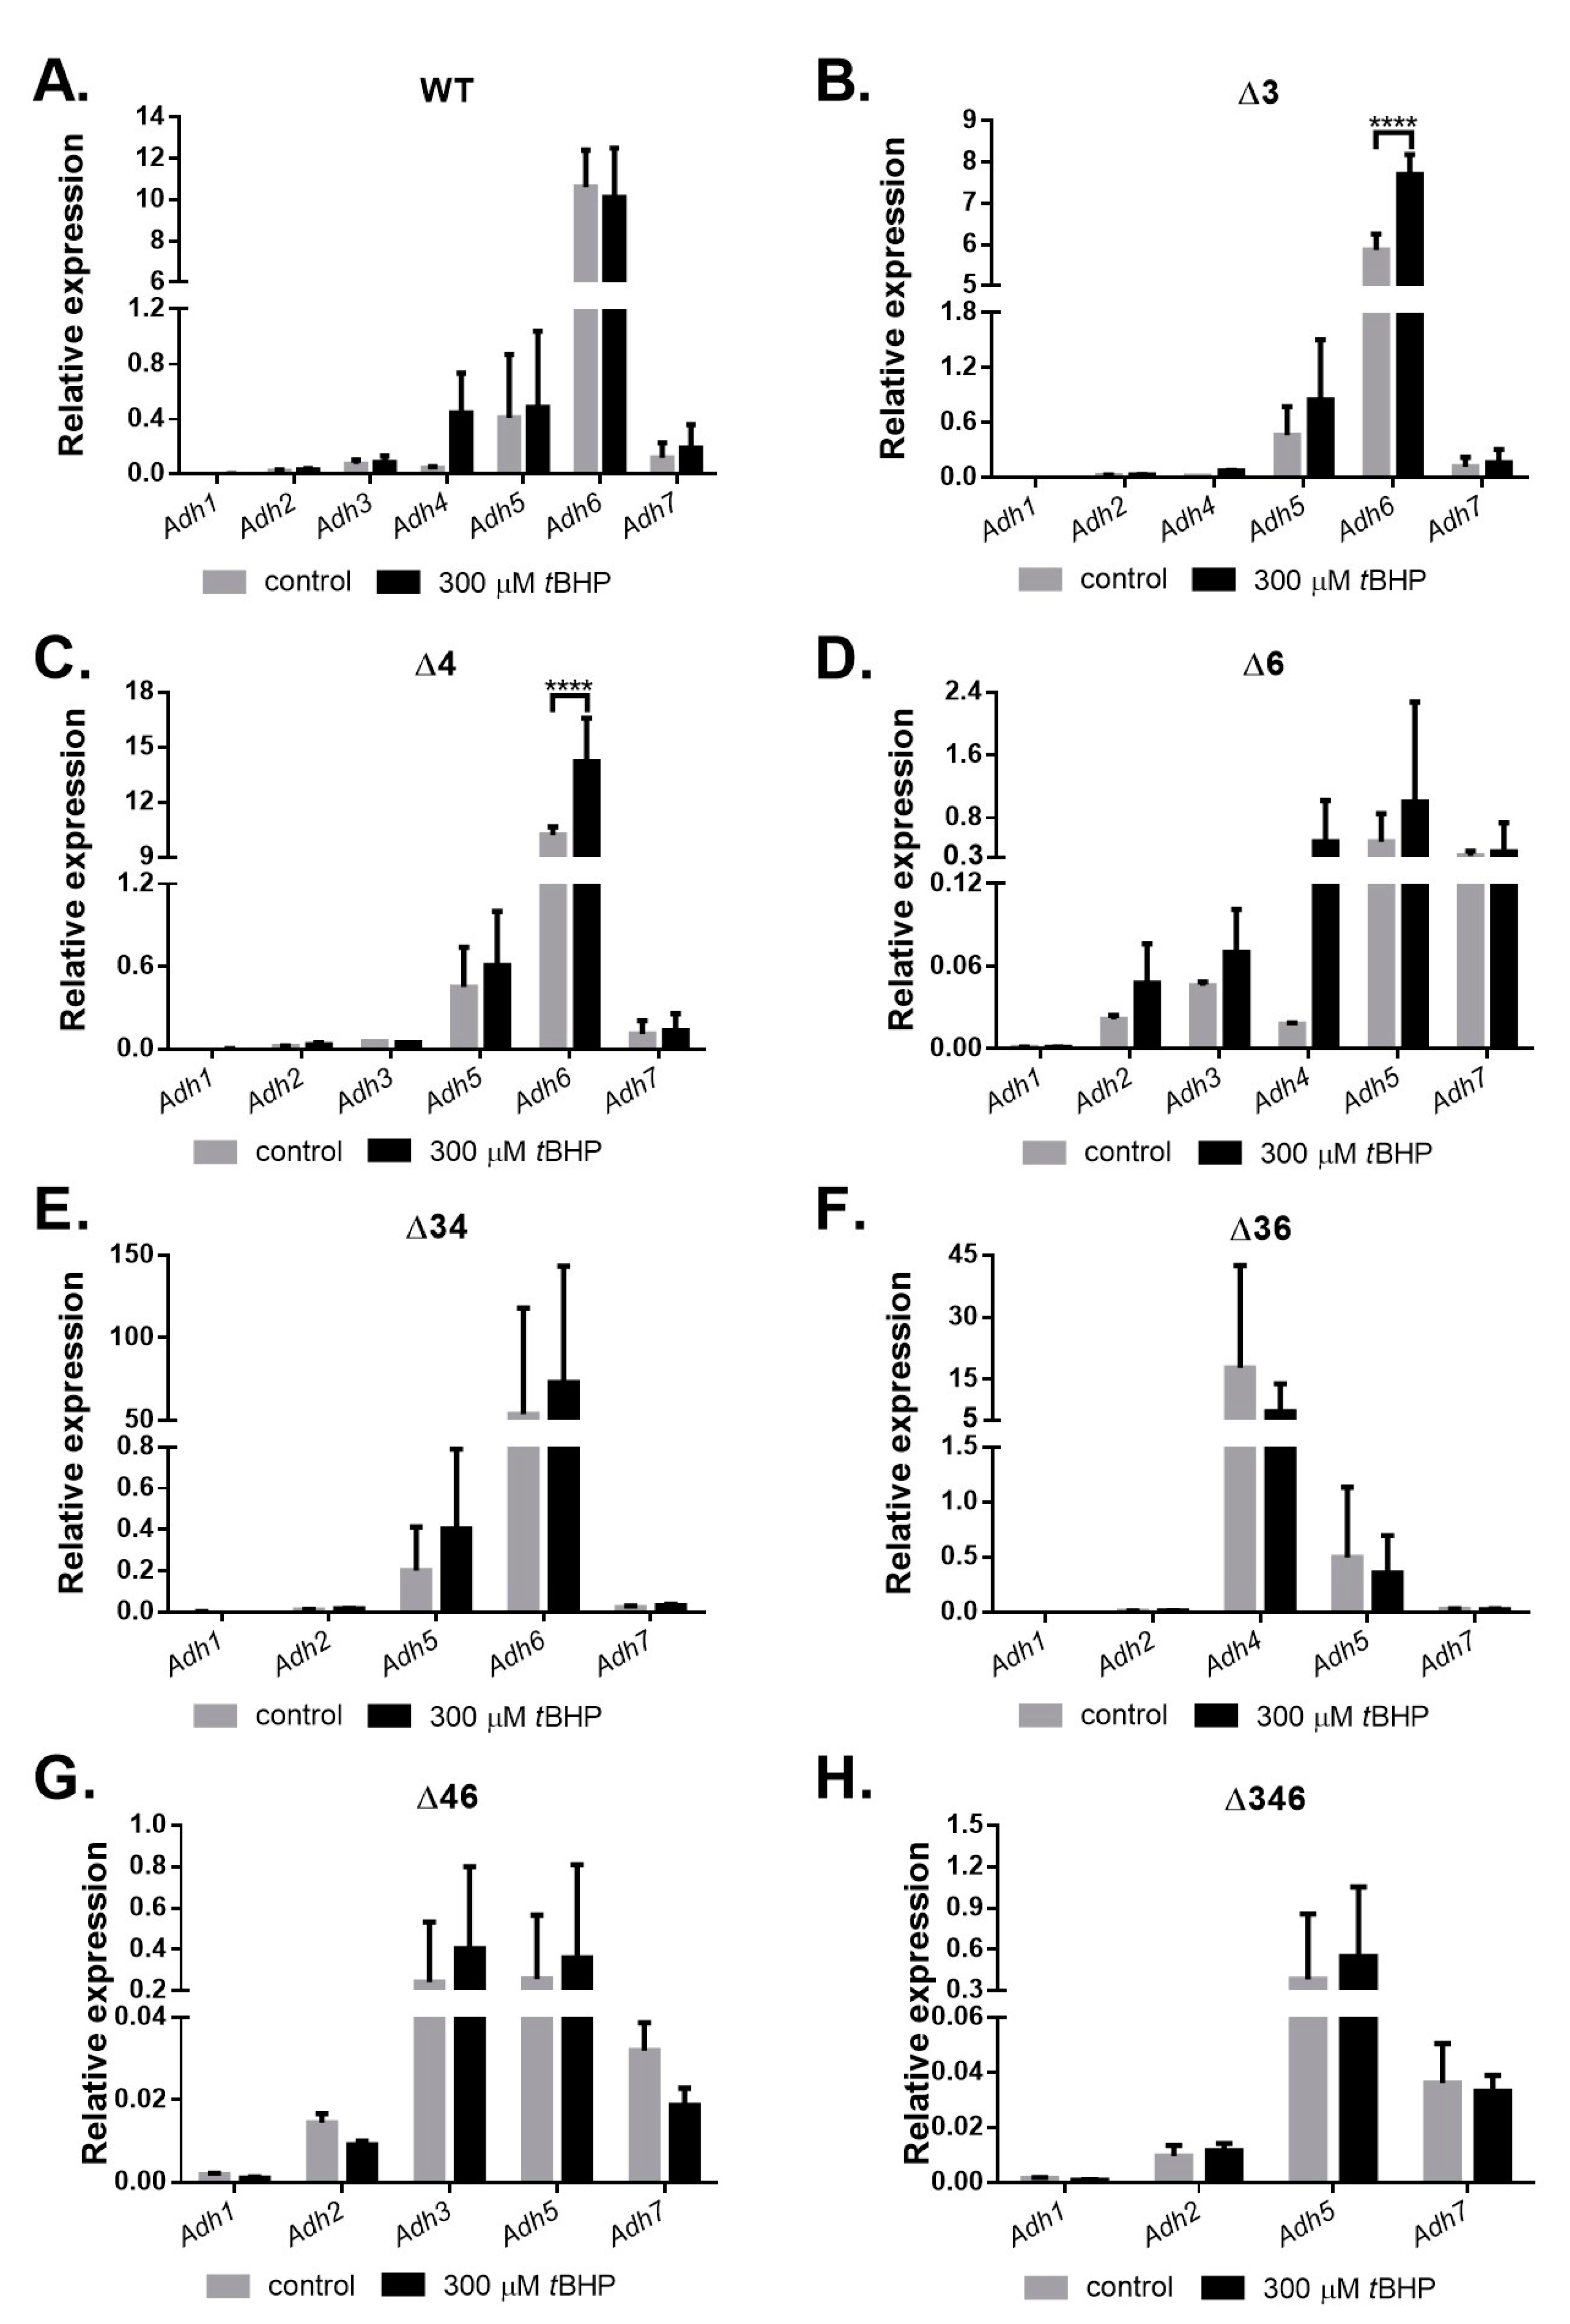
2.5. Adh3 and Adh6 Are Involved in Inorganic and Organic Oxidative Stress Responses

Previous research has suggested that AdhA in Synechocystis sp. PCC 6803 may help to increase ethanol tolerance by maintaining an adequate level of NADH or NADPH to counteract oxidative stress [16], and thus we considered the possibility that FeADHs may similarly act to counterbalance oxidative stress by maintaining the homeostasis of NADH or NADPH in A. baumannii cells. We accordingly cultured wild-type and mutant strains in LB medium with an initial OD600 of 0.1. Viable bacterial counts were determined when the OD600 reached 0.6, after which cultures were treated with 5 mM H2O2 for 20 min. Viable bacterial counts were again assessed, and survival rates were then determined by comparing with pre-testing viability counts (Figure 5). The results showed that only the Δ4 single mutant and the Δ46 double mutant maintained comparable survival rates after H2O2 treatment (Figure 5A), indicating a critical role for ADH3 in countering inorganic oxidative stress. The same experiment was performed again, but 300 µM of organic tert-BHP was applied for 20 min instead of H2O2. The results showed that all mutants experienced significant reductions of at least 30% in viability as compared to wild-type, and this suggests that all three FeADHs may contribute to organic hydroperoxide resistance (Figure 5B).
Cultures were collected for RNA extraction, and differential gene expression under inorganic and organic oxidative stress was analyzed using qRT-PCR. The results showed that no Adh genes were upregulated in the wild-type strain after H2O2 treatment; in fact, expression levels of Adh4 and Adh6 decreased significantly (Figure 6A). However, after H2O2 treatment, Adh6 expression increased significantly in the Δ34 double mutant strain (Figure 6E); Adh3 and Adh5 expression increased significantly in the Δ46 double mutant strain (Figure 6G), and Adh5 expression increased significantly in the Δ346 triple mutant strain (Figure 6H). These findings suggest that Adh5 may partially complement inorganic oxidative stress responses when Adh3 and Adh6 are not available. Following tert-BHP treatment, no Adh genes were upregulated in the wild-type strain (Figure 7A), but Adh6 expression increased significantly in Δ3 single mutant (Figure 7B) and Δ4 single mutant (Figure 7C) strains. Adh3 expression increased significantly in the Δ46 double mutant (Figure 7G), while Adh5 expression also significantly rose in both the Δ46 double mutant (Figure 7G) and Δ346 triple mutant strains (Figure 7H), presumably to complement the stress response in the absence of Adh6 and Adh3. Taken together, these results point to a critical role for Adh3 and Adh6 in countering inorganic and organic oxidative stress.

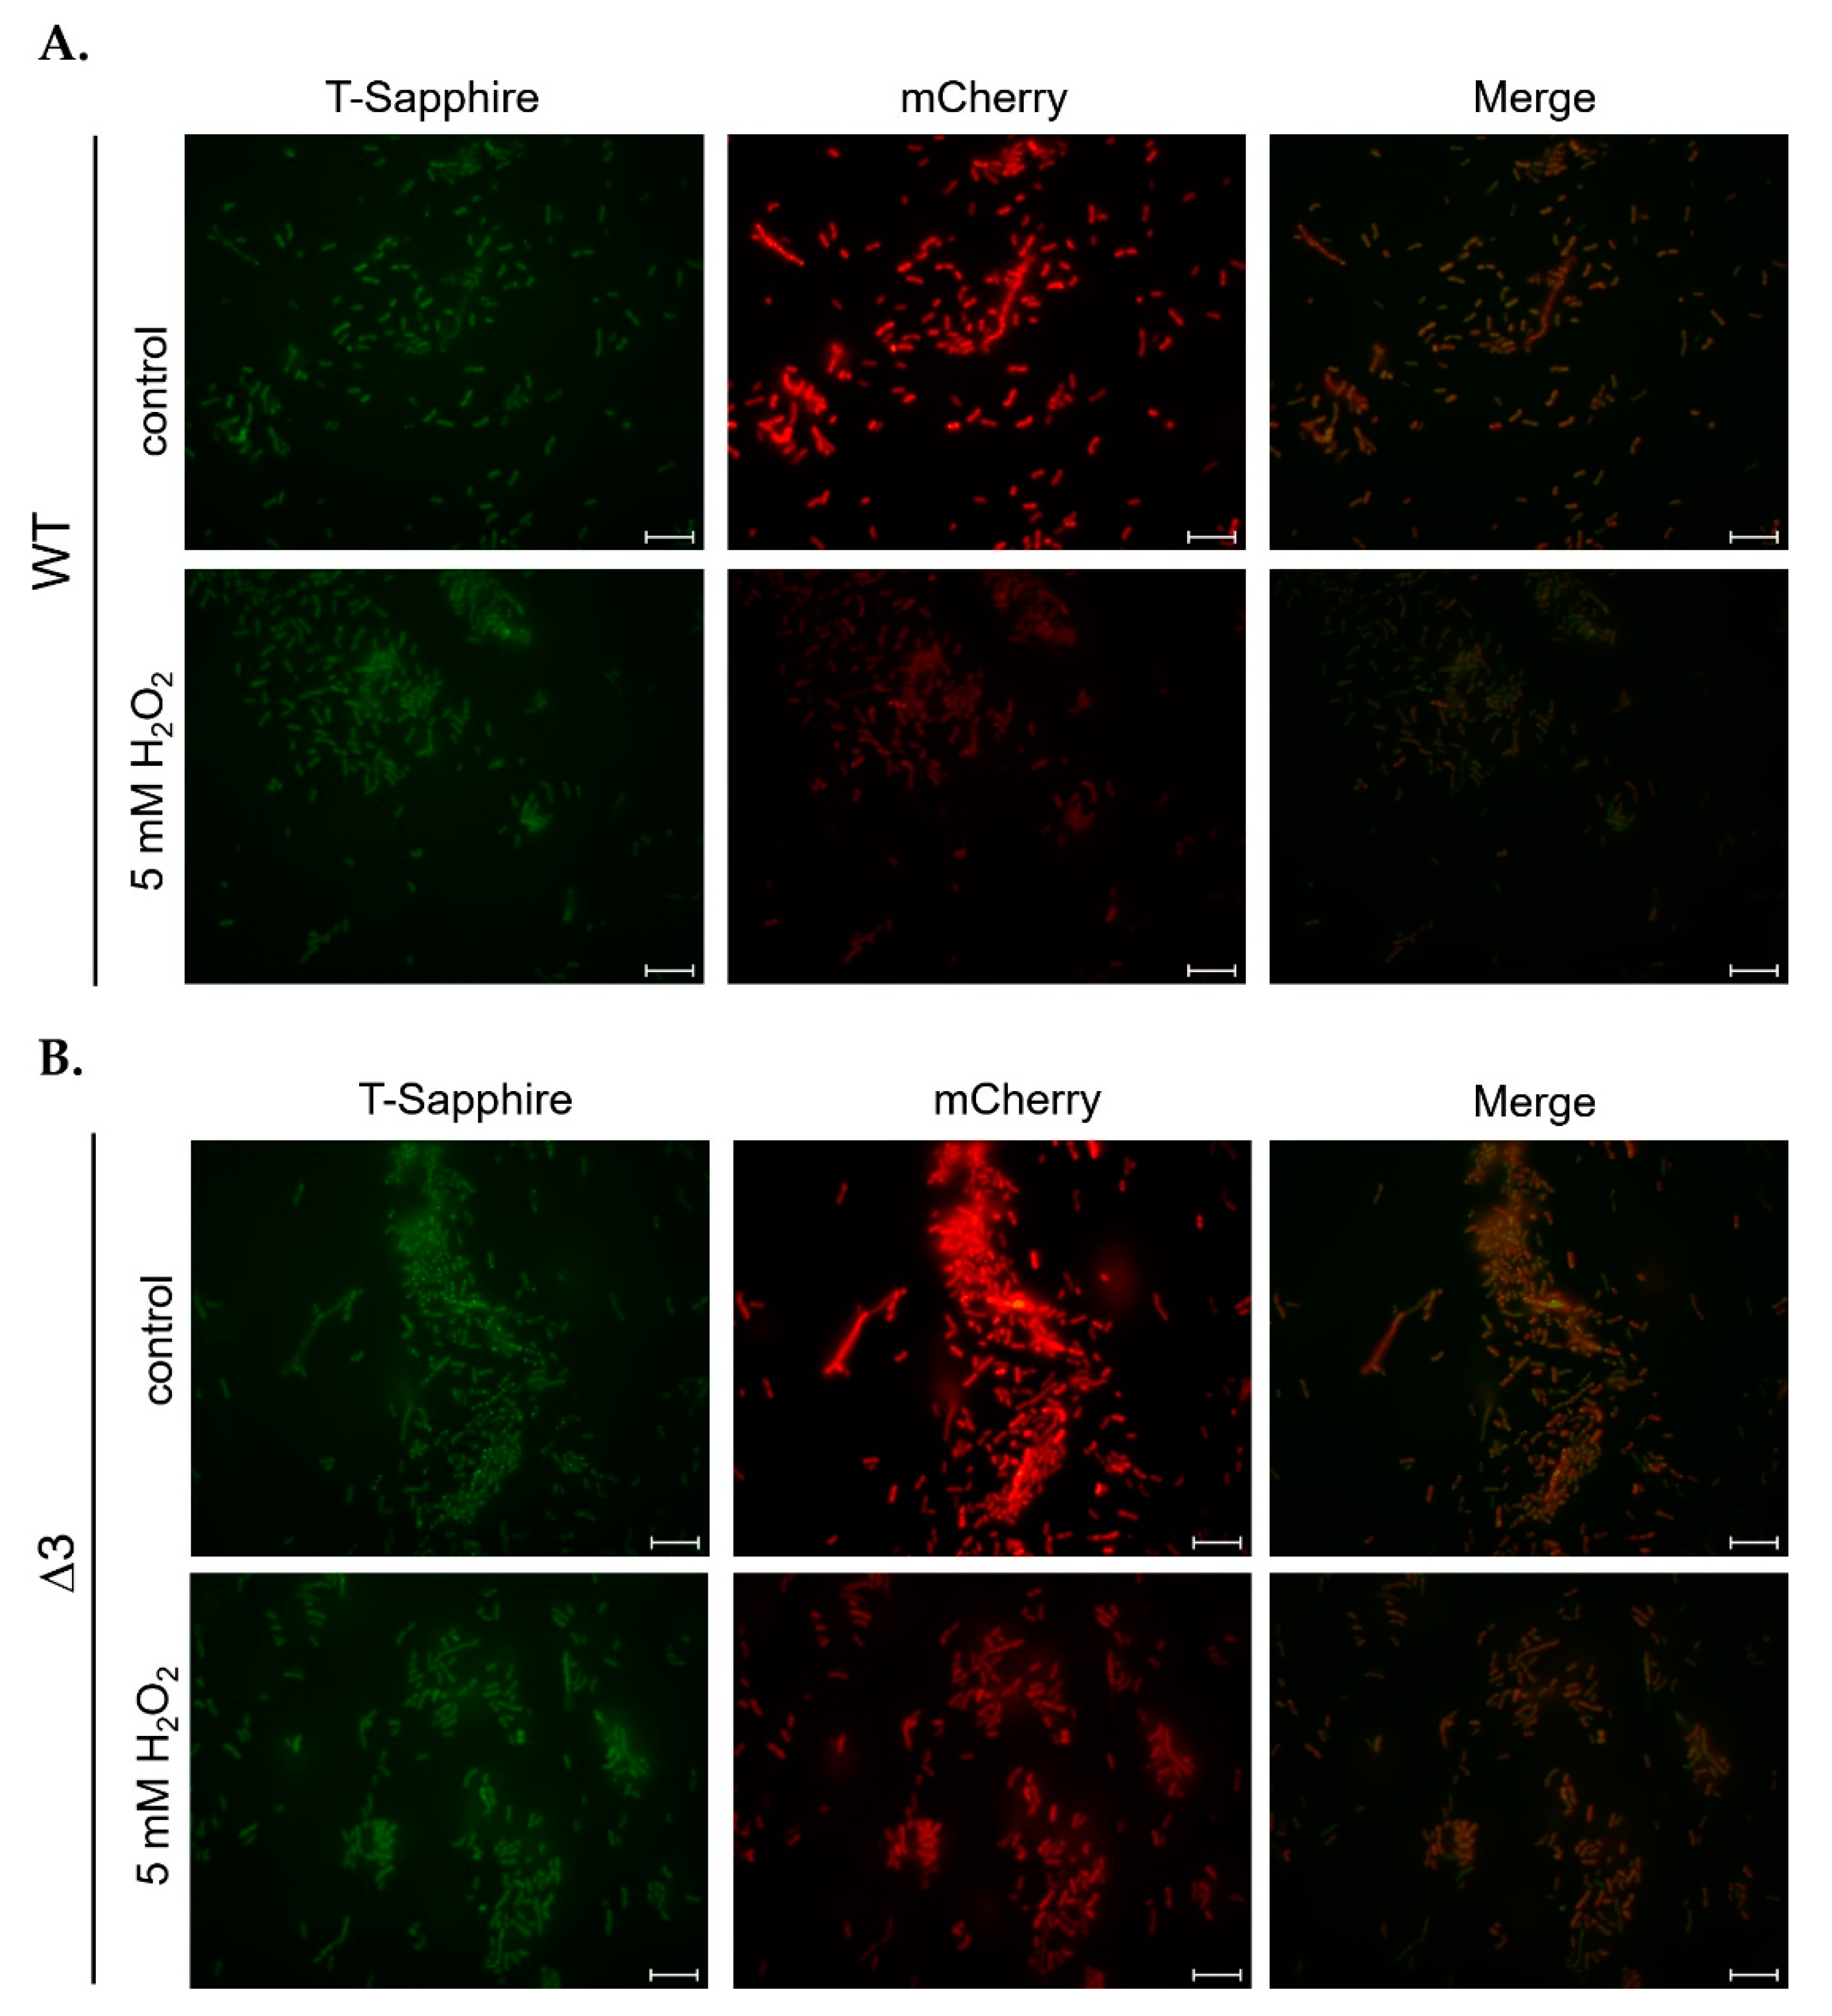
2.6. The Adh3 Stress Resistance Response Does Not Disrupt Homeostasis of Cytosolic NADH/NAD+

To ascertain if any ADHs were involved in NADH/NAD+ homeostasis, the plasmid pWH1266-peredox-mCherry, containing a Peredox cassette, was transformed into wild-type and mutant strains for qualitative and quantitative fluorescence analysis. When transformed strains were treated with 5 mM H2O2 for 20 min, the intensity of mCherry fluorescence was reduced in both wild-type (Figure 8A) and Δ3 single mutant (Figure 8B) strains, indicative of reduced bacterial viability. However, the intensity of T-Sapphire fluorescence in both strains was unaffected by H2O2 treatment (Figure 8), and this indicates that the oxidative stress response mediated by ADHs does not impact the homeostasis of cytosolic NADH/ NAD+.

2.7. Adh3 and Adh6 Are Associated with Virulence against G. mellonella

Correlations between higher stress resistance and higher virulence have previously been reported for A. baumannii [17], and we sought to ascertain if ADHs were involved in virulence, using a common model organism, G. mellonella [15,18,19]. We injected 5 × 10⁶ CFU of wild-type and mutant strains into sets of 10 G. mellonella larvae, with PBS and heat-treated A. baumannii serving as controls (Figure 9). Kaplan–Meier survival curves showed that all 10 larvae injected with wild-type or Δ4 single mutant strains died within 24 h of injection, while all 10 PBS-injected larvae remained alive at 120 h post-injection (Figure 9A). Larvae injected with heat-treated A. baumannii experienced 70% less mortality at 120 h post-injection, and reduced mortality was also observed for the Δ36 double mutant, Δ34 double mutant, and Δ6 single mutant strains, which maintained >50% survival rates at 120 h post-injection (Figure 9A). Larvae injected with the Δ346 triple mutant strain also maintained a 40% survival rate at 120 h post-injection (Figure 9A). These results suggest that Adh3 and Adh6 likely contribute to virulence against G. mellonella. We also examined the melanization of G. mellonella larvae after injection, as this process is a key part of the insect response to bacterial infection, with melanin aggregation observable around microbes within the hemolymph. This is believed to promote pathogen killing. Melanization status was scored daily as shown in Figure 9C, with larvae that are white in color throughout the body scored as 0, those with dark spots on the head and tail scored as 1, those with dark lines appearing on the body scored as 2, those with dark lines across the entire body scored as 3, and those that appear fully darkened scored as 4. The highest melanization scores were observed in larvae injected with wild-type or Δ4 single mutant strains, in accordance with the survival results. However, larvae injected with other mutant strains exhibited similar levels of melanization as heat-treated A. baumannii (Figure 9B).

3. Discussion

In this study, we identified seven annotated Adh genes in A. baumannii ATCC 19606 following a search of GenBank, and further examined the roles of three FeADHs: ADH3, ADH4, and ADH6. We found that ADH4 played a key role in ethanol metabolism, as observed from substrate specificity assays (Table 1), viability assays in alcohol-containing medium (Figure 3), and gene expression patterns in the presence of ethanol (Figure 4); while ADH3 and ADH6 were mainly involved in the oxidative stress response and were associated with virulence, as seen in the results of oxidative stress assays (Figure 5), gene expression patterns in the presence of inorganic and organic hydroperoxides (Figure 6 and Figure 7), and G. mellonella virulence assays (Figure 9). The results suggest that ADHs may play a broad role in A. baumannii beyond ethanol metabolism, and regarding issues such as the potential role of ADH5 in complementing the oxidative stress response in the absence of ADH3 and ADH6 expression, the relatively low number of Adh genes annotated thus far in terms of the genome size of A. baumannii, and the roles of other non-iron-containing ADHs, further research is warranted.
Genomic and proteomic analysis of the three FeADHs examined in this study showed that the GGGS cofactor binding site motif (GGGSXXD) was conserved in all FeADHs [1,8], and four key iron-binding sites (D, H, H, H) and a key aspartic acid residue (D; located at position 39 in ADH3, position 46 in ADH4, and position 41 in ADH6) were also found in all three FeADHs (Figure 1B). The aspartic acid residue shows a preference for NAD+ as the cofactor, as this residue is replaced with glycine (G) in some FeADHs in other microorganisms [20,21], resulting in a shift to NADP+ as the preferred cofactor [22,23]. It has been suggested that the shorter side chain of glycine allows more space for the phosphate of NADP+ [1], while aspartic acid has a longer side chain that only allows space for NAD+ binding [24].
We found that A. baumannii was able to survive in medium containing only ethanol, 1-propanol, or 1-butanol as the sole energy source (Figure 3), and although ADH4 had higher affinity for ethanol (Table 1), enzymatic activity against 1-propanol and 1-butanol was also detected. This is consistent with findings for ADHs in other microorganisms, which typically have activity against most aliphatic alcohols [23,25,26], although some substrates may be preferred over others; however, there are also ADHs that have strong specificity for a particular alcohol [27,28]. A diverse range of enzymatic activity enables A. baumannii to survive under challenging conditions, make use of various energy sources, and demonstrate greater stress resilience overall.
Oxidative stress assays (Figure 5) and gene expression patterns in the presence of inorganic (Figure 6) and organic (Figure 7) hydroperoxides indicate that ADH3 and ADH6 have critical roles in the oxidative stress response, and this has been observed for ADHs in other microorganisms as well [10,16,29], some of which are also involved in the stress response to heat and other stressors [10,29]. ADHs have also been reported to be involved in bacterial biofilm formation [11], and Adh expression was shown to be upregulated in A. baumannii ATCC 17978 strains grown under biofilm conditions [11]. Biofilm formation can increase stress tolerance, but the exact role of ADHs in biofilm formation is unclear as yet. A recent study has shown that A. baumannii ADH may be involved in quorum sensing during biofilm formation, and the inhibition of ADH also reduced the expression of quorum sensing-related signalling [11]. However, it remains unclear whether ADH is driving the quorum sensing process, or merely acting as a feedback modulator; moreover, other functions of ADH during stress resistance and biofilm formation cannot be ruled out at present. Still, the results show that ADHs are critical to A. baumannii survival under oxidative stress conditions or in the presence of alcohol substrates, and it is possible that ADHs can serve as targets for the development of novel antiseptic or antibiotic strategies.
Previous research has shown that A. baumannii ATCC 17978 cells cultured in ethanol-containing medium subsequently demonstrated increased virulence against G. mellonella larvae [15], and the authors speculated that this virulence may be driven by increased production of indole acetic acid (IAA) during ethanol exposure by A. baumannii. If this is confirmed, it would be quite concerning, as ethanol-based disinfectants are routinely used in clinical settings. However, it is possible that this virulence may in fact be driven by increased Adh gene expression in response to oxidative stress induced by peroxide-based disinfectants or bleach, which are more widely applied in hospital environments and also persist longer on surfaces than volatile ethanol. Previous studies have found that the AdhE gene, which encodes a dual-function acetaldehyde-CoA and alcohol dehydrogenase, was upregulated in Streptococcus pneumoniae cultured in the presence of ethanol and subjected to oxidative stress, and this resulted in increased virulence against murine RAW 264.7 cells [12]; interestingly, ΔAdhE mutant strains demonstrated reduced pathogenicity and virulence [12], and this was also observed in E. coli O157:H7 [30]. In this study, we found that Adh3 and Adh6 were upregulated in response to oxidative stress (Figure 6 and Figure 7), and ΔAdh3 and ΔAdh6 mutant strains exhibited less virulence against G. mellonella larvae (Figure 9). Further research to elucidate the underlying mechanisms, as well as field studies to assess Adh3 and Adh6 expression in A. baumannii samples collected from clinical settings, could help to validate this association.
In conclusion, this study shows that FeADHs have diverse functions in A. baumannii beyond ethanol metabolism, being involved in oxidative stress responses and virulence, but different ADHs have varying primary functions. Further research into the additional functions of FeADHs in A. baumannii, as well as the roles of other ADHs, is warranted.

4. Materials and Methods

4.1. Bacterial Strains, Plasmids, and Primers

A. baumannii ATCC 19606 and Escherichia coli strains were cultured in LB medium at 37 °C with shaking, and solid cultures were grown on LB medium containing 1.5% agar. Mutant A. baumannii strains were grown in M9 media (33.7 mM Na2HPO4, 22 mM KH2PO4, 8.55 mM NaCl, 9.35 mM NH4Cl, 1 mM MgSO4, 0.3 mM CaCl2), a minimal microbial growth media to which 1% ethanol, 1% 1-propanol, 1% a-butanol, or 5 mM citrate (5 mM citrate medium) was added in accordance with experimental needs. The bacterial strains and plasmids used are presented in Table 3. The primers used in this study are presented in Table 2.

4.2. Marker-Less Mutation

Marker-less mutation was performed as previously described [31], with some minor modifications. Briefly, the adjacent regions of the Adh gene(s) intended for mutation were cloned into plasmid pk18mobsacB, and transformed into E. coli S17λπ to generate a donor strain for conjugation with A. baumannii. The E. coli donor strains and A. baumannii recipient strains were cultured in LB medium at 37 °C with shaking for 12 to 16 h, after which a 200 μL aliquot of donor bacterial cells was mixed with recipient A. baumannii cells at a 1:20 ratio. The mixed cells were spun down and washed with 60 μL of conjugation buffer (1% NaCl, 10 mM MgSO4) to remove traces of LB medium, and the cell pellet was resuspended in 60 μL of conjugation buffer, then spotted onto a membrane filter (47 mm diameter, mixed cellulose esters, A020H047A; Advantech MFS, Dublin, CA, USA) placed on top of 1.5% LB agar. After cultivation at 37 °C for 19 h, filters were washed with conjugation buffer to remove bacterial cells, which were spun down and resuspended in 200 μL of conjugation buffer, then plated to 1.5% LB agar plates containing 50 μg/mL of ampicillin and 50 μg/mL of kanamycin. The first homologous recombination event enables the E. coli donor plasmid, which contains a kanamycin-resistant gene, to be integrated into the bacterial chromosome of A. baumannii recipient cells. Successful recombinants were then cultivated in LB medium containing 20% sucrose but without kanamycin, thus inducing the A. baumannii recombinants to excise the sacB gene in a second crossover event, and thereby enabling the deletion of the target Adh gene(s). Deletion mutants were subsequently confirmed through PCR analysis.

4.3. Recombinant Alcohol Dehydrogenase Purification and Enzyme Activity Assay

Protein overexpression and purification methods were adapted from our previous study [31]. Briefly, putative A. baumannii Adh genes were cloned into plasmid pQE80L (Qiagen, Hilden, Germany), which was then transformed into E. coli DH5α for recombinant protein production. Ni-affinity chromatography was used for recombinant protein purification. Columns were charged with 1× charge buffer (5 mM NiSO4) for 50 min to enable Ni2+ binding with the column, after which columns were washed with 1× binding buffer (5 mM imidazole, 0.5 M NaCl, 20 mM Tris-HCl, pH = 7.9) for 50 min. Supernatants containing recombinant proteins were then passed through the column, after which the column was washed with 1× wash buffer (60 mM imidazole, 0.5 M NaCl, 20 mM Tris-HCl, pH = 7.9), and then bound proteins were eluted using 1X elute buffer (1 M imidazole, 0.5 M NaCl, 20 mM Tris-HCl, pH = 7.9). The soluble fraction was collected and passed through Amicon Ultra-15 Centrifugal Filter-10 kDa units (Merck Millipore, Burlington MA, USA) to eliminate proteins smaller than 10 kDA. Retained proteins were concentrated by adding 4× ADH storage buffer (320 mM Tris-HCl, pH = 7.4, 160 mM KCl) to a concentration of 1× and then centrifuging for 20 min at 4 °C, 4000× g, after which the supernatant was discarded and 1× ADH storage buffer was added, followed by centrifugation for 10 min at 4 °C, 4000× g. Concentrated proteins were divided into aliquots of 250 μL, to which 250 μL of 4×ADH storage buffer and 500 μL of 100% glycerol were added, and then divided into 200 μL aliquots for storage at −80 °C. Purified proteins were used in enzymatic assays as previously described [35]. The enzymatic assay reaction contained a final concentration of 80 mM buffer, 2 mM NAD+, 1 mM semicarbazide, and 100 µL of alcohol (ethanol, 1-propanol, or 1-butanol) in 1 mL. The OD340 for different protein concentrations was determined every 30 s for three minutes. Specific activity was determined according to the Beer-Lambert Law: Aλ = ελ × C × l, with Aλ representing the OD340 difference between the third and the first minutes; ελ = 6.22 mM−1cm−1, the coefficient of OD340; and C indicating the concentration of produced NADH. The production of 1 µmole of NADH was defined as 1 unit of ADH activity [36]. Three buffers with different pH conditions were used: Phosphate buffer (PB buffer; 80 mM Na2HPO4, 80 mM NaH2PO4, pH = 5.8–8), Tris-Cl (80 mM Tris-HCl, pH = 8–9.5) and carbonate-bicarbonate buffer (CB buffer; 80 mM Na2CO3, 80 mM NaHCO3, pH = 9.5–10.1).

4.4. Stress Resistance Assays

Single colonies of each strain were inoculated in 3 mL LB medium with corresponding antibiotics, which were cultured for 12–16 h at 37 °C with agitation. The overnight culture was refreshed with fresh medium to an OD600 of 0.1. Bacteria were treated with 5 mM H2O2 or 300 µM tert-butyl hydroperoxide (tert-BHP) for 20 min and 4% NaCl, and viable counts were then determined by dropping 5 µL of cultured medium on LB agar plates 6 times and calculating colony-forming units (CFU) after colonies formed on plates [37].

4.5. RNA Extraction and qRT-PCR

Bacterial cultures at an OD600 of 0.6 were collected and centrifuged, and pellets were treated with 0.1 volume of fix solution (5% acid/phenol, 95% ethanol), then centrifuged at 4 °C at 12,000× g for 10 min. Bacterial pellets were kept at −80 °C before RNA extraction. For RNA extraction, each pellet was suspended in 2 mL of Nucleozol (REF 740404.200, Macherey-Nagel, Düren, Germany) and processed according to the instruction manual provided by the manufacturer. The concentration of RNA was determined using a NanoDrop 2000c Spectrophotometer (Thermo Fisher Scientific, Waltham, MA, USA). DNA contamination was assessed by conducting PCR analysis on a 2 μL RNA sample, using DNA polymerase in the absence of reverse transcriptase. No PCR products were noted, indicating the absence of DNA in purified RNA samples. Following extraction, 2 µg of RNA from each sample was prepared for reverse transcription with 1× RTase buffer, 0.5 mM dNTP, 5 mM DTT, and 200 U of RTase (GScript RTase, MB305-0050, GeneDireX, Taoyuan, Taiwan), and placed at 50 °C for one hour. Quantitative RT-PCR was performed with 100 ng cDNA for each reaction. SYBR Green (PowerSYBR Green PCR Master Mix, cat no. 4367659, Thermo Fisher Scientific) was mixed with cDNA and the corresponding primers (see Table 2) for PCR in a LightCycler® 480 (Roche, Basel, Switzerland) [31].
To ascertain if Adh genes contribute to NADH/NAD+ homeostasis, the Peredox cassette from pRestB-His7tag-peredox-mCherry (Addgene, Watertown MA, USA), a fluorescent biosensor of the cytosolic NADH-NAD+ redox state [33,34], was inserted at an EcoRI restriction site into the pWH1266 shuttle vector of A. baumannii and E. coli, to form pWH1266-pereodox-mCherry. This plasmid was then transferred by electroporation at 1.8 kV, 200 W, 25 μF (MicroPulser; Bio-Rad, Hercules, CA, USA) into wild-type and mutant bacterial strains [32] to measure cytosolic NADH:NAD+ ratios. Following incubation at 37 °C for one hour, 200 μL of bacterial culture was spotted onto 1.5% LB agar plates containing 6.25 μg/mL of tetracycline, and plates were subsequently cultured at 37 °C for 12 to 16 h to select for successful transformants.

4.6. Fluorescence Analysis

Successful transformants harboring the pWH1266_peredox-mCherry plasmid were cultured in LB medium containing 6.25 μg/mL of tetracycline at 37 °C for 12 to 16 h until OD600 = 0.3, after which bacterial cells were concentrated by centrifugation. Cell pellets were resuspended in 300 μL of 0.9% NaCl, from which 50 μL of solution was taken and placed on a slide (1″ × 3″ microscope slides; FEA, Taipei, Taiwan), then mounted with a coverslip (22 mm × 22 mm; Paul Marienfeld, Lauda-Königshofen, Germany) and sealed around the edges using transparent nail polish. Fixatives were not used in this study. The slides were examined under an Eclipse E800 fluorescent microscope (Nikon, Tokyo, Japan), using red (G-2A filter; Ex 510–560/DM 575/BA 590) and green (B-2A filter; Ex 450–490/DM 505/BA 520) fluorescence filters, and at least three different views were captured for each sample.

4.7. Virulence Assay with G. mellonella

A virulence comparison was carried out with A. baumannii ATCC 19606 wild-type and Adh3, Adh4, and Adh6 single, double and triple mutants of each strain. All procedures were performed as previously described, with minor modifications [16]. Ten G. mellonella larvae were selected for the same total weight, and were kept in petri dishes without food prior to infection. Larvae were infected with 5 × 10⁶ CFU of each strain. Overnight cultures of each strain were washed twice with PBS (0.137 M NaCl, 2.7 mM KCl, 10 mM Na2HPO4, 1.8 mM KH2PO4), then diluted in PBS. Bacteria in 10 µL aliquots were injected into the hemocoel of each larva via the last left proleg by a Hamilton syringe. Infected larvae were incubated at 37 °C and scored for survival (alive/dead) every 24 h. Larvae were also scored for melanization over 96 h, according to a previously described scoring method [38].

4.8. Statistical Analysis

Data were analyzed using two-way ANOVA tests, with p < 0.05 denoting significance.

Supplementary Materials

The following are available online at https://www.mdpi.com/article/10.3390/ijms22189921/s1.

Author Contributions

Conceptualization, G.-H.L. and H.-Y.S.; methodology, G.-H.L. and H.-Y.S.; formal analysis, M.-C.H. and G.-H.L.; investigation, M.-C.H. and G.-H.L.; resources, G.-H.L.; data curation, M.-C.H. and G.-H.L.; writing—original draft preparation, H.-Y.S. and G.-H.L.; writing—review and editing, G.-H.L. and H.-Y.S.; visualization, M.-C.H. and G.-H.L.; supervision, G.-H.L.; project administration, G.-H.L. and H.-Y.S.; funding acquisition, G.-H.L. All authors have read and agreed to the published version of the manuscript.

Funding

This research was funded by the Buddhist Tzu Chi Medical Foundation, grant number TCMF-SP 110-02. The APC was funded by the Buddhist Tzu Chi Medical Foundation, grant number TCMF-SP 110-02.

Institutional Review Board Statement

Not applicable.

Data Availability Statement

The data presented in this study are available on request from the corresponding author. The data are not publicly available as the full dataset is undergoing analysis to guide future research and potential publications.

Conflicts of Interest

The authors declare no conflict of interest. The funders had no role in the design of the study; in the collection, analyses, or interpretation of data; in the writing of the manuscript, or in the decision to publish the results.

References

  1. Gaona-López, C.; Julián-Sánchez, A.; Riveros-Rosas, H. Diversity and Evolutionary Analysis of Iron-Containing (Type-III) Alcohol Dehydrogenases in Eukaryotes. PLoS ONE 2016, 11, e0166851. [Google Scholar] [CrossRef] [Green Version]
  2. Horinouchi, T.; Maeda, T.; Furusawa, C. Understanding and engineering alcohol-tolerant bacteria using OMICS technology. World J. Microbiol. Biotechnol. 2018, 34, 157. [Google Scholar] [CrossRef] [Green Version]
  3. Jörnvall, H.; Persson, B.; Jeffery, J. Characteristics of alcohol/polyol dehydrogenases. The zinc-containing long-chain alcohol dehydrogenases. Eur. J. Biochem. 1987, 167, 195–201. [Google Scholar] [CrossRef] [PubMed]
  4. Jörnvall, H. Medium- and short-chain dehydrogenase/reductase gene and protein families: MDR and SDR gene and protein superfamilies. Cell. Mol. Life Sci. 2008, 65, 3873–3878. [Google Scholar] [CrossRef] [PubMed] [Green Version]
  5. Persson, B.; Hedlund, J.; Jörnvall, H. Medium- and short-chain dehydrogenase/reductase gene and protein families: The MDR superfamily. Cell. Mol. Life Sci. 2008, 65, 3879–3894. [Google Scholar] [CrossRef] [PubMed] [Green Version]
  6. Jörnvall, H.; Persson, B.; Krook, M.; Atrian, S.; Gonzàlez-Duarte, R.; Jeffery, J.; Ghosh, D. Short-chain dehydrogenases/reductases (SDR). Biochemistry 1995, 34, 6003–6013. [Google Scholar] [CrossRef]
  7. Reid, M.F.; Fewson, C.A. Molecular characterization of microbial alcohol dehydrogenases. Crit. Rev. Microbiol. 1994, 20, 13–56. [Google Scholar] [CrossRef]
  8. Elleuche, S.; Antranikian, G. Bacterial group III alcohol dehydrogenases—Function, evolution and biotechnological applications. OA Alcohol 2013, 1, 3. [Google Scholar] [CrossRef] [Green Version]
  9. Radianingtyas, H.; Wright, P.C. Alcohol dehydrogenases from thermophilic and hyperthermophilic archaea and bacteria. FEMS Microbiol. Rev. 2003, 27, 593–616. [Google Scholar] [CrossRef]
  10. Vidal, R.; López-Maury, L.; Guerrero, M.G.; Florencio, F.J. Characterization of an Alcohol Dehydrogenase from the Cyanobacterium Synechocystis sp. Strain PCC 6803 That Responds to Environmental Stress Conditions via the Hik34-Rre1 Two-Component System. J. Bacteriol. 2009, 191, 4383–4391. [Google Scholar] [CrossRef] [Green Version]
  11. Zhang, K.; Yang, X.; Yang, J.; Qiao, X.; Li, F.; Liu, X.; Wei, J.; Wang, L. Alcohol dehydrogenase modulates quorum sensing in biofilm formations of Acinetobacter baumannii. Microb. Pathog. 2020, 148, 104451. [Google Scholar] [CrossRef]
  12. Luong, T.T.; Kim, E.-H.; Bak, J.P.; Nguyen, C.T.; Choi, S.; Briles, D.E.; Pyo, S.; Rhee, D.-K. Ethanol-induced alcohol dehydrogenase E (AdhE) potentiates pneumolysin in Streptococcus pneumoniae. Infect. Immun. 2015, 83, 108–119. [Google Scholar] [CrossRef] [Green Version]
  13. Bermudez, L.E.; Young, L.S.; Martinelli, J.; Petrofsky, M. Exposure to ethanol up-regulates the expression of Mycobacterium avium complex proteins associated with bacterial virulence. J. Infect. Dis. 1993, 168, 961–968. [Google Scholar] [CrossRef]
  14. Camarena, L.; Bruno, V.; Euskirchen, G.; Poggio, S.; Snyder, M. Molecular mechanisms of ethanol-induced pathogenesis revealed by RNA-sequencing. PLoS Pathog. 2010, 6, e1000834. [Google Scholar] [CrossRef] [PubMed] [Green Version]
  15. Nwugo, C.C.; Arivett, B.A.; Zimbler, D.L.; Gaddy, J.A.; Richards, A.M.; Actis, L.A. Effect of ethanol on differential protein production and expression of potential virulence functions in the opportunistic pathogen Acinetobacter baumannii. PLoS ONE 2012, 7, e51936. [Google Scholar] [CrossRef] [PubMed] [Green Version]
  16. Vidal, R. Alcohol dehydrogenase AdhA plays a role in ethanol tolerance in model cyanobacterium Synechocystis sp. PCC 6803. Appl. Microbiol. Biotechnol. 2017, 101, 3473–3482. [Google Scholar] [CrossRef]
  17. McConnell, M.J.; Actis, L.; Pachón, J. Acinetobacter baumannii: Human infections, factors contributing to pathogenesis and animal models. FEMS Microbiol. Rev. 2013, 37, 130–155. [Google Scholar] [CrossRef] [PubMed] [Green Version]
  18. Wand, M.E.; Bock, L.J.; Turton, J.F.; Nugent, P.G.; Sutton, J.M. Acinetobacter baumannii virulence is enhanced in Galleria mellonella following biofilm adaptation. J. Med. Microbiol. 2012, 61, 470–477. [Google Scholar] [CrossRef] [PubMed] [Green Version]
  19. Insua, J.L.; Llobet, E.; Moranta, D.; Pérez-Gutiérrez, C.; Tomás, A.; Garmendia, J.; Bengoechea, J.A. Modeling Klebsiella pneumoniae pathogenesis by infection of the wax moth Galleria mellonella. Infect. Immun. 2013, 81, 3552–3565. [Google Scholar] [CrossRef] [Green Version]
  20. Conway, T.; Sewell, G.W.; Osman, Y.A.; Ingram, L.O. Cloning and sequencing of the alcohol dehydrogenase II gene from Zymomonas mobilis. J. Bacteriol. 1987, 169, 2591–2597. [Google Scholar] [CrossRef] [Green Version]
  21. Goodlove, P.E.; Cunningham, P.R.; Parker, J.; Clark, D.P. Cloning and sequence analysis of the fermentative alcohol-dehydrogenase-encoding gene of Escherichia coli. Gene 1989, 85, 209–214. [Google Scholar] [CrossRef]
  22. Li, D.; Stevenson, K.J. Purification and sequence analysis of a novel NADP(H)-dependent type III alcohol dehydrogenase from Thermococcus strain AN1. J. Bacteriol. 1997, 179, 4433–4437. [Google Scholar] [CrossRef] [Green Version]
  23. Sulzenbacher, G.; Alvarez, K.; Van Den Heuvel, R.H.; Versluis, C.; Spinelli, S.; Campanacci, V.; Valencia, C.; Cambillau, C.; Eklund, H.; Tegoni, M. Crystal structure of E. coli alcohol dehydrogenase YqhD: Evidence of a covalently modified NADP coenzyme. J. Mol. Biol. 2004, 342, 489–502. [Google Scholar] [CrossRef]
  24. González-Segura, L.; Riveros-Rosas, H.; Julián-Sánchez, A.; Muñoz-Clares, R.A. Residues that influence coenzyme preference in the aldehyde dehydrogenases. Chem. Biol. Interact. 2015, 234, 59–74. [Google Scholar] [CrossRef] [PubMed]
  25. Williamson, V.M.; Paquin, C.E. Homology of Saccharomyces cerevisiae ADH4 to an iron-activated alcohol dehydrogenase from Zymomonas mobilis. Mol. Gen. Genet. 1987, 209, 374–381. [Google Scholar] [CrossRef] [PubMed]
  26. Wills, C.; Kratofil, P.; Londo, D.; Martin, T. Characterization of the two alcohol dehydrogenases of Zymomonas mobilis. Arch. Biochem. Biophys. 1981, 210, 775–785. [Google Scholar] [CrossRef]
  27. Ying, X.; Wang, Y.; Badiei, H.R.; Karanassios, V.; Ma, K. Purification and characterization of an iron-containing alcohol dehydrogenase in extremely thermophilic bacterium Thermotoga hypogea. Arch. Microbiol. 2007, 187, 499–510. [Google Scholar] [CrossRef] [PubMed]
  28. Tasaki, Y.; Yoshikawa, H.; Tamura, H. Isolation and characterization of an alcohol dehydrogenase gene from the octylphenol polyethoxylate degrader Pseudomonas putida S-5. Biosci. Biotechnol. Biochem. 2006, 70, 1855–1863. [Google Scholar] [CrossRef] [Green Version]
  29. An, H.; Scopes, R.K.; Rodriguez, M.; Keshav, K.F.; Ingram, L.O. Gel electrophoretic analysis of Zymomonas mobilis glycolytic and fermentative enzymes: Identification of alcohol dehydrogenase II as a stress protein. J. Bacteriol. 1991, 173, 5975–5982. [Google Scholar] [CrossRef] [Green Version]
  30. Beckham, K.S.H.; Connolly, J.P.R.; Ritchie, J.M.; Wang, D.; Gawthorne, J.A.; Tahoun, A.; Gally, D.L.; Burgess, K.; Burchmore, R.J.; Smith, B.O.; et al. The metabolic enzyme AdhE controls the virulence of Escherichia coli O157:H7. Mol. Microbiol. 2014, 93, 199–211. [Google Scholar] [CrossRef]
  31. Chen, S.J.; Shu, H.Y.; Lin, G.H. Regulation of tert-Butyl Hydroperoxide Resistance by Chromosomal OhrR in A. baumannii ATCC 19606. Microorganisms 2021, 9, 629. [Google Scholar] [CrossRef] [PubMed]
  32. Aranda, J.; Poza, M.; Pardo, B.G.; Rumbo, S.; Rumbo, C.; Parreira, J.R.; Rodríguez-Velo, P.; Bou, G. A rapid and simple method for constructing stable mutants of Acinetobacter baumannii. BMC Microbiol. 2010, 10, 279. [Google Scholar] [CrossRef] [Green Version]
  33. Hung, Y.P.; Albeck, J.G.; Tantama, M.; Yellen, G. Imaging cytosolic NADH-NAD(+) redox state with a genetically encoded fluorescent biosensor. Cell Metab. 2011, 14, 545–554. [Google Scholar] [CrossRef] [Green Version]
  34. Hung, Y.P.; Yellen, G. Live-cell imaging of cytosolic NADH-NAD+ redox state using a genetically encoded fluorescent biosensor. Methods Mol. Biol. 2014, 1071, 83–95. [Google Scholar] [CrossRef] [PubMed] [Green Version]
  35. Elleuche, S.; Fodor, K.; von der Heyde, A.; Klippel, B.; Wilmanns, M.; Antranikian, G. Group III alcohol dehydrogenase from Pectobacterium atrosepticum: Insights into enzymatic activity and organization of the metal ion-containing region. Appl. Microbiol. Biotechnol. 2014, 98, 4041–4051. [Google Scholar] [CrossRef]
  36. Uthoff, S.; Steinbüchel, A. Purification and characterization of an NAD+-dependent XylB-like aryl alcohol dehydrogenase identified in Acinetobacter baylyi ADP1. Appl. Environ. Microbiol. 2012, 78, 8743–8752. [Google Scholar] [CrossRef] [PubMed] [Green Version]
  37. Herigstad, B.; Hamilton, M.; Heersink, J. How to optimize the drop plate method for enumerating bacteria. J. Microbiol. Methods 2001, 44, 121–129. [Google Scholar] [CrossRef]
  38. Tsai, C.J.; Loh, J.M.; Proft, T. Galleria mellonella infection models for the study of bacterial diseases and for antimicrobial drug testing. Virulence 2016, 7, 214–229. [Google Scholar] [CrossRef] [Green Version]
Figure 1. (A) Cladogram of iron-containing Adh genes in A. baumannii compared with 23 other Adh genes from 14 organisms. The scale bar indicates the number of nucleotide substitutions per site. (B) Amino acid alignment of three FeADHs (ADH3, ADH4, ADH6) in A. baumannii. Δ indicates the positions of the four key iron-binding sites (D, H, H, H). Asterisks (*) indicate positions with single fully conserved amino acid residues; colons (:) indicate positions with conservation between residues of strongly similar properties (scoring > 0.5 in the Gonnet point accepted mutation 250 matrix); and periods (.) indicate positions with conservation between groups of weakly similar properties (scoring ≤ 0.5 in the Gonnet point accepted mutation 250 matrix).
Ijms 22 09921 g001aIjms 22 09921 g001b
Figure 2. (A) Optimum pH conditions for ADH4 enzymatic activity. ADH4 enzymatic activity was assessed at room temperature under the following pH ranges: Tris-Cl: pH = 5.8–8; PB, phosphate buffer: pH = 8–9.5; CB, carbonate-bicarbonate buffer: pH = 9.5–10.8. The production of 1 µmole of NADH was defined as 1 unit of ADH activity. (B) Optimum temperature of ADH4 enzymatic activity. ADH4 enzymatic activity was assessed for different temperatures at the optimum pH of 10.8 in CB buffer.
Ijms 22 09921 g002
Figure 3. Growth rates of wild-type (WT) or mutant strains in different medium. (A) Growth rates in LB medium. (B) Growth rates in M9 medium containing 1% ethanol. (C) Growth rates in M9 medium containing 1% 1-propanol. (D) Growth rates in M9 medium containing 1% 1-butanol.
Ijms 22 09921 g003
Figure 4. Relative gene expression of Adh genes in wild-type and mutant strains after culturing in medium with or without ethanol. The gyrase gene (A4U85_RS04125) was used as a control to calculate relative expression levels. Comparison of relative gene expression for A. baumannii ATCC 19606 (A) wild-type; (B) Δ3 single mutant; (C) Δ4 single mutant; (D) Δ6 single mutant; (E) Δ34 double mutant; (F) Δ36 double mutant; (G) Δ46 double mutant; and (H) Δ346 triple mutant strains cultured in M9 medium with 5 mM citrate (gray bar) or 5 mM citrate and 0.5% ethanol (black bar). Two-way ANOVA tests were conducted to assess statistical significance. ** p < 0.01; *** p < 0.001; **** p < 0.0001.
Ijms 22 09921 g004
Figure 5. Survival rates of wild-type or mutant strains treated with (A) 5 mM H2O2; or (B) 300 mM tert-BHP for 20 min. Two-way ANOVA tests were conducted to assess statistical significance. *** p < 0.001; **** p < 0.0001.
Ijms 22 09921 g005
Figure 6. Relative gene expression of Adh genes in wild-type and mutant strains after treatment with H2O2 for 20 min. Comparison of relative gene expression for A. baumannii ATCC 19606 (A) wild-type; (B) Δ3 single mutant; (C) Δ4 single mutant; (D) Δ6 single mutant; (E) Δ34 double mutant; (F) Δ36 double mutant; (G) Δ46 double mutant; and (H) Δ346 triple mutant strains cultured in M9 medium before (gray bar) and after 5 mM H2O2 treatment for 20 min (black bar). Two-way ANOVA tests were conducted to assess statistical significance. **** p < 0.0001.
Ijms 22 09921 g006
Figure 7. Relative gene expression of Adh genes in wild-type and mutant strains after treatment with tert-BHP for 20 min. Comparison of relative gene expression for A. baumannii ATCC 19606 (A) wild-type; (B) Δ3 single mutant; (C) Δ4 single mutant; (D) Δ6 single mutant; (E) Δ34 double mutant; (F) Δ36 double mutant; (G) Δ46 double mutant; and (H) Δ346 triple mutant strains cultured in M9 medium before (gray bar) and after 300 mM tert-BHP treatment for 20 min (black bar). Two-way ANOVA tests were conducted to assess statistical significance. **** p < 0.0001.
Ijms 22 09921 g007
Figure 8. Fluorescence analysis of A. baumannii ATCC 19606 (A) wild-type and (B) Δ3 single mutant with a Peredox plasmid. Here, mCherry fluorescence reflects bacterial viability, while T-Sapphire fluorescence reflects redox changes in bacteria. A total of 5 µL of bacterial culture before (control) and after 5 mM H2O2 treatment for 20 min were added to slides before observation, with mCherry images captured after 4 s of excitation at a wavelength of 587 nm, while T-Sapphire images were captured after 8 s of excitation at a wavelength of 400 nm. Scale bars: 10 µm.
Ijms 22 09921 g008
Figure 9. G. mellonella survival rates and melanization scores after infection with A. baumannii ATCC 19606 wild-type (WT) and mutant strains. (A) Kaplan–Meier survival curves, with each curve representing a single experiment performed with 10 larvae. (B) Melanization score curves. (C) Pictorial definition of melanization scores for reference. Larvae were infected with 5 × 10⁶ CFU of wild-type or mutant strains, with PBS used as the buffer and serving as a control. WT_heat indicates wild-type A. baumannii treated at 100 °C for 10 min.
Ijms 22 09921 g009
Table 1. Alcohol substrate specificity of ADH4.
Carbonate-Bicarbonate (CB) Buffer, pH = 10.1
Ethanol1-Propanol1-Butanol
Vmax (mmole min−1)0.0064 ± 0.00020.027 ± 0.00280.005 ± 0.001
KM (mM)5.11 ± 0.71206.8 ± 79.61196.5 ± 91.21
kcat (s−1)0.21180.90030.1683
kcat/KM (s−1M−1)41.44814.35350.8565
Table 2. Gene-specific primers used in this study.
NameSequences (5′–3′)Function
pK18_Adh3upFCGAGCTCGGTACCCGGGACGCCCTTTAACATGACCAGConstruction of Adh3 mutant
pK18_Adh3downRAACGACGGCCAGTGCCACAGATGCGCTAAGGGAAAACConstruction of Adh3 mutant
pK18_Adh4upFCGAGCTCGGTACCCGGGTGCCCTTCATTATCAATTTCGConstruction of Adh4 mutant
pK18_Adh4downRAACGACGGCCAGTGCCAGACATCGCTTTGAGTTGCATConstruction of Adh4 mutant
pK18_Adh6upFCGAGCTCGGTACCCGGGACGCACATTGGTCAGTTTTGConstruction of Adh6 mutant
pK18_Adh6downRAACGACGGCCAGTGCCATTGCTGCAACCATAACAGGTConstruction of Adh6 mutant
Adh1_rFTGTGATTGCCTGTGGTGAATqRT-PCR
Adh1_rRACACCGCCGTAAAGATGACTqRT-PCR
Adh2_rFGGTCGATTCATGCCGTACTTqRT-PCR
Adh2_rRTGTGGTAATACCCGCACAAAqRT-PCR
Adh3_rFTCAGTTACACCTGCCTATTCTTCAqRT-PCR
Adh3_rRCCCAAAGCCGACAATAACATqRT-PCR
Adh4_rFTGCAAGATGAAGGGCTATTTqRT-PCR
Adh4_rRCACCGCCTAACGACACAATAqRT-PCR
Adh5_rFGCCAGCAGATAAAGCGGATTqRT-PCR
Adh5_rRTGTTGCCCCATATACATTACCAqRT-PCR
Adh6_rFTCTGGTGCACACAACCTACCqRT-PCR
Adh6_rRTCTAAAATCGCAGCATGTGGqRT-PCR
Adh7_rFGGCGAAAATATCGCAACAATqRT-PCR
Adh7_rRACCCAAACCACCAATACCAAqRT-PCR
pRsetB-His7-Peredox-mCherry_FGCCCTTTCGTCTTCAAGTAATACGACTCACTATAGGGConstruction of peredox plasmid
pRsetB-His7-Peredox-mCherry_RAGCTGTCAAACATGAGTCACTTGTACAGTTCGTCCAConstruction of peredox plasmid
Table 3. Plasmids and bacterial strains used in this study.
PlasmidDescriptionAntibiotic Resistance (µg/mL)Reference/Source
pK18mobsacBSuicide vector for homologous recombination Kan50[31]
pK18ΔAdh1pK18mobsacB contains the upstream and downstream regions of Adh1Kan50This study
pK18ΔAdh2pK18mobsacB contains the upstream and downstream regions of Adh2Kan50This study
pK18ΔAdh3pK18mobsacB contains the upstream and downstream regions of Adh3Kan50This study
pK18ΔAdh4pK18mobsacB contains the upstream and downstream regions of Adh4Kan50This study
pK18ΔAdh5pK18mobsacB contains the upstream and downstream regions of Adh5Kan50This study
pK18ΔAdh6pK18mobsacB contains the upstream and downstream regions of Adh6Kan50This study
pK18ΔAdh7pK18mobsacB contains the upstream and downstream regions of Adh7Kan50This study
pQE80LExpression vector with colE1 origin for His-tag fusion protein purificationAmp50Qiagen
pAdh3Apr; Adh3 cloned into BamHI-HindIII sites of pQE80LAmp50This study
pAdh4Apr; Adh4 cloned into BamHI-HindIII sites of pQE80LAmp50This study
pAdh6Apr; Adh6 cloned into BamHI-SmaI sites of pQE80LAmp50This study
pWH1266Apr; Tcr; shuttle vector for E. coli and A. baumanniiAmp50, Tc12.5[32]
pRsetB-His7tag- Peredox-mCherryApr; fluorescent biosensor of the cytosolic NADH/NAD+ redox state by combining a circularly permuted GFP T-Sapphire with a bacterial NADH-binding protein, Rex, and the red fluorescence of a tandemly attached mCherry.Amp50[33,34]
pWH1266_peredox-mCherryApr; Tcr; permuted GFP T-Sapphire with a bacterial NADH-binding protein, Rex, and the red fluorescence of a tandemly attached mCherry from pRsetB-His7tag- Peredox-mCherry was cloned into EcoRI sites of pWH1266Amp50, Tc12.5This study
StrainDescriptionReference/Source
E. coli DH5αF, supE44, hsdR17, recA1, gyrA96, endA1, thi-1, relA1, deoR, λATCC53868
Acinetobacter baumannii ATCC 19606Primary strain used in this study[31]
Adh3(∆3)Marker-less Adh3 deletion mutantThis study
Adh4(∆4)Marker-less Adh4 deletion mutantThis study
Adh6(∆6)Marker-less Adh6 deletion mutantThis study
Adh34(∆34)Marker-less Adh34 double deletion mutantThis study
Adh36(∆36)Marker-less Adh36 double deletion mutantThis study
Adh46(∆46)Marker-less Adh46 double deletion mutantThis study
Adh346(∆346)Marker-less Adh346 triple deletion mutantThis study
Amp: ampicillin; Kan: kanamycin.
Publisher’s Note: MDPI stays neutral with regard to jurisdictional claims in published maps and institutional affiliations.

