Article

Autophagy-Related Proteins Are Differentially Expressed in Adrenal Cortical Tumor/Pheochromocytoma and Associated with Patient Prognosis

Department of Pathology, Yonsei University College of Medicine, Seoul 03722, Korea
*
Author to whom correspondence should be addressed.
Int. J. Mol. Sci. 2021, 22(19), 10490; https://doi.org/10.3390/ijms221910490
Submission received: 7 July 2021 / Revised: 23 September 2021 / Accepted: 24 September 2021 / Published: 28 September 2021
(This article belongs to the Section Molecular Oncology)

Abstract

:
The aim of this research was to evaluate the expression and concomitant implications of LC3A, LC3B, beclin-1, and p62, which are key components of autophagy in human adrenal gland tumors. Tissue microarray was made for 321 cases of adrenal gland tumor (adrenal cortical adenoma (ACA): 115, adrenal cortical carcinoma (ACC): 17, and pheochromocytoma (PCC): 189). Immunohistochemical staining was performed for beclin-1, p62, LC3A, and LC3B, and the results were compared with the patients’ clinicopathologic parameters. LC3A, LC3B, beclin-1, and LC3B isolated single positive cells (ISPC) positivity rates were higher in PCC than in adrenal cortical tumor (ACT), whereas p62 positivity was lower in PCC than in ACT. The proportion of positive LC3B (ISPC) was higher in ACC than in ACA. In addition, the proportion of cells positive for p62 and LC3B (ISPC) was significantly higher in PCCs with a GAPP score of ≥3. In univariate Cox analysis, p62 positivity (p = 0.014) and the presence of p62 (ISPC) (p = 0.001) were associated with shorter disease-free survival in PCC. Moreover, p62 positivity was predictive of shorter overall survival (OS) in patients with PCC by multivariate analysis (relative risk, 6.240; 95% CI, 1.434–27.15; p = 0.015). Differences were found in the expression of autophagy-related proteins according to adrenal gland tumor types. Compared to ACT, the proportion of LC3A, LC3B, beclin-1, and LC3B (ISPC) positivity was higher in PCC, whereas p62 positivity was lower. Similarly, p62 positivity in PCC was associated with patient prognosis of OS.

1. Introduction

Adrenal gland tumors are typically categorized into adrenal cortical tumors (ACTs), originating from the adrenal cortex, and pheochromocytomas (PCCs), which occur in the adrenal medulla. ACT is a relatively rare tumor and is classified into adrenal cortical adenoma (ACA) and adrenal cortical carcinoma (ACC), with histological differential diagnosis between the two being a difficult task. ACC is a particularly rare tumor associated with extremely poor prognosis due to the absence of effective target modalities and the fact that most of the tumor biology is still largely unknown. However, the distinction between benign and malignant PCC based on histological findings is quite challenging, and malignant PCC can be confirmed only when distant metastasis occurs. Consequently, there is an unmet clinical need to discover histopathologic features that could predict prognosis in adrenal gland tumors.
Autophagy is defined as the physiologic process of lysosomal degradation of cellular components. Autophagy plays an important homeostatic role by removing unnecessary and/or dysfunctional cellular components and reusing essential cellular components [1,2,3,4]. Among the various indicators to evaluate autophagy process, protein markers used to evaluate the activity of autophagy contain: beclin-1 [5,6,7,8], which takes part in nucleation; LC3 [9,10,11], which contributes to the formation of the autophagosome by participating in elongation; p62 [12,13], a scaffold protein that transports ubiquitinated proteins to the autophagosome; and BNIP-3 [14], a mitochondrial autophagy (mitophagy) regulator. Increasing results indicate that autophagy is related to tumor biology and may act as a tumor behavior. In the case of high-grade malignant tumors that are characterized by increased metabolic demand, angiogenesis and/or aerobic glycolysis alone may not be able to meet the metabolic demand of tumor cells. In these circumstances, malignant cells derive energy by recycling cytoplasmic components through autophagy as an alternative [15,16]. Meanwhile, unrestrained autophagy can cause progressive consumption of cellular constituents, leading to cell death [17,18]. Therefore, autophagy can theoretically contribute to both tumor progression and suppression; however, there is a lack of detailed research about the expression of autophagy-related proteins in adrenal gland tumors. The aim of this study was to investigate the expression and implication of key autophagy components, LC3A, LC3B, beclin-1, and p62, in human adrenal gland tumors.

2. Materials and Methods

2.1. Patient Selection

Patients at Severance Hospital diagnosed with ACT or PCC after completing surgical removal between January 2000 and December 2013 were consecutively included. Surgical specimens were reviewed retrospectively by an expert endocrine pathologist (Koo JS and Kim HM), and histologic evaluation was conducted using H&E–stained slides. Clinical and pathologic data were also retrospectively collected from the patients’ electronic medical records, which included sex, age at diagnosis, local recurrence, distant metastasis, patient death, and the length of follow up. This study was approved by the Institutional Review Board of Yonsei University Severance Hospital (9 March 2021; 4-2021-0028), which exempted informed consent from patients.

2.2. In Silico Analysis

We searched the gene expression database of normal and tumor tissues (GENT2), a web-accessible database, to compare beclin-1 and LC3A expression patterns in adrenal gland tumor and normal tissues in 20 March 2021 (http://gent2.appex.kr/gent2/). Additionally, we used the web-accessible database cBioPortal in 20 March 2021 (http://www.cbioportal.org) to investigate MAP1LC3A gene alterations in adrenal gland tumor tissues (Figure S1).

2.3. Tissue Microarray

For the creation of tissue microarray, typical areas on H&E slides were selected and the corresponding area was marked on the corresponding paraffin block. Three-millimeter cores were selected from the marked area and placed into a 6 × 5 recipient block. Two tissue cores were selected to avoid selection bias. Each core was randomly assigned into a unique location number linked to clinical and pathologic data.

2.4. Immunohistochemistry

Commercial antibodies used in this study are itemized in Table S1. Immunohistochemical staining was conducted with formalin-fixed, paraffin-embedded tissue sections by an automatic staining system (Benchmark XT, Ventana Medical System, Tucson, AZ, USA) according to the manufacturer’s instructions. Negative control tissue was stained in the absence of primary antibodies and the positive control sample was selected as recommended and counterstained with Harris hematoxylin.

2.5. Interpretation of Immunohistochemical Staining

Beclin-1, p62, LC3A, and LC3B stained slides were identified via light microscopy and were assessed semi-quantitatively across the entire tumor area as previously described [19]. Briefly, the staining score was determined as 0: negative or weak expression in less than 1%, 1: focal expression in 1–10%, 2: positive staining in 11–50%, and 3: positive staining in 51–100%. We defined scores of 0–1 as negative, and a score of 2 and 3 as positive.

2.6. Statistical Analysis

Clinical, pathological, and immunohistochemical results were analyzed by SPSS, version 21.0 (released 2012; IBM Corp., Armonk, NY, USA). To determine statistical significance, chi-squared and Fisher’s exact tests were adopted for categorical variables and a Student’s t-test was used for continuous variables. Kaplan-Meier curves were used to evaluate disease-free survival and overall survival. The difference of survival was determined by log-rank statistics. Multivariate analysis using the Cox proportional hazards model was applied. Statistical significance was determined as p < 0.05.

3. Results

3.1. Clinicopathologic Characteristics of Patients

For ACT, a total of 132 cases, 115 (87.1%) ACA and 17 (12.9%) ACC, were included. The clinicopathologic features of ACT patients are presented in Table S2. The clinical factors with significant differences between ACA and ACC were age (p = 0.048) and tumor size (p < 0.001). Factors included in the Weiss system were also significantly different between ACA and ACC (all p < 0.001, Table S2). On the other hand, the clinicopathologic features of 189 cases of PCC are presented in Table S3.

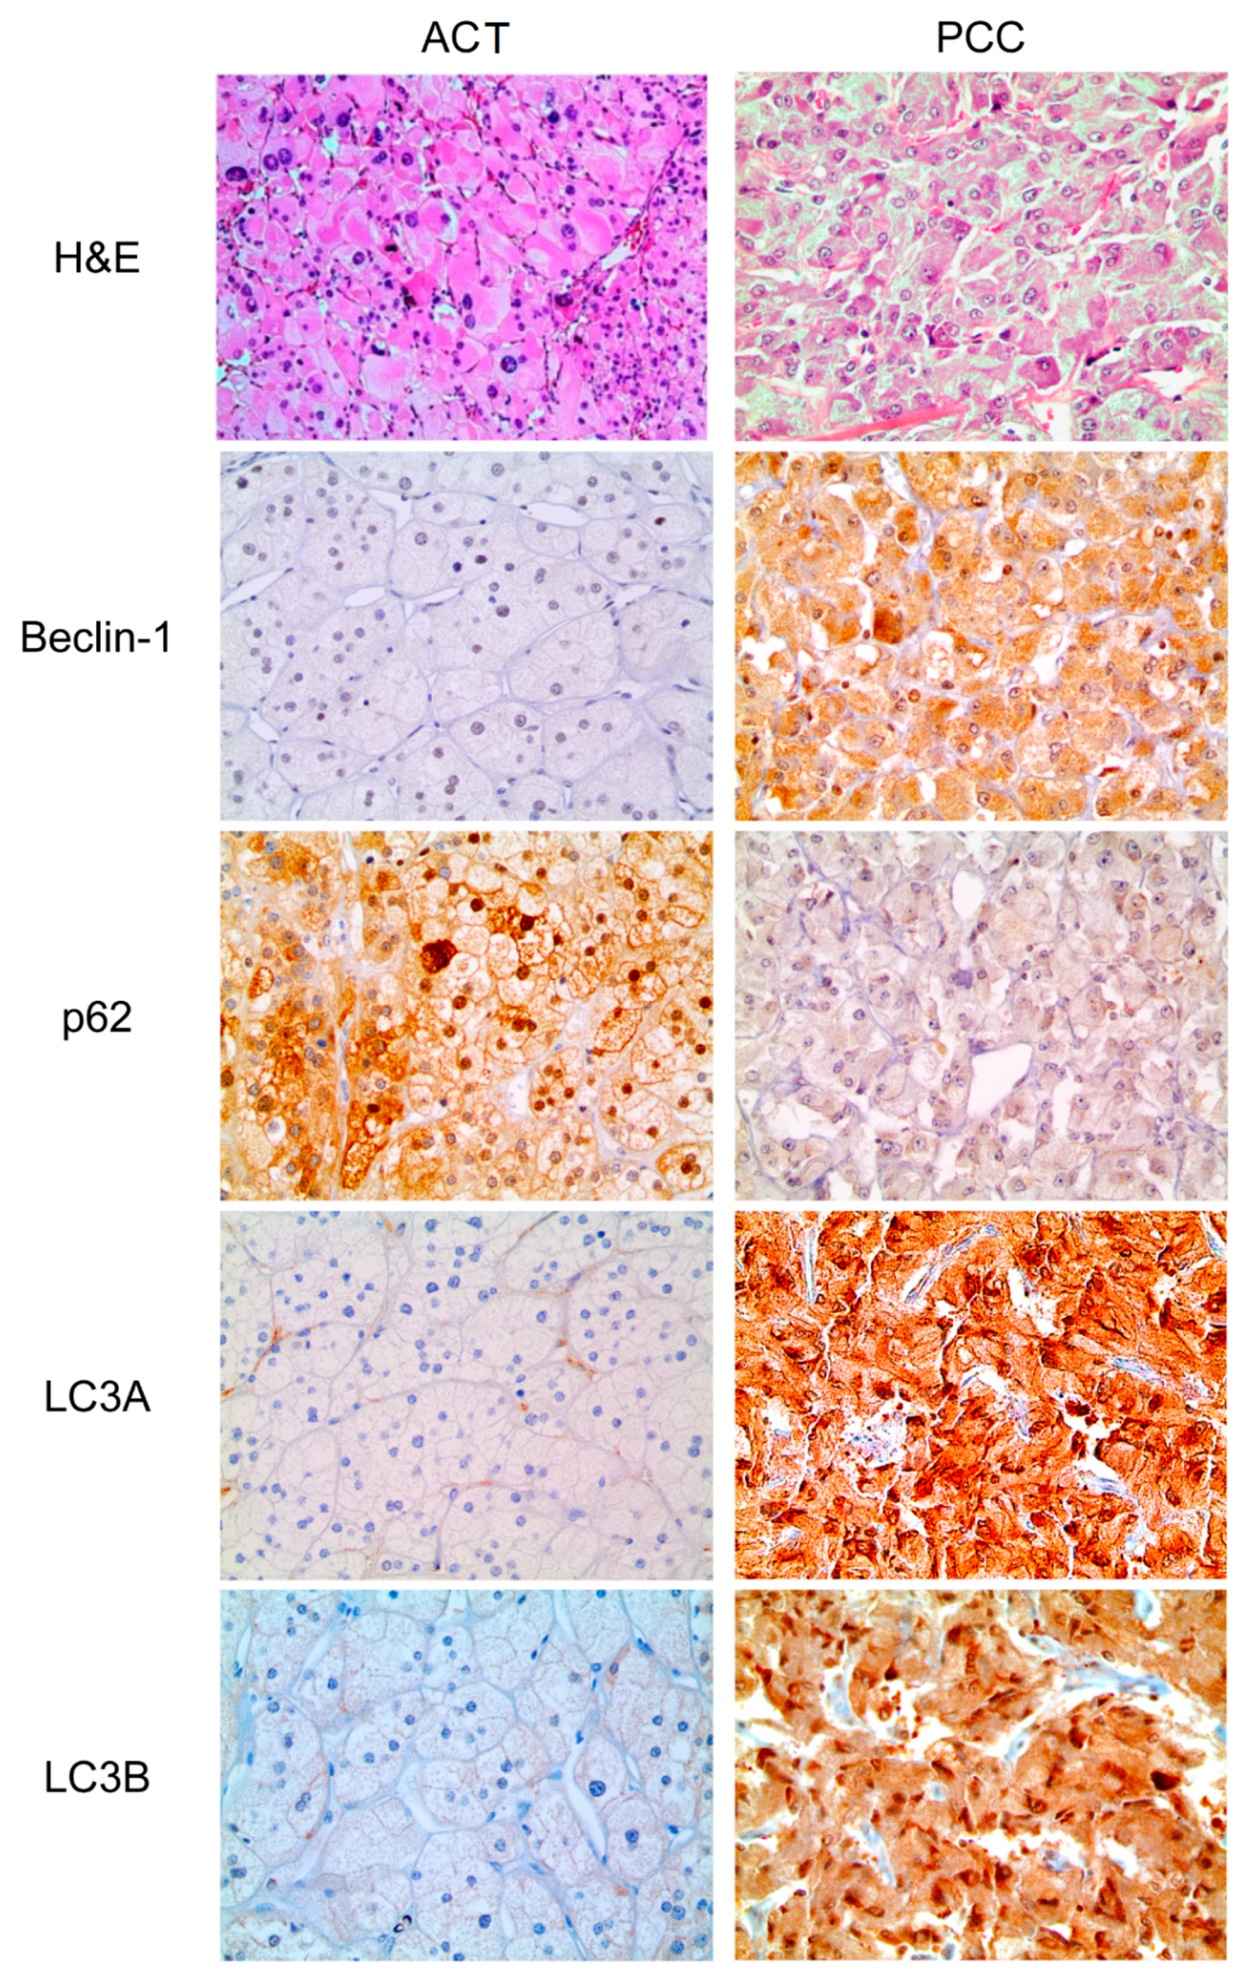
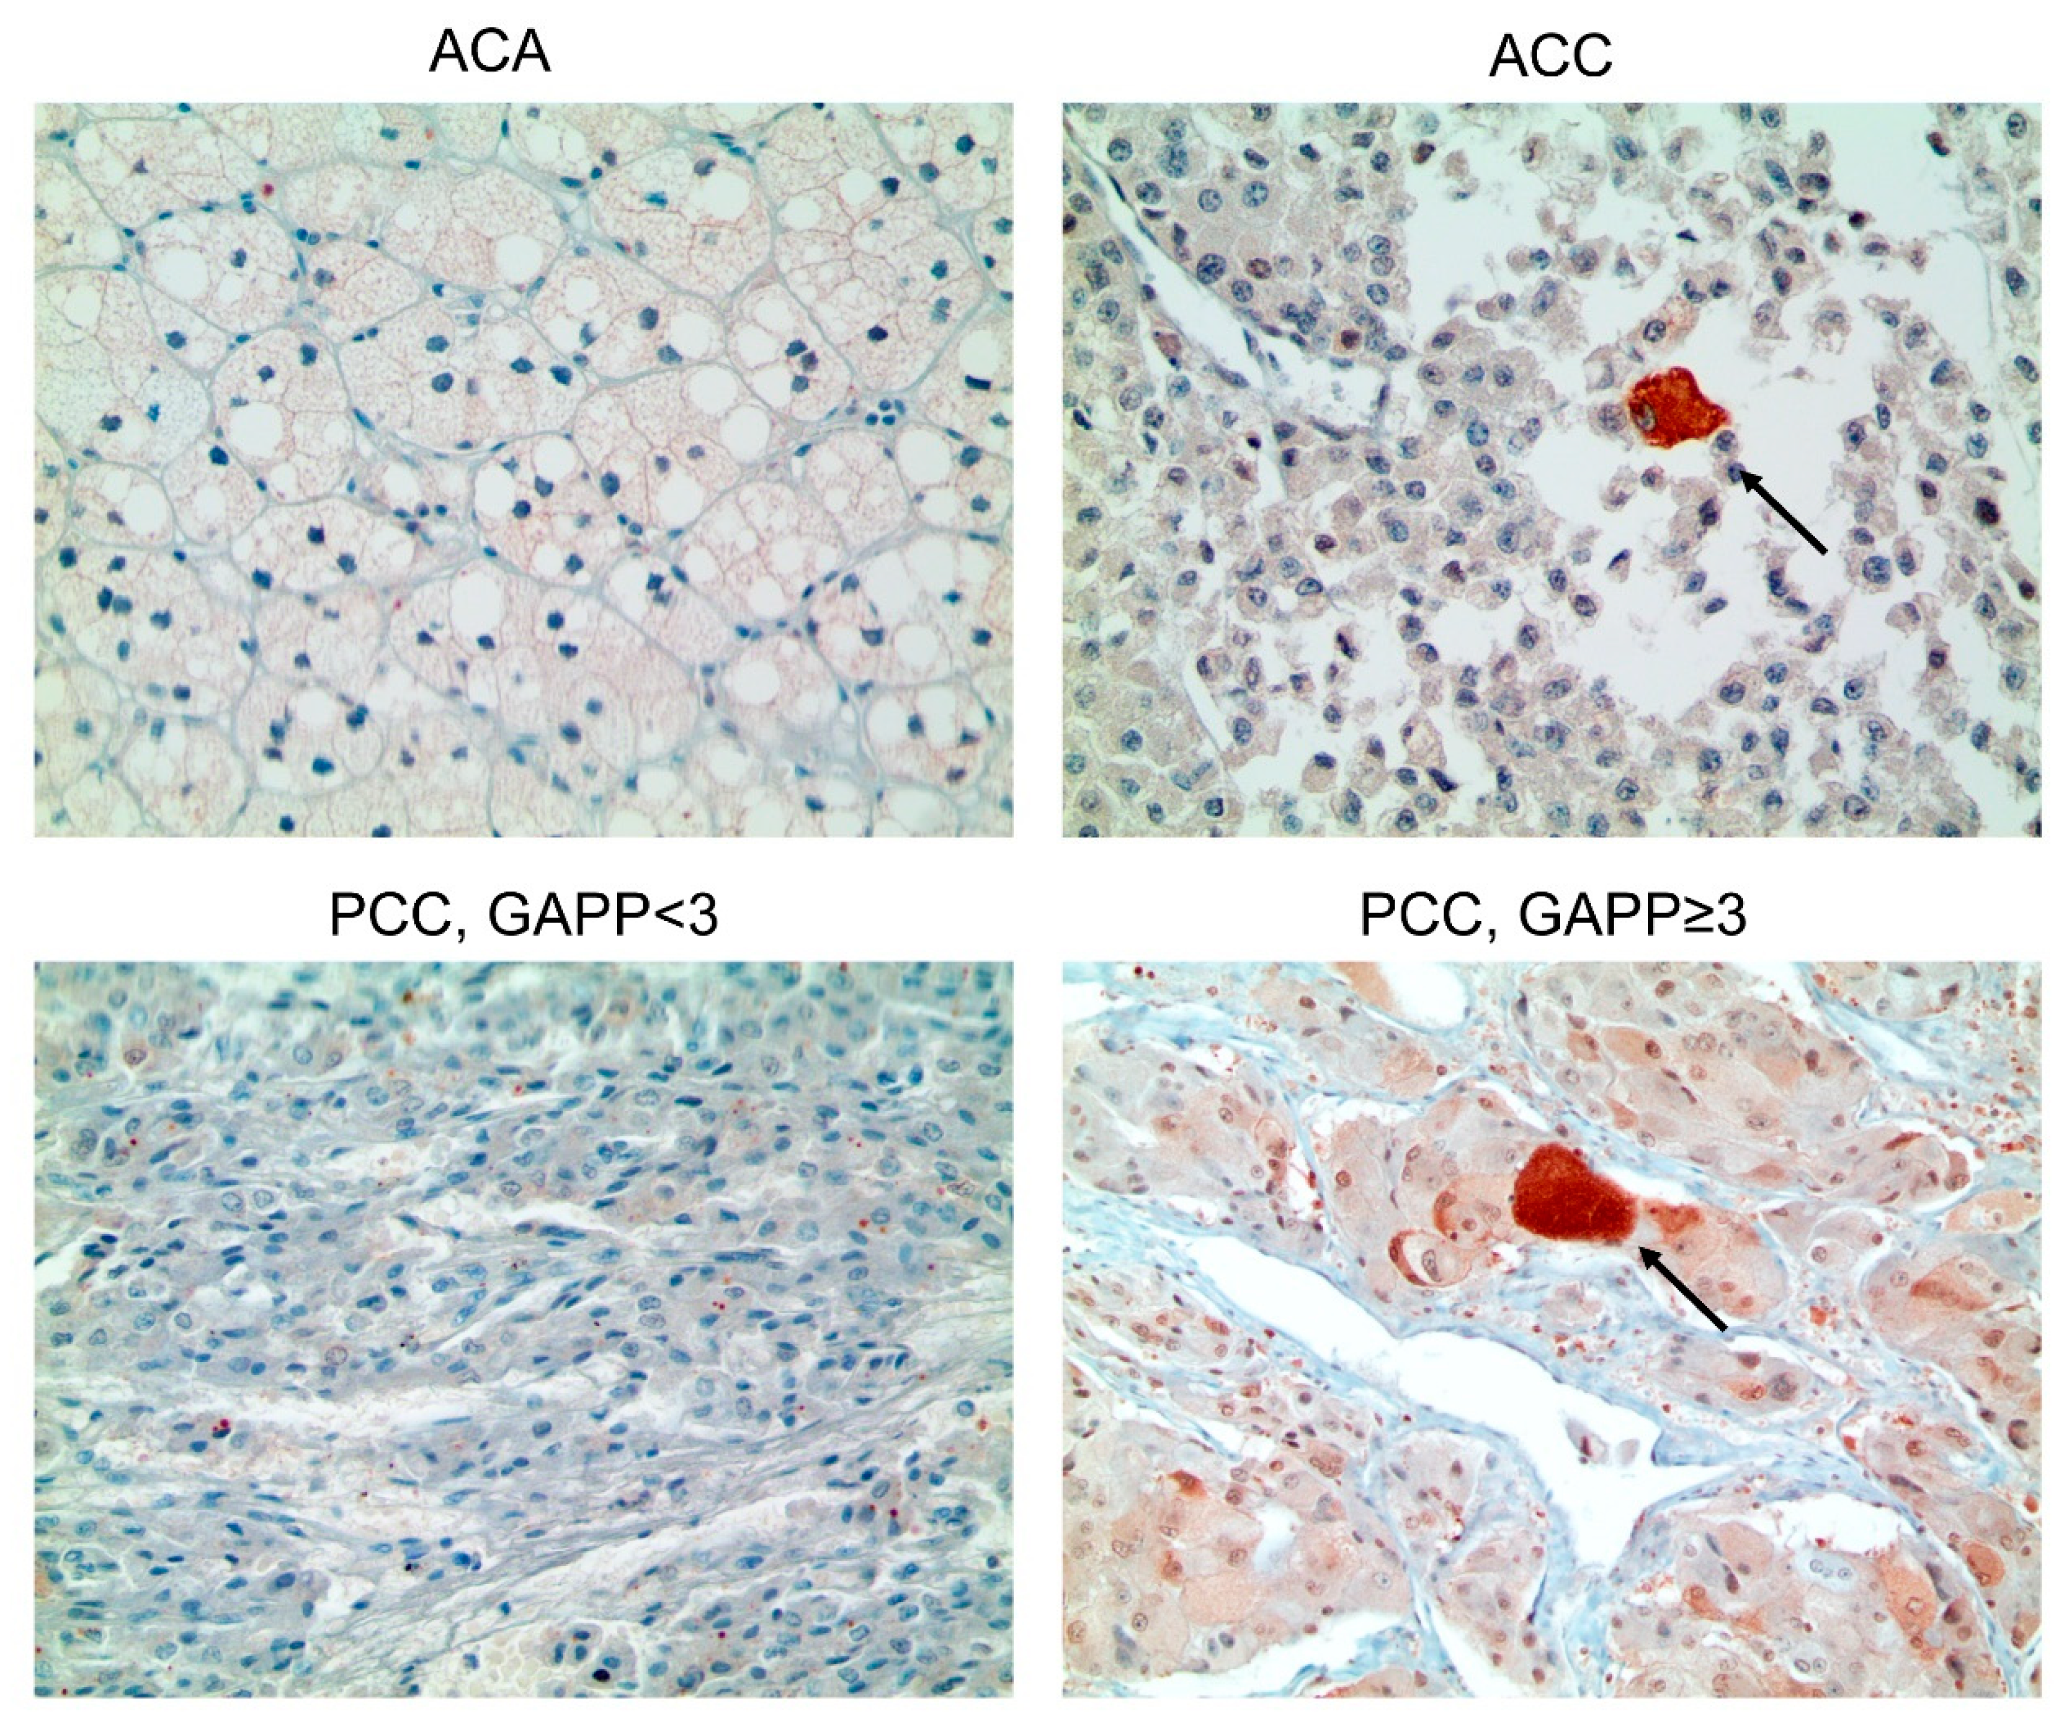
3.2. Expression of Autophagy-Related Proteins in ACT and PCC

In some cases, isolated single positive cells (ISPC) were observed for p62 and LC3B. Strong cytoplasmic expression was detected in one cell (Figure S2). Statistically significant differences were noted between ACT and PCC. The proportion of beclin-1 (p < 0.001), LC3A (p < 0.001), LC3B (p < 0.001), and LC3B (ISPC) (p = 0.010) positivity were higher in PCC than in ACT, whereas the proportion of p62 positive cells was lower in PCC than in ACT (p = 0.006) (Table 1 and Figure 1). A comparison of autophagy-related protein expression between ACA and ACC demonstrated that the proportion of positive LC3B (ISPC) was higher in ACC than in ACA (p = 0.027, Table 2 and Figure 2). The proportions of cells positive for p62 (p = 0.017) and LC3B (ISPC) (p = 0.013) were significantly higher in PCCs, with a GAPP score of ≥3 (Table 3 and Figure 2).

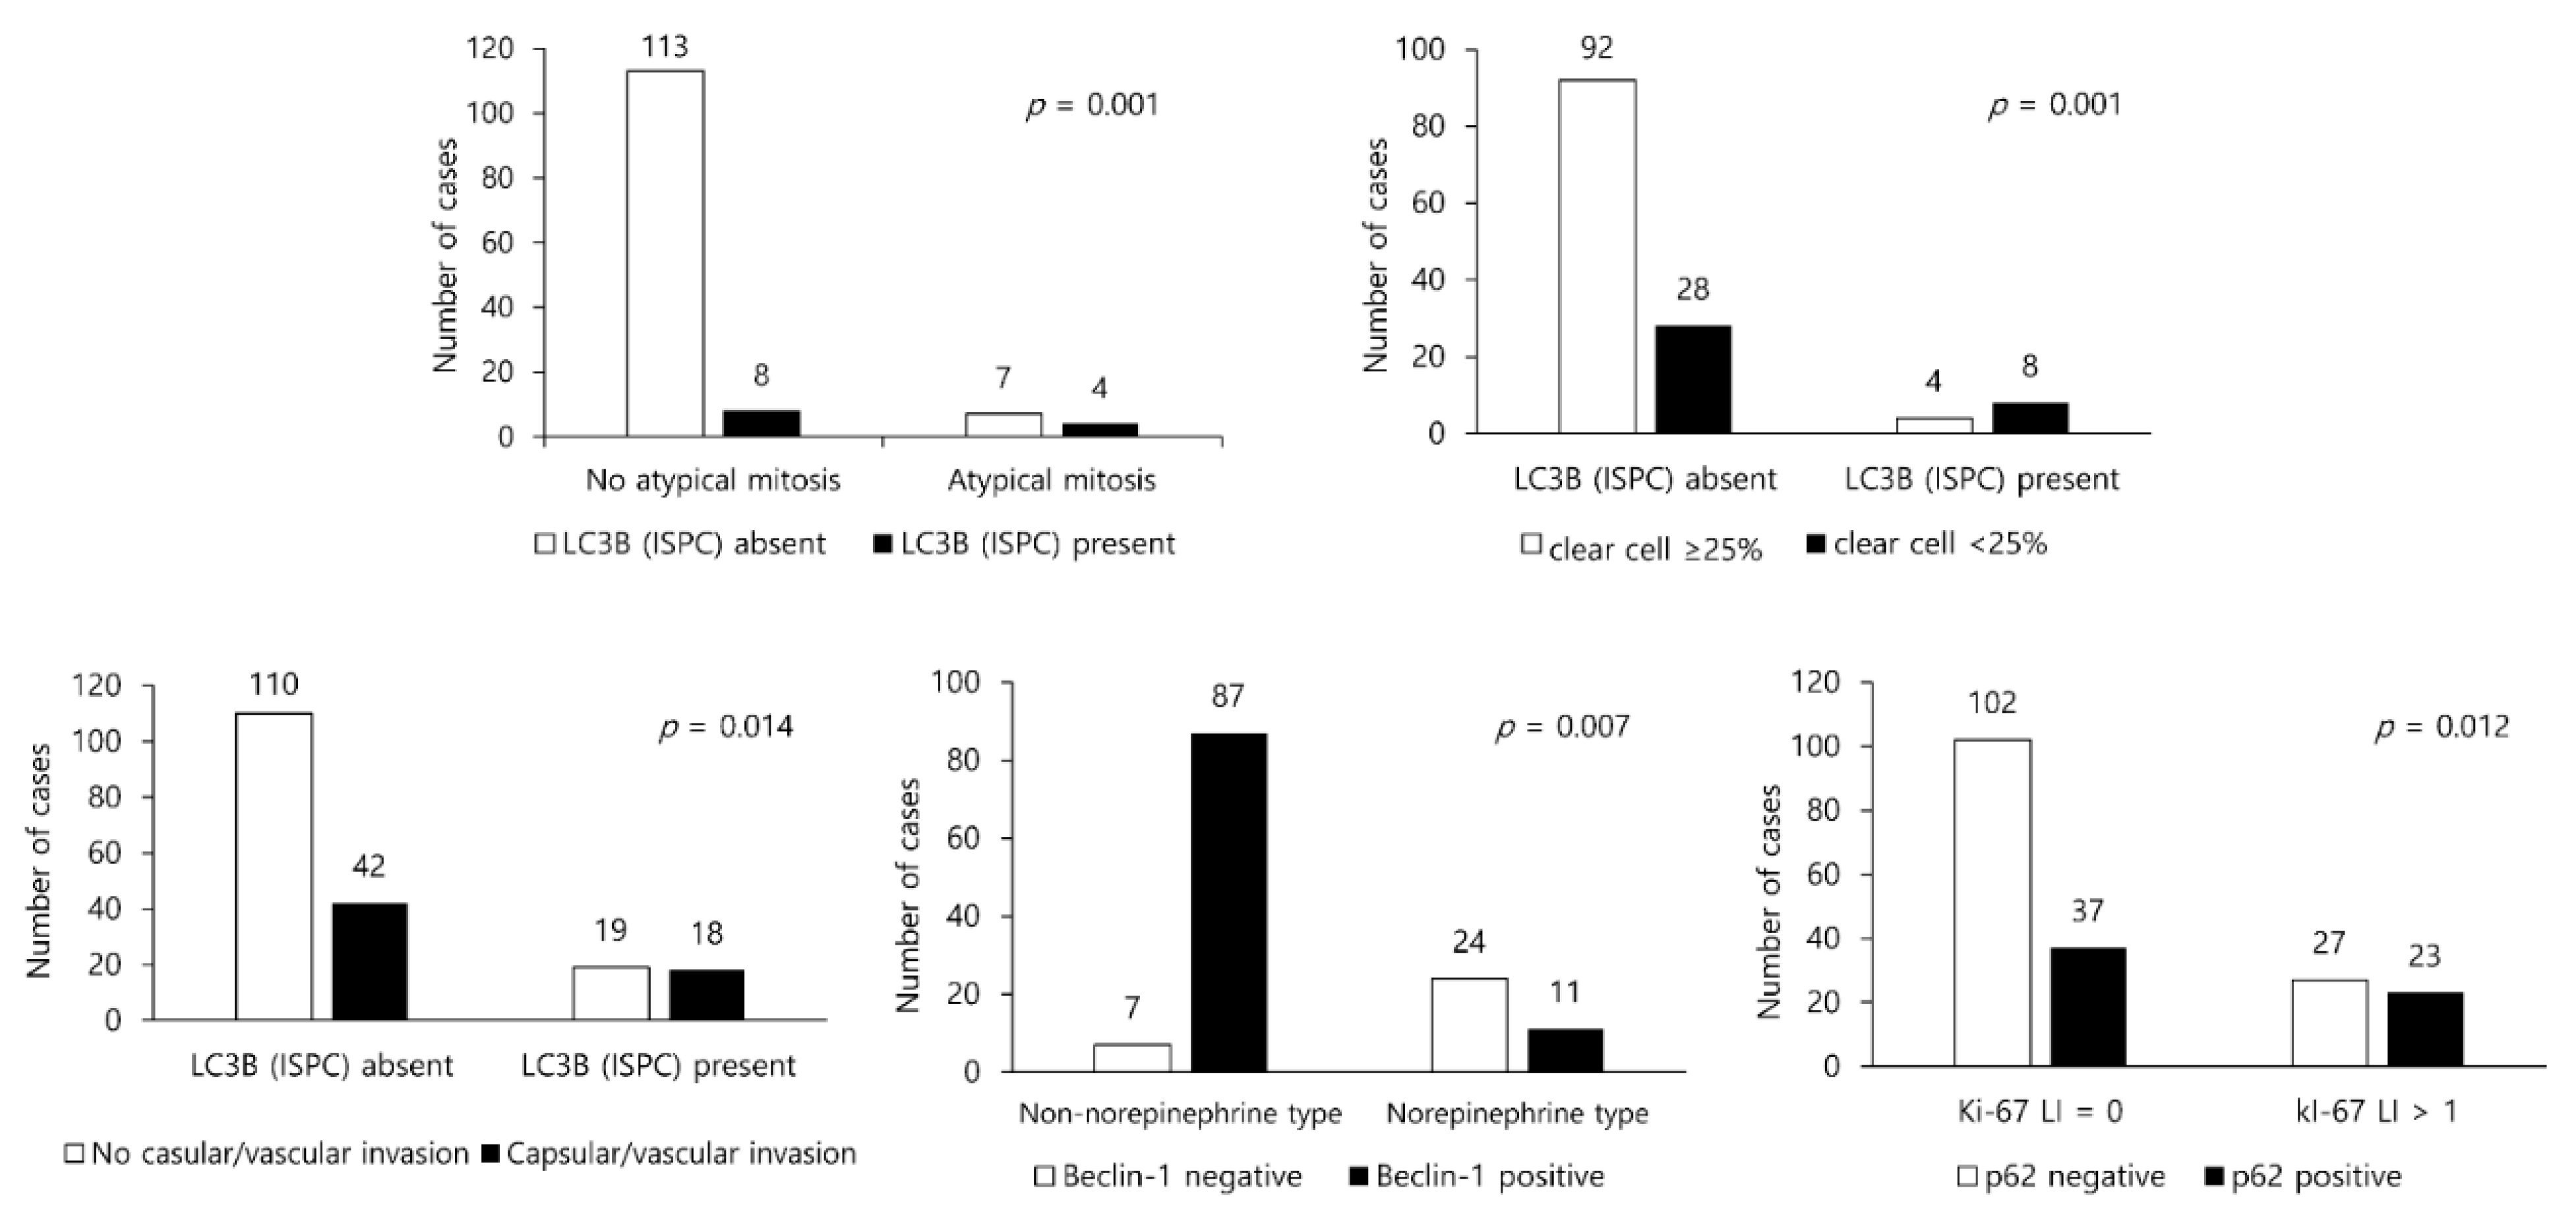
3.3. Presence/Absence of Clinicopathologic Factors in PCC/ACT and Expression of Autophagy-Related Proteins

In ACT, LC3B (ISPC) positivity was associated with atypical mitosis (p = 0.001) and clear cell proportion (p = 0.001). In the presence of positive LC3B (ISPC), the proportion of atypical mitosis and the incidence of clear cells being < 25% was significantly higher (Figure 3). In PCC, the number of cells positive for LC3B (ISPC) was significantly associated with capsular/vascular invasion (p = 0.014). Furthermore, beclin-1 positivity was associated with norepinephrine type (p = 0.007), whereas p62 positivity was related to Ki-67 labeling index (L.I.) >1 (p = 0.012). The capsular/vascular invasion ratio was high in the presence of positive LC3B (ISPC). Meanwhile, the ratio of non-norepinephrine type was higher when beclin-1 expression was positive, and the ratio of Ki-67 L.I. > 1 was found to be higher in the case of cells positive for p62 expression (Figure 3).

3.4. Impact of the Expression of Autophagy-Related Proteins on Patient Prognosis in PCC/ACT

In the univariate analysis, p62 positivity (p = 0.014) and the presence of p62 (ISPC) positive cells (p = 0.001) were associated with shorter disease-free survival (DFS) in PCC. Moreover, p62 positivity (p = 0.023) was associated with shorter overall survival (OS) (Table 4 and Figure 4). The multivariate Cox analysis revealed that none of the autophagy-related proteins were significantly associated with DFS, but p62 positivity was predictive of shorter OS (relative risk, 6.240; 95% CI, 1.434-27.15; p = 0.015, Table 5). There was no significant relationship between the expression of the assessed autophagy-related proteins and patient prognosis in ACT (Table 6).

4. Discussion

In this study, we evaluated the expression status of autophagy-related proteins in adrenal gland tumors. Autophagy is regarded as playing a crucial role in the adrenal gland during physiologic states, since it regulates the growth of adrenal cells in the zona fasciculata [20]. We found that, compared to ACT, the proportion of cells positive for beclin-1, LC3A, LC3B, and LC3B (ISPC) was higher in PCC, whereas p62 positivity was lower in PCC. Furthermore, among these proteins, p62 positivity was revealed to have prognostic significance in PCC, suggesting that identification of proteins involved in autophagy could have clinical relevance. This differential protein expression, according to the origin of adrenal gland tumors, could be relevant to a previous study that reported that autophagy exerts hormone-producing modulatory effects in steroid-secreting cells in the adrenal cortex, but not in the adrenal medulla, wherein the former exhibited characteristics similar to those of Leydig cells in the testis [21].
In the present study, the proportion of cells positive for LC3B (ISPC) was higher in ACC than ACA. Additionally, in PCC, it was associated with a GAPP score of over 3, the presence of atypical mitosis, and capsular/vascular invasion, all of which are clinical features indicating poor patient prognosis. In general, autophagy is understood as a cellular mechanism that degrades intracellular components and produces amino acids, nucleotides, fatty acids, sugars, and ATP by recycling proteins and organelles under oxidative stress [22,23]. However, newly emerging literature suggests that autophagy facilitates tumor progression, survival, and colonization in distant organs [24,25,26,27,28]. The recycling of intracellular components to supply metabolic substrates to overcome the stressful conditions of hypoxia or malnutrition in cancers is a putative explanation for the abovementioned phenomena. It was reported that the expression of autophagy-related proteins was higher in breast cancer with brain metastasis than in a primary breast tumor, corroborating our hypothesis [29]. Moreover, beclin-1 was reported as a marker of gastric carcinogenesis, aggressiveness, and a prognostic marker [30]. Our study also found that aggressive features were related to the expression of autophagy-related proteins. Differently, autophagy could influence patient prognosis via affecting response to chemotherapy [31]. Interestingly, it was found that p62 positivity was related to shorter DFS and OS in PCC. In a previous study, lithium increased autophagy in PC12 cells, resulting in overgrowth of PCC cells, suggesting the possibility that autophagy-related proteins could be prognostic biomarkers in adrenal gland tumors [32].
As shown previously, autophagy is known to act as a tumor enhancer and/or tumor suppressor in various cancers, is also pathogenically implicated in tumor cell growth in adrenal gland tumors [30]. Nevertheless, because the expression of autophagy-related proteins in adrenal gland tumors was not reported in the existing literature, a direct comparison of our findings to a previous study could not be conducted.
Another potential clinical implication of this study is that it paved the way for compounds targeting autophagy as promising therapeutic agents in patients with adrenal gland tumors [33,34,35,36]. A study using rosiglitazone (RGZ), a PPAR-γ agonist, showed that RGZ was capable of activating the AMPK pathway, leading to enhanced autophagy, reactive oxygen species formation, as well as upregulating beclin-1 and LAMP-1, a protein involved in the process of autophagy to induce autophagic cell death in ACC cell lines [37]. However, a contradictory result was reported in PCC, as the induction of autophagy in the rat PCC cell line, PC12, improved cell survival [32,38]. Sunitinib is a tyrosine kinase inhibitor that induces apoptosis and autophagy in PC12 cells by direct inhibition of mTOR [39]. Inhibition of the autophagy process promoted the anti-proliferative and apoptotic effect of sunitinib, highlighting an inverse effect as compared with ACC [38]. Further, a study using SW13 cells, which is an ACC cell line, demonstrated that RGZ does not exert any effect on autophagy; instead, it accompanies the process of cell cycle dysregulation and the inhibition of cell growth [37], emphasizing that the effect of autophagy is complex and could largely differ based on the underlying tumor microenvironment. Notably, as there are increasing attempts to develop therapeutic agents targeting autophagy in cancers [33,34,35,36], it may be possible that these drugs could be used in the treatment of adrenal gland tumors, the possibility and efficacy of which will be elucidated by further in vitro and in vivo studies in the future.
The limitation of this study is that the number of patients with ACC was small, and only a small proportion of patients with PCC (8 among the 189 patients) had undergone chemotherapy. Thus, the effect of autophagy-related protein expression in requiring chemotherapy could not be evaluated. In addition, immunohistochemical staining may not be sufficient to precisely evaluate the activity of autophagy. Given that the evaluation of autophagy was only performed using paraffin blocks of adrenal gland tumors, a detailed investigation utilizing autophagy flux, which enables assessment of the complex, dynamic, and the multi-sequential process of autophagy, as well as in vitro investigations (i.e., immunofluorescence and cell line studies) is warranted to provide better insights into the role of autophagy in adrenal gland tumors.

5. Conclusions

The expression of autophagy-related proteins was significantly different between PCC and ACT. In particular, the expressions of these proteins were associated with aggressive clinical features and patient prognosis, suggesting that the estimation of these proteins may be useful in the discrimination of adrenal gland tumors and the identification of patients with poor prognosis.

Supplementary Materials

The following are available online at https://www.mdpi.com/article/10.3390/ijms221910490/s1.

Author Contributions

Conceptualization, J.S.K.; methodology, H.M.K.; software, J.S.K.; validation, J.S.K. and H.M.K.; formal analysis, J.S.K.; investigation, J.S.K. and H.M.K.; resources, J.S.K.; data curation, J.S.K.; writing—original draft preparation, J.S.K. and H.M.K.; writing—review and editing, H.M.K.; visualization, H.M.K.; supervision, J.S.K.; project administration, J.S.K.; funding acquisition, J.S.K. Both authors have read and agreed to the published version of the manuscript.

Funding

This research received no external funding.

Institutional Review Board Statement

This study was approved by the Institutional Review Board of Yonsei University Severance Hospital (9 March 2021; 4-2021-0028), which exempted informed consent from patients.

Informed Consent Statement

Patient consent was waived due to retrospective study design.

Data Availability Statement

The datasets used to support the findings of this study are available from the corresponding author upon request.

Conflicts of Interest

The authors have no conflict of interest to declare.

References

  1. Levine, B.; Klionsky, D.J. Development by self-digestion: Molecular mechanisms and biological functions of autophagy. Dev. Cell 2004, 6, 463–477. [Google Scholar] [CrossRef]
  2. Mizushima, N. Autophagy: Process and function. Genes Dev. 2007, 21, 2861–2873. [Google Scholar] [CrossRef] [Green Version]
  3. Mizushima, N.; Levine, B.; Cuervo, A.M.; Klionsky, D.J. Autophagy fights disease through cellular self-digestion. Nature 2008, 451, 1069–1075. [Google Scholar] [CrossRef] [Green Version]
  4. Yang, Z.; Klionsky, D.J. Eaten alive: A history of macroautophagy. Nat. Cell Biol. 2010, 12, 814–822. [Google Scholar] [CrossRef] [Green Version]
  5. Chen, Y.; Lu, Y.; Lu, C.; Zhang, L. Beclin-1 expression is a predictor of clinical outcome in patients with esophageal squamous cell carcinoma and correlated to hypoxia-inducible factor (hif)-1alpha expression. Pathol. Oncol. Res. 2009, 15, 487–493. [Google Scholar] [CrossRef] [Green Version]
  6. Li, B.X.; Li, C.Y.; Peng, R.Q.; Wu, X.J.; Wang, H.Y.; Wan, D.S.; Zhu, X.F.; Zhang, X.S. The expression of beclin 1 is associated with favorable prognosis in stage iiib colon cancers. Autophagy 2009, 5, 303–306. [Google Scholar] [CrossRef] [Green Version]
  7. Pirtoli, L.; Cevenini, G.; Tini, P.; Vannini, M.; Oliveri, G.; Marsili, S.; Mourmouras, V.; Rubino, G.; Miracco, C. The prognostic role of beclin 1 protein expression in high-grade gliomas. Autophagy 2009, 5, 930–936. [Google Scholar] [CrossRef] [Green Version]
  8. Wan, X.B.; Fan, X.J.; Chen, M.Y.; Xiang, J.; Huang, P.Y.; Guo, L.; Wu, X.Y.; Xu, J.; Long, Z.J.; Zhao, Y.; et al. Elevated beclin 1 expression is correlated with hif-1alpha in predicting poor prognosis of nasopharyngeal carcinoma. Autophagy 2010, 6, 395–404. [Google Scholar] [CrossRef] [Green Version]
  9. Kabeya, Y.; Mizushima, N.; Ueno, T.; Yamamoto, A.; Kirisako, T.; Noda, T.; Kominami, E.; Ohsumi, Y.; Yoshimori, T. Lc3, a mammalian homologue of yeast apg8p, is localized in autophagosome membranes after processing. EMBO J. 2000, 19, 5720–5728. [Google Scholar] [CrossRef] [PubMed]
  10. Sivridis, E.; Koukourakis, M.I.; Zois, C.E.; Ledaki, I.; Ferguson, D.J.; Harris, A.L.; Gatter, K.C.; Giatromanolaki, A. Lc3a-positive light microscopy detected patterns of autophagy and prognosis in operable breast carcinomas. Am. J. Pathol. 2010, 176, 2477–2489. [Google Scholar] [CrossRef] [PubMed] [Green Version]
  11. Yoshioka, A.; Miyata, H.; Doki, Y.; Yamasaki, M.; Sohma, I.; Gotoh, K.; Takiguchi, S.; Fujiwara, Y.; Uchiyama, Y.; Monden, M. Lc3, an autophagosome marker, is highly expressed in gastrointestinal cancers. Int. J. Oncol. 2008, 33, 461–468. [Google Scholar] [CrossRef] [PubMed] [Green Version]
  12. Komatsu, M.; Waguri, S.; Koike, M.; Sou, Y.S.; Ueno, T.; Hara, T.; Mizushima, N.; Iwata, J.; Ezaki, J.; Murata, S.; et al. Homeostatic levels of p62 control cytoplasmic inclusion body formation in autophagy-deficient mice. Cell 2007, 131, 1149–1163. [Google Scholar] [CrossRef] [Green Version]
  13. Mizushima, N.; Yoshimori, T.; Levine, B. Methods in mammalian autophagy research. Cell 2010, 140, 313–326. [Google Scholar] [CrossRef] [PubMed] [Green Version]
  14. Quinsay, M.N.; Thomas, R.L.; Lee, Y.; Gustafsson, A.B. Bnip3-mediated mitochondrial autophagy is independent of the mitochondrial permeability transition pore. Autophagy 2010, 6, 855–862. [Google Scholar] [CrossRef] [PubMed] [Green Version]
  15. Degenhardt, K.; Mathew, R.; Beaudoin, B.; Bray, K.; Anderson, D.; Chen, G.; Mukherjee, C.; Shi, Y.; Gelinas, C.; Fan, Y.; et al. Autophagy promotes tumor cell survival and restricts necrosis, inflammation, and tumorigenesis. Cancer Cell 2006, 10, 51–64. [Google Scholar] [CrossRef] [Green Version]
  16. Roy, S.; Debnath, J. Autophagy and tumorigenesis. Semin. Immunopathol. 2010, 32, 383–396. [Google Scholar] [CrossRef] [Green Version]
  17. Baehrecke, E.H. Autophagy: Dual roles in life and death? Nat. Rev. Mol. Cell Biol. 2005, 6, 505–510. [Google Scholar] [CrossRef]
  18. Debnath, J.; Baehrecke, E.H.; Kroemer, G. Does autophagy contribute to cell death? Autophagy 2005, 1, 66–74. [Google Scholar] [CrossRef]
  19. Henry, L.R.; Lee, H.O.; Lee, J.S.; Klein-Szanto, A.; Watts, P.; Ross, E.A.; Chen, W.T.; Cheng, J.D. Clinical implications of fibroblast activation protein in patients with colon cancer. Clin. cancer Res. Off. J. Am. Assoc. Cancer Res. 2007, 13, 1736–1741. [Google Scholar] [CrossRef] [Green Version]
  20. Müller, J.; Pfeifer, U.; Dämmrich, J. Inhibited autophagic degradation during acth-stimulated growth of rat adrenal zona fasciculata. Virchows Archiv. B 1986, 52, 429. [Google Scholar] [CrossRef]
  21. Yi, J.; Tang, X. Functional implication of autophagy in steroid-secreting cells of the rat. Anat. Rec. 1995, 242, 137–146. [Google Scholar] [CrossRef]
  22. Cheon, S.Y.; Kim, H.; Rubinsztein, D.C.; Lee, J.E. Autophagy, cellular aging and age-related human diseases. Exp. Neurobiol. 2019, 28, 643–657. [Google Scholar] [CrossRef]
  23. Yu, L.; Chen, Y.; Tooze, S.A. Autophagy pathway: Cellular and molecular mechanisms. Autophagy 2018, 14, 207–215. [Google Scholar] [CrossRef] [PubMed] [Green Version]
  24. Mowers, E.E.; Sharifi, M.N.; Macleod, K.F. Autophagy in cancer metastasis. Oncogene 2017, 36, 1619–1630. [Google Scholar] [CrossRef] [PubMed]
  25. Kenific, C.M.; Thorburn, A.; Debnath, J. Autophagy and metastasis: Another double-edged sword. Curr. Opin. Cell Biol. 2010, 22, 241–245. [Google Scholar] [CrossRef] [PubMed] [Green Version]
  26. Sosa, M.S.; Bragado, P.; Aguirre-Ghiso, J.A. Mechanisms of disseminated cancer cell dormancy: An awakening field. Nat. Rev. Cancer 2014, 14, 611–622. [Google Scholar] [CrossRef] [PubMed]
  27. Langley, R.R.; Fidler, I.J. The seed and soil hypothesis revisited--the role of tumor-stroma interactions in metastasis to different organs. Int. J. Cancer 2011, 128, 2527–2535. [Google Scholar] [CrossRef] [Green Version]
  28. Weckman, A.; Rotondo, F.; Di Ieva, A.; Syro, L.V.; Butz, H.; Cusimano, M.D.; Kovacs, K. Autophagy in endocrine tumors. Endocr. Relat. Cancer 2015, 22, R205–R218. [Google Scholar] [CrossRef] [Green Version]
  29. Maiti, A.; Hait, N.C. Autophagy-mediated tumor cell survival and progression of breast cancer metastasis to the brain. J. Cancer 2021, 12, 954–964. [Google Scholar] [CrossRef]
  30. Cao, Y.; Luo, Y.; Zou, J.; Ouyang, J.; Cai, Z.; Zeng, X.; Ling, H.; Zeng, T. Autophagy and its role in gastric cancer. Clin. Chim. Acta 2019, 489, 10–20. [Google Scholar] [CrossRef]
  31. Thongchot, S.; Vidoni, C.; Ferraresi, A.; Loilome, W.; Khuntikeo, N.; Sangkhamanon, S.; Titapun, A.; Isidoro, C.; Namwat, N. Cancer-associated fibroblast-derived il-6 determines unfavorable prognosis in cholangiocarcinoma by affecting autophagy-associated chemoresponse. Cancers (Basel) 2021, 13, 2134. [Google Scholar] [CrossRef]
  32. Fabrizi, C.; De Vito, S.; Somma, F.; Pompili, E.; Catizone, A.; Leone, S.; Lenzi, P.; Fornai, F.; Fumagalli, L. Lithium improves survival of pc12 pheochromocytoma cells in high-density cultures and after exposure to toxic compounds. Int. J. Cell Biol. 2014, 2014, 135908. [Google Scholar] [CrossRef] [Green Version]
  33. Amaravadi, R.K.; Yu, D.; Lum, J.J.; Bui, T.; Christophorou, M.A.; Evan, G.I.; Thomas-Tikhonenko, A.; Thompson, C.B. Autophagy inhibition enhances therapy-induced apoptosis in a myc-induced model of lymphoma. J. Clin. Investig. 2007, 117, 326–336. [Google Scholar] [CrossRef] [PubMed] [Green Version]
  34. Carew, J.S.; Medina, E.C.; Esquivel, J.A., 2nd; Mahalingam, D.; Swords, R.; Kelly, K.; Zhang, H.; Huang, P.; Mita, A.C.; Mita, M.M.; et al. Autophagy inhibition enhances vorinostat-induced apoptosis via ubiquitinated protein accumulation. J. Cell Mol. Med. 2010, 14, 2448–2459. [Google Scholar] [CrossRef] [PubMed]
  35. Carew, J.S.; Nawrocki, S.T.; Kahue, C.N.; Zhang, H.; Yang, C.; Chung, L.; Houghton, J.A.; Huang, P.; Giles, F.J.; Cleveland, J.L. Targeting autophagy augments the anticancer activity of the histone deacetylase inhibitor saha to overcome bcr-abl-mediated drug resistance. Blood 2007, 110, 313–322. [Google Scholar] [CrossRef] [PubMed] [Green Version]
  36. Gupta, A.; Roy, S.; Lazar, A.J.; Wang, W.L.; McAuliffe, J.C.; Reynoso, D.; McMahon, J.; Taguchi, T.; Floris, G.; Debiec-Rychter, M.; et al. Autophagy inhibition and antimalarials promote cell death in gastrointestinal stromal tumor (gist). Proc. Natl. Acad. Sci. USA 2010, 107, 14333–14338. [Google Scholar] [CrossRef] [PubMed] [Green Version]
  37. Cerquetti, L.; Sampaoli, C.; Amendola, D.; Bucci, B.; Masuelli, L.; Marchese, R.; Misiti, S.; De Venanzi, A.; Poggi, M.; Toscano, V.; et al. Rosiglitazone induces autophagy in h295r and cell cycle deregulation in sw13 adrenocortical cancer cells. Exp. Cell Res. 2011, 317, 1397–1410. [Google Scholar] [CrossRef]
  38. Ikeda, T.; Ishii, K.A.; Saito, Y.; Miura, M.; Otagiri, A.; Kawakami, Y.; Shimano, H.; Hara, H.; Takekoshi, K. Inhibition of autophagy enhances sunitinib-induced cytotoxicity in rat pheochromocytoma pc12 cells. J. Pharmacol. Sci. 2013, 121, 67–73. [Google Scholar] [CrossRef] [Green Version]
  39. Saito, Y.; Tanaka, Y.; Aita, Y.; Ishii, K.; Ikeda, T.; Isobe, K.; Kawakami, Y.; Shimano, H.; Hara, H.; Takekoshi, K. Sunitinib induces apoptosis in pheochromocytoma tumor cells by inhibiting vegfr2/akt/mtor/s6k1 pathways through modulation of bcl-2 and bad. Am. J. Physiol. Endocrinol. Metab. 2012, 302, E615–E625. [Google Scholar] [CrossRef] [Green Version]
Figure 1. Expression of autophagy-related proteins in adrenal cortical tumor and pheochromocytoma. LC3A, LC3B, beclin-1, and LC3B (ISPC) positivity rates were higher in PCC than in ACT, whereas p62 positivity was lower in PCC.
Ijms 22 10490 g001
Figure 2. Isolated single positive cells (ISPC) of p62 and LC3B stain in adrenal tumors. The ISPC proportion of LC3B was higher in ACC than in ACA. The ISPC proportions of p62 and LC3B were significantly higher in PCCs with a GAPP score of ≥3 than in PCCs with a GAPP score of <3. Arrows indicate ISPC.
Ijms 22 10490 g002
Figure 3. The presence/absence of clinicopathologic factors and the expression of autophagy-related proteins in adrenal cortical tumor and pheochromocytoma.
Ijms 22 10490 g003
Figure 4. Impact of the expression of autophagy-related proteins on prognosis in pheochromocytoma. The p62 (left figure) and p62 (ISPC) (middle figure) positivity was associated with shorter disease-free survival in PCC, whereas p62 positivity was also associated with shorter overall survival (right figure).
Ijms 22 10490 g004
Table 1. Expression of autophagy-related proteins in adrenal cortical tumor and pheochromocytoma.
Parameters Total
n = 321 (%)
Adrenal Cortical Tumor
n = 132 (%)
Pheochromocytoma
n = 189 (%)
p-Value
Beclin-1 <0.001
Negative 218 (67.9)127 (96.2)91 (48.1)
Positive 103 (32.1)5 (3.8)98 (51.9)
p62 0.006
Negative 199 (62.0)70 (53.0)129 (68.3)
Positive 122 (38.0)62 (47.0)60 (31.7)
p62 (ISPC) 0.128
Absent238 (74.1)92 (69.7)146 (77.2)
Present83 (25.9)40 (30.3)43 (22.8)
LC3A <0.001
Negative 221 (68.8)132 (100.0)89 (47.1)
Positive 100 (31.2)0 (0.0)100 (52.9)
LC3B <0.001
Negative243 (75.7)116 (87.9)127 (67.2)
Positive78 (24.3)16 (12.1)62 (32.8)
LC3B (ISPC) 0.010
Absent272 (84.7)120 (90.9)152 (80.4)
Present49 (15.3)12 (9.1)37 (19.6)
Table 2. Expression of autophagy-related proteins in adrenal cortical adenoma and adrenal cortical carcinoma.
Parameters Total
n = 132 (%)
Adrenal Cortical Adenoma
n = 115 (%)
Adrenal Cortical Carcinoma
n = 17 (%)
p-Value
Beclin-1 0.381
Negative 127 (96.2)110 (95.7)17 (100.0)
Positive 5 (3.8)5 (4.3)0 (0.0)
p62 0.294
Negative 70 (53.0)63 (54.8)7 (41.2)
Positive 62 (47.0)52 (45.2)10 (58.8)
p62 (ISPC) 0.107
Absent 92 (69.7)83 (72.2)9 (52.9)
Present 40 (30.3)32 (27.8)8 (47.1)
LC3A n/a
Negative 132 (100.0)115 (100.0)17 (100.0)
Positive 0 (0.0)0 (0.0)0 (0.0)
LC3B 0.101
Negative 116 (87.9)99 (86.1)17 (100.0)
Positive 16 (12.1)16 (13.9)0 (0.0)
LC3B (ISPC) 0.027
Absent 120 (90.9)107 (93.0)13 (76.5)
Present 12 (9.1)8 (7.0)4 (23.5)
Table 3. Expression of autophagy-related proteins in pheochromocytoma according to GAPP score.
Parameters Total
n = 189 (%)
Pheochromocytomap-Value
GAPP Score < 3
n = 138 (%)
GAPP Score ≥ 3
n = 51 (%)
Beclin-1 0.884
Negative 91 (48.1)66 (47.8)25 (49.0)
Positive 98 (51.9)72 (52.2)26 (51.0)
p62 0.017
Negative 129 (68.3)101 (73.2)28 (54.9)
Positive 60 (31.7)37 (26.8)23 (45.1)
p62 (ISPC) 0.349
Absent 146 (77.2)109 (79.0)37 (72.5)
Present 43 (22.8)29 (21.0)14 (27.5)
LC3A 0.747
Negative 89 (47.1)64 (46.4)25 (49.0)
Positive 100 (52.9)74 (53.6)26 (51.0)
LC3B 0.254
Negative 127 (67.2)96 (69.6)31 (60.8)
Positive 62 (32.8)42 (30.4)20 (39.2)
LC3B (ISPC) 0.013
Absent 152 (80.4)117 (84.8)35 (68.6)
Present 37 (19.6)21 (15.2)16 (31.4)
Table 4. Univariate analysis of the impact of expression of autophagy-related proteins in pheochromocytoma on disease-free survival and overall survival by the log-rank test.
ParameterNumber of Patients
/Recurrence/Death
Disease-Free SurvivalOverall Survival
Mean Survival
(95% CI) Months
p-ValueMean Survival
(95% CI) Months
p-Value
Beclin-1 0.655 0.112
Negative 91/2/8150 (139–161) 142 (126–158)
Positive 97/3/3154 (148–161) 159 (150–167)
p62 0.014 0.023
Negative 128/1/4156 (154–159) 150 (142–157)
Positive 60/4/7139 (115–162) 136 (114–157)
p62 (ISPC) 0.001 0.910
Absent 145/1/9159 (157–162) 144 (134–155)
Present 43/4/2127 (96–157) 157 (144–170)
LC3A 0.657 0.435
Negative 89/3/4146 (136–157) 154 (142–166)
Positive 99/2/7157 (151–162) 142 (129–155)
LC3B 0.529 0.220
Negative 126/4/5149 (140–158) 155 (145–165)
Positive 62/1/6157 (151–164) 138 (121–155)
LC3B (ISPC) 0.234 0.410
Absent 151/3/10154 (147–162) 148 (137–160)
Present 37/2/1145 (129–162) 151 (139–163)
Table 5. Multivariate analysis of disease-free survival and overall-survival of patients with pheochromocytoma.
Included FactorDisease-Free SurvivalOverall Survival
Hazard Ratio95% CIp-ValueHazard Ratio95% CIp-Value
Histologic pattern 0.738 0.720
Zellballen vs. Non-Zellballen1.4910.143–15,351 0.7370.139–3.912
Cellularity 0.290 0.504
Low, moderate vs. High3.0930.382–25.02 1.8270.312–10.71
Vascular and/or capsular invasion 0.524 0.183
Absent vs. Present2.1250.210–21.55 2.8540.610–13.34
Ki-67 labeling index (%) 0.923 0.112
<1 vs. ≥11.5980.000–21,497 0.1240.010–1.623
GAPP score 0.892 0.061
0–2 vs. 3–101.9490.000–29,027 13.9060.884–218.8
p62 0.420 0.015
Negative vs. Positive2.9450.123–40.72 6.2401.434–27.15
p62 (ISPC) 0.081 0.432
Absent vs. Present8.1430.771–85.95 0.5220.103–2.638
Table 6. Univariate analysis of the impact of expression of autophagy-related proteins in adrenal cortical tumors on disease-free survival and overall survival by the log-rank test.
ParameterNumber of Patients
/Recurrence/Death
Disease-Free SurvivalOverall Survival
Mean Survival
(95% CI) Months
p-ValueMean Survival
(95% CI) Months
p-Value
Beclin-1 n/a n/a
Negative 127/3/9n/a n/a
Positive 5/0/0n/a n/a
p62 0.446 0.056
Negative 70/1/2107 (104–110) 106 (102–110)
Positive 62/2/7115 (110–120) 106 (97–115)
p62 (ISPC) 0.138 0.322
Absent 92/1/5107 (105–109) 103 (99–108)
Present 40/2/4113 (105–121) 107 (96–118)
LC3A n/a n/a
Negative 132/3/9n/a n/a
Positive 0/0/0n/a n/a
LC3B n/a n/a
Negative 116/3/9n/a n/a
Positive 16/0/0n/a n/a
LC3B (ISPC) 0.094 0.157
Absent 120/2/7107 (105–109) 103 (98–107)
Present12/1/2108 (88–128) 100 (77–123)
n/a: not available.
Publisher’s Note: MDPI stays neutral with regard to jurisdictional claims in published maps and institutional affiliations.

