Article

An Exon Skipping in CRS1 Is Associated with Perturbed Chloroplast Development in Maize

State Key Laboratory of Crop Stress Adaptation and Improvement, School of Life Sciences, Kaifeng 475004, China
*
Author to whom correspondence should be addressed.
These authors contributed equally to this work.
Int. J. Mol. Sci. 2021, 22(19), 10668; https://doi.org/10.3390/ijms221910668
Submission received: 23 August 2021 / Revised: 20 September 2021 / Accepted: 27 September 2021 / Published: 1 October 2021
(This article belongs to the Section Molecular Plant Sciences)

Abstract

:
Chloroplasts of higher plants are semi-autonomous organelles that perform photosynthesis and produce hormones and metabolites. They play crucial roles in plant growth and development. Although many seedling-lethal nuclear genes or regulators required for chloroplast development have been characterized, the understanding of chloroplast development is still limited. Using a genetic screen, we isolated a mutant named ell1, with etiolated leaves and a seedling-lethal phenotype. Analysis by BN-PAGE and transmission electron microscopy revealed drastic morphological defects of chloroplasts in ell1 mutants. Genetic mapping of the mutant gene revealed a single mutation (G-to-A) at the 5′ splice site of intron 5 in CRS1, resulting in an exon skipping in CRS1, indicating that this mutation in CRS1 is responsible for the observed phenotype, which was further confirmed by genetic analysis. The incorrectly spliced CRS1 failed to mediate the splicing of atpF intron. Moreover, the quantitative analysis suggested that ZmCRS1 may participate in chloroplast transcription to regulate the development of chloroplast. Taken together, these findings improve our understanding of the ZmCRS1 protein and shed new light on the regulation of chloroplast development in maize.

1. Introduction

In oxygenic photosynthesis, light is captured by the light-harvesting complex and the light excitation energy is transferred to the photosynthetic electron transfer chain consisting of PSII, the Cyt b6f complex and PSI embedded in the thylakoid membrane [1]. The primary products NAD(P)H and ATP provide the reducing power and energy for carbon fixation. The light reactions and carbon fixation occur in the thylakoid membrane and chloroplast stroma, respectively. Chloroplasts play an essential role in photosynthesis and host important metabolic pathways essential for plant growth and development [2]. Chloroplast proteins are mostly encoded by the nuclear genome and some are encoded by the chloroplast genome. The development of functional chloroplasts is thus dependent on the coordinated expression of nuclear and chloroplast genes [3,4,5,6]. Two distinct RNA polymerases, the bacterial-type plastid-encoded RNA polymerase (PEP) and the bacteriophage-type nuclear-encoded polymerase, are required for transcription [5,7,8]. Hundreds of nuclear genes encoding chloroplast proteins are required for RNA processing, editing, intron splicing and translation [9,10].
In higher plants, introns of chloroplast genes are classified as group I and group II introns, according to the conserved secondary structures and differences in the splicing mechanisms [11]. Twenty group II introns and only one group I intron (trnL) are present in 17 genes in the chloroplast genome of Arabidopsis, whereas only 17 group II introns and one group I intron have been identified in maize and rice [12,13]. In prokaryotic organisms, some group II introns are capable of self-splicing in vitro, but group II introns have lost this ability and require the participation of group II intron splicing factors for splicing in plant chloroplasts [6,14,15]. The atpF gene encodes the CF0 subunit I of chloroplast ATP synthase and contains a single intron which belongs to the group II intron family [16,17]. The first characterized chloroplast RNA splicing factor CRS1 contains three ribosome maturation (CRM) domains and specifically binds to the atpF intron (group IIA) to promote its splicing in Arabidopsis and maize [18,19]. However, AL2, the rice ortholog of CRS1, is essential in both chloroplast group I and II intron splicing [13]. Specifically, a short CRS1 may be required for the development or activity of the chloroplast translation machinery, but the molecular mechanisms remain unknown [18]. Therefore, it is necessary to discover the multiple functions of maize CRS1 besides its splicing factor role.
Intron splicing involves removing introns from the precursor RNA (pre-mRNA) and joining the flanking exons [14,20]. The first step of pre-messenger RNA (pre-mRNA) splicing is the recognition and selection of the specific recognition sites, which is followed by the stepwise assembly of the five uridine-rich small ribonucleoproteins (UsnRNPs) [21,22]. Interactions between the UsnRNPs and the 5′ or 3′ splice sites is mediated by the SR protein family through specific binding to the UA-rich regions of introns [23,24,25]. Mutations at the splice sites disturb such interactions and lead to altered splice site recognition, which eventually results in exon skipping and the dysfunction of the protein [25,26]. Intron splicing of chloroplast genes is required for chloroplast development. CRS1-mediated splicing of the chloroplast atpF intron is essential for plant growth and development. However, the effect of dysfunctional CRS1 on chloroplast development has not been studied in detail. In this study, a maize mutant that displays an etiolated-leaf and seedling-lethal phenotype (ell1) was isolated and characterized. The accumulation of the photosynthetic proteins in the ell1 mutant was severely impaired and drastic morphological defects of chloroplasts were also observed in the mutant by transmission electron microscopy (TEM). Map-based cloning and sequencing revealed a single mutation (G-to-A) at the 5′ splice site of intron5 in CRS1, resulting in an exon skipping of CRS1, which disrupted the activity of CRS1 in the intron splicing of atpF. Additionally, a quantitative analysis suggested an essential role of ZmCRS1 in chloroplast transcription. Our study reveals the important roles of CRS1 in chloroplast development in maize.

2. Results

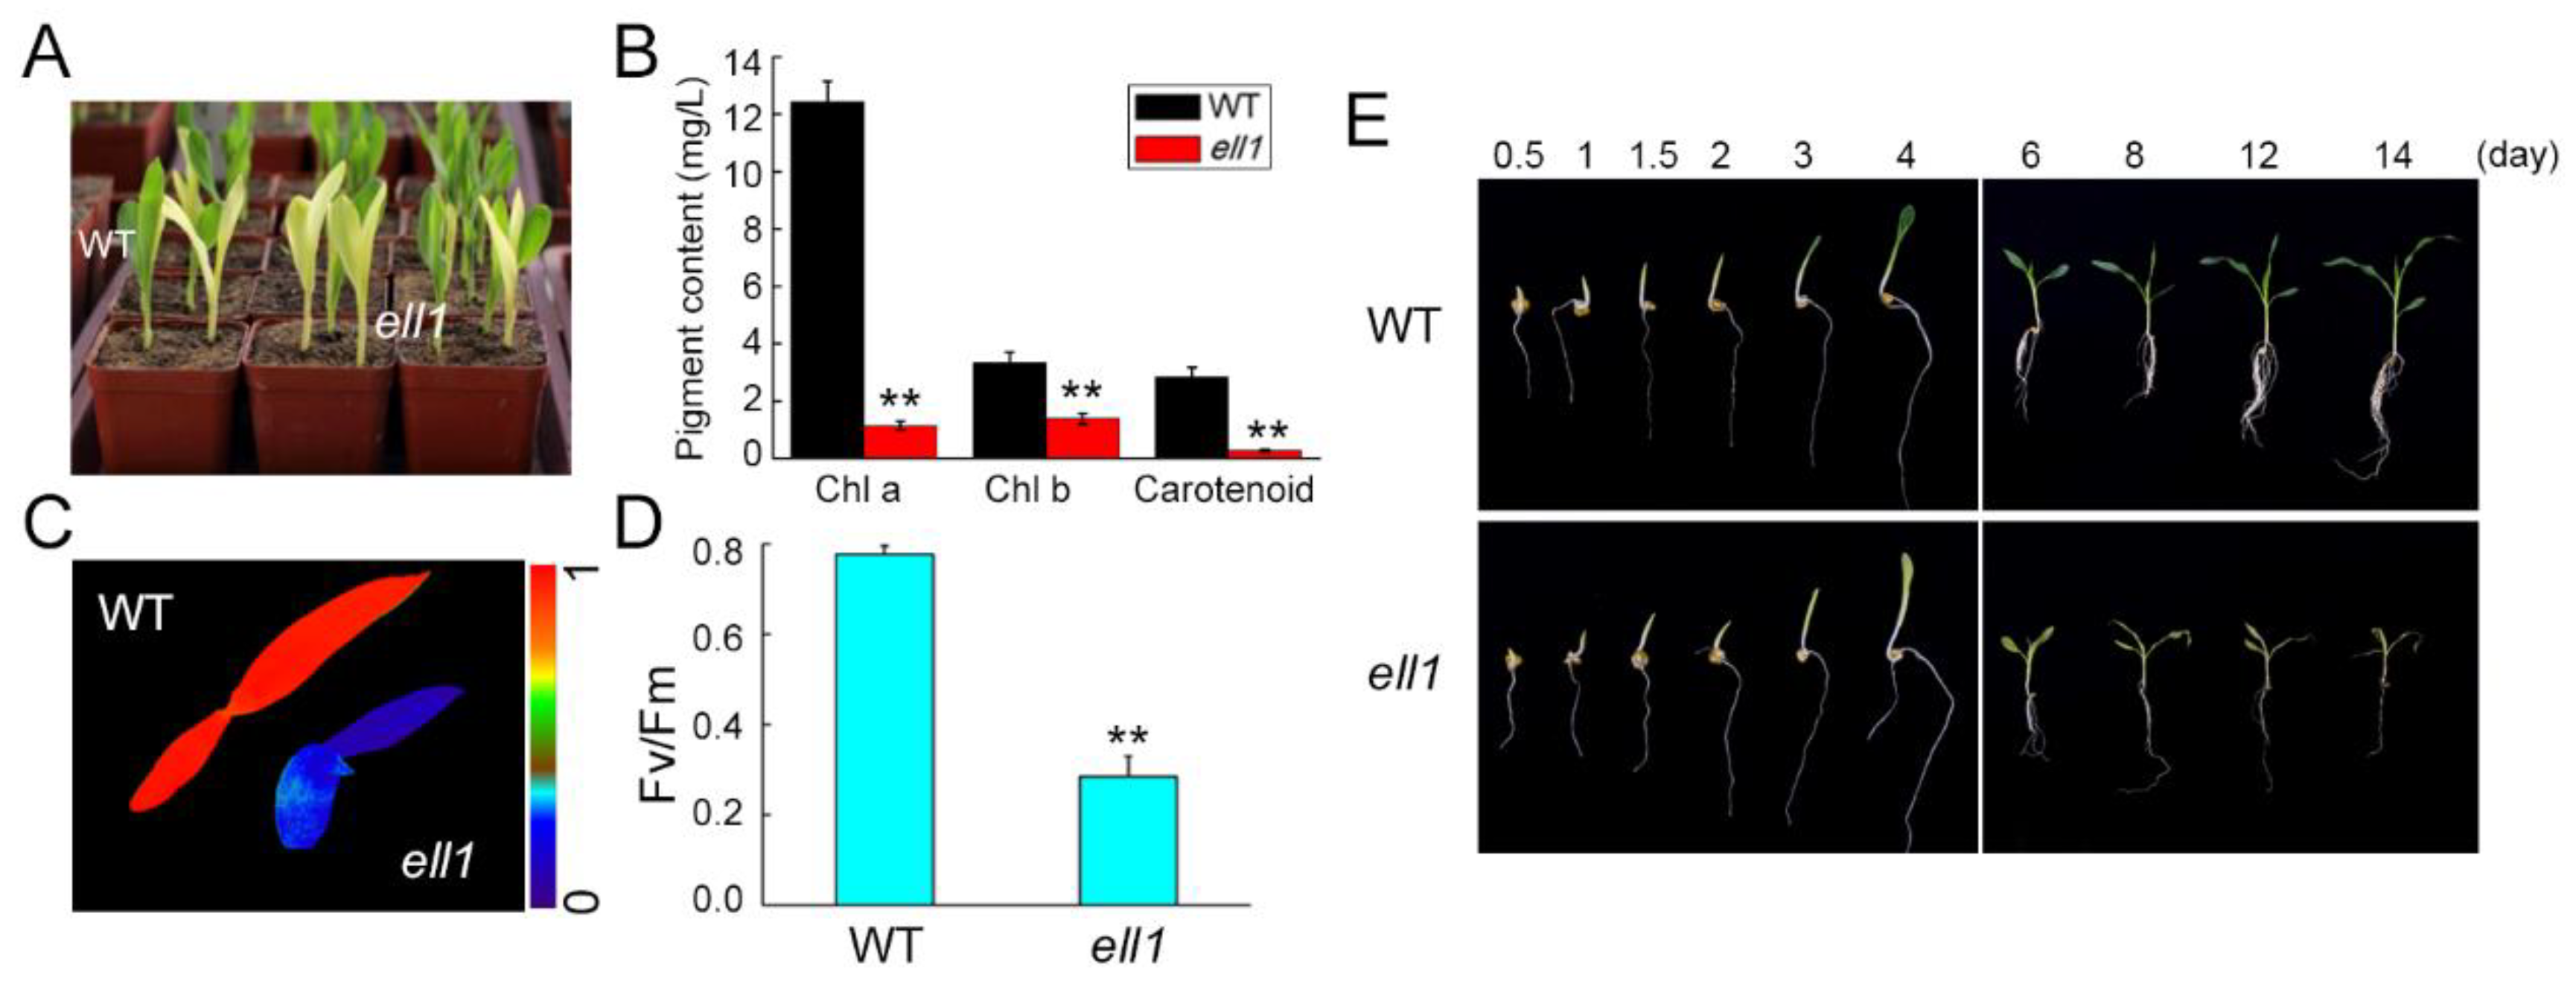
2.1. Identification and Characterization of the ell1 Mutant

To study the molecular mechanisms of chloroplast development in maize, we obtained a collection of ethyl methanesulfonate (EMS)-mutagenized mutants from maizeGDB (https://www.maizegdb.org/, accessed on 26 June 2011). The ell1 mutant was isolated for an etiolated leaf phenotype, while the levels of Chl a, Chl b and carotenoids decreased to about 8, 30 and 16%, respectively, compared to the wild-type (Figure 1A,B). The maximum quantum yield of PSII photochemistry (Fv/Fm) which represents the photosynthetic capacity was ~0.28, significantly lower than 0.8 measured for the wild-type (Figure 1C,D). Moreover, photographs of wild-type and ell1 seedlings were taken from 0.5 to 14 days after germination. We clearly observed that wild-type seedlings emerged from the soil and turned green on day 3 and grew very well. However, the ell1 seedlings had etiolated leaves and gradually lost water and withered until they died on day 14 (Figure 1E).

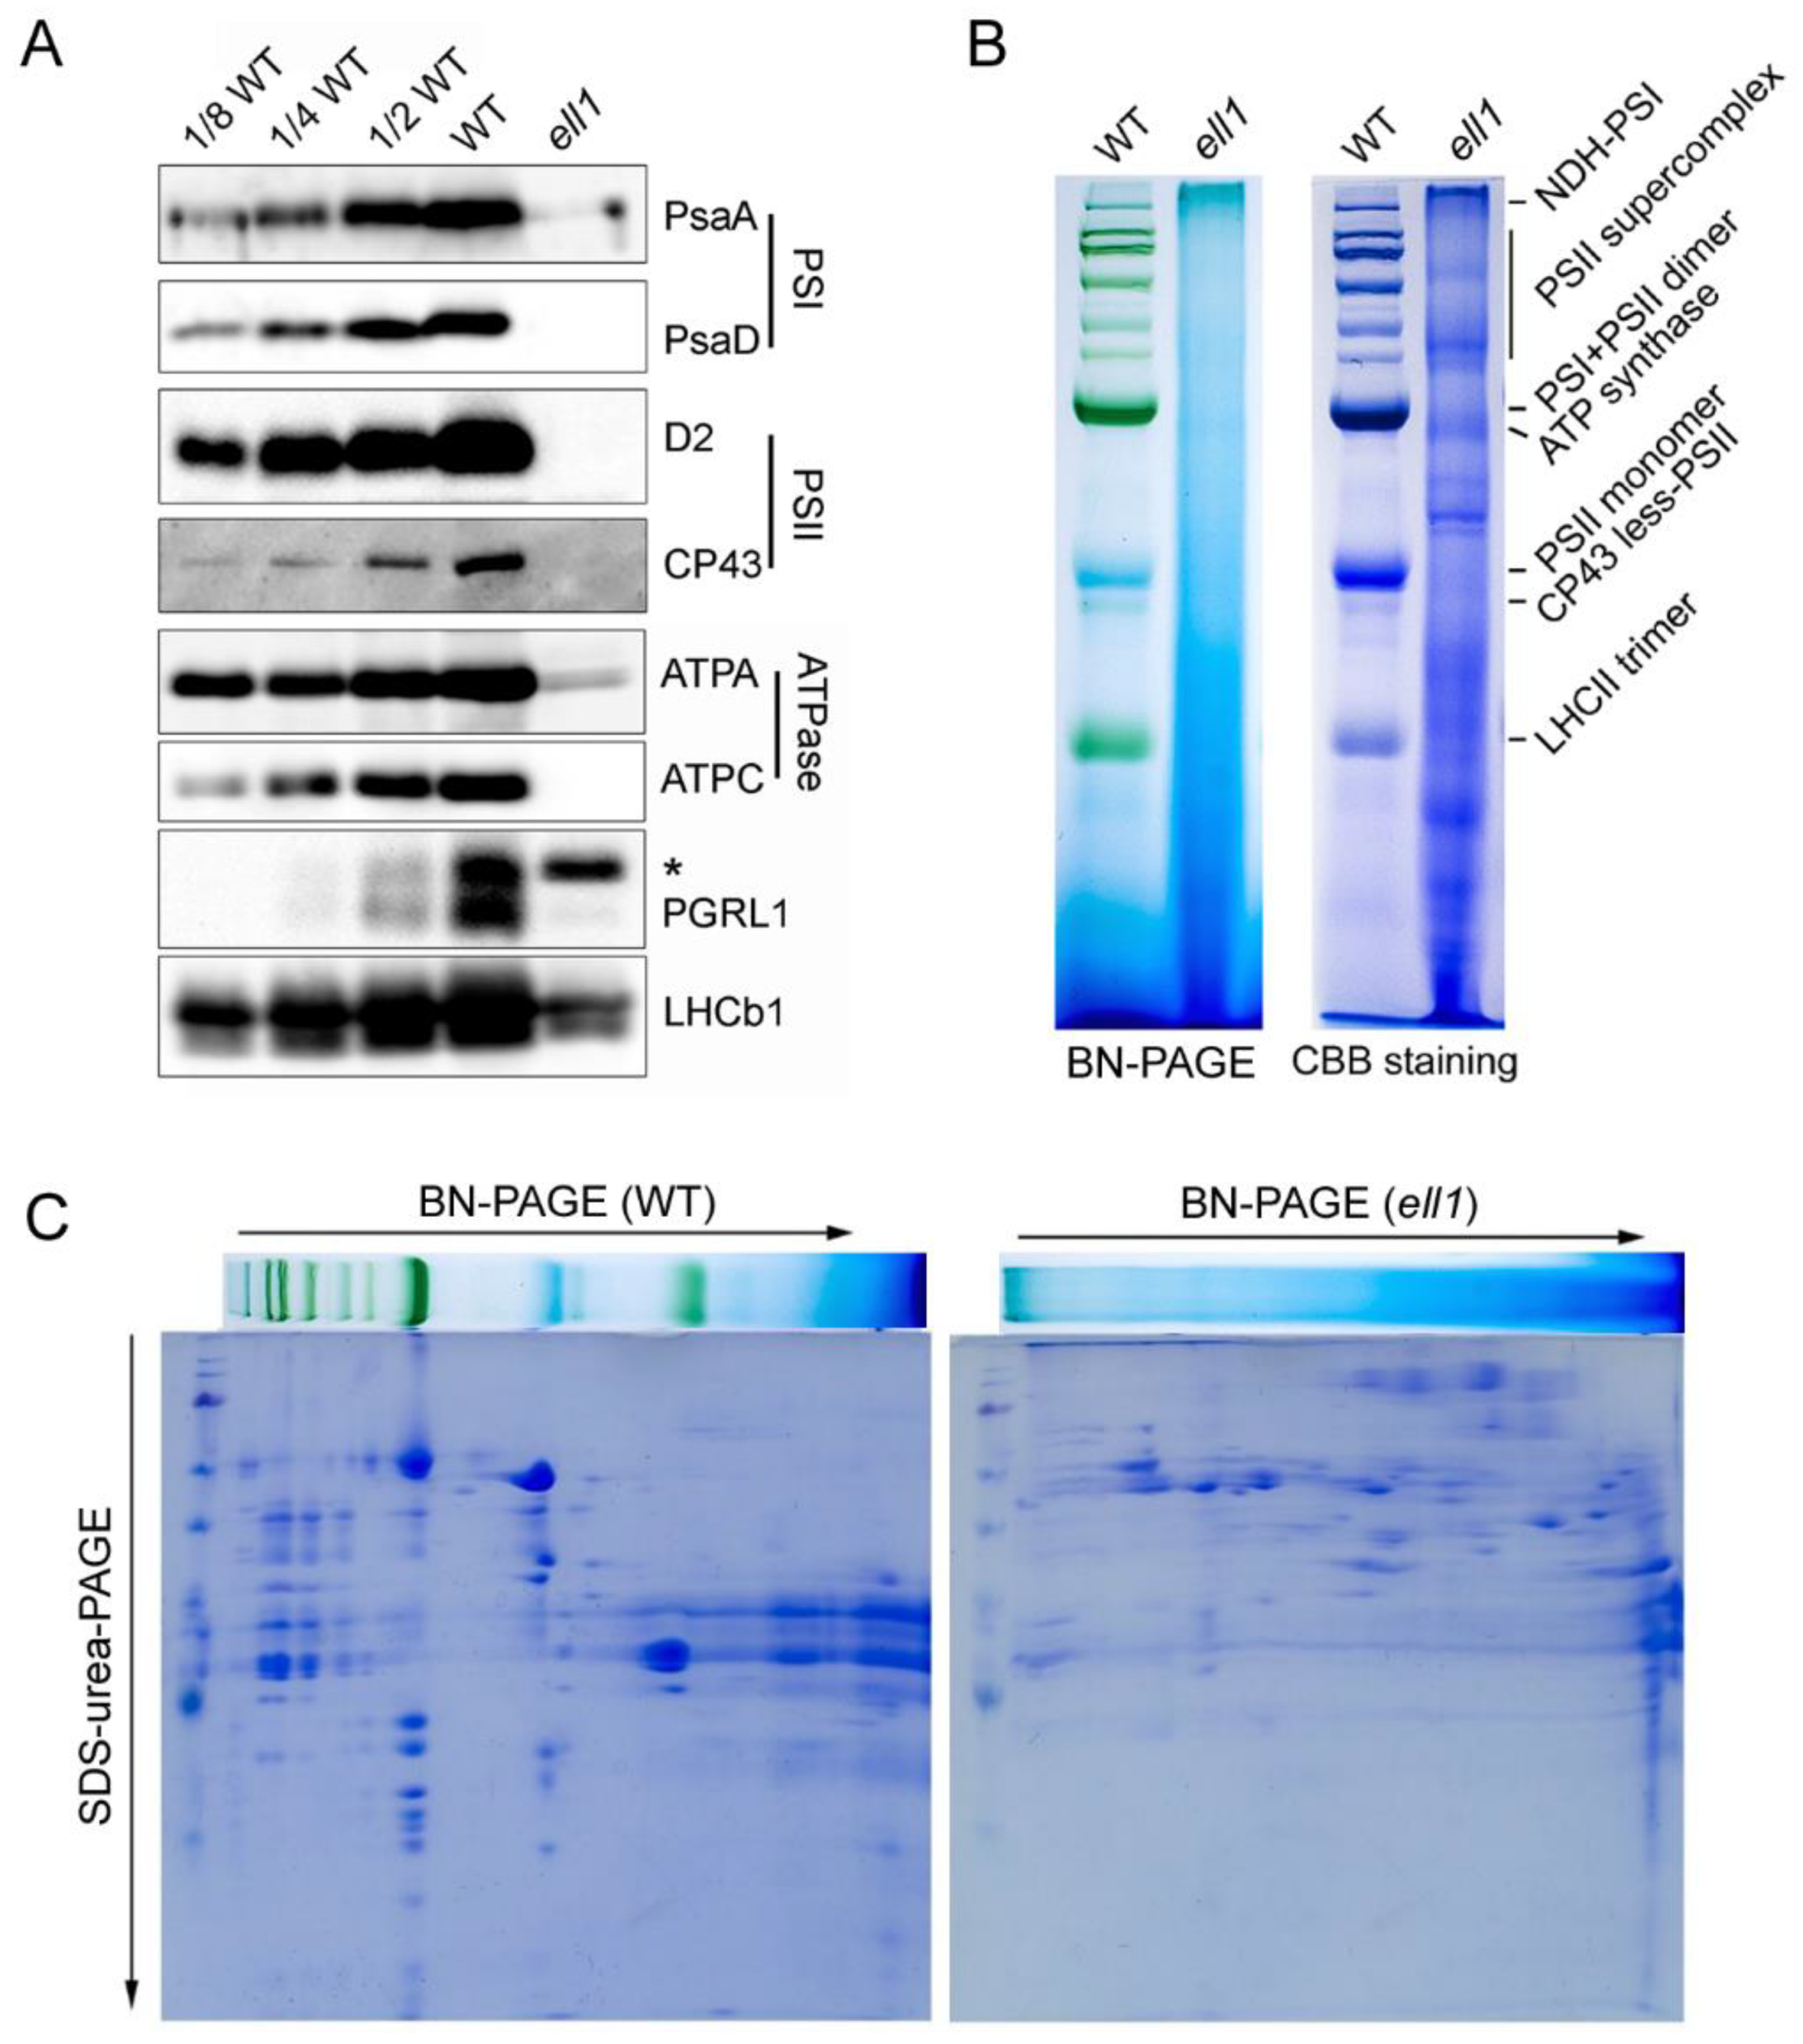
2.2. Accumulation of Photosynthetic Complexes Is Severely Impaired in the ell1 Mutant

To examine whether the low level of photosynthetic efficiency was accompanied by a decreased accumulation of the photosynthetic proteins, thylakoid membrane proteins were extracted from 8-day-old leaves. Protein samples were separated by SDS-urea-PAGE. The levels of thylakoid membrane proteins in the ell1 mutant and WT plants were assessed by immunoblotting using a set of antibodies against diagnostic subunits of multiprotein complexes in the thylakoid membranes. None of the subunits of PSII (D2, CP43), PSI (PsaA, PsaB) and ATP synthase (ATPC) were detectable, and only trace amounts of ATP synthase subunit ATPA and PGRL1, a subunit of the PGR5/PGRL1 complex involved in cyclic electron transport around PSI could be detected in the ell1 mutant (Figure 2A). Moreover, a subunit of the light-harvesting complex II (LHCII), LHCb1, was also severely reduced in the mutant (Figure 2A). These results indicate that the absence of ZmELL1 severely affects the accumulation of thylakoid proteins. In addition, thylakoid protein complexes were solubilized from thylakoid membranes using n-dodecyl-β-D-maltopyranoside (DM) and separated by 6–12% gradient BN-PAGE. Consistent with previous findings, no major protein complexes were observed and only a few minor bands corresponding to smaller complexes were detectable after staining with Coomassie Brilliant Blue (Figure 2B). To further analyze the accumulation of the individual subunits, a two-dimensional SDS-urea-PAGE was performed. The individual subunits were also significantly decreased in the mutant, in contrast to those of the WT (Figure 2C). These data indicate that biogenesis and/or the stability of photosynthetic complexes are severely impaired in the absence of ZmELL1.

2.3. Drastic Morphological Defects in ell1 Mutant Chloroplasts

We then investigated the chloroplast structure in the ell1 mutant by transmission electron microscopy (TEM). Clearly, the characteristic half-moon shaped chloroplasts were visible in wild-type mesophyll cells with normally structured thylakoid membranes composed of grana connected by stromal lamellae (Figure 3). However, chloroplasts of the ell1 mutant displayed an abnormal architecture. In the early growth stage (3-day-old seedlings), only a few stroma lamellae could be observed in ell1 (Figure 3). Moreover, stacked grana in the wild-type appeared to be less organized in ell1, probably due to the lack of connecting stroma lamellae. In addition, we observed irregular shaped chloroplasts with no internal membranes in ell1 at the three-leaf stage (6-day-old seedlings) (Figure S1). These results suggest that ZmELL1 is required for chloroplast development.

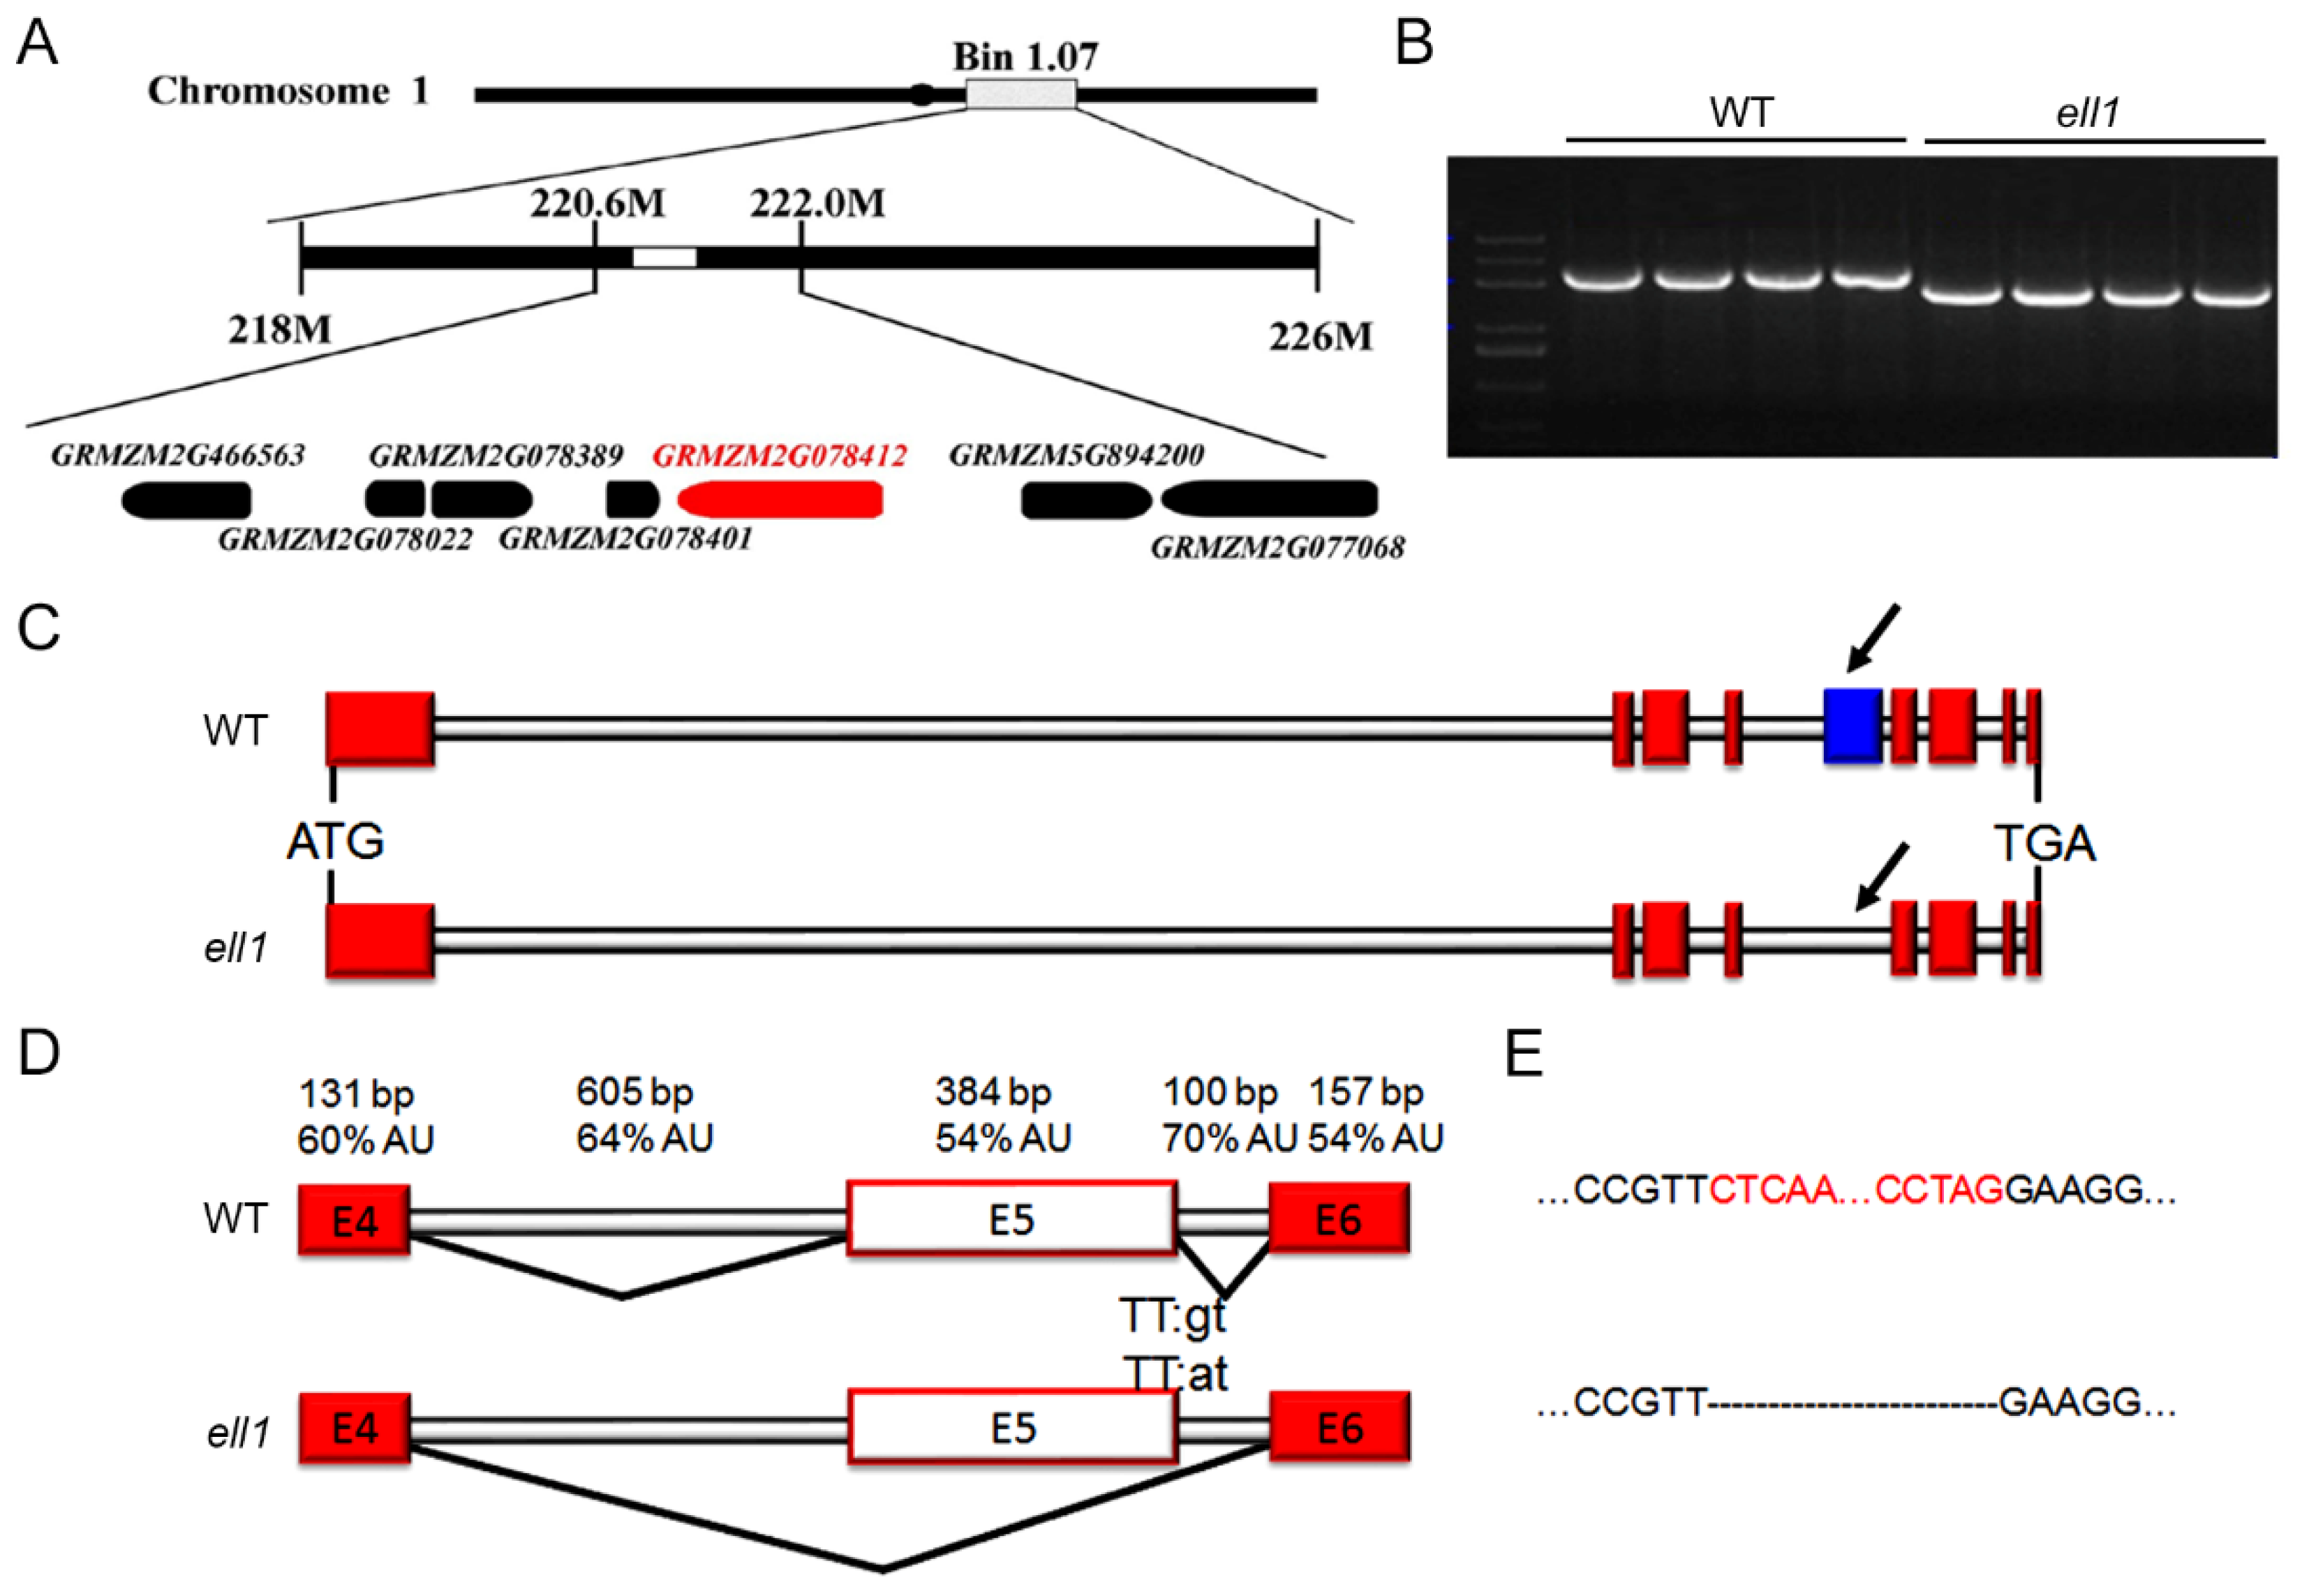
2.4. Map-Based Cloning of ZmELL1 Gene

Since the defective ZmELL1 gene product resulted in seedling-lethality, heterozygous ell1 plants were crossed to wild-type (B73 background) to generate the F2 and BC1 populations for gene mapping. The F1 individuals were normal, but segregation occurred in the F2 plants with 847 green leaf individuals and 284 ell1 individuals among the 1131 plants, corresponding to the 3:1 ratio of Mendel’s law of segregation, suggesting that the etiolated-leaf and seedling-lethality trait is caused by a single recessive mutation. To clone the ZmELL1 gene, we screened 384 SSR markers evenly distributed on the ten chromosomes of maize. A total of 300 F2 recessive plants were used for preliminary mapping based on 37 polymorphic SSR markers, indicating a location on Bin1.07 of chromosome 1 (approximately between 218 M and 226 M, Figure 4A). A total of 54 genetic markers were further developed and 6000 F2 recessive plants were used for fine mapping. The ZmELL1 locus was finally narrowed to an approximately 1.4 Mb interval between 220M105 (220.6 M) and 222M15 (222.0 M) on the long arm of chromosome 1 (Figure 4A). There were 32 annotated genes in this region according to the published B73 genome sequence data. After sequencing, we identified the ELL1 gene as GRMZM2G078412, which encodes the CRS1 protein of maize. cDNAs of ell1 and the wild-type were used to amplify CRS1 by PCR. Surprisingly, we observed that the PCR products of ell1 were significantly shorter than in wild-type plants (Figure 4B). Sequencing of the products revealed that only exon 5 of CRS1 was missing in ell1, but it did not result in a frameshift (Figure 4C,D). The genomic region of CRS1 was then sequenced which indicated a single base change (G to A) at position 10776-bp from the ATG start codon, which is located at the 5′ splice site of the fifth intron of CRS1 (Figure 4D). Additionally, we found that both intron 4 and intron 5 had UA-rich regions and exon 5 had the same UA content as the flanking exon 6, indicating that an exon skipping occurred in ZmCRS1 (Figure 4D,E). Bioinformatics analysis revealed the existence of related proteins of ZmCRS1 in various species. Amino acid sequences of CRS1 proteins from bryophytes (Physcomitrella patens, PptCRS1), gymnosperm (Selaginella moellendorffi, SmoCRS1), dicotyledon (Arabidopsis thaliana, AthCRS1) and monocotyledon (Zea mays, ZmaCRS1) were obtained from GenBank (http://www.ncbi.nlm.nih.gov/, accessed on 22 August 2021) and aligned with clustalW2 software, showing that the CRS1 proteins are conserved (Figure S2). Exon skipping of ZmCRS1 resulted in disruption of the second CRS1_YhbY domain and the deletion of the coiled-coil domain (Figure S2).

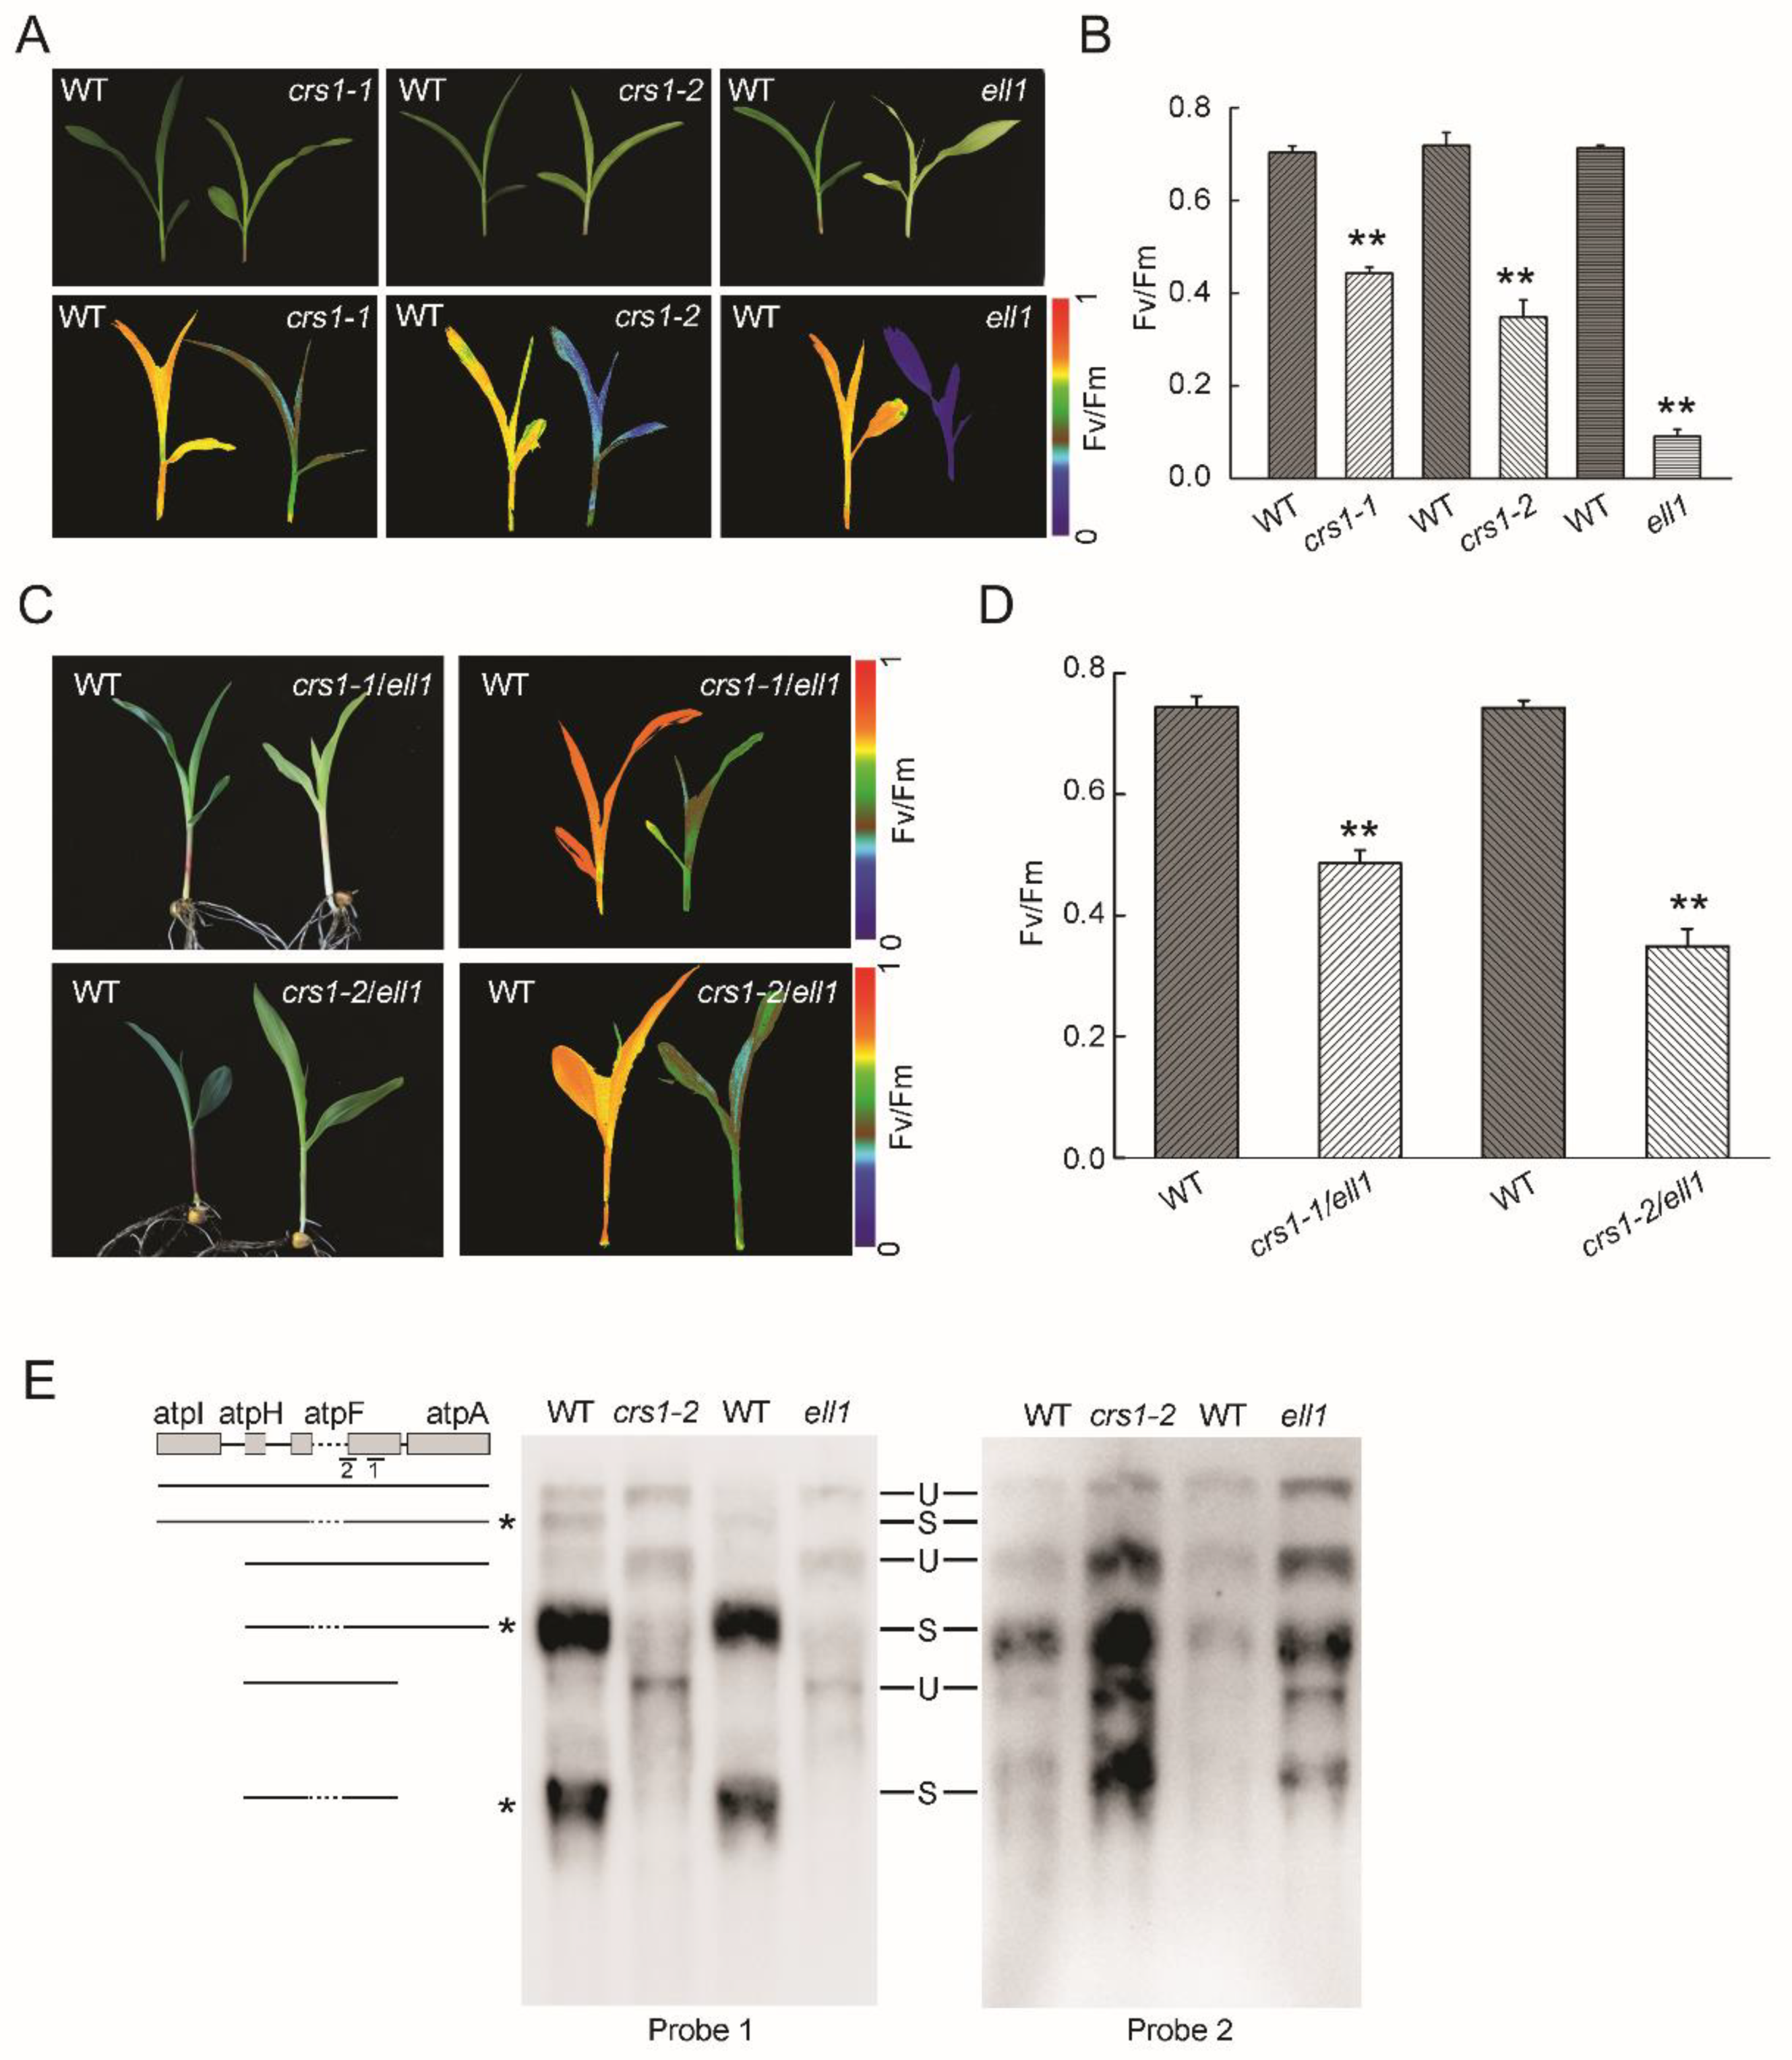
2.5. The Incorrectly Spliced CRS1 Is Responsible for Phenotypes of ell1 Mutant

To further confirm that the phenotype of the ell1 mutant was due to disruption of CRS1, we obtained the crs1 mutator insertion mutants crs1-1 and crs1-2 from maize GDB (https://www.maizegdb.org/, accessed on 18 March 2018). Interestingly, the crs1-1 mutant had normal leaves while the crs1-2 mutant had light yellow leaves (Figure 5A). Among the three alleles, crs1-1 and ell1 had the highest and lowest Fv/Fm level, respectively, which was consistent with their phenotype (Figure 5A,B). As the homozygous crs1 mutants were seedling-lethal, we could not cross the homozygous ell1 to homozygous crs1-1 or crs1-2. Therefore, we crossed heterozygous ell1 to heterozygous crs1-1 and crs1-2. We speculated that the segregation would be observed in the F1 individuals if these two mutants had the same mutated gene. In fact, we observed segregations in both of the F1 individuals from crosses of ell1 with crs1-1 and crs1-2, in agreement with the 3:1 ratio of Mendel’s law of segregation (Figure 5C,D). These F1 individuals had light yellow leaves and decreased Fv/Fm in contrast to the WT (Figure 5C,D). These genetic analysis results confirmed that the mutated ZmCRS1 is responsible for the severe phenotype of ell1. In addition, to investigate the effect of exon skipping on the function of CRS1, the expression level of CRS1 was measured by a quantitative real-time RT-PCR. We observed that the expression of CRS1 was significantly decreased in crs1-2 and ell1 (Figure S3A). Previous studies have shown that CRS1 is a specific splicing factor for atpF intron splicing [18,19]. We then analyzed the splicing of atpF pre-mRNA in crs1-2, ell1 and WT plants by RNA gel-blot using the exon (probe one) and intron (probe two) specific probes (Figure 5E). Clearly, no normal spliced atpF mRNAs but dramatically increased unspliced precursors were detected in both the crs1-2 and ell1 mutants (Figure 5E). Consistently, the quantification of atpF RNA by qRT-PCR revealed a significantly reduced expression of atpF both in crs1-2 and ell1 compared to the WT (Figure S3B). Taken together, our results demonstrate that the splicing activity for atpF pre-mRNA is compromised due to the incorrectly spliced CRS1 in ell1.

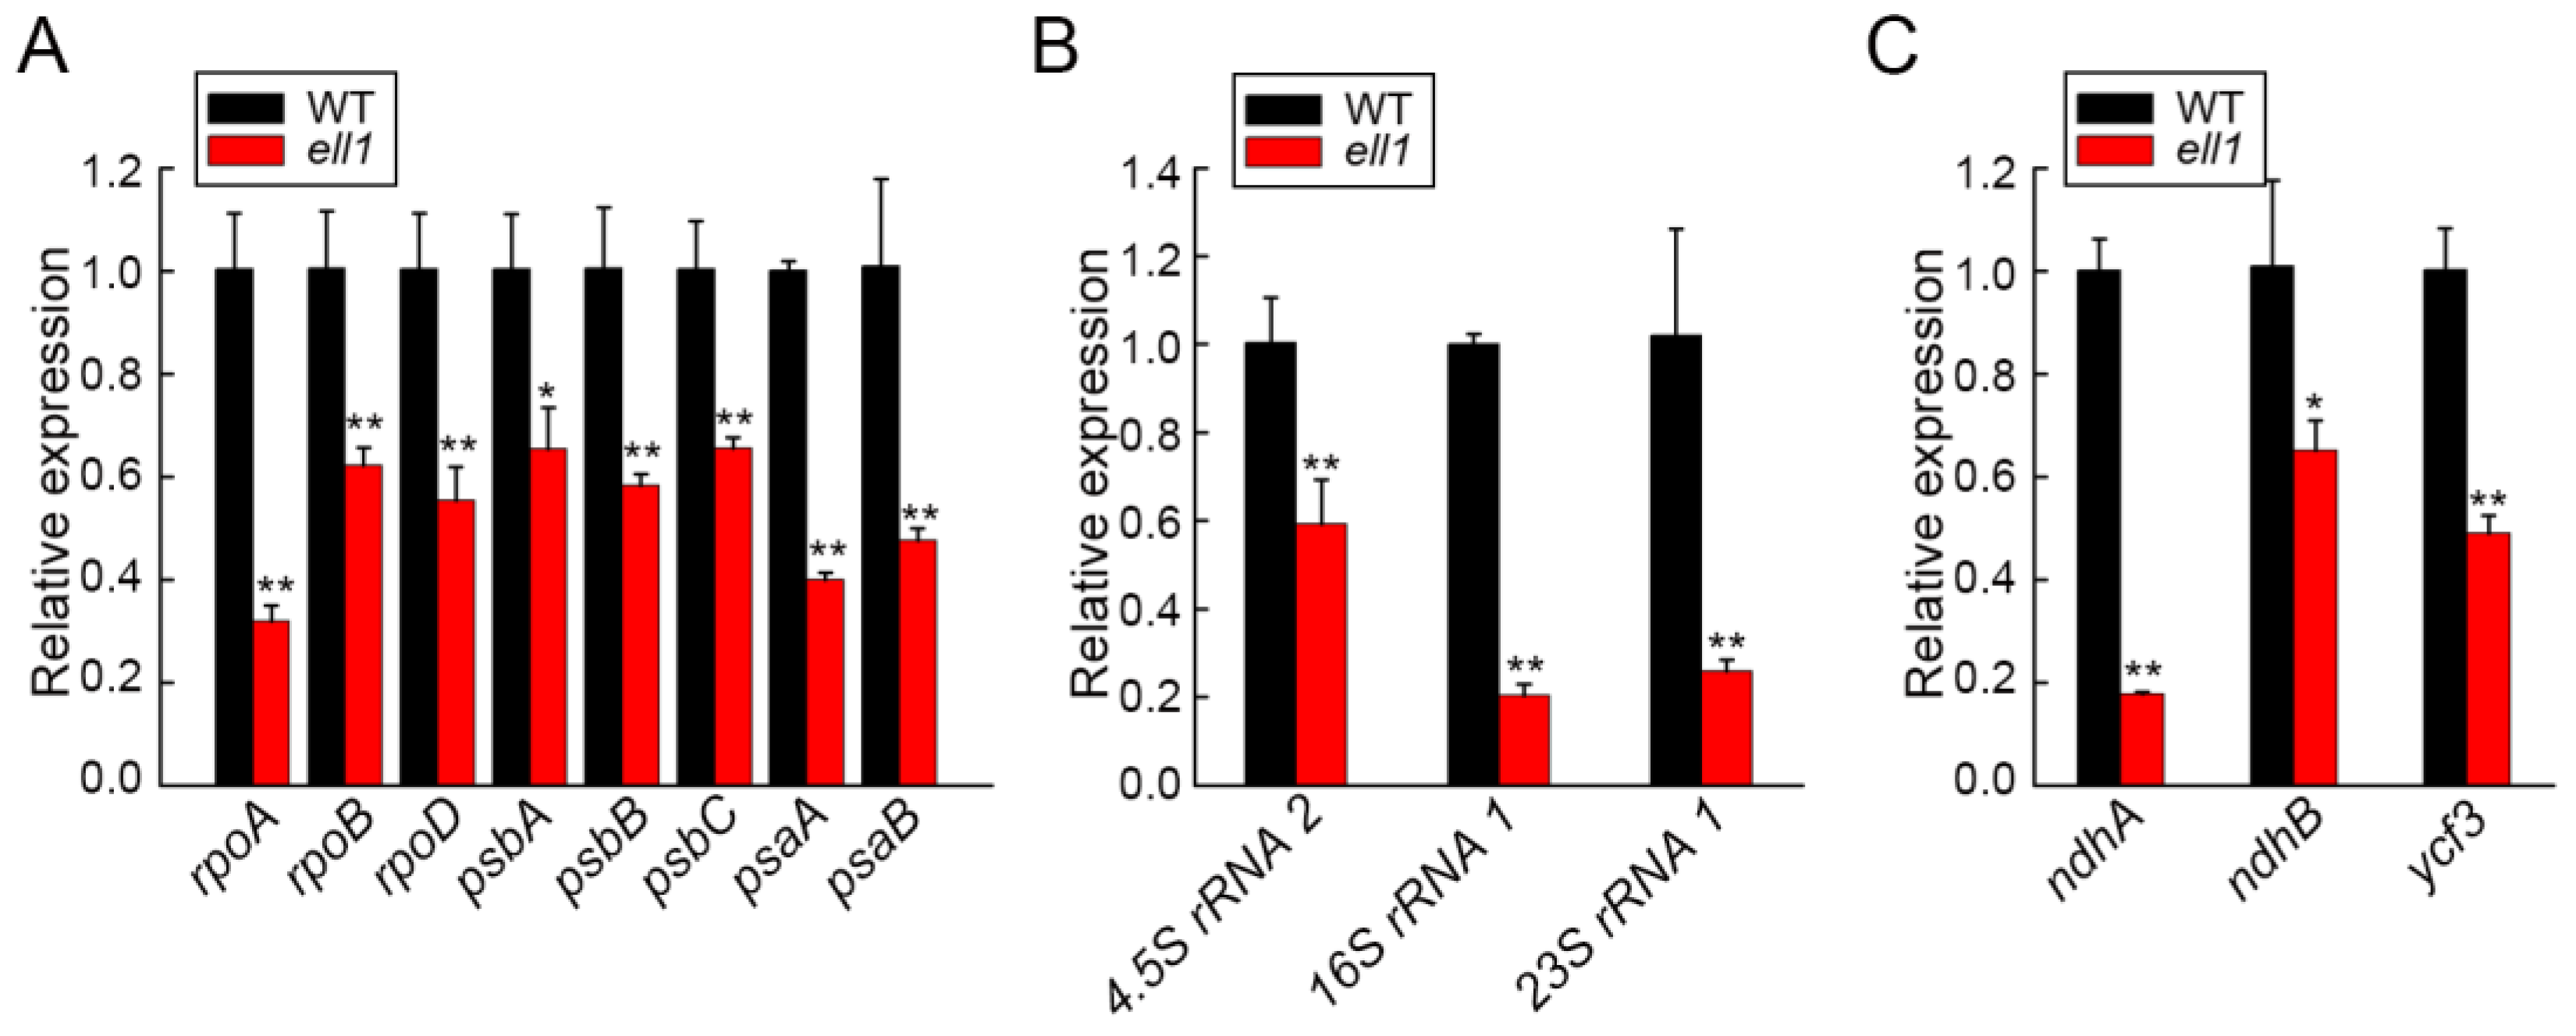
2.6. Chloroplast Transcription Is Affected in the ell1 Mutant

In high plants, chloroplast genome-encoded genes are transcribed by plastid-encoded RNA polymerase (PEP) [5]. Since CRS1 is a chloroplast located protein, we then performed the real-time RT-PCR analysis to explore whether exon skipping in CRS1 disturbed chloroplast gene expression (Figure 6). Firstly, we analyzed the transcription levels of PEP subunits genes (RpoA, RpoB, RpoD) and observed decreased gene transcription in the ell1 mutant (Figure 6A). Similarly, transcription levels of the core subunits of PSII (psbA and psbB) and PSI (psaA and psaB) were also significantly decreased in ell1 compared to the WT (Figure 6A). In addition, to determine whether exon skipping in CRS1 inhibited the chloroplast translation, we quantified the transcription levels of chloroplast ribosomal RNAs and found that expressions of these RNAs were significantly inhibited in ell1 (Figure 6B). Moreover, we also detected the reduced expression levels of chloroplast genes containing group IIB introns (ndhA, ndhB and ycf3) in ell1 (Figure 6C). Taking these results together, we proposed that ZmCRS1 is likely to coordinate the expression of a subset of chloroplast-associated genes to regulate chloroplast development.

3. Discussion

3.1. ZmCRS1 Is Required for Chloroplast Development in Maize

Chloroplast development is indispensable for plant growth and development. Thus, plant growth and yield can be severely restricted if chloroplast development is impaired [27,28]. It is therefore important to identify novel factors that function in the regulation of chloroplast development. In this study, we isolated and characterized the ell1 mutant, which displayed etiolated leaves and died gradually following the three-leaf stage due to its low photosynthetic capacity (Figure 1). The significantly decreased chlorophyll contents in ell1 may be responsible for its etiolated leaves (Figure 1). In photosynthesis, light is captured and electron transport in the thylakoid membranes is mediated by pigment-binding proteins and complexes [1]. However, only trace amounts of the photosynthetic protein complexes and their core subunits were detected (Figure 1 and Figure 2), which may explain the low photosynthetic capacity of ell1. The abnormal chloroplasts may be formed because of photooxidative damage and deficient photosynthetic electron flow in ell1. The decreased chlorophyll content, severely impaired core photosynthetic proteins and drastic defected chloroplasts architecture in ell1 mutant indicate an essential role of ZmCRS1 in chloroplast development (Figure 1, Figure 2 and Figure 3).

3.2. Exon Skipping Induced Incorrect Splicing of CRS1 Is Responsible for ell1 Phenotypes

In plants, pre-RNA splicing includes excision of introns and ligation of exons [25]. Stepwise assembly and interactions of the UsnRNPs at 5′ or 3′ splice site is a key process [22,25]. Disruption of the splice sites disturbs such interactions and commonly results in missing of the exon and both flanking introns during splicing [21,22]. In our study, we cloned the ZmELL1 as ZmCRS1 with a single base change (G to A) at the 5′ splice site of intron 5 in CRS1 (Figure 4). In addition, the results of the PCR amplification and sequencing revealed that exon 5 of CRS1 was missing in ell1 (Figure 4), suggesting that the single base change may have induced an exon skipping of CRS1. Previous studies have reported that the skipped exons usually have a similar UA content as the flanking exons [25]. Interestingly, both intron 4 and intron 5 of ZmCRS1 have UA-rich regions and its exon 5 has the same UA content as the flanking exon 6 according to our calculations (Figure 4), suggesting that the single base change-induced exon skipping of CRS1 is responsible for the phenotypes of the ell1 mutant. Moreover, this was further confirmed by our genetic analysis (Figure 5).
It has been reported that exon skipping occurs in Arabidopsis COP1 and Cucumis sativus CsSEP2 and eventually results in the dysfunction of these proteins [25,26]. CRS1 has three conserved CRS1_YhbY domains which are derived from a prokaryotic ribosome-associated protein [11,29]. The exon skipping in ZmCRS1 caused the disruption of the second CRS1_YhbY domain and the deletion of the coiled-coil domain (Figure 5 and Figure S2). The coiled-coil domain is essential for the dimerization of CRS1 to bind atpF [19]. The plastid-encoded atpF gene encodes the CFoI subunit which is required for accumulation of the chloroplast ATP synthase. The reduced chloroplast ATP synthase thereby results in the retardation of plant development and abnormal chloroplast development [13,17,30]. Therefore, we propose that the ell1 phenotype may be caused by a defect in the atpF gene and the incorrectly spliced CRS1 may lose the splicing activity. Northern blot and qRT-PCR analysis showed the significantly increased unspliced atpF precursor mRNAs (Figure 5 and Figure S3), which strongly proved our hypothesis. Quantitative analysis revealed that the expression of CRS1 is only slightly affected except exon 5 in ell1, while it is almost abolished in the mutator insertion line crs1-2 (Figure S3), suggesting that exon skipping affects CRS1 splicing but not its transcription.

3.3. ZmCRS1 Participates in Chloroplast Transcription to Regulate Chloroplast Development

The splicing functions and intron specificities of CRS1 are conserved between monocot (maize) and dicot (Arabidopsis) plants [13,18,31,32]. However, CRS1 has been shown to be involved both in regulating the splicing of the chloroplast group II introns and possibly also chloroplast group I introns in rice [13]. Furthermore, alternative spliced CRS1 may also be required for chloroplast translation in maize [18]. However, it remains unclear whether ZmCRS1 has other functions besides its splicing roles. Quantitative analysis showed that the expression of plastid-encoded genes, chloroplast ribosomal RNA genes and chloroplast genes containing group IIB introns was significantly reduced in ell1 (Figure 6), suggesting that ZmCRS1 probably participates in chloroplast transcription and the splicing of group IIB and I introns, which is similar to its homologous protein AL2 in rice [13].
Overall, our results showed a single base change induced exon skipping of CRS1 and the incorrectly spliced CRS1 failed to mediate atpF intron splicing. Moreover, CRS1 probably coordinates the transcription of chloroplast-associated genes to regulate chloroplast development. Further studies are still required to reveal the molecular mechanism of CRS1 in regulating of chloroplast development in maize.

4. Materials and Methods

4.1. Plant Materials and Growth Conditions

The maize (Zea mays L.) ell1 mutant was obtained from the MaizeGDB stock center (www.maizegdb.org/data_center/stock, accessed on 26 June 2011), which was generated by ethyl methanesulfonate (EMS)-mutagenized. Maize plants were grown in the greenhouse or in the experimental field in the Henan and Hainan Provinces under natural growth conditions.

4.2. Photosynthetic Pigments Measurements

The measurement of photosynthetic pigments was performed as described previously [33]. A total of 0.4 g of ten-day-old fresh leaf tissue from wild-type plants and ell1 mutant was fully homogenized in 95% ethanol. Chl a, Chl b and carotenoid levels were determined with a UV/VIS spectrophotometer measuring absorbencies at 665, 649 and 470 nm, respectively. Afterwards, pigment contents were calculated as described.

4.3. Chlorophyll Fluorescence Measurements

Chlorophyll fluorescence was measured according to the previously described method [34] using a CF Imager system (Technologica, Essex, UK). Samples were dark-adapted for 30 min at room temperature prior to all measurements. Minimum fluorescence (Fo) was measured by weak red light. Maximum fluorescence of the dark-adapted seedlings (Fm) was determined during a subsequent saturating pulse of white light (8000 μmol m−2 s−1 for 0.8 s). The maximum quantum yield of PSII photochemistry in the dark-adapted state, Fv/Fm, was calculated as Fv/Fm = (Fm − Fo)/Fm.

4.4. Blue-Native PAGE and Immunoblot Analysis

Eight-day-old leaves were used to isolate thylakoid membrane proteins as described in [30,35]. Thylakoid membranes were treated with 2% n-dodecyl-β-D-maltoside (DM) and incubated for 20 min on ice. Subsequent BN-PAGE, two dimensional (2D)/SDS-PAGE and an immunoblot analysis were performed as described previously [30,35].

4.5. Transmission Electron Microscopy

For TEM, two to six days old leaves of wild type and ell1 were cut into small pieces and fixed in 2.5% glutaraldehyde in a phosphate buffer at 4 °C for 4 h. Fixed samples were rinsed and postfixed in 1% OsO4 overnight at 4 °C. The samples were then dehydrated in a graded ethanol series and then infiltrated and embedded in Epon 812 resin. For the TEM analysis, thin sections were generated using a diamond knife microtome and viewed using a JEM-1230 transmission electron microscope (JEOL, Tokyo, Japan).

4.6. Nucleic Acid Analysis

Maize leaf genomic DNA was extracted as previously described in [36]. Total RNA was extracted from 0.1 g leaves with 1 mL Trizol reagent (Thermo fisher Scientific, Waltham, MA, USA) according to the manufacturer’s instructions. The isolated RNA was treated with RNase-free DNase I (NEB, Ipswich, MA, USA) to remove DNA contamination. Reverse transcription was performed using Oligo (dT)15 primer and M-MLV reverse transcriptase (Promega, Madison, WI, USA) with a final volume of 20 µL. Quantitative real-time RT-PCR was performed using UltraSYBR Mixture on a Lightcycler 480 II instrument (Roche, Basel, Switzerland). The relative mRNA abundance in samples was calculated using Livak and Schmittgen’s 2−ΔΔCt method [37].

4.7. Marker Development and Fine Mapping

Marker development and fine mapping was performed as described in [38]. The fine mapping population included 6500 BC1 and 968 F2 segregation plants and was constructed by crossing the zb7 mutant and B73. Genomic DNA was extracted and analyzed for co-segregation using available SSR markers (www.maizegdb.org, accessed on 22 August 2021). New SSR markers were found using the SSRHunter 1.3 Simple Sequence Repeat Search tool and designed using Primer 5.0 based on the B73 genome sequence (www.maizesequence.org, accessed on 22 August 2021).

4.8. Northern-Blot Analysis

Total RNA was extracted from the three-leaf period seedlings using 1 mL of TRIZOL reagent (Thermofisher Scientific, Waltham, MA, USA) from 100 mg of tissue according to the manufacturer’s instructions and immediately used for RNA-blot analysis. A total of 10 μg of total RNA was separated by 1.2% formaldehyde-agarose gel and stained with ethidium bromide to ensure equal loading. The gel was washed for 10 min in sterile water and 15 min in 10 × SSC to remove the formaldehyde, and then transferred to nylon membranes (Hybond-N+, Amersham Biosciences, Florham Park, NJ, USA) in 20 × SSC as described [30,39]. The probes were amplified and RNA blot hybridization and detection was carried out using DIG Luminescent Detection Kit (Roche, Basel, Switzerland) according to the manufacturer’s instructions.

Supplementary Materials

The following are available online at https://www.mdpi.com/article/10.3390/ijms221910668/s1, Figure S1: Electron micrographs of chloroplasts from the wild type and ell1 mutant. Figure S2: Sequence alignment of CRS1 proteins. Figure S3: Expression of the incorrectly spliced CRS1 is not affected in ell1 mutant.

Author Contributions

M.W., K.L., Z.D., L.M. and Y.L. performed the experiments, M.W. and Z.D. drafted the manuscript, Z.H. and S.G. participated in text editing, M.W., Z.D. and C.-P.S. designed the experiment, supervised the study, and revised the manuscript. All authors have read and agreed to the published version of the manuscript.

Funding

This work was supported by the National Key Research and Development Program (2020YFA0907600), the Program for Innovative Research Team (in Science and Technology) in University of Henan Province (21IRTSTHN019), the China Postdoctoral Science Foundation (2019M652522) and the Key project of Science and Technology research of Education Department of Henan Province (20A180004).

Institutional Review Board Statement

Not applicable.

Informed Consent Statement

Not applicable.

Data Availability Statement

The data presented in this study are available in this article and Supplementary Material.

Acknowledgments

We thank the MaizeGDB for providing the mutant seeds.

Conflicts of Interest

The authors declare no conflict of interest.

References

  1. Nelson, N.; Ben-Shem, A. The complex architecture of oxygenic photosynthesis. Nat. Rev. Mol. Cell Biol. 2004, 5, 971–982. [Google Scholar] [CrossRef] [PubMed]
  2. Jarvis, P.; Lopez-Juez, E. Biogenesis and homeostasis of chloroplasts and other plastids. Nat. Rev. Mol. Cell Biol. 2013, 14, 787–802. [Google Scholar] [CrossRef] [PubMed]
  3. Leister, D. Chloroplast research in the genomic age. Trends Genet. 2003, 19, 47–56. [Google Scholar] [CrossRef]
  4. Li, H.-M.; Chiu, C.-C. Protein Transport into Chloroplasts. Annu. Rev. Plant Biol. 2010, 61, 157–180. [Google Scholar] [CrossRef]
  5. Yu, Q.B.; Huang, C.; Yang, Z.N. Nuclear-encoded factors associated with the chloroplast transcription machinery of higher plants. Front. Plant Sci. 2014, 5, 316. [Google Scholar] [CrossRef] [Green Version]
  6. Tang, J.; Zhang, W.; Wen, K.; Chen, G.; Sun, J.; Tian, Y.; Tang, W.; Yu, J.; An, H.; Wu, T.; et al. OsPPR6, a pentatricopeptide repeat protein involved in editing and splicing chloroplast RNA, is required for chloroplast biogenesis in rice. Plant Mol. Biol. 2017, 95, 345–357. [Google Scholar] [CrossRef]
  7. Shiina, T.; Tsunoyama, Y.; Nakahira, Y.; Khan, M.S. Plastid RNA Polymerases, Promoters, and Transcription Regulators in Higher Plants. Int. Rev. Cytol. 2005, 244, 1–68. [Google Scholar] [CrossRef]
  8. Zubo, Y.O.; Kusnetsov, V.V.; Börner, T.; Liere, K. Reverse protection assay: A tool to analyze transcriptional rates from individual promoters. Plant Methods 2011, 7, 47. [Google Scholar] [CrossRef] [Green Version]
  9. Stern, D.B.; Goldschmidt-Clermont, M.P.; Hanson, M. Chloroplast RNA Metabolism. Annu. Rev. Plant Biol. 2010, 61, 125–155. [Google Scholar] [CrossRef]
  10. Huang, W.; Zhu, Y.; Wu, W.; Li, X.; Zhang, D.; Yin, P.; Huang, J. The Pentatricopeptide Repeat Protein SOT5/EMB2279 Is Required for Plastid rpl2 and trnK Intron Splicing. Plant Physiol. 2018, 177, 684–697. [Google Scholar] [CrossRef] [PubMed] [Green Version]
  11. de Longevialle, A.F.; Small, I.D.; Lurin, C. Nuclearly encoded splicing factors implicated in RNA splicing in higher plant or-ganelles. Mol. Plant 2010, 3, 691–705. [Google Scholar] [CrossRef] [Green Version]
  12. Bonen, L.; Vogel, J. The ins and outs of group II introns. Trends Genet. 2001, 17, 322–331. [Google Scholar] [CrossRef]
  13. Liu, C.; Zhu, H.; Xing, Y.; Tan, J.; Chen, X.; Zhang, J.; Peng, H.; Xie, Q.; Zhang, Z. Albino Leaf 2is involved in the splicing of chloroplast group I and II introns in rice. J. Exp. Bot. 2016, 67, 5339–5347. [Google Scholar] [CrossRef]
  14. Lehmann, K.; Schmidt, U. Group II Introns: Structure and Catalytic Versatility of Large Natural Ribozymes. Crit. Rev. Biochem. Mol. Biol. 2003, 38, 249–303. [Google Scholar] [CrossRef]
  15. Lambowitz, A.M.; Zimmerly, S. Mobile Group II Introns. Annu. Rev. Genet. 2004, 38, 1–35. [Google Scholar] [CrossRef] [Green Version]
  16. Bird, C.; Koller, B.; Auffret, A.; Huttly, A.; Howe, C.; Dyer, T.; Gray, J. The wheat chloroplast gene for CF0 subunit I of ATP synthase contains a large intron. EMBO J. 1985, 4, 1381–1388. [Google Scholar] [CrossRef] [PubMed]
  17. Zhang, L.; Zhou, W.; Che, L.P.; Rochaix, J.D.; Lu, C.M.; Li, W.J.; Peng, L.W. PPR Protein BFA2 Is Essential for the Accumulation of the atpH/F Transcript in Chloroplasts. Front. Plant Sci. 2019, 10, 446. [Google Scholar] [CrossRef] [PubMed] [Green Version]
  18. Till, B.; Schmitz-Linneweber, C.; Williams-Carrier, R.; Barken, A. CRS1 is a novel group II intron splicing factor that was de-rived from a domain of ancient origin. RNA 2001, 7, 1227–1238. [Google Scholar] [CrossRef] [PubMed] [Green Version]
  19. Ostersetzer, O.; Cooke, A.M.; Watkins, K.P.; Barkan, A. CRS1, a Chloroplast Group II Intron Splicing Factor, Promotes Intron Folding through Specific Interactions with Two Intron Domains. Plant Cell 2005, 17, 241–255. [Google Scholar] [CrossRef] [PubMed] [Green Version]
  20. Bonen, L. Cis- and trans-splicing of group II introns in plant mitochondria. Mitochondrion 2008, 8, 26–34. [Google Scholar] [CrossRef] [PubMed]
  21. Staley, J.P.; Guthrie, C. Mechanical Devices of the Spliceosome: Motors, Clocks, Springs, and Things. Cell 1998, 92, 315–326. [Google Scholar] [CrossRef] [Green Version]
  22. Wahl, M.C.; Will, C.L.; Lührmann, R. The Spliceosome: Design Principles of a Dynamic RNP Machine. Cell 2009, 136, 701–718. [Google Scholar] [CrossRef] [Green Version]
  23. Berget, S.M. Exon Recognition in Vertebrate Splicing. J. Biol. Chem. 1995, 270, 2411–2414. [Google Scholar] [CrossRef] [Green Version]
  24. Reed, R. Initial splice-site recognition and pairing during pre-mRNA splicing. Curr. Opin. Genet. Dev. 1996, 6, 215–220. [Google Scholar] [CrossRef]
  25. Simpson, C.G.; McQuade, C.; Lyon, J.; Brown, J.W. Characterization of exon skipping mutants of the COP1 gene from Ara-bidopsis. Plant J. 1998, 15, 125–131. [Google Scholar] [CrossRef] [Green Version]
  26. Wang, X.; Gao, D.L.; Sun, J.J.; Liu, M.; Lun, Y.Y.; Zheng, J.S.; Wang, S.H.; Cui, Q.Z.; Wang, X.F.; Huang, S.W. An exon skipping in a SEPALLATA-Like gene is associated with perturbed floral and fruits development in cucumber. J. Integr. Plant Biol. 2016, 58, 766–771. [Google Scholar] [CrossRef] [PubMed] [Green Version]
  27. Pogson, B.; Albrecht, V. Genetic Dissection of Chloroplast Biogenesis and Development: An Overview. Plant Physiol. 2011, 155, 1545–1551. [Google Scholar] [CrossRef] [PubMed] [Green Version]
  28. Wang, Y.L.; Wang, C.M.; Zheng, M.; Lyu, J.; Xu, Y.; Li, X.H.; Niu, M.; Long, W.H.; Wang, D.; Wang, H.Y.; et al. WHITE PANICLE1, a Val-tRNA synthetase regulating chloroplast ribosome biogenesis in rice, is essential for early chloroplast development. Plant Physiol. 2016, 170, 2110–2123. [Google Scholar] [CrossRef] [PubMed]
  29. Barkan, A.; Klipcan, L.; Ostersetzer, O.; Kawamura, T.; Asakura, Y.; Watkins, K.P. The CRM domain: An RNA binding module derived from an ancient ribosome-associated protein. RNA 2006, 13, 55–64. [Google Scholar] [CrossRef] [PubMed] [Green Version]
  30. Zhang, L.; Pu, H.; Duan, Z.; Li, Y.; Liu, B.; Zhang, Q.; Li, W.; Rochaix, J.-D.; Liu, L.; Peng, L. Nucleus-Encoded Protein BFA1 Promotes Efficient Assembly of the Chloroplast ATP Synthase Coupling Factor 1. Plant Cell 2018, 30, 1770–1788. [Google Scholar] [CrossRef] [Green Version]
  31. Asakura, Y.; Barkan, A. Arabidopsis Orthologs of Maize Chloroplast Splicing Factors Promote Splicing of Orthologous and Species-Specific Group II Introns. Plant Physiol. 2006, 142, 1656–1663. [Google Scholar] [CrossRef] [PubMed] [Green Version]
  32. Asakura, Y.; Barkan, A. A CRM domain protein functions dually in group I and group II intron splicing in land plant chlo-roplasts. Plant Cell 2007, 19, 3864–3875. [Google Scholar] [CrossRef] [PubMed] [Green Version]
  33. Lichtenthaler, H.K.; Buschmann, C. Chlorophylls and carotenoids: Measurement and characterization by UV-VIS spectros-copy. Curr. Protoc. Food Anal. Chem. 2001, 1, F4.3.1–F4.3.8. [Google Scholar] [CrossRef]
  34. Gao, Z.; Liu, H.; Wang, H.; Li, N.; Wang, D.; Song, Y.; Miao, Y.; Song, C. Generation of the genetic mutant population for the screening and characterization of the mutants in response to drought in maize. Chin. Sci. Bull. 2014, 59, 766–775. [Google Scholar] [CrossRef]
  35. Duan, Z.; Kong, F.; Zhang, L.; Li, W.; Zhang, J.; Peng, L. A bestrophin-like protein modulates the proton motive force across the thylakoid membrane in Arabidopsis. J. Integr. Plant Biol. 2016, 58, 848–858. [Google Scholar] [CrossRef] [PubMed] [Green Version]
  36. Tan, B.-C.; Chen, Z.; Shen, Y.; Zhang, Y.; Lai, J.; Sun, S.S.M. Identification of an Active New Mutator Transposable Element in Maize. G3 Genes Genome Genet. 2011, 1, 293–302. [Google Scholar] [CrossRef] [Green Version]
  37. Livak, K.J.; Schmittgen, T.D. Analysis of relative gene expression data using real-time quantitative PCR and the 2−Δ∆CT method. Methods 2001, 25, 402–408. [Google Scholar] [CrossRef]
  38. Liu, Y.; Subhash, C.; Yan, J.; Song, C.; Zhao, J.; Li, J. Maize leaf temperature responses to drought: Thermal imaging and quantitative trait loci (QTL) mapping. Environ. Exp. Bot. 2011, 71, 158–165. [Google Scholar] [CrossRef]
  39. Zhang, L.; Duan, Z.; Zhang, J.; Peng, L. Biogenesis Factor Required for Atp Synthase 3 Facilitates Assembly of the Chloroplast ATP Synthase Complex. Plant Physiol. 2016, 171, 1291–1306. [Google Scholar] [CrossRef] [Green Version]
Figure 1. Identification and characterization of the maize ell1 mutants. (A) Identification of the ell1 mutant. Six-day-old seedlings of WT (seedlings with green leaves) and mutants (seedlings with yellow leaves) were photographed. (B) Analysis of the pigment content of the ell1 mutant and WT plants. Pigments were extracted from the three-leaf stage seedlings and were determined with a UV/VIS spectrophotometer measuring absorbencies at 665, 649 and 470 nm, respectively. (C) False-color images representing the maximum quantum yield of PSII photochemistry of the WT and the ell1 mutant. The photosynthetic parameter Fv/Fm was measured after dark adaptation for 30 min using a CF Imager system, the color scale (0 to 1.0) on the right represents the signal intensities for Fv/Fm (C). (D) Calculation of Fv/Fm in the WT and the ell1 mutant. Fv/Fm was calculated as (Fm-Fo)/Fm. (E) Growth and development of the WT and ell1 mutant. Photographs were taken from germination to the three-leaf stage of WT and ell1. Asterisks indicate where WT and ell1 differ significantly (** p < 0.01, Student’s t-test). All data is presented as the means ± SD (n ≥ 3).
Ijms 22 10668 g001
Figure 2. Accumulation of photosynthetic proteins is reduced in ell1. (A) Immunoblot analysis of thylakoid proteins. Thylakoid proteins were extracted from three-leaf stage seedlings of WT and ell1 and loaded with equal total proteins. * Non-specific signal. (B) BN-PAGE analysis of thylakoid membrane protein complexes. Thylakoid membranes were isolated and separated by 5–12% BN-PAGE, the gels stained with Coomassie Brilliant Blue (CBB) are shown on the right. NDH-PSI indicates the NDH-PSI supercomplex. (C) Two-dimensional BN/SDS-PAGE separation of thylakoid protein complexes. Thylakoid complexes separated by BN-PAGE in the first dimension (B) were subjected to denaturing SDS-urea-PAGE. Proteins were stained with CBB; the identities of relevant proteins are indicated.
Ijms 22 10668 g002
Figure 3. Electron micrographs of chloroplasts from the wild-type and ell1 mutant. Chloroplasts from three-day-old wild-type (WT) and ell1 plants observed by transmission electron microscopy. Magnified views (for (a,d), bars = 5 μm; for (b,e), bars = 1 μm; for (c,f), bars = 0.5 μm) are shown on the right.
Ijms 22 10668 g003
Figure 4. Positional cloning of the ZmCRS1 gene. (A) Fine mapping of the ZmELL1 gene and annotated genes in the 1.4 Mb region. (B) Amplification of GRMZM2G078412 in WT plant and ell1 mutant by PCR, cDNAs were used as templates. (C) Gene structure of ZmCRS1 in the wild-type and ell1 mutant. Exons are shown as red boxes and lines indicate the intron. The missing exon 5 is indicated as a blue box and black arrows. (D) Exon skipping of the ZmCRS1 gene. Splicing was analyzed between exon 4 (E4) and exon 6 (E6), the skipped exon 5 (E5) is shown as a white box. Percentage AU content of the exons (boxes) and introns (gray horizontal line), sizes are indicated in base pairs (bp). (E) Exon skipping of exon 5. Red letters indicate the missing cDNA region (corresponding to exon 5) which is represented as black dotted lines in ell1. The sequence of the 5′ splice consensus site in the mutant is also shown. The thick black lines indicate the major splicing events in the WT and the ell1 mutant.
Ijms 22 10668 g004
Figure 5. ZmELL1 encodes the CRS1 protein. (A,B) Growth and low-Fv/Fm phenotypes of the crs1 mutants. Images of three-leaf stage plants are shown in the upper panel. Plants were dark-adapted for 30 min at room temperature and Fo and Fm were measured using a CF Imager system. Fv/Fm was calculated as Fv/Fm= (Fm − Fo)/Fm shown in (A,B). (C,D) Growth and segregation of the F1 hybrid generation. Images of three-leaf stage plants are shown in the left panel and low-Fv/Fm phenotypes are shown in the right panel. crs1-1/ell1, individual with pale-green leaf of the hybrid F1 population of heterozygous ell1/crs1-1 seedlings. crs1-2/ell1, individual with pale-green leaf of the hybrid F1 population of heterozygous ell1/ crs1-2 seedlings. Asterisks in (B,D) indicate where the WT and ell1 differ significantly (** p < 0.01, Student’s t-test). All of the data are presented as the means ± SD (n ≥ 3). (E) RNA gel blotting illustrating the atpF splicing defect in crs1-2 and ell1 mutants. Total RNA from wild-type (WT), crs1-2, or ell1 seedlings was analyzed by hybridization with an atpF-specific probe (1 and 2). RNA bands marked with asterisks lack the atpF intron.
Ijms 22 10668 g005
Figure 6. Relative expression of chloroplast genes in ell1. Relative expression of the chloroplast genes in wild type and ell1, including (A) plastid-encoded genes, (B) chloroplast ribosomal RNA genes and (C) chloroplast genes containing group IIB introns in wild type and ell1. Values are the means of three biological repeats with SD (n = 3). Asterisks indicate where the WT and ell1 differ significantly (* 0.01 < p < 0.05, ** p < 0.01, Student’s t-test).
Ijms 22 10668 g006
Publisher’s Note: MDPI stays neutral with regard to jurisdictional claims in published maps and institutional affiliations.

