Abstract
The green rice leafhopper (GRH, Nephotettix cincticeps Uhler) is one of the most important insect pests causing serious damage to rice production and yield loss in East Asia. Prior to performing RNA-Seq analysis, we conducted an electrical penetration graph (EPG) test to investigate the feeding behavior of GRH on Ilpum (recurrent parent, GRH-susceptible cultivar), a near-isogenic line (NIL carrying Grh1) compared to the Grh1 donor parent (Shingwang). Then, we conducted a transcriptome-wide analysis of GRH-responsive genes in Ilpum and NIL, which was followed by the validation of RNA-Seq data by qPCR. On the one hand, EPG results showed differential feeding behaviors of GRH between Ilpum and NIL. The phloem-like feeding pattern was detected in Ilpum, whereas the EPG test indicated a xylem-like feeding habit of GRH on NIL. In addition, we observed a high death rate of GRH on NIL (92%) compared to Ilpum (28%) 72 h post infestation, attributed to GRH failure to suck the phloem sap of NIL. On the other hand, RNA-Seq data revealed that Ilpum and NIL GRH-treated plants generated 1,766,347 and 3,676,765 counts per million mapped (CPM) reads, respectively. The alignment of reads indicated that more than 75% of reads were mapped to the reference genome, and 8859 genes and 15,815,400 transcripts were obtained. Of this number, 3424 differentially expressed genes (DEGs, 1605 upregulated in Ilpum and downregulated in NIL; 1819 genes upregulated in NIL and downregulated in Ilpum) were identified. According to the quantile normalization of the fragments per kilobase of transcript per million mapped reads (FPKM) values, followed by the Student’s t-test (p < 0.05), we identified 3283 DEGs in Ilpum (1935 upregulated and 1348 downregulated) and 2599 DEGs in NIL (1621 upregulated and 978 downregulated) with at least a log2 (logarithm base 2) twofold change (Log2FC ≥2) in the expression level upon GRH infestation. Upregulated genes in NIL exceeded by 13.3% those recorded in Ilpum. The majority of genes associated with the metabolism of carbohydrates, amino acids, lipids, nucleotides, the activity of coenzymes, the action of phytohormones, protein modification, homeostasis, the transport of solutes, and the uptake of nutrients, among others, were abundantly upregulated in NIL (carrying Grh1). However, a high number of upregulated genes involved in photosynthesis, cellular respiration, secondary metabolism, redox homeostasis, protein biosynthesis, protein translocation, and external stimuli response related genes were found in Ilpum. Therefore, all data suggest that Grh1-mediated resistance against GRH in rice would involve a transcriptome-wide reprogramming, resulting in the activation of bZIP, MYB, NAC, bHLH, WRKY, and GRAS transcription factors, coupled with the induction of the pathogen-pattern triggered immunity (PTI), systemic acquired resistance (SAR), symbiotic signaling pathway, and the activation of genes associated with the response mechanisms against viruses. This comprehensive transcriptome profile of GRH-responsive genes gives new insights into the molecular response mechanisms underlying GRH (insect pest)–rice (plant) interaction.
1. Introduction
During their life cycle, plants are constantly confronted by different sorts of environmental stimuli (abiotic stress) [1,2] or attacks from living organisms (biotic stress), including pathogens such as bacteria, viruses, fungi, nematodes, and insect pests causing serious damages to crops. Despite their fundamental roles in food production [3,4], insects are said to be responsible for a reduction in the yield of crops, which results in economic losses across the world [5,6], thus putting at risk the food security. Various measures have been proposed to control and minimize these losses, and the most practical and economical control measure is the use of resistant varieties to insect pests.
Rice (Oryza sativa L.) is recognized as the staple food for nearly half of the global population, which is projected to reach about 9.8 billion people by 2050 [7]. The rapid increase in the global population has been the key driver to increasing rice production and productivity across the globe. This cereal crop (rice), solely cultivated for human consumption, is the host plant to many insect pests, including planthoppers (brown planthopper (BPH): Nilaparvata lugens Stal, small brown planthopper (SBPH): Laodelphax striatellus Fallen, green leafhopper (GLH): Nephotettix virescens Distant, green rice leafhopper (GRH): Nephotettix cincticeps Uhler, whitebacked planthopper (WBPH): Sogatella furcifera Horvath, and zigzag leafhopper (ZLH): Recilia dorsalis Motschulsky), stem borers, and gall midges, which are considered as the most serious pests of rice [8]. Among them, GRH, known as one of the most important insect pests threatening rice production in East Asia [9], has been identified as a vector for the rice dwarf virus (RDV), rice waika virus (RWV) [10], rice transitory yellow virus (RTYV) [11], and rice yellow dwarf virus (RYDV). The control of insect pests such as GRH in rice production is a challenging task, involving the use of pesticides or a biological control approach. These methods are costly and harmful to the environment. The use of resistant rice lines has been proposed as the most effective way to overcome crop failure caused by GRH and viral diseases conveyed by this insect pest [11,12].
Intrinsic to their mode of action, GRHs suck sap from both the xylem and the phloem of susceptible rice varieties, leading to plant growth failure [13] and important economic losses [14]. According to Matsumoto et al. [15], during the feeding process on the rice plant, the GRH accumulates bioactive proteins such as laccase and beta-glucosidase in its salivary glands [16,17], which have the ability to hinder the defense system of the host plant, eventually enabling the insect to ingest nutrients derived from the host, resulting in cell death [18,19].
Upon insect pest attack, plants activate the appropriate defense mechanism, tending to provide a proper level of resistance to combat the stress. During this event, defense-related genes are induced, while antioxidant systems (nonenzymatic and enzymatic) and phytohormone signaling cascades are activated [20]. Among the plant hormones involved in the plant stress response mechanism against biotic stresses, salicylic acid (SA) and jasmonic acid (JA) have been shown to be predominant [21]. Under the same conditions, a transcriptional reprogramming within the cell takes place, which is followed by the accumulation of protein kinases, secondary metabolites, and changes in the photosynthetic process, among other cellular processes [22].
For several decades, many plant breeding research programs have shown a growing interest in developing crop varieties with improved resistance against economically important insect pests, including GRH. In recent years, the use of molecular breeding techniques such as marker-assisted selection (MAS) or marker-assisted backcrossing (MABC), as well as gene pyramiding on various types of breeding populations, such as near-isogenic lines (NILs), recombinant inbred lines (RILs), doubled haploid (DH) lines, and pyramiding lines, have proven beneficial for developing rice varieties carrying a single gene or multiple GRH resistance genes [23,24].
So far, studies aimed at investigating quantitative trait loci (QTLs) associated with GRH resistance in rice have employed forward genetics, in addition to linkage mapping and QTL analysis or genome-wide association studies (GWAS) approaches. These studies have proposed a number of QTLs mapped to different chromosomes of rice, and, in some cases, fine mapping of major QTLs has been performed, resulting in the identification of putative candidate genes (Grh1, chromosome 5 [25]; Grh2, chromosome 11; Grh3, chromosome 6; Grh4, chromosome 3; Grh5, chromosome 8 [13]; Grh6, chromosome 4; Grh9 [23,26]). Of this number, a few genes have been cloned and functionally characterized.
Recent advances in molecular breeding research and the emergence of genome sequencing technologies have introduced a wide range of opportunities and possibilities for exploring the molecular basis underlying the defense mechanisms of plants in response to pathogens or attack of pests. As sequencing technology has improved and costs have decreased, an exponential increase in the use of transcriptome studies has been observed, and RNA sequencing (herein referred to as RNA-Seq) has been employed to explore the molecular mechanisms of various biological phenotypes [27,28,29,30,31,32]. In addition to the conventional use of gene annotation, profiling, and expression comparison, transcriptome studies have been applied for many other purposes, such as gene structure analysis, identification of novel genes or regulatory RNAs, RNA editing analysis, co-expression or regulatory network analysis, biomarker discovery, development-associated imprinting studies, single-cell RNA sequencing studies, and pathogen–host dual RNA sequencing studies.
This study aimed to investigate the transcriptome-wide profile, as well as the defense mechanisms and signaling pathways activated, when rice plants are infested with green rice leafhopper (GRH). To achieve that, we used a rice near-isogenic line (NIL) reported by Park et al. [33] (carrying the Green rice leafhopper resistance 1 (Grh1) locus, which has been fine mapped to chromosome 5 and located in a region covered by 670 kbp) and the rice cultivar Ilpum (GRH-susceptible) exposed to GRH infestation. Then, we performed a transcriptome study to identify novel GRH-responsive genes between the NIL GRH-resistant line and Ilpum. In addition, we monitored the feeding behavior of GRH, over time, on GRH-resistant and -susceptible rice lines, using the electrical penetration graph (EPG) technique to investigate the molecular mechanisms underlying Grh1-mediated resistance against GRH, and we elucidated the molecular basis for the GRH (insect pest)–rice (plant) interaction, which would explain the differential transcriptome profile between GRH-susceptible and -resistant rice lines, as well as the activation or suppression of diverse regulatory pathways, coupled with reprogramming of physiological and biochemical processes.
2. Results
2.1. Feeding Behavior of GRH Reared on Ilpum and NIL Carrying Grh1
Electrical penetration graph (EPG) technology has long been employed to observing the stylet probing behavior of waveforms in each process, from host detection to insect feeding, and it helps examine the phloem feeding activity of the insect on the host plant [34]. Waveforms, classified from Nc1 to Nc6, are shown for each feeding pattern. The Nc6 waveform implies that the GRH sucks the phloem sap [35]. The EPG results in panels A and B of Figure 1 show the feeding behavior of GRH on Ilpum and NIL, respectively. These results indicate that GRH could not penetrate the stylet in the phloem of NIL (as indicated by the Nc5 waveform) compared to Ilpum. This feeding pattern was similarly observed when GRH were reared on Shingwang (the donor parent of Grh1) showing zero (0) in the cumulative Nc6 column (see Table S1). The accumulated Nc6 waveform in Ilpum implies that GRH had took up substances from the phloem, as indicated by the Nc6 average value of 137.4 ± 126.1 min.
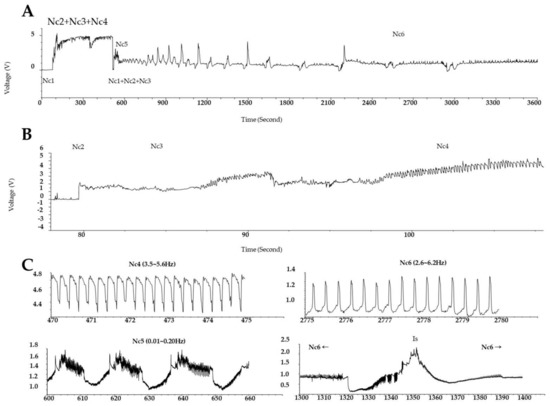
Figure 1.
Electrical penetration graph (EGP) showing the feeding patterns of green rice leafhopper over time. EPG of GRH reared (A) on Ilpum (GRH-susceptible) and (B) on near-isogenic line (NIL) harboring Grh1 locus; (C) frequencies of waveforms (Nc1 to Nc6). Typically, to take up phloem sap, waveforms are categorized as follows: Nc1→Nc2→Nc3→Nc5→Nc6. Nc1 means non-probing, Nc2 indicates the penetration of stylet into host, Nc3 signifies path and salivation, Nc4 represents xylem feeding, Nc5 shows salivation or physical activity in the phloem, and Nc6 represents phloem sap sucking. Nc2–Nc6 indicate the time to reach the stylet to phloem and ready to take up nutrients from the phloem. Accumulated Nc6 means the accumulative time to take up nutrients from the phloem. Shingwang and NIL showed similar patterns in Nc2–Nc6, accumulated Nc6, and Nc2–Nc5.
In addition to the feeding habit of GRH on the susceptible and resistant rice lines (Figure 1), we estimated the survival percentage of GRH reared on Ilpum and NIL. Results indicate that GRH reared on Ilpum (GRH susceptible) recorded a significant and sustained survival percentage over time, with 72% of insects still alive 72 h after infestation. In contrast, 60% of insects died 36 h after being infested in NIL (near-isogenic line) seedlings carrying the Grh1 resistance locus. The death rate increased with time and reached 92% (or 8% of alive GRH) at the final count (72 h after infestation) (Figure 2).
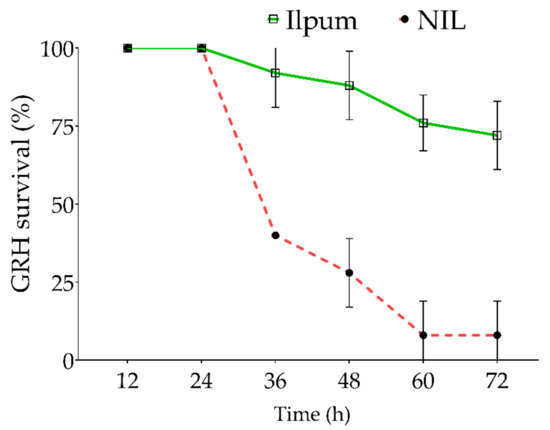
Figure 2.
Survival percentage of green rice leafhopper over time. Ten green rice leafhoppers (GRHs) were placed in each test tube containing a single rice seedling. The number of alive GRHs was counted every 12 h from the initial infestation time, and the survival percentage was estimated for each time point. The red dotted line indicates the near-isogenic line (NIL, a cross between Shingwang carrying Grh1 locus and Ilpum) GRH-infested, while the green continuous line represents the survival of Ilpum GRH-infested. Error bars denote the SD of mean values (10 insects per tube) in quintuplet.
2.2. Transcriptome Analysis
To investigate the changes in gene expression profile during GRH feeding-mediated biotic stress, rice seedlings placed in test tubes were infested with 10 insects (GRH) per tube, and leaf samples were collected 48 h post infestation, in duplicate, for RNA-Seq analysis of Ilpum (recurrent parent) and NIL. Another set of leaf samples were collected from seedlings grown without GRH. Data in Figure 3 indicate highly significant changes in gene expression profile at p < 0.05. We observed a 13.3% increase in the number of upregulated genes in the NIL compared to Ilpum (Figure 3C,D). In the same way, the number of read counts (CPM) of Ilpum GRH-treated and NIL GRH-treated plants was 526,030 and 690,017, respectively (Figure 3A,B), which revealed about a 31.2% increase in NIL.
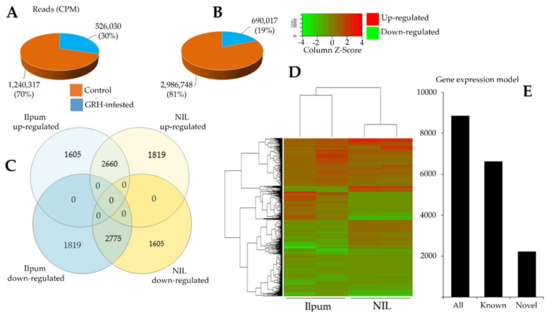
Figure 3.
Differentially expressed genes of green rice leafhopper (GRH)—responsive genes between Ilpum and near-isogenic line (NIL). Reads count in (A) Ilpum and (B) NIL control and GRH-treated plants; (C) up- and downregulated genes in Ilpum and NIL; (D) heat map showing differentially expressed genes (DEGs) between Ilpum and near-isogenic line (NIL) in response to GRH in duplicate (two samples sequenced per rice line for nontreated and GRH-infested seedlings. Data used to generate the heat map are expressed as Log2FC); (E) gene expression model. Log2FC, logarithm base 2 of the fold change calculated from the fragment per kilobase of transcript per million mapped reads (FPKM Value_2/Value_1).
On the basis of the quantile normalization of the fragments per kilobase of transcript per million mapped reads (FPKM) values (followed by the Student’s t-test, p < 0.05), we identified 3283 DEGs in Ilpum (1935 upregulated and 1348 downregulated) and 2599 DEGs in NIL (1621 upregulated and 978 downregulated) with at least log2 (logarithm base 2) twofold change (Log2FC ≥2) in the expression, in response to GRH. Up to 75% of these reads successfully mapped to the rice reference genome database (Figure 3E). In total, 8859 genes and 15,815,400 transcripts were identified (Figure 3C). Of this number, 4265 and 4594 genes were upregulated and downregulated, respectively, in Ilpum vs. 4479 and 4380 up- and downregulated, respectively, in NIL. Among them, 3424 were differentially expressed genes (DEGs, 1605 upregulated in Ilpum but downregulated in NIL; 1819 genes upregulated in NIL but downregulated in Ilpum), which represents about 38.6% of the total number of expressed genes. Under the same conditions, 2660 genes were commonly upregulated and 2775 were downregulated in Ilpum and NIL, respectively.
The major characteristic of near-isogenic lines (NILs), also known as inbred lines, is the identical genetic makeups with their recurrent parent except for a few specific locations or genetic loci as a result of an introgression of a desirable character or trait (gene) from a donor parent into an otherwise agronomically acceptable cultivar (recurrent parent) [36]. Here, Ilpum and NIL had the same genetic background, except the genetic locus covering Grh1, a GRH-resistance locus introduced from the rice cultivar Shingwang (donor parent) to Ilpum (recurrent parent). This is reflected in the heat map (Figure 3D), which shows the pattern of DEGs and commonly expressed genes in response to GRH. The quantile normalization of the fragment per kilobase of transcript per million mapped reads (FPKM) values (value 1 and value 2) and the selection of DEGs having at least twofold change (Log2FC) in their transcriptional level in response to GRH infestation led to 2250 DEGs being identified in Ilpum, of which 1410 genes were upregulated and 840 were downregulated. Similarly, 1834 DEGs were identified (1237 upregulated and 597 downregulated genes). The gene expression and raw sequence data were submitted to the Gene Expression Omnibus (GEO) and Short Read Archive (SRA) at NCBI (https://www.ncbi.nlm.nih.gov/geo/submitter/), accessed on 25 August 2021, with accession numbers GSE176497 and SRP323419, respectively, using FileZilla 3.54.1 software (Tim Kosse, FileZilla ©2004-20021, https://filezilla-project.org/), accessed on 25 August 2021. Lists of the 10 most upregulated and 10 most downregulated genes in Ilpum and NIL are given in Table S2 and Table S3, respectively, and discussed below in detail.
Because a large number of genes, classified in diverse regulatory pathways, showed differential transcriptome profiles between Ilpum and NIL, we were interested to unveil the identity of DEGs that exhibited opposite expression patterns. The results of the comparative transcriptome profiling indicate that, of the top 20 DEGs, 10 were upregulated in Ilpum by GRH (7.6–12.6 log2FC) but downregulated in NIL (–1.6 to –9.9 log2FC) (Table 1). Meanwhile, the other 10 DEGs showed an opposite transcriptional pattern (downregulated in Ilpum by –0.13 to –8.3, while being upregulated in NIL by 8.4–12.5 log2FC). In the same way, the top 10 upregulated genes showed an increase in their expression levels by 8.1–15.4 log2FC in NIL, while having lower expression levels in Ilpum under the same conditions (upregulated by 0.2–2.7 log2FC) (Table 2).

Table 1.
Top 20 differentially expressed (DEGs) genes between Ilpum and near-isogenic line.
Table 2.
Top 10 exponentially induced genes in NIL compared to Ilpum.
2.3. Functional Classification of Genes: Gene Ontology Enrichment Analysis
In the perspective of identifying the classes to which the identified GRH-responsive genes belong, a Gene Ontology (GO) classification was done, according to the molecular function, biological process, and cellular response. The GO enrichment revealed that a broad range of molecular functions and biological processes were involved, among which the binding activity, transport activity, and catalytic activity predominated. The majority of the identified genes were proposed to be involved in the macromolecule catabolic process, organic acid biosynthetic process, carboxylic acid biosynthesis, protein catabolic process, or cofactor metabolism (Figure S1A). In the same way, the Kyoto Encyclopedia of Genes and Genomes (KEGG) pathway analysis showed that most of the identified GRH-responsive genes belong to phytohormone biosynthesis pathways, terpenoid and steroid synthesis, alkaloid biosynthesis pathway from shikimate and terpenoids, or carbone fixation during photosynthesis (Figure S1B). In addition, most of the genes encoding proteins were localized in the cell membrane, ribonucleoprotein complex, or organelle membrane (Figure S1D).
2.4. Differentially Expressed Genes Associated with Abiotic and Biotic Stresses Response
Fifty-eight DEGs were proposed to be associated with the response to external stimuli. Of this number, 34 were associated with abiotic stress response, and 24 were associated with biotic stress response (Figure 4G). The set of DEGs associated with abiotic stress included drought stress (stomatal closure signaling: two), cold stress (cold response sensor: three), heat stress (heat response transcriptional regulator: two, temperature sensing and signaling: one), salinity (salt overly sensitive (SOS) signaling pathway: four, GA signaling pathway crosstalk: two), light (red or far red light: four, UV-A/blue light: 12), carbon dioxide (CO2 sensing and signaling: two), and gravity sensing and signaling (four). Among the 34 genes, 18 were differentially regulated between Ilpum and NIL (seven genes were downregulated in Ilpum (log2FC: −0.12 to −1.24) but upregulated in NIL (Log2FC: 0.03–1.46), while six other genes were upregulated in Ilpum (Log2FC: 0.04–2.53) but downregulated in NIL (Log2FC: −0.1 to −4.87)). Some of the DEGs (downregulated in Ilpum and upregulated in NIL), which are associated with the abiotic stress response, include EID1 (a regulator component encoding the CUL4–DDB1 ubiquitination complex), PIF transcription factor, PKS (phototropin signaling factor), ARG1 (signaling protein factor), SCaBP8/CBL10 (SOS3-SOS2, salt overly sensitive signaling and calcium-dependent regulatory protein), and DELLA transcription factor (involved in GA signaling pathway crosstalk).
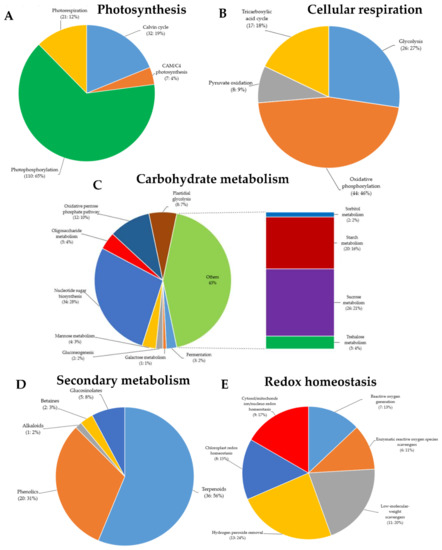
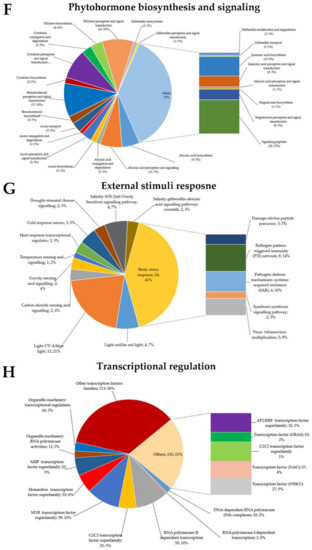
Figure 4.
Gene Ontology (GO) terms of green rice leafhoppers fed rice. Differentially expressed genes (DEGs) associated with (A) photosynthesis, (B) cellular respiration, (C) carbohydrate metabolism, (D) secondary metabolism, (E) reduction–oxidation (redox) homeostasis, (F) phytohormone biosynthesis and signaling, (G) external stimuli response, and (H) transcriptional regulation in response to green rice leafhopper (GRH)-induced biotic stress in rice.
GRH infestation is primarily considered as a biotic stress, because the stress is induced by a living organism (insect pest), which is also a vector for various plant’s viruses. Here, DEGs associated with biotic stress response included the damage-elicitor peptide precursor (three), pathogen-pattern triggered immunity (PTI) network (eight), pathogen defense mechanisms (systemic acquired resistance, SAR: six), symbiotic signaling pathway (two), and virus response mechanism (five). It was interesting to see that five genes associated with pathogen response mechanism exhibited a differential transcriptional regulation between Ilpum and NIL (upregulated in Ilpum (Log2FC: 0.6–2.5) but downregulated in NIL (Log2FC: −0.09 to −0.5) (Table S4). These genes included ARL8 (encoding small GTPase associated with tobamovirus multiplication), PEPR (pep-elicitor peptide receptor involved in damage repair), and three genes (XLG, AGG1/2, and PCRK) associated with the pattern-triggered immunity (PTI) network and bacterial elicitor response. Furthermore, as shown in Figure 3 and Figure 4, RNA-Seq results showed differential transcriptional regulation between specific genes associated with different metabolic pathways and the cellular response to abiotic and biotic stress response between Ilpum and NIL following GRH infestation.
2.5. Differentially Expressed Genes Involved in Hormone Metabolism and Other Signaling Cascades
Upon stress induction, from living organisms (biotic stress) or environmental factors (abiotic stress), plants activate various signaling cascades that are sent as an alert to activate the required defense system. In plants, phytohormones, in addition to being essential for growth and development of plants, serve as signaling molecules under stress. After being perceived, signals are transduced at a whole-plant level and allow the activation of various antioxidant systems, followed by a transcriptional reprogramming within the cell. Here, upon GRH infestation, the RNA-Seq results revealed that 168 DEGs associated with phytohormone biosynthesis or signaling (abscisic acid (ABA) biosynthesis: nine, perception and signaling: 11, and conjugation and degradation: two; auxin biosynthesis: three, perception and signal transduction: five, conjugation and degradation: two, and transport: five; brassinosteroid (BR) biosynthesis: four, and perception and signal transduction: 17; cytokinin (CK) biosynthesis: three, perception and signal transduction: 15, and conjugation and degradation: five; ethylene (ET) biosynthesis: six, and perception and signal transduction: 16; gibberellin (GA) biosynthesis: two, perception and signal transduction: one, modification and degradation: two, and transport: one; jasmonic acid (JA) biosynthesis: 15, and perception and signal transduction: eight; salicylic acid (SA) perception and signal transduction: one; strigolactone (SL) biosynthesis: one, and perception and signal transduction: eight) were induced or suppressed. Another group of 25 DEGs were categorized as signaling peptides (Figure 4F).
We were interested to see the differential transcriptional level of phytohormone signaling pathway genes in response to GRH. As shown in Figure 5 and Table S4, of the 168 identified DEGs, 56 genes recorded differential expression patterns between Ilpum and NIL, of which 37 showed a downregulation pattern in Ilpum (Log2FC: −0.01 to −7.3) but were upregulated in NIL (Log2FC: 0.03–8.1), whereas 19 genes were upregulated in Ilpum (Log2FC: 0.24–3.5) but downregulated in NIL (Log2FC: −0.01 to −4.9) under the same conditions. However, 112 had similar expression patterns in Ilpum and NIL. The DEGs included auxin (biosynthesis, transport, conjugation and degradation, perception and signal transduction), brassinosteroids (BR biosynthesis, perception and signal transduction), cytokinin (CK biosynthesis, perception and signal transduction, conjugation and degradation), ethylene (ET biosynthesis, perception and signal transduction), gibberellin (GA biosynthesis, perception and signal transduction, modification and degradation, and transport), jasmonic acid (JA biosynthesis, perception and signal transduction), salicylic acid (SA perception and signal transduction), strigolactone (SL biosynthesis, perception and signal transduction), and other signaling peptide-related genes.
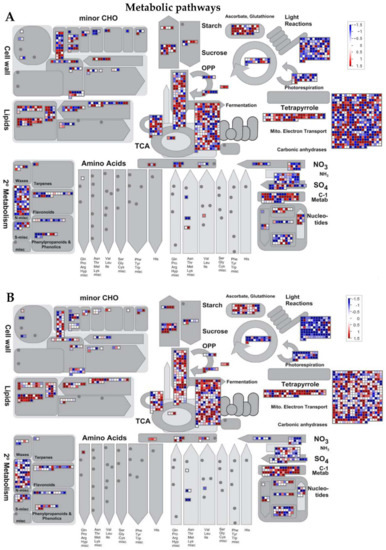
Figure 5.
MapMan illustration of differentially changes in transcriptional regulation of metabolic pathways DEGs between Ilpum and NIL in response to GRH infestation. Induction or suppression of the expression of genes involved in different metabolic pathways in (A) Ilpum and (B) near-isogenic line (NIL) derived from a cross between Ilpum (recurrent parent) and Shingwang (donor parent of Grh1), in response to green rice leafhopper (GRH) infestation in rice. Red squares are upregulated genes and blue squares are downregulated genes. Data are logarithm base 2 of fold change (Log2FC) (FPKM_value 2/FPKM_value 1). Red boxes are upregulated genes, blue boxes are downregulated genes, and white color indicates Log2FC ± zero.
2.6. DEGs Associated with Secondary Metabolism and Redox Homeostasis
Secondary metabolites, also known as secondary (specialized) or natural products, are organic compounds derived from primary metabolites generated by living organisms, including plants, which are not required for the growth, development, or reproduction of the organism but are produced to confer a selective advantage to the organism. For instance, they may be involved in plants defense or act as regulators in various plant metabolic processes, among other factors [37]. In this study, in addition to the defense-related genes mentioned in the above paragraphs, the MapMan analysis of the RNA-Seq data indicated that, of all the DEGs identified following GRH infestation, 64 were associated with secondary metabolism in plants (terpenoids: 36, phenolics: 20, glucosinolates: five, betaines: two, and alkaloids: one) (Figure 4D). In addition, panel E of Figure 4 indicates that 54 DEGs were associated with reduction–oxidation (redox) homeostasis (reactive oxygen species (ROS) generation: seven, enzymatic ROS scavengers: six, low-molecular-weight scavengers: 11, hydrogen peroxide (H2O2) removal: 13, chloroplast redox homeostasis: eight, and cytosol/mitochondrion/nucleus redox homeostasis: nine).
The transcriptional regulation of genes associated with secondary metabolism was as follows: 24 genes exhibited differential transcript accumulation patterns between Ilpum and NIL, of which 12 genes were downregulated in Ilpum (Log2FC: −0.02 to −3.78) but upregulated in NIL, and the other 12 were upregulated in Ilpum (Log2FC: 0.04–1.6), while being downregulated in NIL (Log2FC: −0.2 to −2.7). However, the remaining 40 genes had similar expression patterns between Ilpum and NIL. Regarding the transcriptional regulation of genes associated with redox homeostasis, 27 were differentially expressed between Ilpum and NIL, where 12 genes were downregulated in Ilpum (Log2FC: −0.4 to −4.9) but upregulated in NIL (Log2FC: 0.01–1.6). Under the same conditions, 15 genes exhibited an upregulation pattern in Ilpum (Log2FC: 0.02–5.04), while being downregulated in NIL (Log2FC: −0.04 to −2.1) (Figure 5 and Figure 6, Table S4).
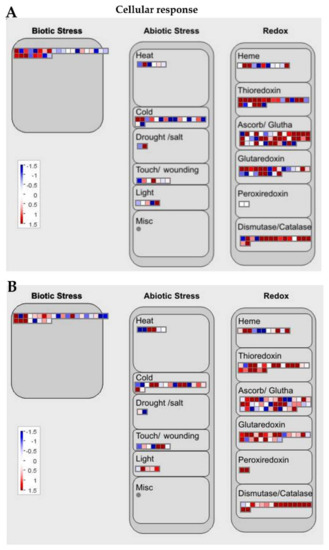
Figure 6.
MapMan cellular response overview of the transcriptional regulation between Ilpum and NIL upon GRH infestation. Induction or suppression of the expression of genes involved in different metabolic pathways in (A) Ilpum and (B) near-isogenic line (NIL) derived from a cross between Ilpum (recurrent parent) and Shingwang (donor parent of Grh1), in response to green rice leafhopper (GRH) infestation in rice. Red squares are upregulated genes and blue squares are downregulated genes. Data are logarithm base 2 of fold change (Log2FC) (FPKM_value 2/FPKM_value 1). Red boxes are upregulated genes, blue boxes are downregulated genes, and white color indicates Log2FC ± zero.
2.7. Differentially Expressed Genes with GO Terms Involved in Cellular Functions
MapMan analysis showed that 170 DEGs are involved in photosynthesis (Calvin cycle: 32, CAM/C4 photosynthesis: seven, photophosphorylation: 110, photorespiration: 21) (Figure 4A). Among them, 52 genes were differentially regulated. In essence, 12 were downregulated in Ilpum (Log2FC −0.286 to −2.372) but upregulated in NIL (Log2FC 0.08–6.67), whereas 40 were upregulated in Ilpum (Log2FC: 0.002–6.69) but downregulated in NIL (Log2FC: −0.21 to −11.3). In the same way, 95 and 122 DEGs were associated with cellular respiration (glycolysis: 26, oxidative phosphorylation: 44, pyruvate oxidation: eight, tricarboxylic acid (TCA) cycle: 17) and carbohydrate metabolism (fermentation: three, galactose metabolism: one, gluconeogenesis: two, mannose metabolism: four, nucleotide sugar biosynthesis: 34, oligosaccharide metabolism: five, oxidative pentose phosphate pathway: 12, plastidial glycolysis: eight, sorbitol metabolism: two, starch metabolism: 20, sucrose metabolism: 26, and trehalose metabolism: five), respectively. A comparative transcriptome analysis revealed that, among the genes controlling cellular respiration, 34 were differentially regulated (10 downregulated in Ilpum (Log2FC: −0.71 to −5.75) but upregulated in NIL (Log2FC: 0.48–5.17), and 24 upregulated in Ilpum (Log2FC: 0.099–4.49) but downregulated in NIL (Log2FC: −0.15 to −4.19)), and 61 genes showed a similar expression pattern (upregulated or downregulated) in both Ilpum and NIL. Likewise, out of the 122 DEGs involved in the carbohydrate metabolism, 55 genes were differentially regulated (31 downregulated in Ilpum (Log2FC: −0.06 to −13.71) but upregulated in NIL (Log2FC: 0.16–11.54), and 24 genes were upregulated in Ilpum (Log2FC: 0.28–4.36) but downregulated in NIL (Log2FC: −0.03 to −3.99)), while 75 genes had similar transcript accumulation patterns in both Ilpum and NIL (Table S4).
Another set of 80 DEGs, identified as GRH-responsive genes, based on their annotation, were associated with multi-process signaling (SnRK1-kinase regulatory system: 13, programmed cell death (PCD: 11), circadian clock system: 14, organelle machinery: 12, target of rapamycin (TOR) signaling: eight, G-protein signaling: one, phosphoinositide lipid regulatory system: 27, and Rop-GTPase regulatory system: five) (Figure S2A), protein modification (acetylation: five, glycosylation: 30, protein folding: 24, disulfide bond formation: 4, targeting peptide maturation: 26, hydroxylation: 3, S-glutathionylation: 26, S-nitrosylation: one, lipidation: 12, and phosphorylation: 365) (Figure S2B), cell-cycle organization (cell-cycle control: 16, DNA replication: seven, mitosis and meiosis: 18, cytokinesis: 12, organelle DNA replication: three, organelle division: five, and membrane organization: 11) (Figure S2C). In the same way, data identified DEGs associated with nutrient uptake (copper uptake: three, iron uptake: 14, phosphorus assimilation: 10, sulfur assimilation: four, nitrogen assimilation: 23) (Figure S2D) and protein homeostasis (ubiquitin fold protein conjugation: 117, ubiquitin-proteasome system: 49, Cullin: 46, Hsp90 chaperone system: 11, cytosolic Hsp70 chaperone system: 17, plastidial Hsp70 chaperone system: five, ribosome-associated chaperon activities: eight, ER quality control (ERQC, endoplasmic reticulum: 10), ER-associated protein degradation (ERAD: 19), chloroplast-associated protein degradation: one, autophagy: 20, proteolysis: 106, protein repair: one) (Figure S2E). From a global perspective, we observed that 35 genes out of 80 in the category of multi-process signaling were differentially regulated between Ilpum and NIL (16 genes were downregulated in Ilpum (Log2FC: −0.11 to −3.12) but upregulated in NIL (Log2FC: 0.03–2.8), and 19 genes were upregulated in Ilpum (Log2FC: 0.01–2.71) but downregulated in NIL (Log2FC: −0.09 to −2.86), whereas 45 genes recorded a similar transcriptional level (Table S4).
2.8. Differentially Expressed Genes Associated with Transcriptional Regulation
The regulation of gene expression occurs at different levels of the metabolism of the cell. This important event involves many factors, including proteins, which act alone or in complex with other cellular compounds to regulate gene expression under specific conditions. Our RNA-Seq data show that, upon GRH infestation, 599 DEGs (356 upregulated and 243 downregulated) belonging to 53 transcription regulation complexes and transcription factor (TF) families were either induced or suppressed. Of this number, we can mention the basal transcription regulators such as RNA polymerase I (two) and II (59)-dependent transcription complexes, TIFY (13), and Sigma factor (two), as well as the commonly reported TF families such as C2C2 (32), bZIP (basic leucine zipper: 32), MYB (myeloblastosis: 59), Homeobox (33), and AP2/ERF (ethylene-responsive factor: 31) TF superfamilies, and the GRAS (GIBBERELILIN-INSENSITIVE (GAI), REPRESSOR of GA1-3 (RGA), and SCARECROW (SCR): 15), C2H2-ZF (31), C3H-ZF (19), NAC (27), and WRKY (27), basic helix–loop–helix (bHLH: 28) TF families (Figure 4H). Other TF families included NN-like TF (two), Alpin (six), cysteine proteinase 1 precursor (CPP1: two), EIL (six), heat-shock factor (HSF: 12), MAD/AGL (one), SBP (two), TUB (nine), ARR-B (three), and mTERF (14), among others (Figure 4H). Interestingly, the top 10 upregulated (Log2FC: 6.24–9.98) and top 10 downregulated (Log2FC: −3.07 to −7.78) TF-encoding genes belonged to the Homeobox, GRAS, Alfin, B3, RNA polymerase II, and C2H2-ZF TF families, and the Homeobox, mitochondrial transcription termination factor (mTERF), auxin-responsive factor (ARF), plastid-encoded bacterial-type RNA polymerase (PEP), C2H2F, myeloblastosis (MYB), NAC (no apical meristem (NAM), ATAF12, and cup-shaped cotyledon (CUC2)), polymerase complexes, and nuclear factor Y (NF-Y) TF families, for upregulated and downregulated, respectively.
In addition, among the 599 DEGs associated with the transcriptional regulation in response to GRH-induced biotic stress, 224 genes were differentially regulated between Ilpum and NIL (143 genes were downregulated in Ilpum (Log2FC: −0.03 to −7.21) but upregulated in NIL (Log2FC: 0.01–9.99), and 81 genes were upregulated in Ilpum (Log2FC: 0.01–8.42) but downregulated in NIL (Log2FC: −0.1 to −5.99)). However, 375 genes exhibited similar expression patterns between Ilpum and NIL (Figure 6, Table S4).
2.9. Differentially Expressed Genes Associated with Other Complex Cell Metabolism
We observed that GRH-induced biotic stress provoked changes in various plant metabolisms, in addition to what has been described in the previous paragraphs. As shown in panels F–O of Figure S2, hundreds of genes associated with cell-wall organization (130, 95 upregulated: Log2FC 0.025–10.05 and 35 downregulated: Log2FC −0.04 to −2.92), vesicle trafficking (179), protein translocation (87), solute transport (434), amino-acid metabolism, lipid metabolism (191), nucleotide metabolism (41), coenzyme metabolism (127), chromatin organization (117), and RNA processing (219) were differentially regulated between Ilpum and NIL in response to GRH. To this number, we can add genes involved in cytoskeleton organization (93), protein biosynthesis (233), and DNA damage response (22). Table S4 provides details comparative transcriptome profile based on MapMan characterization between Ilpum and NIL.
2.10. Confirmation by qPCR of GRH-Mediated Transcriptional Changes
With the purpose of validating the RNA-Seq data, the expression of 12 genes selected from RNA-Seq data (Ilpum upregulated genes: Os01g58100 (polyphenol oxidase, POD), Os04g43800 (phenylalamine-lyase), Os05g35290 (phenylalanine ammonia-lyase) and downregulated by GRH: Os03g03360 (ribosomal protein L5), Os06g40640 (fructose-bisphosphate aldolase isozyme), Os09g16910 (cysteine desulfurase 1, mitochondrial precursor); NIL upregulated genes: Os01g62020 (NAD dependent epimerase/dehydratase family domain-containing protein), Os04g43800 (phenylalanine ammonia-lyase), Os12g37260 (lipoxygenase 2.1, chloroplast precursor) and downregulated by GRH: Os01g62244 (ubiquitin-conjugating enzyme), Os07g04840 (23 kDa polypeptide of photosystem II, PsbP), Os12g17600 (ribulose bisphosphate carboxylase small chain, chloroplast precursor) among the most upregulated and downregulated were validated by qPCR (Figure 7A–D).
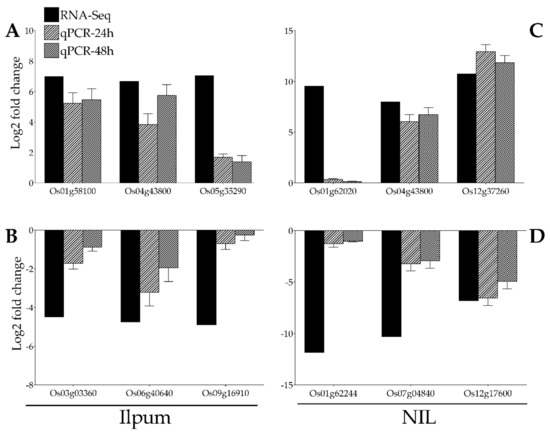
Figure 7.
Confirmation of RNA-Seq results by qPCR. A total of 12 genes identified as GRH-responsive through RNA-Seq-based transcriptome analysis (black bars) in GRH-infested rice leaves from Ilpum and derived near-isogenic line (NIL) were selected to validate the fold change in their expression by qPCR (bars with motif filling). These genes belong to different functional groups involved in various metabolic pathways in rice. (A) Upregulated and (B) downregulated genes in Ilpum, and (C) upregulated and (D) downregulated genes in NIL in response to GRH infestation.
In the same perspective, we were interested in investigating the expression of a set of genes either showing an enhanced transcript accumulation level in NIL (carrying Ghr1 locus) compared to Ilpum or exhibiting differential expression patterns between the two genetic materials under study. It was interesting to see that the expression level of Os07g34520 (OsADF3, Isocitrate lysate), and that of Os10g37340 (cystathionine gamma-synthase, pyridoxal phosphate-depended enzyme domain-containing protein) significantly increased in NIL (RNA-Seq: 1.93 Log2FC, qPCR: 1.86 (24 h) and 1.42 (48 h) for OsADF3 and RNA-Seq: 1.22 Log2FC, qPCR: 0.99 and 0.94 Log2FC, at 24 h and 48 h for cystathionine) carrying the resistance QTL Grh1 compared to Ilpum (RNA-Seq: 0.20, qPCR: 0.23 (24 h) and 0.78 (48 h) Log2FC for OsADF3 and RNA-Seq: 0.11 Log2FC, qPCR: 0.13 (24 h) and 0.42 (48 h) Log2FC) in response to GRH infestation (Figure 8A,B). In contrast, another set of genes including Os02g43330 (OsHOX24, Homeobox-associated leucine zipper), Os03g60580 (OsWCOR79, acting-depolymerizing factor), Os01g74450 (Aquaporin), and Os01g06740 (OsRIP1 or OsjRIP1.1, encoding ribosome-inactivating protein II) exhibited differential expression patterns (downregulated in Ilpum but upregulated in NIL) under the same conditions (Figure 8C–F).
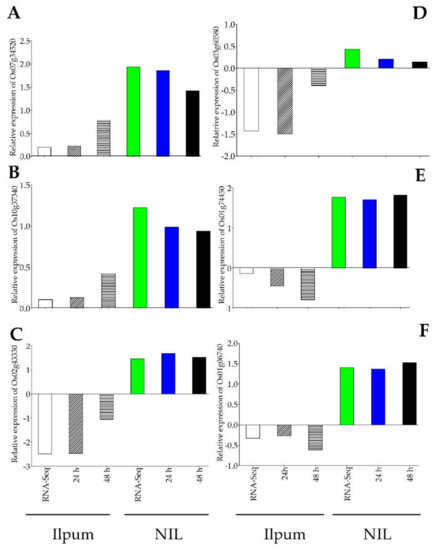
Figure 8.
qPCR validation of differentially expressed genes between Ilpum and NIL. (A) Enhanced transcript accumulation of Os07g34520 and (B) Os10g37340 in NIL compared to Ilpum in response to GRH feeding. (C) Differential expression of Os02g43330, (D) Os03g60580, (E), Os01g74450, and (F) Os01g06740 between Ilpum and NIL under the same conditions.
3. Discussion
3.1. Green Rice Leafhopper-Induced Stress Activates Defense-Related Genes and Multiple Regulatory Pathways in Rice
Plants have evolved sophisticated, highly coordinated, and well-structured innate immune system, capable of detecting invading organisms and halting them before they are able to cause extensive damage [38,39]. At a cellular level, upon biotic stress induction, a variety of signaling cascades are activated, which in turn help the plant to localize the source of the stress in order to mobilize the relevant resources and activate the appropriate defense system to combat the stress, while tending to maintain a balanced growth and development [40]. In the process, stress-responsive compounds accumulate in the cell, and a transcriptional reprograming occurs, resulting in the induction or suppression of defense-related genes and the synthesis of proteins. Under the same conditions, secondary metabolites accumulate, and antioxidant systems (enzymatic and nonenzymatic) are activated, as part of the defense mechanism. Here, MapMan analysis revealed that a basal defense system similar to that observed during pathogen attacks was typically activated upon GRH infestation. We can mention, among others, the pathogen-pattern-triggered immunity (PTI: FLS2 (LOC_Os04g52780, the flagellin receptor protein kinase, upregulated by Log2FC 2.7 in Ilpum and 3.45 in NIL) and PCRK: LOC_Os10g30600, the bacterial elicitor response protein kinase, which were upregulated in Ilpum and NIL by Log2FC 0.9 and 2.3, respectively. In addition, the NPR1 (nonexpressor of pathogenesis-related gene 1, LOC_Os01g09800), a key regulator of salicylic acid (SA)-mediated resistance and systemic acquired resistance (SAR) [41,42], was upregulated by Log2FC 0.87 in Ilpum and 2.61 in NIL. Furthermore, the TGA (LOC_Os01g17260, transcription TGA6 or AtbZIP45, a negative regulator of resistance (NRR) proteins [43] similarly downregulated in Ilpum and NIL) was earlier reported to interact with NRP1 while co-expressing with NRP1 homologs NH1 and NH3, and three OsWRKY33 TF-dependent plant immunity (similarly upregulated in Ilpum and NIL) and Virus tobamovirus multiplication were the most abundant (Figure 4G). These genes are thought to contribute to the response mechanisms of rice towards GRH resistance.
It was interesting to see that, in addition to biotic stress-related genes, GRH triggered significant changes in the expression of genes previously associated with abiotic stress response in plants. These include the salt overly sensitive (SOS2, LOC_Os01g35184) signaling pathway genes, earlier suggested to positively regulate the salt stress response in plants [44], which were found to be upregulated in Ilpum but downregulated in NIL. In the same way, the gibberellin–abscisic acid signaling pathway crosstalk OsGAI TF (LOC_Os03g49990, a gibberellin insensitive encoding a DELLA protein) was differentially regulated between Ilpum (downregulated) and NIL (upregulated). This applies also to COLD1 (LOC_Os04g51180, cold sensor), which was upregulated in Ilpum, while being downregulated in NIL. Another group of abiotic stress-responsive genes included stomata closure (drought), heat response transcriptional regulator and temperature sensing and signaling, and CAS (LOC_Os02g49680, extracellular calcium sensor receptor: upregulated in Ilpum but downregulated in NIL) among others. A study conducted by Rolly et al. [45] proposed that phytohormone biosynthesis or signaling pathway genes such as auxin carriers (PIN-FORMED proteins), MAX1–4 (more axillary branching, strigolactone biosynthesis genes), gibberellin biosynthesis genes (GA20ox1 and 2), and cytokinin biosynthesis (isopentenyl transferase, IPT5 and 7) could be involved in the adaptive response towards drought tolerance in Arabidopsis.
It is well established that photosynthesis and respiration are two fundamental physiological processes required for the survival of plants during stress [46]. In this study, Table S4, BIN 1 summarizes the differential transcriptome profile between Ilpum and NIL. A recent report showed that ATP, NADPH, and carbohydrates are generated as part of photosynthesis, and these resources are then utilized for the synthesis of many other compounds such as primary metabolites and defense-associated hormones (abscisic acid, ABA; ethylene, ET; jasmonic acid, JA; salicylic acid, SA) [47]. Other studies have supported that both an increase and a decrease in photosynthesis rates can occur, and photosynthesis can be assumed as a source of energy for plant defense against stress inducers [48]. Considering the expression patterns of genes associated with the photosynthesis, during GRH feeding on rice seedlings, where the NIL (carrying Grh1) recorded the highest number of downregulated genes (16.5%, exceeding that observed in Ilpum), it appears that Ilpum experienced a high level of stress caused by GRH compared to NIL. The NIL (GRH resistant) might have activated other defense systems providing the required cellular response towards GRH resistance. We could then propose that, during insect pest feeding on host plants, the photosynthesis rate increased to provide enough energy as part of the primary metabolism, which contributed to the adaptive response mechanisms towards insect pest resistance and helped maintain balanced growth and development of plants.
In the biological system, biological processes such as photosynthesis and cellular respiration have evolved multiple biochemical steps, which occur simultaneously within the cells and share common molecular components [49]. Here, we observed that the majority of genes (61.6%) involved in carbohydrate metabolism and expressed in response to GRH were downregulated in Ilpum vs. 53.8% upregulated in NIL (Table S4, BIN 3). Cellular respiration is central to the life of plants. In the same way, 67.4% and 52.6% of genes involved in cellular respiration were upregulated in Ilpum and NIL, respectively, vs. 32.6% and 47.4% showing a downregulation pattern. Likewise, secondary metabolites such as terpenoids and flavonoids, among others, have been shown to contribute to boosting the plant immune system in response to abiotic or biotic stress [50]. Looking at the RNA-Seq data and MapMan analysis results, Ilpum and NIL showed similar expression patterns of genes involved in secondary metabolism (26.6% and 73.4% down- and upregulated in both backgrounds). This is also true for genes involved in DNA damage response (Table S5, BIN 14). Therefore, we could then argue that rice plants exposed to GRH infestation would experience a disturbed photosynthetic process, while witnessing an enhanced cellular respiration and accumulation of secondary metabolites as part of the defense mechanisms towards GRH resistance.
Maintaining genome integrity is recognized as crucial for all living organisms, especially under stress conditions where plants experience changes in their metabolism and increased accumulation of bioactive molecules such as reactive oxygen species (ROS) that may cause DNA damage and cell death [51]. Our data showed that RNA biosynthesis genes were 51% downregulated vs. 59.4% upregulated in Ilpum and NIL, respectively. Among RNA processing genes, Ilpum and NIL had similar expression patterns of transcription factor-encoding genes (61.6% and 64.4% downregulated in Ilpum and NIL, respectively; 38.4% and 35.6% upregulated in Ilpum and NIL, respectively) (Table S4, BIN 15 and BIN 16).
Furthermore, the transcription profile of genes related to amino-acid metabolism (BIN 4), lipid metabolism (BIN 5), coenzyme metabolism (BIN 7), polyamine metabolism (BIN 8), protein modification (BIN 18), and protein homeostasis (BIN 19) indicated that the number of downregulated genes by GRH in these categories was much higher in Ilpum compared to the GRH-resistant rice line (NIL), whereby some of the downregulated genes in Ilpum were differentially regulated under the same conditions.
Generally, genes whose expression is highly induced upon stress induction (abiotic or biotic stress) are considered as having a high potential to be involved in the adaptive response or resistance mechanisms towards that particular stress. In addition, most upregulated and downregulated genes are thought to have differential contributions acting as positive or negative regulators of plant defense. In this study, among the top 20 DEGs between Ilpum (GRH susceptible) and NIL (carrying Grh1), pooled from the GRH-mediated transcriptome data (Table 1), six were previously characterized, including OsMRG702 (LOC_Os11g34300, a reader protein of H3K4me3 [52], upregulated in Ilpum (9.6 Log2FC) but downregulated in NIL (−0.44 Log2FC)), OsAIP1 or OsBAT1 (LOC_Os01g36890, involved in biotic stress response [53], upregulated in Ilpum (9.6 Log2FC) but downregulated in NIL (−4.6 Log2FC)), and OsFtsH2 (LOC_Os06g45820) identified as cell division protease, homolog of AtFtsH2/8 [54], upregulated in Ilpum (8.2 Log2FC) but downregulated in NIL (−0.92 Log2FC). In contrast, genes such as OsBIHD1 (LOC_Os03g03g47740, homeodomain containing protein) [55,56,57], OsRLI (LOC_Os11g34350, RNA L inhibitor belonging to ATP-binding cassette (ABC) sub-family E member 1 [58]), and OsFNR (LOC_Os03g57120, ferredoxin-NADP reductase chloroplast precursor) [59]), previously reported as being involved in biotic stress resistance in rice, were downregulated in Ilpum (Log2FC −0.63 (OsBIHD1), −024 (OsRLI), and −0.13 (OsFNR)), while being highly induced in NIL (Log2FC 9.99 (OsBIHD1), 8.79 (OsRLI), and 8.39 (OsFNR)) under the same conditions.
3.2. Complex Signaling Networks Activated upon GRH Infestation in Rice
The molecular mechanisms against the attack of insect pests, including GRH, involve a wide range of complex signaling networks, predominantly mediated by but not limited to jasmonic acid (JA) [60,61]. Other phytohormones such as ethylene (ET) and salicylic acid (SA) have been shown to be activated in the process [40,62,63,64,65,66] and trigger changes in the transcript levels of stress-responsive genes. Under the same conditions, ROS and RNS accumulate, which have a dual effect; at a low level, they serve as signaling molecules and help plants to quickly react and activate the required defense system, whereas, when over-accumulated, ROS or RNS and derivative compounds are detrimental to plant fitness [67,68]. The reduction–oxidation (redox) homeostasis of the plant is compromised when these ROS and RNS over-accumulate or are in imbalance, thus causing oxidative or nitro-oxidative stress, lipid peroxidation denoting cell membrane degradation, and eventually culminating to cell death. Thus, considering that a high number of genes associated with redox homeostasis were downregulated by GRH in NIL, in contrast with those upregulated in Ilpum (Table S4, BIN 10), we could say that a balanced redox was maintained in the GRH resistant line NIL, which experienced a low level of stress as compared to the susceptible rice cultivar Ilpum, eventually due to over-accumulation of ROS or RNS that have the ability to cause oxidative damage and cell death.
Respiratory burst oxidase homologs (RBOHs) are recognized as being crucial for defense signaling events and are key players in plant immunity [69,70,71,72,73], allowing the activation of antioxidant systems (nonenzymatic and enzymatic antioxidants), including catalase (CAT) [74,75], glutaredoxin (Grx) [76,77,78], and superoxide dismutase (SOD) [79,80], to combat the stress and give a robust defense response. In this perspective, we could speculate that the significant upregulation of RBOH encoding genes (LOC_Os05g45210, LOC_Os09g26660, LOC_Os09g26660, LOC_Os01g53294, LOC_Os01g25820) in Ilpum (1.8–5.03 Log2FC), while being either downregulated or not affected in NIL (0.08 to –2.05 Log2FC), coupled with the differential transcript accumulation of ROS scavenger-related genes (LOC_Os02g02400 (catalase, CAT-A), LOC_Os06g51150 (CAT-B), LOC_Os03g03910 (CAT isozyme 2), LOC_Os07g46990 (superoxide dismutase, SOD)) and hydrogen peroxide removal-related genes (ascorbate peroxidase (LOC_Os04g35520) and ascorbate free radical reductase (LOC_Os02g47800)), among others, gives insights into the observed enhanced resistance of NIL plants to GRH and a low level of ROS accumulation compared to Ilpum, while suggesting a possible interaction with Ghr1.
3.3. Differential Feeding Behaviors of GRH between Ilpum (Susceptible) and NIL (Carrying Grh1) Give Insights into Their Survival and Transcriptome Profiles in Rice
Studies on GRH resistance in plants have proposed that rice varieties showing resistance to GRH possess three characteristics of insect resistance, namely, antibiosis [81,82], antixenosis [83], and tolerance [84], causing insect high mortality, slow development, and infecundity, among others. In addition, a study conducted by ABE [85] investigated the mechanism of varietal resistance to GRH (Nephotettix cincticeps Uhler) found that, when leafhoppers were reared on resistant plants, their development was slowed down, followed by a rapid death, especially first nymphs. The author also indicated that the sugar content of the excreta was roughly below 0.1% in GRHs reared on resistant rice varieties, contrasting with nearly 0.8–1.6% of sugar content of the excreta of GRHs reared on susceptible rice varieties. In a converse approach, Reddy et al. [86] supported that the feeding by planthoppers on susceptible rice varieties caused a reduction in stored sugar content. In the same way, Heong and Hardy [87] reported that sugar content, such as sucrose (predominant) [82], glucose, fructose, or maltose, is required for successful development and fitness of planthoppers (in this case brown planthopper, BPH). We could then say, on the one hand, that the low survival rate (8%) of second nymph GRHs infested in NIL (carrying Grh1) compared to the 72% survival rate recorded in Ilpum 72 h after infestation would imply that GRHs reared on the resistant NIL seedlings starved to death due to a failure to suck the phloem sap of NIL (Nc4, Figure 1B), whereas, in the susceptible rice variety (Ilpum), GRHs were able to suck the phloem sap (Nc6, Figure 1A) containing the required sugar for their fitness and development. However, we suspect that GRHs may not have penetrated the phloem and taken up nutrients from host plants considering the activation of defense mechanisms in NIL carrying Grh1, coupled with the evident boost in the transcriptional regulation of defense-related genes. On the other hand, it is thought that the failure to penetrate the stylet and feed from the phloem of NIL could be attributed to the robust defense system activated, coupled with the active signaling pathway-related genes and antioxidant-associated protein-coding genes, and their interplay contributed to the observed resistance of NIL compared to Ilpum.
Therefore, considering the transcriptome profile of GRH-responsive genes in Ilpum and NIL, and the differential expression patterns displayed in the two rice genetic materials, coupled with the interesting functions of genes with a log2 fold change value above 2, data generated by this study suggest that Grh1-mediated resistance against green rice leafhopper (GRH) is a result of a complex and a combinational action of transcriptome-wide interactions, coupled with biochemical reactions and physiological processes across the plant, rather than gene–gene action. In addition, RNA-Seq and ManMan data associated with the EPG results propose that the feeding behavior of GRHs on rice plants determines the kind of defense mechanism and physiological processes that will be activated, as well as the biochemical reactions that will take place, in order to provide a proper response towards the stress, while tending to maintain balanced plant growth and development.
4. Materials and Methods
4.1. Green Rice Leafhopper Growth Conditions
Prior to infestation, second nymph GRHs were grown and maintained as described previously [33]. Briefly, GRHs were reared at 25 °C, under a 16 h light and 8 h dark cycle and 60–70% relative humidity, in cages of 50 cm × 50 cm × 50 cm, width, length, and height, respectively, with each cage containing GRHs of similar growth stage (nymphs to adults). The development cycle of GRH takes about 25 days from eggs to adult insects, distributed as follows: first to fourth instar nymphs accounting for 25 days (first to second instar nymphs: 10 days, second to third instar nymphs: 5 days, third to fourth instar nymphs: 5 days, and fourth to adult: 5 days). At each development stage, GRHs were reared in different cages, and second instar nymphs GRH were used for downstream experiments.
4.2. Plant Growth Conditions and Green Rice Leafhopper Infestation
Two rice lines, Ilpum (the GRH-susceptible cultivar) and a near-isogenic line (NIL) carrying the Grh1 (a gene conferring resistance towards GRH) derived from a cross between Shingwang (indica, P1) and Ilpum (japonica, P2) [33], were use as genetic materials for RNA-Seq analysis. In addition, the Grh1 donor parent Shingwang was included in the study solely to monitor the feeding behavior of GRH during the electrical penetration graph (EPG) test. Prior to germination, rice seeds were surface-sterilized using nitric acid (HNO3, 0.7%) (CAS: 7697-37-2, Junsei Chemical Co. Ltd., Tokyo, Japan) overnight to break the dormancy [88], followed by incubation for 48 h at 27 °C to induce germination. Then, germinated rice seeds were grown in 50-well trays (one germinated seed per well) containing an enriched soil supplemented with basic nutrients necessary for rice seedling growth as indicated by the manufacturer (Boonong, Gyeongju, Korea, humidity: 18–30%, pH: 4.5–5.5, EC: below 2.0) until three-leaf stage. Seedlings with a uniform height (one seedling per rice line per test tube, in quintuplets for control and GRH-infested seedlings) were placed in test tubes after washing the loose soil from the roots. Seedlings were infested with second instar nymphs green rice leafhoppers (10 GRHs per test tube per seedling in quintuplet) for 48 h at room temperature as described previously [33]. Leaf samples for RNA-Seq analysis were collected in duplicate (from two different seedlings) from control (GRH non-infested seedlings) and GRH-infested seedlings, before being snap-frozen in liquid nitrogen and sent for sequencing (Macrogen, Daejeon, Korea).
4.3. Electrical Penetration Graph (EPG) Test and GRH Survival Rate
We monitored the feeding behavior of GRH on selected plant materials using an electrical penetration graph (EPG) technology as described previously [34]. In essence, a stylet probing the behavior of waveforms in each process from host detection to insect feeding was used to examine the interaction between phloem-feeding activities of the insect on the host plant. In the process, different waveforms are recorded and are classified from Nc1 to Nc6. Nc1–4 waveforms indicate that the insect (GRH) sucked only the xylem sap, while the Nc6 waveform indicates that the green rice leafhopper sucked the phloem sap [35,89].
The EPG test was conducted on male GRHs initially anesthetized with carbon dioxide (CO2), and a gold line electroductive silver conductive paint (P-100, CANS, Japan) was attached to GRH wings. The gold lines were connected to the GIGA-4 DC EPG amplifier (Washington University, The Netherlands). EPG waveforms were analyzed using PROBE 3.4 software (W.F. Tajallingii, Wageningen University, The Netherlands). The substrate voltage was adjusted in the range of +5 V to −5 V [89,90]. Male GRHs were inoculated to the third-leaf stage of rice, and the waveforms were recorded for 6 h. All insects were recorded simultaneously in 10 replicates for the EPG test, with Nc indicating the waveforms of GRH (Nephotettix cincticeps Uhler). The mean waveform duration (Nc1–Nc6), mean duration per waveform event, and mean number of waveform events per insect were calculated (Table 3).
Table 3.
EPG information from N. cincticeps nymphs feeding on rice seedlings.
The survival rate of GRH in Ilpum and NIL GRH-infested seedlings was determined over time as follows: (total number insects (GRH) initially infested—number of dead insects over time)/(total number of alive insects initially infested) × 100, and the data were expressed as a percentage.
4.4. RNA-Seq, Data Analysis, and Quality Control
Total RNA was isolated from leaf samples using a Takara MiniBEST RNA extraction kit (CAS No 9767, Japan), and DNA contamination was eliminated using DNase. An mRNA purification kit was used to prepare the library according to the manufacturer’s protocol (Library kit: TruSeq Stranded Total RNA LT Sample Prep Kit (Plant); protocol: TruSeq Stranded Total RNA Sample Prep Guide, Part #15031048 Rev.E; Reagent: TruSeq 3000 4000 SBS Kit v3). RNA fragments were randomly purified for short-read sequencing, followed by reverse transcription of fragmented RNA into cDNA. The adapters were ligated onto both ends of the cDNA fragments. After amplifying fragments using PCR, fragments with insert sizes between 200 and 400 bp were selected, and both ends of the cDNA were sequenced by read length (paired-end sequencing) (Macrogen, Beolkkot-ro, Geumcheon, Seoul, Korea) using Illumina’s HiSeq™ 4000 Sequencing System facilitated by HCS 3.3.52 software (Illumina, Inc. 9885 Towne Centre Drive, San Diego, CA 92121, USA) according to the manufactures’ instructions (Sequencing protocol: HiSeq 3000 4000 System User Guide Document#15066496 v05 HCS 3.3.52).
The quality control of the sequenced raw reads was done via a computational method using the FastQ Screen program (version 0.3, Babraham Institute, Cambridge, UK) [91] to ensure overall read quality, total bases, total reads, and GC (%). In order to reduce biases in analysis, artefacts such as low-quality reads, adaptor sequences, contaminant DNA, or PCR duplicates were removed, and the trimmed reads (Trimmed Mean of M-values, TMM, normalized with edgeR package in R (version 4.1.1, USA) for all samples were compared with each other and merged into one file prior to performing the transcriptome assembly. Merged data were assembled using Trinity (http://trinityrnaseq.github.io), accessed on 25 August 2021, to form contigs (longer fragments without N gaps).
4.5. Clustering Transcripts into Unigenes and ORF Prediction
For assembled genes, the longest of the assembled contigs were filtered and clustered into nonredundant transcripts using CD-HIT-EST [92,93]. We defined these transcripts as “unigenes”, which were used for predicting the ORFs (open reading frames), annotating against several known sequence databases and analyzing differentially expressed genes (DEGs). ORF prediction for unigenes was performed using the TransDecoder program to identify candidate coding regions within the transcript sequence. After extracting ORFs that were at least 100 amino acids long, TransDecoder predicted the likely coding regions.
4.6. Raw and Trimming Data Statistics
The total number of bases, reads, GC (%), Q20 (%), and Q30 (%) were calculated for four samples. The Trimmomatic program [94] was used to remove adapter sequences and bases with base quality lower than 3 from the ends. Using the sliding window method, bases of reads that did not qualify for a window size of 4 and a mean quality of 15 were trimmed. Afterward, reads with length shorter than 36 bp were dropped to produce trimmed data.
4.7. Annotation on Gene Ontology and EggNOG Databases
For functional annotation of the unigenes, the Gene Ontology (GO) database was applied to classify the annotated unigenes using BLASTX of DIAMOND with an E-value cutoff of 1.0 × 10⁻⁵. Classification of GO terms was subsequently performed using and in-house script. The GO terms belonging to biological processes (BPs), cellular components (CCs), and molecular function (MFs) were listed (Figure S2).
To identify the proteins distributed in eukaryotic orthologous groups (KOG), clusters of orthologous groups (COGs), and non-supervised orthologous groups (NOGs), we carried out BLASTX of DIAMOND with an E-value cutoff of 1.0 × 10⁻⁵ in the EggNOG (Evolutionary Genealogy of Genes) database. The annotated unigenes were mapped to the annotation of the corresponding orthologous groups in the EggNOG database.
4.8. Annotation on KEGG Pathway, UniProt, and Pfam Databases
For functional annotation of the unigenes, we carried out BLASTX of DIAMOND with an E-value cutoff of 1.0 × 10⁻⁵ in the Kyoto Encyclopedia of Genes and Genomes (KEGG) database. Bidirectional best hit (BBH), which is a widely used method to infer orthology, was used to search against the KEGG database to obtain the KO (reference pathway) number of the KEGG annotation. The KO number of the transcriptome was also obtained according to KEGG annotation (Oryza sativa Japonica RAPDB (RAPDB_IRGSP-1.0) genome database, https://www.genome.jp/kegg-bin/show_organism?org=dosa), accessed on 25 August 2021.
For functional annotation of the unigenes, we carried out BLASTX of DIAMOND with an E-value cut-off of 1.0 × 10⁻⁵ in the UniProt (Universal Protein Resource) database. In addition to capturing the core data mandatory for each UniProtKB entry (mainly the amino-acid sequence, protein name or description, taxonomic data, and citation information), as much annotation information as possible was added.
For functional annotation of the unigenes, we carried out BLASTX of DIAMOND with an E-value cut-off of 1.0 × 10⁻⁵ in the Pfam database. The Pfam database is a large collection of protein families, each represented by multiple sequence alignments and hidden Markov models (HMMs). Proteins are generally composed of one or more functional regions, commonly termed domains. The identification of domains that occur within proteins can, therefore, provide insights into their function.
4.9. MapMan Analysis
Big data with several genes and transcripts often challenge efficient data analysis. Common Gene Ontology (GO) enrichment analysis relying on a database search, although useful for functional characterization of specific gene sets, happens to be less informative if detailed analysis is required at the level of studying genes involved in particular pathways or physiological functions. In this regard, various tools have been developed and used with variable success, e.g., the TM4 suit by Saeed et al. [95], and GoMinerTM by Zeeberg et al. [96].
In addition, the MapMan omics data analysis program (http://mapman.gabipd.org), accessed on 25 August 2021, has been widely used for visualization of omics data at the process or pathway level. The software is designed and optimized to map transcriptomic data in existing databases for different plant species, including rice. MapMan employs a hierarchical BIN-based ontology system (BINs are functional categories), where specific bins are allocated to biological processes or molecular functions and sub-bins are allocated to individual steps or nodes in that particular biological process. For instance, BIN number 26 is related to stress, and BIN numbers 26.1–6 refer to abiotic stress, while BIN numbers 26.8–10 indicate biotic stress. In the same way, sub-bins associated with abiotic stress include 26.1 (light stress), 26.2 (carbon dioxide sensing and signaling), 26.3 (gravity sensing and signaling), 26.4 (26.4.1: temperature sensing; 26.4.2: heat stress; 26.4.3: cold stress), 26.5 (drought stress), and 26.6 (salt stress). Similarly, sub-bins 26.8.1, 26.8.3, 26.9.1, and 26.10.1.2 are associated with pathogen pattern-triggered immunity (PTI), defense mechanisms, symbiont-symbiosis signaling, virus movement, and tobamovirus multiplication, respectively. This approach helps to minimize the redundancy usually found in GO enrichment analysis. Furthermore, MapMan uses expression values of genes and displays the analyzed data in the form of diagrams, which allows a better understanding of the significance of the data, where genes with increased or decreased expression levels are indicated as color-coded square blocks. In the perspective of obtaining meaningful information, 8859 DEGs were analyzed using MapMan 3.6.0RC1. To achieve that, all gene expression data with significant DEGs (p < 0.05) were formatted in Microsoft Excel using their unique locus identifiers and expression values expressed as Log2FC and saved as a tab-delimited file. The file was further mapped against the rice genome database (X4.2 oryza_sativa) in MapMan. Then, the analyzed data were classified into different metabolic pathways.
4.10. Validation of RNA-Seq Data by qPCR
The TaKaRa MiniBEST Universal Plant RNA Extraction Kit (TAKARA Bio Inc., Cat. No. 9769 v201309Da, Kusatsu, Japan) was used to extract the total RNA from leaf samples, following the manufacturer’s instructions. Briefly, frozen leaf samples with liquid nitrogen were crushed to fine powder, and 450 μL of buffer RL (containing 50× dithiothreitol (DTT, 20 μL per 1 mL of buffer RL)) was added and pipetted up and down for a few seconds until the lysate showed no precipitate. The mixture was then centrifuged at 12,000 rpm for 5 min (top bench centrifuge), and the supernatant was transferred to fresh 1.5 mL Eppendorf tubes (e-tubes) (Step 1). Then, one volume of ethanol (100%) was added to the mixture from Step 1, followed by mixing by pipetting up and down, and 600 μL was transferred to a pin column with a 2 mL collection tube. The tubes were centrifuged for 1 min at 12,000 rpm, and the flowthrough was discarded, followed by the addition of 500 μL of buffer RWA and centrifugation for 30 s at 12,000 rpm. Immediately after discarding the flowthrough, 600 μL of buffer RWB was added to the spin column and centrifuged for 30 s at 12,000 rpm (this step was repeated twice). Empty spin columns with collection tubes were centrifuged for 2 min at 12,000 rpm, and the spin column were placed on fresh 1.5 e-tubes; then, 100 μL of RNase free water was added. Finally, samples were incubated for 5 min at room temperature, followed by centrifugation for 2 min at 12,000 rpm (the elution step was repeated twice).
To synthesize the cDNA (complementary DNA) [97], 1 μg of RNA was used as a template, and the ProtoScript®II First Strand cDNA Synthesis Kit (New England BioLabs Inc., NEB Labs, MA, USA) was employed according to the manufacturer’s instructions. The newly synthesized cDNA was then used as a template for qPCR (quantitative real-time polymerase chain reaction) to validate the transcript accumulation of the six upregulated (three in Ilpum and three in NIL) and six downregulated (three in Ilpum and three in NIL) genes.
To validate the expression patterns of differentially expressed genes (DEGs) selected from the RNA-Seq dataset, a reaction mixture was prepared comprising 10 μL of Prime Q-Master Mix (with SYBR green I), 0.1× ROX (0.1 μL/50×) (GENETBIO Inc., Daejeon, Korea), 1 μL of template DNA, and 10 pM of each forward and reverse primers in a total reaction volume of 20 μL, including a no-template control (NTC). A three-step reaction including polymerase activation at 95 °C for 10 min, denaturation at 95 °C for 20 s, annealing at 60 °C for 30 s, and extension at 72 °C for 30 s was performed in a real-time PCR machine (QuantStudioTM Design and Analysis Software v.1.3, Applied Biosystems, Thermo Fisher Scientific, Seoul, Korea), with a total of 40 reaction cycles, and the data were normalized to the relative expression of rice Actin1. The list of primers used to validate RNA-Seq results by qPCR can be found in Table S5.
5. Conclusions
Green rice leafhopper (GRH) is a permanent threat to rice cultivation and food security, especially in East Asia. The use of GRH resistance rice lines is the most effective way to overcome crop failure caused by GRH and viral diseases conveyed by this insect pest. This study performed a comparative transcriptome-wide analysis of GRH-responsive genes in GRH-susceptible and -resistant rice genotypes. The RNA-Seq results revealed that phytohormone signaling pathways, carbohydrate metabolism, protein modification and homeostasis, nutrient uptake, and solute transport-related genes, among others, were predominantly upregulated in the GRH-resistant near-isogenic line (NIL, carrying Grh1 locus). In addition, genes associated with basal defense and systemic acquired resistance (SAR), as well as major transcription factors encoding genes belonging to GRAS, NAC, bHLH, MYB, bZIP, WRKY, and C2H2-F families, were differentially regulated between NIL and Ilpum. Furthermore, the electrical penetration graph revealed that GRHs reared on NIL failed to suck phloem sap and starved to death. However, genes involved in cellular respiration, as well as genes related to photosynthesis, redox homeostasis, secondary metabolism, and external stimulus response, were abundantly induced in the GRH-susceptible rice cultivar Ilpum. Therefore, all data suggest that Grh1-mediated activation of multiple regulatory and signaling pathways in response to GRH may involve an interactome with a large number of defense systems towards GRH resistance in rice, rather than gene–gene actions. Advanced functional analyses would help to elucidate the mechanism underlying GRH resistance in rice on a genome-wide scale.
Supplementary Materials
The following are available online at https://www.mdpi.com/article/10.3390/ijms221910696/s1.
Author Contributions
Conceptualization, J.-H.L. and N.R.K.; methodology, J.-H.L., Y.K. and N.R.K.; validation, J.-M.K., J.-H.L., N.R.K., D.-S.P. and D.S.; formal analysis, Y.K., N.R.K., B.Y.S., S.-M.L., Y.K. and J.-K.C.; investigation, Y.K. and N.R.K.; resources, J.-M.K., J.-H.L., J.-H.C., J.-W.K., N.R.K. and J.-Y.L.; software, N.R.K.; data curation, N.R.K.; writing—original draft preparation, Y.K. and N.R.K.; writing—review and editing, J.-H.L., N.R.K. and D.S.; visualization and supervision, J.-H.L., N.R.K. and J.-M.K.; project administration, J.-H.L. and J.-M.K.; funding acquisition, J.-M.K. and J.-H.L. All authors have read and agreed to the published version of the manuscript.
Funding
This work was supported by the BioGreen21 Agri-Tech Innovation Program (Project No. PJ01579401).
Institutional Review Board Statement
Not applicable.
Informed Consent Statement
Not applicable.
Data Availability Statement
The data presented in this study are available in the Supplementary Materials. In addition, we submitted the gene expression data (Processed data after MapMan analysis) and raw sequence data (RNA-Seq raw data) to the Gene Expression Omnibus (GEO) and Short Read Archive (SRA) at NCBI (https://www.ncbi.nlm.nih.gov/geo/submitter/), accessed on 25 August 2021, with accession numbers GSE176497 and SRP323419, respectively.
Conflicts of Interest
The authors declare no conflict of interest.
References
- Tang, Y.; Bao, X.; Zhi, Y.; Wu, Q.; Guo, Y.; Yin, X.; Zeng, L.; Li, J.; Zhang, J.; He, W.; et al. Overexpression of a MYB family gene, OsMYB6, increases drought and salinity stress tolerance in transgenic rice. Front. Plant Sci. 2019, 10, 168. [Google Scholar] [CrossRef] [PubMed]
- Basu, S.; Giri, R.K.; Benazir, I.; Kumar, S.; Rajwanshi, R.; Dwivedi, S.K.; Kumar, G.J.P. Comprehensive physiological analyses and reactive oxygen species profiling in drought tolerant rice genotypes under salinity stress. Physiol. Mol. Biol. Plants 2017, 23, 837–850. [Google Scholar] [CrossRef] [PubMed]
- Alford, D.V. Beneficial Insects; CRC Press: Boca Raton, FL, USA, 2019. [Google Scholar]
- Van Huis, A.; Van Itterbeeck, J.; Klunder, H.; Mertens, E.; Halloran, A.; Muir, G.; Vantomme, P. Edible Insects: Future Prospects for Food and Feed Security; Food and Agriculture Organization of the United Nations: Rome, Italy, 2013. [Google Scholar]
- Pathak, M.D.; Khan, Z.R. Insect Pests of Rice; International Rice Research Institute: Los Baños, Philippines, 1994. [Google Scholar]
- Bradshaw, C.J.; Leroy, B.; Bellard, C.; Roiz, D.; Albert, C.; Fournier, A.; Barbet-Massin, M.; Salles, J.-M.; Simard, F.; Courchamp, F. Massive yet grossly underestimated global costs of invasive insects. Nat. Commun. 2016, 7, 1–8. [Google Scholar] [CrossRef] [PubMed]
- UN Department of Economic and Social Affairs. World Population Projected to Reach 9.8 Billion in 2050, and 11.2 Billion in 2100; UN Department of Economic and Social Affairs: New York, NY, USA, 2019. [Google Scholar]
- Brar, D.; Virk, P.; Jena, K.; Khush, G. Breeding for Resistance to Planthoppers in Rice; International Rice Research Institute: Los Baños, Philippines, 2009; pp. 401–409. [Google Scholar]
- Ghauri, M.S.K. Revision of the genus Nephotettix Matsumura (Homoptera: Cicadelloidea Euscelidae) based on the type material. Bull. Entomol. Res. 1971, 60, 481–512. [Google Scholar] [CrossRef]
- Hirao, J.; Inoue, H. Zoology. Transmission efficiency of rice waika virus by the green rice leafhoppers, Nephotettix spp. (Hemiptera: Cicadellidae). Appl. Entomol. Zool. 1978, 13, 264–273. [Google Scholar] [CrossRef]
- Inoue, H. Zoology. Transmission Efficiency of Rice Transitory Yellowing Virus by teh Green Rice Leafhoppers, Nephotetlix spp. (Hemiptera: Cicadellidae). Appl. Entomol. Zool. 1979, 14, 123–126. [Google Scholar] [CrossRef][Green Version]
- Nakashima, K.; Kato, S.; Iwanami, S.; Murata, N. Cloning and detection of chromosomal and extrachromosomal DNA from mycoplasmalike organisms that cause yellow dwarf disease of rice. Appl. Environ. Microbiol. 1991, 57, 3570–3575. [Google Scholar] [CrossRef]
- Fujita, D.; Doi, K.; Yoshimura, A.; Yasui, H. Molecular mapping of a novel gene, Grh5, conferring resistance to green rice leafhopper (Nephotettix cincticeps Uhler) in rice, Oryza sativa L. Theor. Appl. Genet. 2006, 113, 567–573. [Google Scholar] [CrossRef]
- Sivamani, E.; Huet, H.; Shen, P.; Ong, C.A.; de Kochko, A.; Fauquet, C.; Beachy, R.N. Rice plant (Oryza sativa L.) containing rice tungro spherical virus (RTSV) coat protein transgenes are resistant to virus infection. Mol. Breed. 1999, 5, 177–185. [Google Scholar]
- Matsumoto, Y.; Suetsugu, Y.; Nakamura, M.; Hattori, M. Transcriptome analysis of the salivary glands of Nephotettix cincticeps (Uhler). J. Insect Physiol. 2014, 71, 170–176. [Google Scholar] [CrossRef]
- SoGAWA, K. Studies on the salivary glands of rice plant leafhoppers: II. Origins of the structural precursors of the sheath material. Appl. Entomol. Zool. 1967, 2, 195–202. [Google Scholar] [CrossRef]
- Nakamura, M.; Hattori, M. Purification of β-glucosidase from the salivary glands of the green rice leafhopper, Nephotettix cincticeps (Uhler) (Hemiptera: Cicadellidae), and its detection in the salivary sheath. Appl. Entomol. Zool. 2013, 48, 489–497. [Google Scholar] [CrossRef]
- Naito, A.; Masaki, J. Studies on the feeding behavior of green rice leafhopper, Nephotettix cincticeps UHLER. I. Insertion of the stylets into host plant. Jap. J. Appl. Ent. Zool 1967, 11, 50–56. [Google Scholar] [CrossRef]
- Wu, J.; Baldwin, I.T. New insights into plant responses to the attack from insect herbivores. Annu. Rev. Genet. 2010, 44, 1–24. [Google Scholar] [CrossRef]
- Rani, P.U.; Jyothsna, Y. Biochemical and enzymatic changes in rice plants as a mechanism of defense. Acta Physiol. Plant. 2010, 32, 695–701. [Google Scholar] [CrossRef]
- Shi, J.-H.; Sun, Z.; Hu, X.-J.; Jin, H.; Foba, C.N.; Liu, H.; Wang, C.; Liu, L.; Li, F.-F.; Wang, M.-Q. Rice defense responses are induced upon leaf rolling by an insect herbivore. BMC Plant Biol. 2019, 19, 1–12. [Google Scholar] [CrossRef]
- Wang, Y.; Liu, Q.; Du, L.; Hallerman, E.M.; Li, Y. Transcriptomic and Metabolomic Responses of Rice Plants to Cnaphalocrocis medinalis Caterpillar Infestation. Insects 2020, 11, 705. [Google Scholar] [CrossRef]
- Fujita, D.; Yoshimura, A.; Yasui, H.J.B.S. Development of near-isogenic lines and pyramided lines carrying resistance genes to green rice leafhopper (Nephotettix cincticeps Uhler) with the Taichung 65 genetic background in rice (Oryza sativa L.). Breed. Sci. 2010, 60, 18–27. [Google Scholar] [CrossRef]
- Ji, Z.-J.; Yang, S.-D.; Zeng, Y.-X.; Liang, Y.; Yang, C.-D.; Qian, Q. Pyramiding blast, bacterial blight and brown planthopper resistance genes in rice restorer lines. J. Integ. Agric. 2016, 15, 1432–1440. [Google Scholar] [CrossRef]
- Tamura, K.; Fukuta, Y.; Hirae, M.; Oya, S.; Ashikawa, I.; Yagi, T. Mapping of the Grh1 locus for Green Rice Leahopper Resistance in Rice Using RFLP Markers. Breed. Sci. 1999, 49, 11–14. [Google Scholar] [CrossRef]
- Fujita, D.; Doi, K.; Yoshimura, A.; Yasui, H.J.B.s. A major QTL for resistance to green rice leafhopper (Nephotettix cincticeps Uhler) derived from African rice (Oryza glaberrima Steud.). Breed. Sci. 2010, 60, 336–341. [Google Scholar] [CrossRef][Green Version]
- Krizek, B.A.; Bequette, C.J.; Xu, K.; Blakley, I.C.; Fu, Z.Q.; Stratmann, J.W.; Loraine, A.E. RNA-Seq links the transcription factors AINTEGUMENTA and AINTEGUMENTA-LIKE6 to cell wall remodeling and plant defense pathways. Plant Physiol. 2016, 171, 2069–2084. [Google Scholar] [CrossRef]
- Bansal, R.; Mian, M.; Mittapalli, O.; Michel, A.P. RNA-Seq reveals a xenobiotic stress response in the soybean aphid, Aphis glycines, when fed aphid-resistant soybean. BMC Genom. 2014, 15, 1–14. [Google Scholar] [CrossRef]
- Hu, H.; Wang, C.; Li, X.; Tang, Y.; Wang, Y.; Chen, S.; Yan, S. RNA-Seq identification of candidate defense genes targeted by endophytic Bacillus cereus-mediated induced systemic resistance against Meloidogyne incognita in tomato. Pest Manag. Sci. 2018, 74, 2793–2805. [Google Scholar] [CrossRef]
- Li, Q.; Sun, Z.; Shi, Q.; Wang, R.; Xu, C.; Wang, H.; Song, Y.; Zeng, R. RNA-seq analyses of midgut and fat body tissues reveal the molecular mechanism underlying Spodoptera litura resistance to tomatine. Front. Physiol. 2019, 10, 8. [Google Scholar] [CrossRef]
- Gao, L.; Tu, Z.J.; Millett, B.P.; Bradeen, J.M. Insights into organ-specific pathogen defense responses in plants: RNA-seq analysis of potato tuber-Phytophthora infestans interactions. BMC Genom. 2013, 14, 1–12. [Google Scholar] [CrossRef]
- Menuz, K.; Larter, N.K.; Park, J.; Carlson, J.R. An RNA-seq screen of the Drosophila antenna identifies a transporter necessary for ammonia detection. PLoS Genet. 2014, 10, e1004810. [Google Scholar] [CrossRef]
- Park, S.-K.; Kwak, D.-Y.; Park, D.-S.; Shin, D.; Hwang, W.-H.; Kim, M.-H.; Hur, Y.-J.; Cho, J.-H.; Song, Y.-C.; Lee, J.-Y. Fine mapping of Grh1, a major gene associated with antibiosis to green rice leafhopper in rice. Mol. Breed. 2013, 32, 729–733. [Google Scholar] [CrossRef]
- Mustafa, T.; Horton, D.R.; Cooper, W.R.; Swisher, K.D.; Zack, R.S.; Pappu, H.R.; Munyaneza, J.E. Use of electrical penetration graph technology to examine transmission of ‘Candidatus Liberibacter solanacearum’to potato by three haplotypes of potato psyllid (Bactericera cockerelli; Hemiptera: Triozidae). PLoS ONE 2015, 10, e0138946. [Google Scholar] [CrossRef]
- He, Y.; Chen, L.; Chen, J.; Zhang, J.; Chen, L.; Shen, J.; Zhu, Y.C. Electrical penetration graph evidence that pymetrozine toxicity to the rice brown planthopper is by inhibition of phloem feeding. Pest Manag. Sci. 2011, 67, 483–491. [Google Scholar] [CrossRef]
- Rafalski, J.A.; Vogel, J.M.; Morgante, M.; Powell, W.; Andre, C.; Tingey, S.V. Generating and using DNA markers in plants. In Nonmammalian Genomic Analysis; Elsevier: Amsterdam, The Netherlands, 1996; pp. 75–134. [Google Scholar]
- Erb, M.; Kliebenstein, D.J. Plant secondary metabolites as defenses, regulators, and primary metabolites: The blurred functional trichotomy. Plant Physiol. 2020, 184, 39–52. [Google Scholar] [CrossRef] [PubMed]
- Nishad, R.; Ahmed, T.; Rahman, V.J.; Kareem, A. Modulation of Plant Defense System in Response to Microbial Interactions. Front. Microbiol. 2020, 11, 1298. [Google Scholar] [CrossRef] [PubMed]
- Ponce de León, I.; Montesano, M. Activation of defense mechanisms against pathogens in mosses and flowering plants. Int. J. Mol. Sci. 2013, 14, 3178–3200. [Google Scholar] [CrossRef] [PubMed]
- Zebelo, S.A.; Maffei, M.E. Role of early signalling events in plant–insect interactions. J. Exp. Bot. 2015, 66, 435–448. [Google Scholar] [CrossRef]
- Yuan, Y.; Zhong, S.; Li, Q.; Zhu, Z.; Lou, Y.; Wang, L.; Wang, J.; Wang, M.; Li, Q.; Yang, D.; et al. Functional analysis of rice NPR1-like genes reveals that OsNPR1/NH1 is the rice orthologue conferring disease resistance with enhanced herbivore susceptibility. Plant Biotechnol. J. 2007, 5, 313–324. [Google Scholar] [CrossRef]
- Chern, M.; Fitzgerald, H.A.; Canlas, P.E.; Navarre, D.A.; Ronald, P.C. Overexpression of a rice NPR1 homolog leads to constitutive activation of defense response and hypersensitivity to light. Mol. Plant Microbe Interact. 2005, 18, 511–520. [Google Scholar] [CrossRef]
- Chern, M.; Bai, W.; Ruan, D.; Oh, T.; Chen, X.; Ronald, P.C. Interaction specificity and coexpression of rice NPR1 homologs 1 and 3 (NH1 and NH3), TGA transcription factors and Negative Regulator of Resistance (NRR) proteins. BMC Genom. 2014, 15, 1–20. [Google Scholar] [CrossRef]
- Rolly, N.K.; Imran, Q.M.; Lee, I.-J.; Yun, B.-W.J. Salinity stress-mediated suppression of expression of salt overly sensitive signaling pathway genes suggests negative regulation by AtbZIP62 transcription factor in Arabidopsis thaliana. Int. J. Mol. Sci. 2020, 21, 1726. [Google Scholar] [CrossRef]
- Rolly, N.K.; Mun, B.-G.; Yun, B.-W. Insights into the Transcriptional Regulation of Branching Hormonal Signaling Pathways Genes under Drought Stress in Arabidopsis. Genes 2021, 12, 298. [Google Scholar] [CrossRef]
- Xu, Z.; Jiang, Y.; Zhou, G. Response and adaptation of photosynthesis, respiration, and antioxidant systems to elevated CO2 with environmental stress in plants. Front. Plant Sci. 2015, 6, 701. [Google Scholar] [CrossRef]
- Lu, Y.; Yao, J. Chloroplasts at the crossroad of photosynthesis, pathogen infection and plant defense. Int. J. Mol. Sci. 2018, 19, 3900. [Google Scholar] [CrossRef]
- Bolton, M.D. Primary metabolism and plant defense—Fuel for the fire. Mol. Plant Microbe Interact. 2009, 22, 487–497. [Google Scholar] [CrossRef]
- Brown, M.H.; Schwartz, R.S. Connecting photosynthesis and cellular respiration: Preservice teachers’ conceptions. J. Res. Sci. Teach. Off. J. Natl. Assoc. Res. Sci. Teach. 2009, 46, 791–812. [Google Scholar] [CrossRef]
- Bennett, R.N.; Wallsgrove, R.M. Secondary metabolites in plant defence mechanisms. New Phytol. 1994, 127, 617–633. [Google Scholar] [CrossRef]
- Qiu, Z.; Zhu, L.; He, L.; Chen, D.; Zeng, D.; Chen, G.; Hu, J.; Zhang, G.; Ren, D.; Dong, G.; et al. DNA damage and reactive oxygen species cause cell death in the rice local lesions 1 mutant under high light and high temperature. New Phytol. 2019, 222, 349–365. [Google Scholar] [CrossRef]
- Jin, J.; Shi, J.; Liu, B.; Liu, Y.; Huang, Y.; Yu, Y.; Dong, A. MRG702, a reader protein of H3K4me3 and H3K36me3, is involved in brassinosteroid-regulated growth and flowering time control in rice. Plant Physiol. 2015, 168, 1275–1285. [Google Scholar] [CrossRef][Green Version]
- Tuteja, N.; Tarique, M.; Trivedi, D.K.; Sahoo, R.K.; Tuteja, R. Stress-induced Oryza sativa BAT1 dual helicase exhibits unique bipolar translocation. Protoplasma 2015, 252, 1563–1574. [Google Scholar] [CrossRef]
- Wang, F.; Liu, J.; Chen, M.; Zhou, L.; Li, Z.; Zhao, Q.; Pan, G.; Zaidi, S.-H.-R.; Cheng, F. Involvement of abscisic acid in PSII photodamage and D1 protein turnover for light-induced premature senescence of rice flag leaves. PLoS ONE 2016, 11, e0161203. [Google Scholar] [CrossRef]
- Luo, H.; Song, F.; Zheng, Z. Overexpression in transgenic tobacco reveals different roles for the rice homeodomain gene OsBIHD1 in biotic and abiotic stress responses. J. Exp. Bot. 2005, 56, 2673–2682. [Google Scholar] [CrossRef]
- Luo, H.; Song, F.; Goodman, R.; Zheng, Z. Up-regulation of OsBIHD1, a rice gene encoding BELL homeodomain transcriptional factor, in disease resistance responses. Plant Biol. 2005, 7, 459–468. [Google Scholar] [CrossRef]
- Liu, H.; Dong, S.; Gu, F.; Liu, W.; Yang, G.; Huang, M.; Xiao, W.; Liu, Y.; Guo, T.; Wang, H.; et al. NBS-LRR protein Pik-H4 interacts with OsBIHD1 to balance rice blast resistance and growth by coordinating ethylene-brassinosteroid pathway. Front. Plant Sci. 2017, 8, 127. [Google Scholar] [CrossRef]
- Du, X.-L.; Wang, D.; Qian, X.-Y.; Jiang, L.-Z.; Chun, W.; Li, K.-G.; Shen, G.-A.; Lin, C.-F.; Yang, J.-S. cDNA cloning and expression analysis of the rice (Oryza sativa L.) RNase L inhibitor. DNA Seq. 2003, 14, 295–301. [Google Scholar] [CrossRef]
- Aoki, H.; Tanaka, K.; Ida, S. The genomic organization of the gene encoding a nitrate-inducible ferredoxin-NADP+ oxidoreductase from rice roots. Biochim. Biophys. Acta Bioenerg. 1995, 1229, 389–392. [Google Scholar] [CrossRef][Green Version]
- El-Wakeil, N.E.; Volkmar, C.; Sallam, A.A. Jasmonic acid induces resistance to economically important insect pests in winter wheat. Pest Manag. Sci. Former. Pestic. Sci. 2010, 66, 549–554. [Google Scholar] [CrossRef]
- Senthil-Nathan, S.; Kalaivani, K.; Choi, M.-Y.; Paik, C.-H. Effects of jasmonic acid-induced resistance in rice on the plant brownhopper, Nilaparvata lugens Stål (Homoptera: Delphacidae). Pestic. Biochem. Physiol. 2009, 95, 77–84. [Google Scholar] [CrossRef]
- Bodenhausen, N.; Reymond, P. Signaling pathways controlling induced resistance to insect herbivores in Arabidopsis. Mol. Plant-Microbe Interact. 2007, 20, 1406–1420. [Google Scholar] [CrossRef]
- Dicke, M.; Van Poecke, R. Signalling in plant-insect interactions: Signal transduction in direct and indirect plant defence. In Plant Signal Transduction; Oxford University Press: Oxford, UK, 2002; pp. 289–316. [Google Scholar]
- Chamberlain, K.; Pickett, J.A.; Woodcock, C.M. Plant signalling and induced defence in insect attack. Mol. Plant Pathol. 2000, 1, 67–72. [Google Scholar] [CrossRef]
- Xu, J.; Wang, X.; Zu, H.; Zeng, X.; Baldwin, I.T.; Lou, Y.; Li, R.J.N.P. Molecular dissection of rice phytohormone signaling involved in resistance to a piercing-sucking herbivore. New Phytol. 2021, 230, 1639–1652. [Google Scholar] [CrossRef]
- Du, B.; Chen, R.; Guo, J.; He, G. Current understanding of the genomic, genetic, and molecular control of insect resistance in rice. Mol. Breed. 2020, 40, 1–25. [Google Scholar] [CrossRef]
- Del Río, L.A. ROS and RNS in plant physiology: An overview. J. Exp. Bot. 2015, 66, 2827–2837. [Google Scholar] [CrossRef]
- Bardaweel, S.K.; Gul, M.; Alzweiri, M.; Ishaqat, A.; ALSalamat, H.A.; Bashatwah, R.M. Reactive oxygen species: The dual role in physiological and pathological conditions of the human body. Eurasian J. Med. 2018, 50, 193. [Google Scholar] [CrossRef] [PubMed]
- Wang, R.; He, F.; Ning, Y.; Wang, G.-L. Fine-Tuning of RBOH-Mediated ROS Signaling in Plant Immunity. Trends Plant Sci. 2020, 25, 1060–1062. [Google Scholar] [CrossRef] [PubMed]
- Morales, J.; Kadota, Y.; Zipfel, C.; Molina, A.; Torres, M.-A. The Arabidopsis NADPH oxidases RbohD and RbohF display differential expression patterns and contributions during plant immunity. J. Exp. Bot. 2016, 67, 1663–1676. [Google Scholar] [CrossRef] [PubMed]
- Yoshioka, H.; Mase, K.; Yoshioka, M.; Kobayashi, M.; Asai, S. Regulatory mechanisms of nitric oxide and reactive oxygen species generation and their role in plant immunity. Nitric Oxide 2011, 25, 216–221. [Google Scholar] [CrossRef]
- Yamauchi, T.; Yoshioka, M.; Fukazawa, A.; Mori, H.; Nishizawa, N.K.; Tsutsumi, N.; Yoshioka, H.; Nakazono, M. An NADPH oxidase RBOH functions in rice roots during lysigenous aerenchyma formation under oxygen-deficient conditions. Plant Cell 2017, 29, 775–790. [Google Scholar] [CrossRef]
- Wong, H.L.; Pinontoan, R.; Hayashi, K.; Tabata, R.; Yaeno, T.; Hasegawa, K.; Kojima, C.; Yoshioka, H.; Iba, K.; Kawasaki, T.; et al. Regulation of rice NADPH oxidase by binding of Rac GTPase to its N-terminal extension. Plant Cell 2007, 19, 4022–4034. [Google Scholar] [CrossRef]
- Das, K.; Roychoudhury, A. Reactive oxygen species (ROS) and response of antioxidants as ROS-scavengers during environmental stress in plants. Front. Environ. Sci. 2014, 2, 53. [Google Scholar] [CrossRef]
- Sharma, P.; Jha, A.B.; Dubey, R.S.; Pessarakli, M. Reactive oxygen species, oxidative damage, and antioxidative defense mechanism in plants under stressful conditions. J. Bot. 2012, 2012, 217037. [Google Scholar] [CrossRef]
- Lillig, C.H.; Berndt, C.; Holmgren, A. Glutaredoxin systems. Biochim. Biophys. Acta Gen. Subj. 2008, 1780, 1304–1317. [Google Scholar] [CrossRef]
- Holmgren, A. Antioxidant function of thioredoxin and glutaredoxin systems. Antioxid. Redox Signal. 2000, 2, 811–820. [Google Scholar] [CrossRef]
- Rouhier, N.; Villarejo, A.; Srivastava, M.; Gelhaye, E.; Keech, O.; Droux, M.; Finkemeier, I.; Samuelsson, G.; Dietz, K.J.; Jacquot, J.-P.; et al. Identification of plant glutaredoxin targets. Antioxid. Redox Signal. 2005, 7, 919–929. [Google Scholar] [CrossRef]
- Raychaudhuri, S.S.; Deng, X.W. The role of superoxide dismutase in combating oxidative stress in higher plants. Bot. Rev. 2000, 66, 89–98. [Google Scholar] [CrossRef]
- Bowler, C.; Montagu, M.V.; Inze, D. Superoxide dismutase and stress tolerance. Annu. Rev. Plant Biol. 1992, 43, 83–116. [Google Scholar] [CrossRef]
- Inoue, H. Larval development of the green rice leafhopper, Nephotettix cincticeps Uhler, and the white back planthopper, Sogatella furcifera Horvath, on japonica and indica rice varieties. Jpn. J. Appl. Entomol. Zool. Chugoku Branch 1966, 8, 17–19. [Google Scholar]
- Ando, Y. Zoology. Insect resistance of the rice plant to the green rice leafhopper Nephotettix cincticeps Uhler, 1: Laboratory technique for testing the antibiosis. Jpn. J. Appl. Entomol. Zool. 1978, 22, 169–177. [Google Scholar]
- Kogan, M.; Ortman, E.F. Antixenosis—A new term proposed to define Painter’s “nonpreference” modality of resistance. Bull. ESA 1978, 24, 175–176. [Google Scholar] [CrossRef]
- Koshihara, T. Resistance of rice varieties against green rice leafhopper, Nephotettix cincticeps Uhler. Trop. Agric. Res. Ser. 1971, 5, 221–225. [Google Scholar]
- Abe, S.K. Mechanism of varietal resistance to the rice green leafhopper (Nephotettix cincticeps Uhler). Jpn. Agric. Res. Q. 1985, 19, 115–124. [Google Scholar]
- Reddy, K.L.; Pasalu, I.; Raju, A.S.; Reddy, D. Biochemical basis of resistance in rice cultivars to brown plant hopper Nilaparvata lugens (Stal.). J. Entomol. Res. 2004, 28, 79–85. [Google Scholar]
- Heong, K.L.; Hardy, B. Planthoppers: New Threats to the Sustainability of Intensive Rice Production Systems in Asia; International Rice Research Institute: Los Baños, Philippines, 2009. [Google Scholar]
- Kabange, N.R.; Park, S.-Y.; Lee, J.-Y.; Shin, D.; Lee, S.-M.; Kwon, Y.; Cha, J.-K.; Cho, J.-H.; Duyen, D.V.; Ko, J.-M.; et al. New Insights into the Transcriptional Regulation of Genes Involved in the Nitrogen Use Efficiency under Potassium Chlorate in Rice (Oryza sativa L.). Int. J. Mol. Sci. 2021, 22, 2192. [Google Scholar] [CrossRef]
- Yorozuya, H. Analysis of tea plant resistance to tea green leafhopper, Empoasca onukii, by detecting stylet-probing behavior with DC electropenetrography. Entomol. Exp. Appl. 2017, 165, 62–69. [Google Scholar] [CrossRef]
- Kawabe, S.; McLean, D. Electronic measurement of probing activities of the green leafhopper of rice. Entomol. Exp. Appl. 1980, 27, 77–82. [Google Scholar] [CrossRef]
- Wingett, S.W.; Andrews, S. FastQ Screen: A tool for multi-genome mapping and quality control. F1000Research 2018, 7, 1338. [Google Scholar] [CrossRef]
- Li, W.; Godzik, A. Cd-hit: A fast program for clustering and comparing large sets of protein or nucleotide sequences. Bioinformatics 2006, 22, 1658–1659. [Google Scholar] [CrossRef]
- Li, W.; Jaroszewski, L.; Godzik, A. Clustering of highly homologous sequences to reduce the size of large protein databases. Bioinformatics 2001, 17, 282–283. [Google Scholar] [CrossRef]
- Bolger, A.M.; Lohse, M.; Usadel, B. Trimmomatic: A flexible trimmer for Illumina sequence data. Bioinformatics 2014, 30, 2114–2120. [Google Scholar] [CrossRef]
- Saeed, A.; Sharov, V.; White, J.; Li, J.; Liang, W.; Bhagabati, N.; Braisted, J.; Klapa, M.; Currier, T.; Thiagarajan, M.; et al. TM4: A free, open-source system for microarray data management and analysis. Biotechniques 2003, 34, 374–378. [Google Scholar] [CrossRef]
- Zeeberg, B.R.; Feng, W.; Wang, G.; Wang, M.D.; Fojo, A.T.; Sunshine, M.; Narasimhan, S.; Kane, D.W.; Reinhold, W.C.; Lababidi, S.; et al. GoMiner: A resource for biological interpretation of genomic and proteomic data. Genome Biol. 2003, 4, R28. [Google Scholar] [CrossRef]
- Mun, B.-G.; Lee, S.-U.; Hussain, A.; Kim, H.-H.; Rolly, N.K.; Jung, K.-H.; Yun, B.-W. S-nitrosocysteine-responsive genes modulate diverse regulatory pathways in Oryza sativa: A transcriptome profiling study. Funct. Plant Biol. 2018, 45, 630–644. [Google Scholar] [CrossRef]


Publisher’s Note: MDPI stays neutral with regard to jurisdictional claims in published maps and institutional affiliations. |
© 2021 by the authors. Licensee MDPI, Basel, Switzerland. This article is an open access article distributed under the terms and conditions of the Creative Commons Attribution (CC BY) license (https://creativecommons.org/licenses/by/4.0/).