
Early Changes in Exo- and Endocytosis in the EAE Mouse Model of Multiple Sclerosis Correlate with Decreased Synaptic Ribbon Size and Reduced Ribbon-Associated Vesicle Pools in Rod Photoreceptor Synapses


Abstract
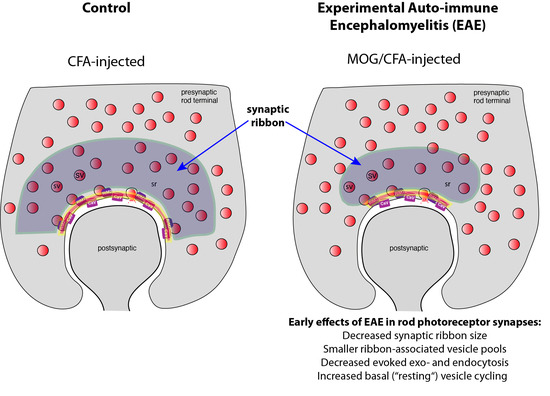
1. Introduction
2. Results
2.1. Photoreceptor Ribbons Are Shorter in Early EAE Mice in Comparison to Control Mice as Judged by 3D SR-SIM Analyses
2.2. Synaptic Ribbons Are Shorter in Height and Length in Early EAE Mice in Comparison to Litermate Control Mice as Judged by Transmission Electron Microscopy
2.3. The Number of Docked Vesicles and Ribbon-Tethered Vesicles Are Reduced in Early EAE Mice in Comparison to Control Mice
2.4. Defects in Depolarization-Evoked Exocytosis in EAE Mice as Early as on Day 7 after Injection
2.5. Post-Stimulus Endocytosis Is Decreased in Early EAE Mice in Comparison to Control MICE
2.6. Decreased Enrichment of Dynamin3 at Photoreceptor Synapses in Early EAE Mice in Comparison to Control Mice
2.7. Basal (Resting) Synaptic Vesicle Cycling Is Increased in Photoreceptor Synapses of MOG/CFA-Injected EAE Mice
2.8. Elevated De-Phosphorylation of Dynamin1 in Photoreceptor Synapses of MOG/CFA-Injected EAE Mice
3. Discussion
4. Materials and Methods
4.1. Animals
4.2. Solutions
4.3. Bafilomycin
4.4. Induction of Experimental Autoimmune Encephalomyelitis (EAE)
4.5. Immunolabelling of Resin Sections of the Retina
4.6. Confocal Microscopy and Quantitative Analyses of Immunosignals
4.7. Super-Resolution Structured-Illumination-Microscopy (SR-SIM) and Quantitative Analyses of Immunosignals
4.8. Transmission Electron Microscopy of Synapses from the Mouse Retina
4.9. Analysis of Synaptic Ribbon Height, Number of Docked Synaptic Vesicles, Ribbon-Tethered Synaptic Vesicles and Reserve Pool Synaptic Vesicles in Rod Photoreceptor Synapses of CFA-Injected Control Mice and MOG/CFA-Injected EAE Mice by Transmission Electron Microscopy
4.10. Estimation of Synaptic Ribbon z-Length in EAE- and Control-Injected Mice by TEM Analyses of Serial Ultrathin Sections
4.11. Preparation of Retinal Slices from MOG/CFA-Injected Transgenic SypHy Reporter Mice for the Analysis of Vesicle Cycling in Rod Photoreceptor Synapses
4.12. Optical Recording of Synaptic Activity in MOG/CFA-Injected SypHy Reporter Mice
4.13. Data Analyses of SypHy Responses
4.14. Measurement of Endocytosis at Photoreceptor Synapse of MOG/CFA-Injected EAE Mice and CFA-Injected Control Mice Using the Vesicular Proton Pump Inhibitor Bafilomycin A1
4.15. Measurement of Basal (“Resting”) Endocytosis at Photoreceptor Synapse of MOG/CFA-Injected EAE Mice and CFA-Injected Control Mice Using Bafilomycin A1
4.16. Measurement of Post-Stimulus Endocytosis at Photoreceptor Synapse of MOG/CFA-Injected EAE Mice and CFA-Injected Control Mice Using Bafilomycin A1
4.17. Bafilomycin Data Analysis
4.18. Western Blot Analyses
4.19. Dot Blot Analyses of Anti-p-Dynamin1 Antibody on p-Dynamin1 and p-Dynamin3 Peptides Cross Linked to Bovine Serum Albumin (BSA)
Author Contributions
Funding
Institutional Review Board Statement
Informed Consent Statement
Data Availability Statement
Acknowledgments
Conflicts of Interest
References
- Lassmann, H.; Bruck, W.; Lucchinetti, C.F. The immunopathology of multiple sclerosis: An overview. Brain Pathol. 2007, 17, 210–218. [Google Scholar] [CrossRef] [PubMed]
- Friese, M.A.; Schattling, B.; Fugger, L. Neurodegeneration and axonal dysfunction in multiple sclerosis. Nat. Rev. Neurol. 2014, 10, 225–238. [Google Scholar] [CrossRef] [PubMed]
- Dendrou, C.A.; Fugger, L.; Friese, M.A. Immunopathology of multiple sclerosis. Nat. Rev. Immunol. 2015, 15, 545–558. [Google Scholar] [CrossRef] [PubMed]
- Faissner, S.; Plemel, J.R.; Gold, R.; Yong, W. Progressive multiple sclerosis: From pathophysiology to therapeutic strategies. Nat. Rev. Drug Discov. 2019, 18, 905–922. [Google Scholar] [CrossRef]
- Rovaris, M.; Judica, E.; Gallo, A.; Benedetti, B.; Sormani, M.P.; Caputo, D.; Ghezzi, A.; Montanari, E.; Bertolotto, A.; Mancardi, G.; et al. Grey matter damage predicts the evolution of primary progressive multiple sclerosis at 5 years. Brain 2006, 129, 2628. [Google Scholar] [CrossRef]
- Dutta, R.; Chang, A.; Doud, M.K.; Kidd, G.J.; Ribuado, M.V.; Young, E.A.; Fox, R.J.; Staugaitis, S.M.; Trapp, B.D. Demyelination causes synaptic alterations in hippocampi from multiple sclerosis patients. Ann. Neurol. 2011, 69, 445–454. [Google Scholar] [CrossRef]
- Saidha, S.; Syc, S.B.; Ibrahim, M.A.; Eckstein, C.; Warner, C.V.; Farrell, S.K.; Oakley, J.D.; Durbin, M.K.; Meyer, S.A.; Balcer, L.J.; et al. Primary retinal pathology in multiple sclerosis as detected by optical coherence tomography. Brain 2011, 134, 518–533. [Google Scholar] [CrossRef]
- Lowe, M.J.; Koenig, K.A.; Beall, E.B.; Sakaie, K.A.; Stone, L.; Bermel, R.; Phillips, M.D. Anatomic connectivity assessed using pathway radial diffusivity is related to functional connectivity in monosynaptic pathways. Brain Connect. 2014, 4, 558–565. [Google Scholar] [CrossRef]
- Haider, L.; Simeonidou, C.; Steinberger, G.; Harmetner, S.; Grigoiadis, N.; Deretzki, G.; Kovacs, C.G.; Kitzelnigg, A.; Lassmann, H.; Frischer, J.M. Multiple sclerosis deep grey matter: The relation between demyelination, neurodegeneration, inflammation and iron. J. Neurol. Neurosurg. Psychol. 2014, 85, 1386–1399. [Google Scholar] [CrossRef]
- Jürgens, T.; Jafari, M.; Kreutzfeld, M.; Bahn, E.; Brück, W.; Kerschensteiner, M.; Merkler, D. Reconstruction of single cortical projection neurons reveals primary spine loss in multiple sclerosis. Brain 2016, 139, 39–46. [Google Scholar] [CrossRef]
- Jafari, M.; Schumacher, A.M.; Snaidero, N.; Ullrich Gavilanes, E.M.; Neziraj, T.; Kocsis-Jutka, V.; Engels, D.; Jürgens, T.; Wagner, I.; Weidinger, J.D.F.; et al. Phagocyte-mediated synapse removal in cortical neuroinflammation is promoted by local calcium accumulation. Nat. Neurosci. 2021, 24, 355–367. [Google Scholar] [CrossRef]
- Habbas, S.; Santello, M.; Becker, D.; Stubbe, H.; Zappia, G.; Liaudet, N.; Klaus, F.R.; Kollias, G.; Fontana, A.; Pryce, C.R.; et al. Neuroinflammatory TNFα impairs memory via astrocyte signaling. Cell 2015, 163, 1730–1741. [Google Scholar] [CrossRef]
- Stampanoni Bassi, M.; Mori, F.; Buttari, F.; Marfia, G.A.; Sancesario, A.; Centonze, D.; Iezzi, E. Neurophysiology of synaptic functioning in multiple sclerosis. Clin. Neurophysiol. 2017, 128, 1148–1157. [Google Scholar] [CrossRef]
- Rizzo, F.R.; Musella, A.; De Vito, F.; Fresegna, D.; Bullitta, S.; Vanni, V.; Guadalupi, L.; Stampanoni Bassi, M.; Buttari, F.; Mandolesi, G.; et al. Tumor Necrosis Factor and Interleukin-1β Modulate Synaptic Plasticity during Neuroinflammation. Neural Plast. 2018, 2018, 8430123. [Google Scholar] [CrossRef]
- Schattling, B.; Engler, J.B.; Volkmann, C.; Rothammer, N.; Woo, M.S.; Petersen, M.; Winkler, I.; Kaufmann, M.; Rosenkranz, S.C.; Fejtova, A.; et al. Bassoon proteinopathy drives neurodegeneration in multiple sclerosis. Nat. Neurosci. 2019, 22, 887–896. [Google Scholar] [CrossRef]
- Michailidou, I.; Willems, J.G.P.; Kooi, E.J.; van Eden, C.; Gold, S.M.; Geurts, J.J.G.; Baas, F.; Huitinga, I.; Ramaglia, V. Complement C1q-C3-associated synaptic changes in multiple sclerosis hippocampus. Ann. Neurol. 2015, 77, 1007–1026. [Google Scholar] [CrossRef]
- Di Filippo, M.; Portaccio, E.; Mancini, A.; Calabresi, P. Multiple sclerosis and cognition: Synaptic failure and network dysfunction. Nat. Rev. Neurosci. 2018, 19, 599–609. [Google Scholar] [CrossRef]
- Mandolesi, G.; Gentile, A.; Musella, A.; Fresegna, D.; De Vito, F.; Bullitta, S.; Sepman, H.; Marfia, G.A.; Centonze, D. Synaptopathy connects inflammation and neuro-degeneration in multiple sclerosis. Nat. Rev. Neurol. 2015, 11, 711–724. [Google Scholar] [CrossRef]
- Calabrese, M.; Magliozzi, R.; Ciccarelli, O.; Geurts, J.J.G.; Reynolds, R.; Martin, R. Exploring the origins of grey matter damage in multiple sclerosis. Nat. Rev. Neurosci. 2015, 16, 147–158. [Google Scholar] [CrossRef]
- Toosy, A.T.; Mason, D.F.; Miller, D.H. Optic neuritis. Lancet Neurol. 2014, 13, 83–99. [Google Scholar] [CrossRef]
- Constantinescu, C.S.; Farooqi, N.; O’Brien, K.; Gran, B. Experimental autoimmune encephalomyelitis (EAE) as a model system for multiple sclerosis (MS). Br. J. Pharmacol. 2011, 164, 1079–1106. [Google Scholar] [CrossRef]
- Robinson, A.P.; Harp, C.T.; Noronha, A.; Miller, S.D. The experimental autoimmune encephalomyelitis (EAE) model of MS: Utility for understanding disease pathophysiology and treatment. Handb. Clin. Neurol. 2014, 122, 173–189. [Google Scholar] [PubMed]
- Ben-Nun, A.; Kaushansky, N.; Kawakami, N.; Krishnamoorthy, G.; Berer, K.; Liblau, R.; Hohlfeld, R.; Wekerle, H. From classic to spontaneous and humanized models of multiple sclerosis: Impact on understanding pathogenesis and drug development. J. Autoimmun. 2014, 54, 33–50. [Google Scholar] [CrossRef]
- Dembla, M.; Kesharwani, A.; Natarajan, S.; Fecher-Trost, C.; Fairless, R.; Williams, S.K.; Flockerzi, V.; Diem, R.; Schwarz, K.; Schmitz, F. Early auto-immune targeting of photoreceptor ribbon synapses in mouse models of multiple sclerosis. EMBO Mol. Med. 2018, 10, e8926. [Google Scholar] [CrossRef]
- Mukherjee, A.; Katiyar, R.; Dembla, E.; Dembla, M.; Kumar, P.; Belkacemi, A.; Jung, M.; Beck, A.; Flockerzi, V.; Schwarz, K.; et al. Disturbed Presynaptic Ca2+ Signaling in Photoreceptors in the EAE Mouse Model of Multiple Sclerosis. iScience 2020, 23, 101830. [Google Scholar] [CrossRef] [PubMed]
- Matthews, G.; Fuchs, P. The diverse roles of ribbon synapses in sensory neurotransmission. Nat. Rev. Neurosci. 2010, 11, 812–822. [Google Scholar] [CrossRef]
- Lagnado, L.; Schmitz, F. Ribbon synapses and visual processing in the retina. Annu. Rev. Vis. Sci. 2015, 1, 235–262. [Google Scholar] [CrossRef]
- Moser, T.; Grabner, C.P.; Schmitz, F. Sensory processing at ribbon synapses in the retina and the cochlea. Physiol. Rev. 2010, 100, 103–144. [Google Scholar] [CrossRef]
- Schmitz, F.; Königstorfer, A.; Südhof, T.C. RIBEYE, a component of synaptic ribbons: A protein’s journey through evolution provides insight into synaptic ribbon function. Neuron 2000, 28, 857–872. [Google Scholar] [CrossRef]
- Maxeiner, S.; Luo, F.; Tan, A.; Schmitz, F.; Südhof, T.C. How to make a synaptic ribbon: RIBEYE deletion abolishes ribbons in retinal synapses and disrupts neurotransmitter release. EMBO J. 2016, 35, 1098–1114. [Google Scholar] [CrossRef]
- Schmitz, F. The making of synaptic ribbons: How they are built and what they do. Neuroscientist 2009, 15, 611–624. [Google Scholar] [CrossRef]
- Heidelberger, R.; Thoreson, W.B.; Witkovsky, P. Synaptic transmission at retinal ribbon synapses. Prog. Ret. Eye Res. 2005, 24, 682–720. [Google Scholar] [CrossRef] [PubMed]
- Allwardt, B.A.; Lall, A.B.; Brockerhoff, S.E.; Dowling, J.E. Synapse formation is arrested in retinal photoreceptors of the zebrafish nrc mutant. J. Neurosci. 2001, 21, 2330–2342. [Google Scholar] [CrossRef] [PubMed]
- Van Epps, H.A.; Hayashi, M.; Lucast, L.; Stearns, G.W.; Hurley, J.B.; De Camilli, P.; Brockerhoff, S.E. The zebrafish nrc mutant reveals a role for the polyphosphoinositide phosphatase synaptojanin in cone photoreceptor ribbon anchoring. J. Neurosci. 2004, 24, 8641–8650. [Google Scholar] [CrossRef]
- Trapani, J.G.; Obholzer, N.; Mo, W.; Brockerhoff, S.E.; Nicolson, T. Synaptojanin is required for temporal fidelity of synaptic transmission in hair cells. PLoS Genet. 2009, 5, e1000480. [Google Scholar] [CrossRef]
- Jung, S.; Maritzen, T.; Wichmann, C.; Jing, Z.; Neef, A.; Revelo, N.H.; Al-Moyed, H.; Meese, S.; Woijcik, S.M.; Panou, I.; et al. Disruption of adapter protein 2mu (AP-2mu) in cochlear hair cells impairs vesicle reloading of synaptic release sites and hearing. EMBO J. 2015, 34, 2686–2702. [Google Scholar] [CrossRef]
- Wahl, S.; Magupalli, V.G.; Dembla, M.; Katiyar, R.; Schwarz, K.; Köblitz, L.; Alpadi, K.; Krause, E.; Rettig, J.; Sung, C.H.; et al. The disease protein Tulp1 is essential for periactive zone endocytosis in photoreceptor ribbon synapses. J. Neurosci. 2016, 36, 2473–2493. [Google Scholar] [CrossRef]
- Tertrais, M.; Boueau, Y.; Emptoz, A.; Belleudy, S.; Sutton, R.B.; Petit, C.; Safieddine, S.; Dulon, D. Viral transfer of mini-otoferlins partially restores the fast component of exocytosis and uncovers ultrafast endocytosis in auditory hair cells of otoferlin knock-out mice. J. Neurosci. 2019, 39, 3394–3411. [Google Scholar] [CrossRef]
- Kroll, J.; Jaime Tobón, L.M.; Vogl, C.; Neef, J.; Kondratiuk, I.; König, M.; Strenzke, N.; Wichmann, C.; Milosevic, I.; Moser, T. Endophilin-A regulates presynaptic Ca2+ influx and synaptic vesicle recycling in auditory hair cells. EMBO J. 2019, 38, e100116. [Google Scholar] [CrossRef]
- Kroll, J.; Özçete, Ö.D.; Jung, S.; Maritzen, T.; Milosevic, I.; Wichmann, C.; Moser, T. AP180 promotes release site clearance and clathrin-dependent vesicle reformation in mouse cochlear inner hair cells. J. Cell Sci. 2020, 133, 236737. [Google Scholar] [CrossRef]
- Xiong, W.; Yu, S.; Gong, S. Loss of cochlear ribbon synapses in the early stage of aging causes initial hearing impairment. Am. J. Transl. Res. 2020, 12, 7354–7366. [Google Scholar] [PubMed]
- Pangrsic, T.; Vogl, C. Balancing presynaptic release and endocytic membrane retrieval at hair cell ribbon synapses. FEBS Lett. 2018, 592, 3633–3650. [Google Scholar] [CrossRef] [PubMed]
- Doherty, G.J.; McMahon, H.T. Mechanisms of endocytosis. Annu. Rev. Biochem. 2009, 78, 857–902. [Google Scholar] [CrossRef]
- McMahon, H.T.; Boucrot, E. Molecular mechanism and physiological functions of clathrin-mediated endocytosis. Nat. Rev. Cell Biol. 2011, 12, 517–533. [Google Scholar] [CrossRef]
- Ferguson, S.M.; DeCamilli, P. Dynamin, a membrane remodelling GTPase. Nat. Rev. Mol. Cell Biol. 2012, 13, 75–88. [Google Scholar] [CrossRef]
- Daumke, O.; Roux, A.; Haucke, V. BAR domain scaffolds in dynamin-mediated membrane fission. Cell 2014, 156, 882–892. [Google Scholar] [CrossRef]
- Antonny, B.; Curd, C.; De Camilli, P.; Chen, E.; Daumke, O.; Faelber, K.; Ford, M.; Frolov, V.A.; Frost, A.; Hinshaw, J.E.; et al. Membrane fission by dynamin: What we know and what we need to know. EMBO J. 2016, 35, 2270–2284. [Google Scholar] [CrossRef]
- Jimah, J.R.; Hinshaw, J.E. Structural insights into the mechanisms of dynamin superfamily proteins. Trends Cell Biol. 2019, 29, 257–273. [Google Scholar] [CrossRef]
- Thottacherry, J.J.; Sathe, M.; Prabhakara, C.; Mayor, S. Spoiled for choice: Diverse endocytic pathways function at the cell surface. Annu. Rev. Cell Dev. Biol. 2019, 35, 55–84. [Google Scholar] [CrossRef]
- Kononenko, N.L.; Haucke, V. Molecular mechanisms of presynaptic membrane retrieval and synaptic vesicle reformation. Neuron 2015, 45, 484–496. [Google Scholar] [CrossRef]
- Gan, Q.; Watanabe, S. Synaptic vesicle endocytosis in different model systems. Front. Cell. Neurosci. 2018, 12, 171. [Google Scholar] [CrossRef]
- Fuchs, M.; Brandstätter, J.H.; Regus-Leidig, H. Evidence for a Clathrin-independent mode of endocytosis at a continuously active sensory synapse. Front. Cell. Neurosci. 2014, 8, 60. [Google Scholar] [CrossRef]
- Xue, J.; Graham, M.E.; Novelle, A.E.; Sue, N.; Gray, N.; McNiven, M.A.; Smillie, K.J.; Cousin, M.A.; Robinson, P.J. Calcineurin selectively docks with the dynamin1xb slice variant to regulate activity-dependent bulk endocytosis. J. Biol. Chem. 2011, 286, 30195–30303. [Google Scholar] [CrossRef]
- Bodmer, D.; Ascano, A.; Kuruvilla, R. Isoform-specific dephosphorylation of dynamin1 by calcineurin couples neurotrophin receptor endocytosis to axonal growth. Neuron 2011, 70, 1085–1099. [Google Scholar] [CrossRef]
- Eich, M.L.; Dembla, E.; Wahl, S.; Dembla, M.; Schwarz, K.; Schmitz, F. The calcineurin-binding, activity-dependent splice variant dynamin1xb is highly enriched in synapses in various regions of the central nervous system. Front. Mol. Neurosci. 2017, 10, 230. [Google Scholar] [CrossRef]
- Robinson, P.J.; Liu, J.P.; Powell, K.A.; Fykse, E.M.; Südhof, T.C. Phosphorylation of dynamin1 and synaptic vesicel recycling. Trends Neurosci. 1994, 17, 348–353. [Google Scholar] [CrossRef]
- Cousin, M.A.; Robinson, P.J. The dephosphins: Dephosphorylation by calcineurin triggers synaptic vesicle endocytosis. Trends Neurosci. 2001, 24, 659–665. [Google Scholar] [CrossRef]
- Ferguson, S.M.; Brasnjo, G.; Hayashi, M.; Wölfel, M.; Collesi, C.; Giovedi, S.; Raimondi, A.; Gong, L.-W.; Ariel, P.; Paradise, S.; et al. A selective activity-dependent requirement for dynamin 1 in synaptic vesicle endocytosis. Science 2007, 316, 570–574. [Google Scholar] [CrossRef]
- Raimondi, A.; Ferguson, S.M.; Lou, X.; Armbruster, M.; Paradise, S.; Giovedi, S.; Messa, M.; Kono, N.; Takasaki, J.; Cappello, V.; et al. Overlapping Role of Dynamin Isoforms in Synaptic Vesicle Endocytosis. Neuron 2011, 70, 1100–1114. [Google Scholar] [CrossRef]
- Calabrese, B.; Halpain, S. Differential targeting of dynamin-1 and dynamin-3 to nerve terminals during chronic suppression of neuronal activity. Mol. Cell. Neurosci. 2015, 68, 36–45. [Google Scholar] [CrossRef] [PubMed]
- Zampighi, G.A.; Schietroma, C.; Zampighi, L.M.; Woodruff, M.; Wright, E.M.; Brecha, N.C. Conical tomography of a ribbon synapse: Structural evidence for vesicle fusion. PLoS ONE 2011, 6, e16944. [Google Scholar] [CrossRef] [PubMed]
- Issa, N.P.; Hudspeth, A.J. Clustering of Ca2+ channels and Ca2+ activated K+ channels at fluorescently labeled presynaptic active zones of hair cells. Proc. Natl. Acad. Sci. USA 1994, 91, 7578–7582. [Google Scholar] [CrossRef] [PubMed]
- Liu, X.; Kerov, V.; Haeseleer, F.; Majumder, A.; Artemyev, N.; Baker, S.A.; Lee, A. Dysregulation of Ca(v)1.4 channels disrupts the maturation of photoreceptor synaptic ribbons in congenital stationary night blindness type 2. Channels 2013, 7, 514–523. [Google Scholar] [CrossRef] [PubMed]
- Zabouri, N.; Haverkamp, S. Calcium channel-dependent molecular maturation of photoreceptor synapses. PLoS ONE 2013, 8, e63853. [Google Scholar] [CrossRef]
- Regus-Leidig, H.; Atorf, J.; Feigenspan, A.; Kremers, J.; Maw, M.A.; Brandstätter, J.H. Photoreceptor degeneration in two mouse models for congenital stationary night blindness type 2. PLoS ONE 2014, 9, e86769. [Google Scholar] [CrossRef]
- Sheets, L.; Kindt, K.; Nicolson, T. Presynaptic Cav1.3 channels regulate synaptic ribbon size and are required for synaptic maintenance in sensory hair cells. J. Neurosci. 2012, 32, 17273–17286. [Google Scholar] [CrossRef]
- Sheets, L.; He, X.J.; Olt, J.; Schreck, M.; Petralia, R.S.; Wang, Y.X.; Zhang, Q.; Beirl, A.; Nicolson, T.; Marcotti, W.; et al. Enlargement of ribbons in zebrafish hair cells increases calcium currents but disrupts afferent spontaneous activity and timing of stimulus onset. J. Neurosci. 2017, 37, 6299–6313. [Google Scholar] [CrossRef]
- Dembla, E.; Dembla, M.; Maxeiner, S.; Schmitz, F. Synaptic ribbons foster active zone stability and illumination-dependent active zone enrichment of RIM2 and Cav1.4 in photoreceptor synapses. Sci. Rep. 2020, 10, 5957. [Google Scholar] [CrossRef]
- Joiner, M.L.; Lee, A. Voltage-gated Cav1 channels in disorders of vision and hearing. Curr. Mol. Pharmacol. 2015, 8, 143–148. [Google Scholar] [CrossRef]
- Pangrsic, T.; Singer, J.H.; Koschak, A. Calcium channels: Key players in sensory coding in the retina and the inner ear. Physiol. Rev. 2018, 98, 2063–2096. [Google Scholar] [CrossRef]
- Frank, T.; Rutherford, M.A.; Strenzke, N.; Neef, A.; Pangrsic, T.; Khimich, D.; Fejtova, A.; Gundelfinger, E.D.; Liberman, M.C.; Harke, B.; et al. Bassoon and the synaptic ribbon organize Ca2+ channels and vesicles to add release sites and promote refilling. Neuron 2010, 68, 724–738. [Google Scholar] [CrossRef]
- Joselevitch, C.; Zenisek, D. The cytomatrix protein bassoon contributes to fast neurotransmission at conventional and ribbon synapses. Neuron 2010, 68, 604–608. [Google Scholar] [CrossRef]
- Manchanda, A.; Chatterjee, P.; Bonventra, J.A.; Haggard, D.E.; Kindt, K.S.; Tanguay, R.L.; Johnson, C.P. Otoferlin depletion results in abnormal synaptic ribbons and altered intracellular calcium levels in zebrafish. Sci. Rep. 2019, 9, 14273. [Google Scholar] [CrossRef]
- Magupalli, V.G.; Schwarz, K.; Alpadi, K.; Natarajan, S.; Seigel, G.M.; Schmitz, F. Multiple RIBEYE-RIBEYE interactions create a dynamic scaffold for the formation of synaptic ribbons. J. Neurosci. 2008, 28, 7954–7967. [Google Scholar] [CrossRef]
- Wong, H.C.; Zhang, Q.; Beirl, A.J.; Petralia, R.S.; Wang, Y.-X.; Kindt, K. Synaptic mitochondria regulate hair-cell synapse size and function. eLife 2019, 8, e48914. [Google Scholar] [CrossRef]
- Okur, M.N.; Mao, B.; Kimura, R.; Haraczy, S.; Fitzgerald, T.; Edwards-Hollingsworth, K.; Tian, J.; Osmani, W.; Croteau, D.L.; Kelley, M.W.; et al. Short-term NAD+ supplementation prevents hearing loss in mouse models of Cockayne syndrome. NPJ Aging Mech. Dis. 2020, 6, 1. [Google Scholar] [CrossRef]
- Denton, R.M.; Randle, P.J.; Martin, B.R. Stimulation by calcium ions of pyruvate dehydrogenase phosphate phosphatase. Biochem. J. 1972, 128, 161–163. [Google Scholar] [CrossRef]
- Denton, R.M.; Richards, D.A.; Chin, J.G. Calcium ions and the regulation of NAD+-linked isocitrate dehydrogenase from the mitochondria of rat heart and other tissues. Biochem. J. 1978, 176, 899–906. [Google Scholar] [CrossRef]
- McCormack, J.G.; Denton, R.M. The effect of calcium ions and adenine nucleotides on the activity of pig heart 2-oxoglutarate dehydrogenase complex. Biochem. J. 1979, 180, 533–544. [Google Scholar] [CrossRef]
- Denton, R.M.; McCormack, J.G. Ca2+ transport by mammalian mitochondria and its role in hormone secretion. Am. J. Physiol. 1985, 249, E543–E554. [Google Scholar]
- Gunter, T.E.; Gunter, K.K.; Sheu, S.S.; Gavin, C.E. Mitochondrial calcium transport: Physiological and pathological relevance. Am. J. Physiol. 1994, 267, C313–C339. [Google Scholar] [CrossRef]
- Balaban, R.S. Cardiac energy metabolism homeostasis: Role of cytosolic calcium. J. Mol. Cell. Cardiol. 2002, 34, 1259–1271. [Google Scholar] [CrossRef]
- Glancy, B.; Balaban, R.S. Role of mitochondrial Ca2+ in the regulation of cellular kinetics. Biochemistry 2012, 51, 2959–2973. [Google Scholar] [CrossRef]
- Marcu, R.; Wiczer, B.M.; Neeley, C.; Hawkins, B. Mitochondrial matrix accumulation regulates cytosolic NAD+/NADH metabolism, protein acetylation, and sirtuin expression. Mol. Cell Biol. 2014, 34, 2890–2902. [Google Scholar] [CrossRef]
- Marcu, R.; Kotha, S.; Zhi, Z.; Qin, W.; Neeley, C.K.; Wang, R.K.; Zheng, Y.; Hawkins, B.J. The mitochondrial permeability transition pore regulates endothelial bioenergetics and angiogenesis. Circ. Res. 2015, 116, 1336–1345. [Google Scholar] [CrossRef]
- Witte, M.E.; Mahad, D.J.; Lassmann, H.; van Horssen, J. Mitochondrial dysfunction contributes to neurodegeneration in multiple sclerosis. Trends Mol. Med. 2014, 20, 179–187. [Google Scholar] [CrossRef]
- Campbell, G.R.; Worrall, J.T.; Mahad, D.J. The central role of mitochondria in axonal degeneration in multiple sclerosis. Mult. Scler. 2014, 20, 1806–1813. [Google Scholar] [CrossRef] [PubMed]
- Peixoto de Barcelos, I.; Troxell, R.M.; Graves, J.R. Mitochondrial dysfunction and multiple sclerosis. Biology 2019, 8, 37. [Google Scholar] [CrossRef]
- Jensen, J.B.; Lysaght, A.C.; Liberman, M.C.; Qvortrup, K.; Stankovic, K.M. Immediate and delayed cochlear neuropathy after noise exposure in pubescent mice. PLoS ONE 2015, 10, e0125160. [Google Scholar] [CrossRef] [PubMed]
- Liu, H.; Peng, H.; Wang, L.; Xu, P.; Wang, H.; Liu, H.; Wu, H. Differences in calcium clearance at inner hair cell active zones may underlie the difference in susceptibility to noise-induced cochlea synaptopathy of C57BL/6J and CBA/CaJ mice. Front. Cell Dev. Biol. 2021, 8, 635201. [Google Scholar] [CrossRef]
- Giraudet, F.; Labanca, L.; Souchal, M.; Avan, P. Decreased reemerging auditory brainstem responses under ipsilateral broadband masking as a marker of noise-induced cochlear synaptopathy. Ear Hear. 2021, 42, 1062–1071. [Google Scholar] [CrossRef] [PubMed]
- Liberman, L.D.; Wang, H.; Liberman, M.C. Opposing gradients of ribbon size and AMPA receptor expression underlie sensitivity differences among cochlear-nerve/hair-cell synapses. J. Neurosci. 2011, 31, 801–808. [Google Scholar] [CrossRef] [PubMed]
- Kantardzhieva, A.; Liberman, M.C.; Sewell, W.F. Quantitative analysis of ribbons, vesicles, and cisterns at the cat inner hair cell synapse: Correlation with spontaneous rate. J. Comp. Neurol. 2013, 521, 3260–3271. [Google Scholar] [CrossRef] [PubMed]
- Gomez-Casati, M.E.; Goutman, J. Divide and conquer acoustic diversity. EMBO J. 2021, 40, 107531. [Google Scholar] [CrossRef]
- Adly, M.A.; Spiwoks-Becker, I.; Vollrath, L. Ultrastructural changes of photoreceptor synaptic ribbons in relation to time of day and illumination. Investig. Ophthalmol. Vis. Sci. 1999, 40, 2165–2172. [Google Scholar]
- Vollrath, L.; Spiwoks-Becker, I.; Adly, M.A.; Schaaf, U.; Lasarzik, I.; Neumann, S. Synaptic ribbon dynamics in photoreceptors of mice. Ital. J. Anat. Embryol. 2001, 106, 499–547. [Google Scholar]
- Spiwoks-Becker, I.; Glas, M.; Lasarzik, I.; Vollrath, L. Mouse photoreceptor synaptic ribbons lose and regain material in response to illumination changes. Eur. J. Neurosci. 2004, 19, 1559–1571. [Google Scholar] [CrossRef]
- Schmitz, F.; Natarajan, S.; Venkatesan, J.K.; Wahl, S.; Schwarz, K.; Grabner, C.P. EF hand—Mediated Ca2+- and cGMP-signaling in photoreceptor terminals. Front. Mol. Neurosci. 2012, 5, 28. [Google Scholar] [CrossRef]
- Roos, J.; Kelly, R.B. The endocytic machinery in nerve terminals surrounds sites of exocytosis. Curr. Biol. 1999, 9, 1411–1414. [Google Scholar] [CrossRef]
- Okamoto, M.; Schoch, S.; Südhof, T.C. EHSH1/intersectin, a protein that contains EH and SH3 domains and binds to dynamin and SNAP25. J. Biol. Chem. 1999, 274, 18446–18454. [Google Scholar] [CrossRef]
- Marie, B.; Sweeney, S.T.; Poskanzer, K.E.; Roos, J.; Kelly, R.B.; Davis, G.W. Dap160/Intersectin scaffolds the active zone to achieve high-fidelity endocytosis and normal synaptic growth. Neuron 2004, 43, 207–219. [Google Scholar] [CrossRef] [PubMed]
- Sakaba, T.; Kononenko, N.; Bacetic, J.; Pechstein, A.; Schmoranzer, J.; Yao, L.; Barth, H.; Shupliakov, O.; Aktories, K.; Haucke, V. Fast neurotransmitter release regulated by the endocytic scaffold intersectin. Proc. Natl. Acad. Sci. USA 2013, 110, 8266–8271. [Google Scholar] [CrossRef] [PubMed]
- Cano, R.; Tabares, L. The active and periactive zone organization and the functional properties of small and large synapses. Front. Synaptic Neurosci. 2016, 8, 12. [Google Scholar] [CrossRef] [PubMed]
- Maritzen, T.; Haucke, V. Coupling of exocytosis and endocytosis at the presynaptic active zone. Neurosci. Res. 2018, 127, 45–52. [Google Scholar] [CrossRef]
- Wahl, S.; Katiyar, R.; Schmitz, F. A local, periactive zone endocytic machinery of photoreceptor synapses in close vicinity to synaptic ribbons. J. Neurosci. 2013, 33, 10278–10300. [Google Scholar] [CrossRef]
- Thoreson, W.B.; Rabl, K.; Townes-Anderson, E.; Heidelberger, R. A highly Ca2+ sensitive pool of vesicles contributes to linearity at the rod photoreceptor ribbon synapse. Neuron 2004, 42, 595–605. [Google Scholar] [CrossRef]
- Thoreson, W.B. Transmission at rod and cone ribbon synapses in the retina. Pflug. Arch. 2021, 473, 1469–1491. [Google Scholar] [CrossRef]
- Wu, L.G.; McNeil, B.D.; Xu, J.; Fan, J.; Xue, L.; Melicoff, E.; Adachi, R.; Bai, L.; Wu, L.G. Ca2+ and calmodulin initiate all forms of endocytosis during depolarization of a nerve terminal. Nat. Neurosci. 2009, 12, 1003–1010. [Google Scholar] [CrossRef]
- Yamashita, T.; Eguchi, K.; Saitoh, N.; von Gersdorff, H.; Takahashi, T. Developmental shift to a mechanism to a mechanism of synaptic vesicle endocytosis requiring nanodomain Ca2+. Nat. Neurosci. 2010, 13, 838–844. [Google Scholar] [CrossRef]
- Leitz, J.; Kavalali, E.T. Ca2+ dependence of synaptic vesicle endocytosis. Neuroscientist 2016, 22, 464–476. [Google Scholar] [CrossRef]
- Marks, B.; McMahon, H.T. Calcium triggers calcineurin-dependent synaptic vesicle recycling in mammalian nerve terminals. Curr. Biol. 1998, 8, 740–749. [Google Scholar] [CrossRef]
- Smillie, K.J.; Cousin, M.A. Dynamin1 phosphorylation and the control of synaptic vesicle endocytosis. Biochem. Soc. Symp. 2005, 72, 87–97. [Google Scholar]
- Anggono, V.; Smillie, K.J.; Graham, M.E.; Valova, V.A.; Cousin, M.A.; Robinson, P.J. Syndapin 1 is the phosphorylation-regulated dynamin1 partner in synaptic vesicle endocytosis. Nat. Neurosci. 2006, 9, 752–760. [Google Scholar] [CrossRef]
- Clayton, E.L.; Evans, G.J.O.; Cousin, M.A. Activity-dependent control of bulk endocytosis by protein dephosphorylation in central nerve terminals. J. Physiol. 2007, 585, 687–691. [Google Scholar] [CrossRef]
- Clayton, E.L.; Anggono, V.; Smillie, K.J.; Chau, N.; Robinson, P.J.; Cousin, M.A. The phospho-dependent dynamin—Syndapin interaction triggers activity-dependent bulk endocytosis of synaptic vesicles. J. Neurosci. 2009, 29, 7706–7717. [Google Scholar] [CrossRef]
- Clayton, E.L.; Cousin, M.A. The molecular physiology of activity-dependent bulk endocytosis of synaptic vesicles. J. Neurochem. 2009, 111, 901–914. [Google Scholar] [CrossRef]
- Saraf, J.; Bhattacharya, P.; Kalia, K.; Borah, A.; Sarmah, D.; Kaur, H.; Dave, K.R.; Yavagal, D.R. A friend or foe: Calcineurin across the gamut of neurological disorders. ACS Cent. Sci. 2018, 4, 805–819. [Google Scholar] [CrossRef]
- Cheung, G.; Cousin, M.A. Synaptic vesicle generation from activity—Dependent bulk endosomes requires a dephosphorylation—Dependent dynamin—Syndapin interaction. J. Neurochem. 2019, 151, 570–583. [Google Scholar] [CrossRef]
- Engholm-Keller, K.; Waardenberg, A.J.; Müller, J.A.; Wark, J.R.; Fernando, R.N.; Arthur, J.W.; Robinson, P.J.; Dietrich, D.; Schoch, S.; Graham, M.E. The temporal profile of activity-dependent phosphor-signalling reveals long-lasting patterns of poststimulus regulation. PLoS Biol. 2019, 2, 46. [Google Scholar]
- Silbern, I.; Pan, K.T.; Fiosins, M.; Bonn, S.; Rizzoli, S.O.; Fornasiero, E.F.; Urlaub, H.; Jahn, R. Protein phosphorylation in depolarized synaptosomes: Dissecting primary effects of calcium from synaptic vesicle cycling. Mol. Cell. Proteom. 2021, 20, 100061. [Google Scholar] [CrossRef]
- Dagley, L.F.; Croft, N.P.; Isserlin, R.; Olsen, J.B.; Fong, V.; Emili, A.; Purcell, A.W. Discovery of novel disease-specific and membrane-associated candidate markers in a mouse model of multiple sclerosis. Mol. Cell. Proteom. 2014, 13, 679–700. [Google Scholar] [CrossRef] [PubMed]
- Sen, M.K.; Almuslehi, M.S.M.; Shortland, P.J.; Mahns, D.A.; Coorssen, J.R. Proteomics of multiple sclerosis: Inherent issues in defining the pathoetiology and identifying (early) biomarkers. Int. Mol. Sci. 2021, 22, 7377. [Google Scholar] [CrossRef] [PubMed]
- Fairless, R.; Williams, S.K.; Diem, R. Dysfunctions of neuronal calcium signalling in neuroinflammation and neurodegeneration. Cell Tiss. Res. 2014, 357, 455–462. [Google Scholar] [CrossRef] [PubMed]
- Hundehege, P.; Epping, L.; Meuth, S.G. Calcium homeostasis in multiple sclerosis. Neurol. Int. Open 2017, 1, E127–E135. [Google Scholar] [CrossRef]
- Dembla, M.; Wahl, S.; Katiyar, R.; Schmitz, F. ArfGAP3 is a component of the photoreceptor synaptic ribbon complex and forms a NAD(H)-regulated, redox-sensitive complex with RIBEYE that is important for endocytosis. J. Neurosci. 2014, 34, 5245–5260. [Google Scholar] [CrossRef][Green Version]
- Robinson, P.J.; Sontag, J.M.; Liu, J.P.; Fykse, E.M.; Slaughter, C.; McMahon, H.T.; Südhof, T.C. Dynamin GTPase regulated by protein kinase C phosphorylation in nerve terminals. Nature 1993, 365, 163–166. [Google Scholar] [CrossRef]
- Schneider, C.A.; Rasband, W.S.; Eliceiri, K.W. NIH Image to ImageJ: 25 years of image analysis. Nat. Methods 2012, 9, 671–675. [Google Scholar] [CrossRef]
- Schindelin, C.A.; Arganda-Carreras, I.; Frise, E.; Kaynig, V.; Longair, M.; Pietzsch, T.; Preibisch, S.; Rueden, C.; Saalfeld, S.; Schmid, B.; et al. Fiji: An open source platform for biological-image analysis. Nat. Methods 2012, 9, 676–682. [Google Scholar] [CrossRef]
- Costes, S.V.; Daelemans, D.; Cho, E.H.; Dobbin, Z.; Pavlakis, G.; Lockett, S. Automatic and quantitative measurement of protein-protein colocalization in live cells. Biophys. J. 2004, 86, 3993–4003. [Google Scholar] [CrossRef]
- Bolte, S.; Cordelieres, F.P. A guided tour into subcellular colocalization analysis in light microscopy. J. Microsc. 2006, 224, 213–232. [Google Scholar] [CrossRef]
- Dunn, K.W.; Kamocka, M.M.; McDonald, J.H. A practical guide to evaluating colocalization in biological microscopy. Am. J. Physiol. Cell. Physiol. 2011, 300, C723–C742. [Google Scholar] [CrossRef]
- Schermelleh, L.; Heintzmann, R.; Leonhardt, H. A guide to super-resolution fluorescence microscopy. J. Cell Biol. 2010, 190, 165–175. [Google Scholar] [CrossRef]
- Peachey, L.D. Thin sections: I. a study of section thickness and physical distortion produced during microtomy. J. Biophys. Biochem. Cytol. 1958, 4, 233–242. [Google Scholar] [CrossRef]
- Sakai, T. Relation between thickness and interference colors of biological ultrathin sections. J. Electron. Microsc. 1980, 29, 369–375. [Google Scholar]
- Applebury, M.L.; Antoch, M.P.; Baxter, L.C.; Chun, L.L.Y.; Falk, J.D.; Farhangfar, F.; Kage, K.; Krzystolik, M.G.; Lyass, L.A.; Robbins, J.T. The murine cone photoreceptor: A single cone type expresses both S and M opsins with retinal spatial patterning. Neuron 2000, 27, 513–523. [Google Scholar] [CrossRef]
- Wang, Y.V.; Weick, M.; Demb, J.B. Spectral and temporal sensitivity of cone-mediated responses in mouse retinal ganglion cells. J. Neurosci. 2011, 31, 7670–7681. [Google Scholar] [CrossRef]
- Dröse, S.; Altendorf, K. Bafilomycins and concanamycins as inhibitors of V-ATPases and P-ATPases. J. Exp. Biol. 1997, 200, 1–8. [Google Scholar] [CrossRef]
- Sankaranarayanan, S.; Ryan, T.A. Calcium accelerates endocytosis of vSNAREs at hippocampal synapses. Nat. Neurosci. 2001, 4, 129–136. [Google Scholar] [CrossRef]
- Granseth, B.; Lagnado, L. The role of endocytosis in regulating the strength of hippocampal synapses. J. Physiol. 2008, 586, 5969–5982. [Google Scholar] [CrossRef]
- Dreosti, E.; Lagnado, L. Optical reporters of synaptic activity in neural circuits. Exp. Physiol. 2011, 96, 4–12. [Google Scholar] [CrossRef]
- Ryan, T.A.; Reuter, H. Measurement of vesicle recycling in central neurons. News Physiol. Sci. 2001, 16, 10–14. [Google Scholar] [CrossRef]
- Schwarz, T.L. Synaptotagmin promotes vesicle fusion and recycling. Proc. Natl. Acad. Sci. USA 2004, 101, 16401–16402. [Google Scholar] [CrossRef]
- Rose, T.; Schoeneberger, P.; Jezek, K.; Oertner, T.G. Developmental refinement of vesicle cycling at Schaffer collateral synapses. Neuron 2013, 77, 1109–1121. [Google Scholar] [CrossRef]
- Klionsky, D.J.; Elazar, Z.; Seglen, P.O.; Rubinszein, D.C. Does bafilomycin A1 block the fusion of autophagosomes with lysosomes. Autophagy 2008, 4, 849–850. [Google Scholar] [CrossRef]
- Huenchuguala, S.; Munoz, P.; Segura-Aguilar, J. The importance of mitophagy in maintaining mitochondrial function in U373MG cells. Bafilomycin A1 restores aminochrome-induced mitochondrial damage. ACS Chem. Neurosci. 2017, 8, 2247–2253. [Google Scholar] [CrossRef]
- Zhdanov, A.V.; Dmitriev, R.I.; Papkovsky, D.B. Bafilomycin A1 activates respiration of neuronal cells via uncoupling associated with flickering depolarization of mitochondria. Cell. Mol. Life Sci. 2011, 68, 903–917. [Google Scholar] [CrossRef]
- Dieckmann-Schuppert, A.; Schnittler, H.J. A simple assay for quantification of protein in tissue sections, cell cultures, and cell homogenates, and of protein immobilized on solid surfaces. Cell Tiss. Res. 1997, 288, 119–126. [Google Scholar] [CrossRef]


| Antibody | Reference | Dilution |
|---|---|---|
| Anti-RIBEYE(B), rabbit polyclonal (U2656) | [29] | 1:1500 (IF) |
| Anti-RIBEYE(B), mouse monoclonal (2D9) | [24] | 1:1000 (IF) |
| Anti-Dynamin1xb (mouse monoclonal) | [55] | 1:200 (IF) 1:500 (WB) |
| Anti-Dynamin3 (rabbit polyclonal) | Synaptic Systems, (Göttingen, Germany) SYSY-115302 [52] | 1:500 (IF) 1:1000(WB) |
| Anti-phospho-Dynamin1 (Ser774; sheep polyclonal) | Santa Cruz, Sc-135689 (Heidelberg, Germany) [126] | 1:100 (IF) 1:500 (WB) |
| Anti-Actin, mouse monoclonal (clone C4) | Millipore, MAB1501 (Darmstadt, Germany) [55] | 1:1000(IF) 1:2000(WB) |
| Antibody | Source | Dilution |
|---|---|---|
| Chicken anti-mouse Alexa488 | Invitrogen Molecular Probes (Karlsruhe, Deutschland), A-21200 | 1:1000 (IF) |
| Donkey anti-rabbit Alexa568 | Invitrogen Molecular Probes (Karlsruhe, Deutschland), A-10042 | 1:1000 (IF) |
| Chicken anti-rabbit Alexa488 | Invitrogen Molecular Probes (Karlsruhe, Deutschland), A-21441 | 1:1000 (IF) |
| Donkey anti-mouse Alexa568 | Invitrogen Molecular Probes (Karlsruhe, Deutschland), A-10037 | 1:1000 (IF) |
| Donkey anti-sheep Alexa 568 | Invitrogen, Molecular Probes (Karlsruhe, Deutschland), A-21099 | 1:1000 (IF) |
| Donkey anti-rabbit Alexa 647 | Invitrogen Molecular Probes (Karlsruhe, Deutschland), A-31573 | 1:1000 (IF) |
| Goat anti-rabbit peroxidase-conjugated (POX) | Sigma (Taufkirchen, Germany), A-6154 | 1:3000 (WB) |
| Rabbit anti-sheep HRP-conjugated | Invitrogen ThermoFisher (Langenselbold, Germany), 31480 | 1:3000 (WB) |
| Goat anti-mouse POX | Sigma (Taufkirchen, Germany), A-3673 | 1:3000 (WB) |
| IRDye® 680LT Donkey anti-Mouse IgG | LI-COR (Bad Homburg, Germany), 92568022 | 1:5000 (WB) |
| IRDye® 800CW Donkey anti-Rabbit IgG | LI-COR (Bad Homburg, Germany), 92532213 | 1:5000 (WB) |
| IRDye® 800CW Donkey anti-Goat IgG | LI-COR (Bad Homburg, Germany), 92832214 | 1:5000 (WB) |
Publisher’s Note: MDPI stays neutral with regard to jurisdictional claims in published maps and institutional affiliations. |
© 2021 by the authors. Licensee MDPI, Basel, Switzerland. This article is an open access article distributed under the terms and conditions of the Creative Commons Attribution (CC BY) license (https://creativecommons.org/licenses/by/4.0/).
Share and Cite
Kesharwani, A.; Schwarz, K.; Dembla, E.; Dembla, M.; Schmitz, F. Early Changes in Exo- and Endocytosis in the EAE Mouse Model of Multiple Sclerosis Correlate with Decreased Synaptic Ribbon Size and Reduced Ribbon-Associated Vesicle Pools in Rod Photoreceptor Synapses. Int. J. Mol. Sci. 2021, 22, 10789. https://doi.org/10.3390/ijms221910789
Kesharwani A, Schwarz K, Dembla E, Dembla M, Schmitz F. Early Changes in Exo- and Endocytosis in the EAE Mouse Model of Multiple Sclerosis Correlate with Decreased Synaptic Ribbon Size and Reduced Ribbon-Associated Vesicle Pools in Rod Photoreceptor Synapses. International Journal of Molecular Sciences. 2021; 22(19):10789. https://doi.org/10.3390/ijms221910789
Chicago/Turabian StyleKesharwani, Ajay, Karin Schwarz, Ekta Dembla, Mayur Dembla, and Frank Schmitz. 2021. "Early Changes in Exo- and Endocytosis in the EAE Mouse Model of Multiple Sclerosis Correlate with Decreased Synaptic Ribbon Size and Reduced Ribbon-Associated Vesicle Pools in Rod Photoreceptor Synapses" International Journal of Molecular Sciences 22, no. 19: 10789. https://doi.org/10.3390/ijms221910789
APA StyleKesharwani, A., Schwarz, K., Dembla, E., Dembla, M., & Schmitz, F. (2021). Early Changes in Exo- and Endocytosis in the EAE Mouse Model of Multiple Sclerosis Correlate with Decreased Synaptic Ribbon Size and Reduced Ribbon-Associated Vesicle Pools in Rod Photoreceptor Synapses. International Journal of Molecular Sciences, 22(19), 10789. https://doi.org/10.3390/ijms221910789