Article

Insights into Cadmium-Induced Carcinogenesis through an In Vitro Study Using C3H10T1/2Cl8 Cells: The Multifaceted Role of Mitochondria

1
Department of Biotechnology and Biosciences, University of Milano-Bicocca, Piazza della Scienza 2, 20126 Milano, Italy
2
Department of Molecular and Translational Medicine (DMTM), University of Brescia, Viale Europa 11, 25123 Brescia, Italy
3
Department of Earth and Environmental Sciences, University of Milan Bicocca, Piazza della Scienza 1, 20126 Milan, Italy
4
Integrated Models for Prevention and Protection in Environmental and Occupational Health, (MISTRAL), Interuniversity Research Center, 37134 Verona, Italy
*
Authors to whom correspondence should be addressed.
Int. J. Mol. Sci. 2021, 22(19), 10837; https://doi.org/10.3390/ijms221910837
Submission received: 10 September 2021 / Revised: 30 September 2021 / Accepted: 5 October 2021 / Published: 7 October 2021
(This article belongs to the Section Biochemistry)

Abstract

:
In this paper, we report the metabolic characterization of two foci, F1 and F3, obtained at the end of Cell Transformation Assay (CTA), performed by treating C3H10T1/2Cl8 mouse embryo fibroblasts with 1 μM CdCl2 for 24 h. The elucidation of the cadmium action mechanism can be useful both to improve the in vitro CTA and to yield insights into carcinogenesis. The metabolism of the two foci was investigated through Seahorse and enzyme activity assays; mitochondria were studied in confocal microscopy and reactive oxygen species were detected by flow cytometry. The results showed that F1 focus has higher glycolytic and TCA fluxes compared to F3 focus, and a more negative mitochondrial membrane potential, so that most ATP synthesis is performed through oxidative phosphorylation. Confocal microscopy showed mitochondria crowded in the perinuclear region. On the other hand, F3 focus showed lower metabolic rates, with ATP mainly produced by glycolysis and damaged mitochondria. Overall, our results showed that cadmium treatment induced lasting metabolic alterations in both foci. Triggered by the loss of the Pasteur effect in F1 focus and by mitochondrial impairment in F3 focus, these alterations lead to a loss of coordination among glycolysis, TCA and oxidative phosphorylation, which leads to malignant transformation.

1. Introduction

Cadmium (Cd) is a well-known carcinogen, classified by the International Agency for Research on Cancer as a group I human carcinogen; however, the molecular mechanisms leading cells into a malignant phenotype are largely unknown. Still, cadmium is a widespread environmental contaminant, currently released by anthropogenic activities at a rate of 30,000 tons per year. Human uptake is therefore very easy: besides occupational exposure, it can occur through food, drinking water, inhalation of air particles, and cigarette smoking. The absence of any specific excretory way for cadmium leads to its persistence inside the body, with a half-life between 10 and 30 years [1].
With the exception of a catalytic role in some algal enzymes [2], cadmium is devoid of all biological roles; however, Cd2+ ions can easily displace Zn2+ ions, due to their similar charge and mass [3,4,5,6]. This similarity also accounts for cadmium uptake by zinc channels and transporters, in what has been named a “Trojan horse mechanism” [7]. Moreover, cadmium can interfere with zinc binding proteins, whose estimated number within the cell is higher than 3,000. These features lead to a major displacement of Zn in the Zn-proteome, and the substitution with Cd in the Zn-finger regions. Consequences of these chemical properties are the disruption of the correct folding and the inactivation of proteins involved in genomic stability, such as the p53, and of proteins involved in DNA repair (e.g., NER and BER) [6,8].
Cell Transformation Assay (CTA), the most advanced in vitro test for the prediction of human chemical carcinogenicity, refers to the induction, in cultured cells, of phenotypic alterations that have long been considered associated with cells exhibiting neoplastic potential in vivo. After exposure to carcinogenic stimuli, such cells show morphological alterations and form discrete anchorage-independent altered colonies, referred to as transformed foci, atop the confluent monolayer. The transformed foci are able to produce tumors in vivo. Moreover, the CTA has been shown to closely model some key stages of the in vivo carcinogenic process [9]. In addition to be widely used for the screening of potential carcinogens [10,11], the CTA is also a powerful tool for mechanistic studies of carcinogenesis [12,13]. In our experiments, the CTA based on the use of C3H10T1/2Cl8 mouse embryo fibroblasts was adopted, the latter being among the suitable cells suggested by standard protocols [14].
Foci, obtained at the end of the CTA, are recognized under a microscope and classified by morphological features, such as deep basophilic staining, multilayered growth, random cell orientation at the edge of the focus, and invasiveness of the surrounding normal cells monolayer [9,14]. These morphological features are related to molecular changes leading the cells to acquire fully malignant characteristics, which are demonstrated by their ability to develop tumors when injected into susceptible host animals [15].
In a previous work [16], we found that morphological evaluations and proliferative assays confirmed the loss of contact inhibition and the higher proliferative rate of transformed clones. Moreover, biochemical analysis of EGFR pathway revealed that, despite the same initial carcinogenic stimulus (1 μM CdCl2 for 24 h), the different foci were characterized by the activation of different molecular pathways. In particular, F1 focus showed ERK activation and a high proliferation rate, while F3 focus showed Akt activation and a survival molecular profile. More recently [12], a toxicogenomic study performed by our group, showed that, upon cadmium administration, the two foci also developed distinct patterns of up-regulated and down-regulated genes.
This work reports an in-depth characterization of both F1 and F3 foci, with the aim of identifying metabolic alterations caused by gene dysregulation. We investigated oxygen consumption rate and ATP production, as well as mitochondrial morphology and defense mechanisms against oxidative stress; mitochondria are in fact known to play a key role in malignant transformation and metastasis development [17]. Our results show a different metabolic pattern in each focus, which could explain their different proliferation rates.

2. Results

2.1. The Main ATP Production Route Is Oxidative Phosphorylation in F1 Focus and Substrate Level Phosphorylation in F3 Focus

The respiratory metabolism of both F1 and F3 foci was investigated, measuring oxygen consumption rate (OCR) and extracellular acidification rate (ECAR), through Mitostress assay in the Agilent Seahorse. The results are reported in Figure 1: F1 focus showed higher basal and maximal respiration rates, as well as a higher spare respiratory capacity, compared to F3 focus (Figure 1a,b). The higher basal OCR shown by F1 focus is reflected by the higher level of acidification, as shown by ECAR measurement, reported in Figure 1d. Both F1 and F3 ECAR was only slightly decreased upon oligomycin addition, while it increased following FCCP addition; however, the F1 ECAR increase was found to be much higher than F3 and remained high even after rotenone/antimycin addition, suggesting a significant contribution of glycolytic acidification. As shown in Figure 1c, the proton leak, measuring the amount of protons which are not used as proton motive force, was also found to be more consistent in F1 focus. As a consequence, in this focus electron transport is less efficiently coupled to ATP synthesis (20% uncoupling), as reported in Figure 1e. Despite mitochondria uncoupling, F1 higher basal respiration rate sustained a higher mitochondrial ATP production, compared to F3 focus (Figure 1c).
Mitochondrial membrane potential was measured through the green-fluorescent, lipophilic dye 3,3′-dihexyloxacarbocyanine iodide (DiOC6). As reported in Figure 2, in accordance with its higher mitochondrial ATP production and higher OCR, F1 focus showed a higher DiOC6 fluorescence, compared to F3 focus, indicating a more negative Δψ.

2.2. F1 Focus Shows Hyperactivated Glycolysis, TCA and Lactic Fermentation

The activities of a series of enzymes involved in sugar metabolism were assayed in both foci. The results are reported in Table 1: glyceraldehyde-3-phosphate dehydrogenase (GAPDH) was found to be more active in F1 focus than in F3; hexokinase (HK) and pyruvate kinase (PK), although showing a modest difference between the two foci, were also found reduced in F3 focus; moreover, both citrate synthase and malate dehydrogenase specific activities were significantly higher in F1 focus.
On the contrary, a significant increase in glutamate dehydrogenase activity was detected in F3, compared to F1 focus, while no differences between the two foci were observed in specific activities of malic enzyme, glucose-6-phosphate dehydrogenase (G6PDH) and NADP+-dependent isocitrate dehydrogenase. As shown in Figure 3a, lactate dehydrogenase (LDH) was also found more active in F1 focus, suggesting that glycolytic NADH production exceeds mitochondrial reoxidative capacity leading to fermentation. This is confirmed by the increase in lactate production, shown by F1 focus (Figure 3b).
To assess whether F1 focus metabolism is rewired into the Warburg effect, we investigated the expression of PKM2 isoform of pyruvate kinase, which is often expressed in cancer cells, as well as the expression of the PFKFB3 isoform of the bifunctional phosphofructokinase/fructose bisphosphatase (PFK/FBP) enzyme. PFKFB3 is endowed with a much higher kinase/phosphatase activity, compared to the normal enzyme, and allows cancer cells to maintain high glycolytic rates, by producing fructose 2,6-bisphosphate; the latter in turn activates phosphofructokinase activity of the bifunctional PFK1/FBP enzyme making it at the same time insensitive to ATP inhibition. As reported in Figure 4, Western blots showed that PKM2 was expressed in both foci, although at higher levels in F1 focus. This is well in accordance with a higher ATP production in F1 focus through oxidative phosphorylation than through glycolysis: in fact, PKM2 isoform is less active and allows the PEP phosphate group to be transferred to the active site of phosphoglyceromutase. This results in the net conversion of PEP into pyruvate, without ATP production.
The PFKFB3 isoform and glyceraldehyde-3-phosphate dehydrogenase (GAPDH) were also found to be expressed at a higher level in F1 focus than in F3 focus, accounting for F1 higher glycolytic flux.

2.3. F3 Focus Shows Impaired Oxidative Phosphorylation

Although F1 focus showed a higher mitochondrial ATP production, total intracellular ATP was found to be the same in both foci, as shown in Figure 3b, suggesting that F3 focus compensated for this with a higher ATP generation through substrate level phosphorylation. Both glycolysis and oxidative phosphorylation are less active in F3 focus, in accordance with its reduced proliferation, compared to F1, leading to a minor consume of ATP. This was confirmed by OCR and ECAR measurements through Seahorse glycolytic assay, reported in Figure 5; the Proton Efflux Rate (PER) was measured for each focus under different conditions. The results showed that, although basal PER was higher for F1 focus, F3 focus showed a higher basal glycolysis, as well as a higher compensatory glycolysis. Moreover, the acidification level dropped to lower values after glycolysis inhibition by 2-DG, confirming that F3 focus relies more on substrate level phosphorylation than on oxidative phosphorylation. Further confirmation comes from specific activity assays of glycolytic and TCA enzymes, reported in Table 1, showing that, while some TCA enzymes (such as pyruvate kinase, citrate synthase and malate dehydrogenase) were found to be less active in F3 focus; compared to F1, glutamate dehydrogenase activity was found to be significantly higher; this suggests that F3 focus may use TCA in an anaplerotic way.

2.4. F3 Focus Generates More ROS, but Less O2, Compared to F1 Focus

Total ROS content was assayed in each focus through cell-permeant 2′,7′-dichlorodihydrofluorescein diacetate (H2DCFDA), which is oxidized to DCF fluorescent probe; results, reported in Figure 6a,b, showed a higher ROS level in F3 focus. However, DHE fluorescent probe, more selective towards O2, showed that this ROS was more abundant in F1 focus, as reported in Figure 6c,d.
This is confirmed by investigation of mitochondrial ROS generation, using MitoSOX Red indicator, which reacts with superoxide, and by MitoPY1, detecting hydrogen peroxide; results showed no significant difference in mitochondrial O2 production between F1 and F3 foci (Figure 7a,b), while H2O2 production was found to be more elevated in F3 focus (Figure 7c,d).
These results were further confirmed by the activity assays of the enzymes involved in oxidative stress defense, reported in Table 2. Glutathione S-transferase and glutathione reductase specific activities were both found higher in F1 focus than in F3 focus, while glutathione peroxidase and catalase specific activities were more elevated in F3 focus. The level of SOD1 and SOD2 were similar in both foci. Glutathione assay showed that total glutathione level was significantly higher in F1 focus (Figure 8), with a GSH/GSSG close to 1 for both foci.

2.5. Mitochondria Morphology Analysis Shows Different Alterations in Each Focus

Confocal microscopy images of R123 stained cells from F1 and F3 foci were collected to investigate mitochondria morphology and intracellular distribution. The results are shown in Figure 9, together with images from healthy C3H cells, already described in a previous paper. As previously reported [18], mitochondria in C3H cells were found to be evenly distributed through the cytoplasm, extending from the nucleus to the cell periphery in a regular network (Figure 9a); their morphology was thin and filamentous (Figure 9a1), and their fluorescence intensity varied along the single mitochondrion, alternating regions of high and low fluorescence (Figure 9a2).
A different distribution and morphology were observed in F1 focus cells (Figure 9b), which showed tightly crowded mitochondria in the perinuclear region (Figure 9b1,b2). This mitochondrial crowding around the nucleus did not allow us to observe the detail of their morphology. At the cell periphery, patches of crowded mitochondria and rod-like shaped mitochondria were clearly observed, with short-fragmented organelles distributed in the whole cytoplasm (Figure 9b1,b2).
A different picture was seen for F3 focus (Figure 9c). In the cytoplasm, sparse mitochondria were organized in an irregular network and no crowding was observed in the perinuclear region, where few long filamentous mitochondria surrounded the cell nucleus. Mitochondria in these cells appeared to be generally thicker and longer than those in control cells (Figure 9c1,c2). A typical feature of these cells was the presence of mitochondria with very fluorescent and swollen tips (Figure 9c2), suggesting mitochondrial stress and a possible damage.
A quantitative analysis of mitochondria circularity and density of mitochondrial network, shown in Table 3, confirmed morphological data.

2.6. Autophagy Is Not Activated in Foci

Autophagy activation was also investigated, since previous data, obtained in our laboratory, showed that a 24 h treatment with CdCl2 can induce autophagy in C3H10T1/2Cl8 mouse embryonic fibroblasts (Oldani et al. 2020b); however, neither F1 nor F3 focus showed autophagy activation, as reported in Figure 10, showing no difference in AMPK phosphorylation. The LC3-I and LC3-II isoforms’ distribution was also assessed and the amount of LC3-II, the isoform associated to autophagosomes, was compared between the two foci, in order to evaluate autophagy induction [19]; no significant differences were observed between the two foci.

3. Discussion

In this work we compared two different foci, F1 and F3, obtained at the end of the CTA performed on C3H cells treated with CdCl2 for 24 h. The results showed that previously observed differences in their proliferative behavior [16] and gene dysregulation [12] are accompanied by metabolic differences. This in turn confirms that there are many targets for cadmium at the molecular level, eventually leading to malignant transformation.
In F1 focus, we observed higher glycolytic, TCA and oxidative phosphorylation rates compared to F3 focus, which are well in accordance with its higher proliferative rate supported by increased mitochondrial functionality. This is likely accomplished through a mitochondrial reorganization in a tightly crowded distribution around the nucleus, as shown by confocal microscopy analysis. A similar picture was previously observed in C3H cells treated with CdCl2 for 24 h [18]. However, all the NADH produced by Cd-treated C3H10T1/2Cl8 cells was efficiently reoxidized on the electron transport chain. In F1 focus, NADH production exceeds mitochondrial reoxidative capacity, so that NADH is partly reoxidized by LDH, producing lactate. Another interesting feature of F1 focus is the loss of the Pasteur effect: although most ATP is produced through oxidative phosphorylation, glycolysis is not inhibited. This is likely due to the overexpression of PFKFB3, which, unlike PFK1FBP, is not inhibited by ATP and citrate [20] and is endowed with a much higher ratio in kinase/phosphatase activity, allowing cells to maintain high glycolytic rates. F1 high glycolytic rate could also sustain other metabolic synthesis, through overexpression of PKM2 isoform, promoting PEP conversion into pyruvate without ATP synthesis. This could lead to the synthesis of many metabolites, essential to sustain high proliferation rates, and particularly to glutathione synthesis, which is in fact more abundant in F1 focus compared to F3. Glutamine is also required for glutathione synthesis and further experiments will assess whether this amino acid contributes to F1 high proliferation.
F3 focus relies mainly on glycolysis for its ATP request, although this pathway is on the whole less active than in F1 focus; NADH produced in the glycolytic pathway is reoxidized by LDH, but lactate production is lower than in F1 focus. The metabolic flux through glycolysis is reduced (as shown by lower PFKFB3, PKM2 and GAPDH expression), compared to F1 focus, justifying F3 lower proliferative rate.
F3 focus showed a higher accumulation of total ROS, with an increased production of mitochondrial H2O2, compared to F1 focus: this is well in accordance with higher specific activities of both glutathione peroxidase and catalase in F3 focus. ROS accumulation is also supported by the GSH/GSSG ratio close to 1, observed in both foci, while in healthy cells it normally ranges between 200:1 and 30:1 [21]. In particular, the increase in H2O2 production can be due to superoxide dismutation, reflecting in an increase in superoxide production in F3 focus as well. However, it could also be due to electron transfer impairment in F3 damaged mitochondria, as supported by confocal microscopy data and confirmed by Seahorse results. Mitochondrial damage is also supported by previous toxicogenomic data [12] obtained in our laboratory showing that 13 out of the 15 top up-regulated genes in F3 focus are involved in an interferon mediated inflammatory response, similar to that triggered by viral DNA and RNA [22]. Furthermore, the upregulation, in F3 focus, of TLR8 gene and IL-6 coding gene [12] suggests that mtRNA release from damaged mitochondria could be responsible for the observed inflammatory response. A similar result was previously observed in human monocytes, where viral RNA was detected by TLR8 resulting in IL-6 and TNF secretion [23]. The importance of inflammation in the process of carcinogenesis is widely recognized [24], indicating that damaged mitochondria-mediated inflammation could be one possible route to transformation. Overall, our data show that, although total ATP level is the same in both foci, F3 consumes less ATP, due to its low proliferation. Therefore, although glycolysis is less active in F3 focus than in F1, it is still sufficient to support its growth.
F1 focus showed a lower level of total ROS, but a higher production of O2 compared to F3 focus, although no significant differences were found in mitochondrial O2 levels. This is in accordance with the higher glutathione S-transferase and glutathione reductase specific activities detected in F1 focus, representing the defense against O2 accumulation, and is further confirmed by the higher level of reduced glutathione in this focus; a GSH/GSSG ratio close to 1 suggests that oxidative stress is high in this focus. The glutathione level is often increased in cancer cells, as a result of increased oxidative stress and glycolysis up-regulation, where it leads to faster growth rates and resistance to a number of chemotherapeutic agents [25]. Additionally, GSH has been shown to directly reduce O2 [26] and may therefore represent a defense mechanism against this ROS, in addition to SOD activity. This could also explain why neither SOD1 nor SOD2 is increased in F1 focus in order to detoxify O2.
Previous data obtained in our laboratory [18] showed that SOD1 activity is impaired by 24 h treatment with CdCl2, leading to an increased O2 level; however, toxicogenomic data showed that the SOD1 coding gene is not dysregulated by CdCl2 treatment neither in C3H cells [3] nor in human SH-SY5Y neuroblastoma cells [27]. In foci, we could not detect any impairment in SOD1 activity, suggesting that this enzyme inhibition is an early event caused by CdCl2 administration, far before the 4 to 6 weeks needed for the in vitro cell transformation. Finally, no autophagy activation was detected in the two foci, suggesting that the autophagy observed after cadmium administration for 24 h was part of the early mechanism of defense against this metal. By comparing data reported in this paper with those previously obtained on healthy C3H10T1/2Cl8 cells treated with CdCl2 for 24 h [18], we observed that each focus maintains some but not all the alterations observed in C3H10T1/2Cl8. This finding suggests that the different alterations did not originally occur in all treated cells, but that different cells reacted to CdCl2 exposure in different ways. In other words, although C3H cells are all genetically identical, much of their fate upon CdCl2 exposure depends on a plethora of microenvironmental, epigenetic and subcellular factors, such as, for example, local metallothioneins and GST expression and ROS defense enzyme activities.
Although in different ways, both F1 and F3 foci showed uncoordinated glycolysis, TCA and oxidative phosphorylation, each pathway working independently. This is likely a consequence of the loss of the Pasteur effect in F1 focus and of mitochondrial damage in F3 focus, each leading to cell transformation and foci formation.
CdCl2 toxicity is efficiently inactivated in most cells; however, a very small number of cells are damaged, in different ways. These cells proliferate in the absence of CdCl2, giving rise to foci after 4 to 6 weeks. Further research will address the question of how all these effects are irreversibly triggered by CdCl2 uptake, 4–6 weeks earlier than foci detection and collection.

4. Materials and Methods

4.1. Cell and Culture Conditions

The experiments were performed using the cells collected from cadmium-transformed foci obtained at the end of Cell Transformation Assays (CTAs) on C3H10T1/2 clone 8 mouse embryonic fibroblasts (cell line ATCC, CCL 226 lot. n. 58078542), as previously described [16]. This cell line was chosen for its high sensitivity to carcinogenic compounds, its low spontaneous transformation rates, and because it represents one of the three cell lines suggested in the Detailed Review Paper on Cell Transformation Assay to be used for detection of chemical carcinogens [14]. Cells with passages from 9 to 12 were used for cell transformation studies [14]. The CTA was carried out following cells exposure to 1 μM CdCl2 for 24 h; after that, the cadmium containing medium was substituted with a fresh medium without cadmium and the cells were grown for 6 weeks, until foci appeared [28]. Different foci were collected at the end of the CTAs, cultured and processed for further analyses, as described in the following sections. Among the different fully transformed foci, F1 and F3 foci were subjected to further analyses, since they were found to be very different, both morphologically and from the biochemical point of view. Cells were cultured in Basal Medium Eagle (BME, Sigma Chemical Co., St. Louis, MO, USA) enriched with 10% heat-inactivated fetal bovine serum (FBS, Euroclone, Pero, Italy), 1 % glutamine, 0.5% HEPES 2 M and 25 μg/mL gentamicin (all purchased from Sigma) at 37 °C in a humidified incubator supplied with a constant flow of 5% CO2 in air throughout each experiment. Cells were routinely seeded in 100 mm Ø cell culture Petri dishes, the medium was changed every 3 days and cells grown until 80% confluence maximum was reached. The cells were stored in ampoules, frozen at –80 °C with 10% sterile dimethyl sulfoxide (DMSO) as a preservative.

4.2. Cell Lysis and Preparation of Protein Samples

Cells from both F1 and F3 foci were harvested by trypsinization at 80% confluence, rinsed with ice-cold PBS and lysed in 50 mM Tris-HCl, pH 7.4, 150 mM NaCl, 5 mM EDTA, 10% glycerol, 1% NP40 buffer, containing 1 μM leupeptin, 2 μg/mL aprotinin, 1 μg/mL pepstatin and 1 mM phenylmethylsulfonyl fluoride (PMSF). After lysis on ice, homogenates were obtained by passing the cells 5 times through a blunt 20-gauge needle fitted to a syringe and then centrifuging at 15,000× g for 30 min at 4 °C. Enzyme activities were assayed on supernatants.
For cytosolic fraction, cells were rinsed with ice-cold PBS and lysed in PBS, containing 1 μM leupeptin, 2 μg/mL aprotinin, 1 μg/mL pepstatin and 1 mM PMSF; homogenates were obtained by passing the cells 5 times through a blunt 20-gauge needle fitted to a syringe, incubating on ice for 15 min and sonicating 2 times (10 s cycle). The supernatant was obtained by centrifugation at 15,000× g for 10 min at 4 °C and used to measure enzyme activities.
For mitochondrial fraction, cell lysate was centrifuged at 800× g for 5 min at 4 °C to remove nuclei and unbroken cells. The post-nuclear supernatant was centrifuged at 10,000× g for 15 min to collect mitochondria. After centrifugation, the supernatant was removed and pellets were resuspended in 50 mM Tris-HCl 50, pH 7.4, 150 mM NaCl, 5 mM EDTA, 10% glycerol, 1% NP40 buffer, containing 1 μM leupeptin, 2 μg/mL aprotinin, 1 μg/mL pepstatin and 1 mM PMSF and used to measure enzymatic activities. The cytosolic and mitochondrial fractions were analyzed through Western blot to confirm mitochondria isolation.

4.3. Cell Lysis and Preparation of Metabolite Samples

Both cell clones were harvested by trypsinization at 80% confluence; the pellets were resuspended in 3 mL PBS, harvested by a centrifugation in the above conditions, weighed, and resuspended with 5 volumes of 5% perchloric acid. The suspension was passed 5 times through a blunt 20-gauge needle fitted to a syringe, incubated on ice for 15 min and centrifuged at 3000× g at 4 °C for 10 min. The resulting supernatant was neutralized with 2.5 M K2CO3 to pH 6.5, centrifuged at 3000× g at 4 °C for 10 min to eliminate potassium perchlorate and kept at −80 °C for metabolite analyses.

4.4. Enzyme and Metabolite Assays

The enzymes and metabolites were assayed using the following procedures. All assays were performed in triplicate at 30 °C in a Cary3 Spectrophotometer and analyzed by the Cary Win UV application software for Windows. Enzymatic activities were expressed in international units and referred to protein concentration as determined by the Bradford method [29]. Metabolite concentrations were expressed in nmol/mg cells.
Hexokinase (HK) activity was determined by following NADPH formation at 340 nm by coupled assay with glucose-6-phosphate dehydrogenase (G6PDH) according to Bergmeyer [30]. The protein samples were incubated with 100 mM Tris-HCl pH 7.6, 1 mM ATP, 0.6 mM NADP+, 2 mM glucose, 10 mM MgCl2, 1 U/mL G6PDH.
In glyceraldeyde-3-phosphate dehydrogenase (GAPDH) assay was measured the disappearance of NADH at 340 nm according to Bergmeyer [30]. The protein samples were incubated with 80 mM HEPES-Tris pH 7.6, 6 mM glycerate 3-phosphate, 0.9 mM EDTA, 1.1 mM ATP, 0.2 mM NADH, 1.7 mM MgSO4, 15 U/mL phosphoglycerate kinase (PGK). In lactate dehydrogenase (LDH) assay was measured the disappearance of NADH at 340 nm according to Bergmeyer [30]. The protein samples were incubated with 85 mM potassium phosphate buffer, 0.2 mM NADH, 0.6 mM pyruvate. Pyruvate kinase (PK) activity was determined by following NADH disappearance at 340 nm by coupled assay with lactate dehydrogenase (LDH) according to Bergmeyer [30]. The protein samples were incubated with 50 mM HEPES-Tris pH 7.6, 75 mM KCl, 8 mM MgCl2, 0.2 mM NADH, 8 mM 2- phosphoenolpyruvate, 1.5 mM ADP, 9 U/mL LDH. In malate dehydrogenase (MDH) assay was measured the disappearance of NADH at 340 nm according to Bergmeyer [30]. The protein samples were incubated with 50 mM HEPES-Tris pH 7.6, 0.5 mM oxaloacetate, 0.2 mM NADH. In glutamate dehydrogenase (GLDH) assay was measured the disappearance of NADH at 340 nm according to Bergmeyer [30]. The protein samples were incubated with 50 mM HEPES-Tris pH 7.6, 100 mM NH4Cl, 0.2 mM NADH, 1 mM ADP, 1 mM EDTA, 7 mM 2-oxoglutarate. Glucose-6-phosphate dehydrogenase (G6PDH) activity was determined by following NADPH formation at 340 nm according to Bergmeyer [30]. The protein samples were incubated with Tris-HCl 90 mM, 7 mM MgCl2, 1 mM glucose-6-phosphate, 0.4 mM NADP+.
NADP+ dependent isocitrate dehydrogenase (ICDH) activity was determined by following NADPH formation at 340 nm according to Bergmeyer [30]. The protein samples were incubated with 50 mM HEPES-Tris pH 7.6, 4 mM MnCl2, 3.7 mM isocitrate, 0.32 mM NADP+. Malic enzyme (ME) activity was determined by following NADPH formation at 340 nm according to Bergmeyer [30]. The protein samples were incubated with 50 mM HEPES-Tris pH 7.6, 10 mM MgSO4, 4 mM malate, 0.5 mM NADP+. Citrate synthase (CS) was assayed according to Shepherd [31]. In detail, the protein samples were incubated with 100 mM Tris-HCl pH 8, 0.1 mM 5,5′- dithiobis-(2-nitrobenzoic acid), 0.05 mM acetyl-CoA and 0.25 mM oxaloacetate. The reaction was monitored at 412 nm. Catalase (CAT) activity was assayed according to Bergmeyer [32], using 12 mM H2O2 as substrate in the presence of 50 mM sodium phosphate buffer, pH 7.5. The reaction was monitored at 240 nm. Glutathione S-transferase (GST) was measured as reported in Habig [33], using 1 mM reduced glutathione (GSH) and 1 mM 1-chloro-2,4-dinitrobenzene (CDNB) as substrates in the presence of 90 mM potassium phosphate buffer pH 6.5. The reaction was monitored at 340 nm. The glutathione peroxidase (GPx) activity is based on the oxidation of GSH using H2O2 as substrate, coupled to the disappearance of NADPH by glutathione reductase (GR), according to Nakamura [34]. The protein samples were incubated with 50 mM sodium phosphate buffer pH 7.5, 0.16 mM NADPH, 1 mM NaN3, 0.4 mM EDTA, 1 mM GSH, 0.2 mM H2O2, 2 U/mL GR.
Glutathione reductase (GR) was measured following the disappearance of NADPH at 340 nm according to Wang [35]. The protein samples were incubated with 100 mM potassium phosphate buffer pH 7.6, 0.16 mM NADPH, 1 mM EDTA, 1mg/mL BSA, 4.6 mM oxidized glutathione (GSSG). Superoxide dismutase 1 (SOD1) and superoxide dismutase 2 (SOD2) were measured using an indirect method according to Vance [36]. This technique is based on the ability of superoxide dismutase to compete with ferricytochrome c for superoxide anions generated by the xanthine oxidase system and thus to inhibit the reduction of ferricytochrome c. Briefly, the protein samples were incubated with 0.01 mM ferricytochrome c in 10 mM HEPES-Tris pH 7.5, 0.1 mM EDTA, 0.01 mM xanthine in 1 mM NaOH and xanthine oxidase at final concentration of 0.006 U/mL. Under these conditions, one unit of SOD is the amount of enzyme able to yield a 50% decrease in the rate of ferricytochrome c reduction followed at 550 nm.
Lactate and total intracellular ATP were measured using standard enzymatic tests [30]. In detail, lactate was measured following NADH formation in the presence of 380 mM Tris-Glycine pH 9, 2.6 mM NAD+, 15 U/mL lactate dehydrogenase; ATP was measured following NADPH formation in the presence of 25 mM HEPES-Tris pH 7.6, 3.3 mM MgCl2, 0.23 mM NADP+, 17 mM glucose, 0.23 U/mL G6PDH, 0.46 U/mL HK.

4.5. GSH Assay

Both foci were harvested by trypsinization at 80% confluence; the pellets were washed in 3 mL PBS, harvested by a centrifugation and weighed to normalize the results to mg of cells. Pellets were resuspended in 500 μL cold 5% 5-sulfosalicylic acid (SSA), lysed by vortexing and by passing through a blunt 20-gauge needle fitted to a syringe 5 times. All the samples were incubated for 10 min at 4 °C and then centrifuged at 14,000× g for 10 min at 4 °C. The supernatant was prepared and used for the analysis following the instructions of Glutathione Colorimetric Detection Kit (catalog number EIAGSHC, Invitrogen, Carlsbad, CA, USA). The Kit is designed to measure oxidized glutathione (GSSG), total glutathione (GSH tot) and reduced glutathione (GSH tot—GSSG) concentrations through enzymatic recycling assay based on glutathione reductase and reduction of Ellman reagent (5,5-dithiobis(2-nitrobenzoic acid)) and using 2-vinylpyridine as reagent for the derivatization of glutathione [37]. Therefore, it was possible to obtain GSH/GSSG ratio, a critical indicator of cell health. The absorbance was measured at 405 nm using a micro plate reader. The values of absorbance were compared to standard curves (GSH tot and GSSG, respectively) and normalized to mg of cells. Final concentrations were expressed in nmol/mg cells.

4.6. SDS-PAGE and Western Blotting

For sample preparation for Western-blot analysis, both cell clones were harvested by trypsinization at 80% confluence. The cells were then rinsed with ice-cold PBS and lysed in RIPA buffer (50 mM Tris-HCl pH 7.5, 150 mM NaCl, 1% NP-40, 0.5% sodium deoxycholate, 0.1% SDS) containing 1 μM leupeptin, 2 μg/mL aprotinin, 1 μg/mL pepstatin, 1 mM PMSF and phosphatase inhibitors. After lysis on ice, homogenates were obtained by passing them through a blunt 20-gauge needle fitted to a syringe 5 times; they were then centrifuged at 15,000× g for 30 min. Supernatants were analyzed for protein content by the BCA protein assay [38]. SDS-PAGE and Western blot were carried out by standard procedures [39]. Sixty micrograms of proteins were separated on a 10% or 15% acrylamide/bis-acrylamide SDS-PAGE, transferred onto a nitrocellulose membrane (Millipore, Billerica, MA, USA), probed with the appropriated antibodies and visualized using ECL detection system (Millipore). Protein levels were quantified by densitometry of immunoblots using Scion Image software (Scion Corp., Frederick, MD, USA). The following primary antibodies were used (all purchased by Cell Signaling Technology, Danvers, MA, USA): anti-PKM2 (catalog number #4053, dilution 1:1000), anti-PFKFB3 (catalog number #13123, dilution 1:1000), anti P-AMPK (Thr172) (catalog number #2535, dilution 1:1000), anti-AMPK (catalog number #2532, dilution 1:1000), anti- LC3B (catalog number #2775, dilution 1:500), anti-GAPDH (catalog number #2118, dilution 1:10,000), anti-tubulin (catalog number #2125S, dilution 1:1000) (all purchased by Cell Signaling Technology, Danvers, MA, USA) and anti-vinculin (catalog number #V9131, dilution 1:10,000) (purchased by Sigma Chemical Co., St. Louis, MO, USA). IgG HRP anti-rabbit (catalog number #7074) and anti-mouse (catalog number #7076) conjugated secondary antibodies (purchased by Cell Signaling Technology, Danvers, MA, USA) were diluted 1:10,000.

4.7. Detection of Intracellular Reactive Oxygen Species

The generation of intracellular reactive oxygen species (ROS) was detected by the oxidation of 2′,7′-Dichlorofluorescin diacetate (H2DCFDA) or Dihydroethidium (DHE). H2DCFDA is an indicator for both reactive oxygen species and nitric oxide (•NO); the second probe is more selective towards superoxide anion (O2). The cells were plated at a density of 2.5 × 10⁵ cells per well into six-well plates in 2 mL of complete culture medium and incubated 24 h after seeding with H2DCFDA (5 μΜ final concentration in PBS) or DHE (10 μΜ final concentration in complete medium) for 20 min in the dark at 37 °C. At the end of incubation, cells were washed by warm PBS, trypsinized (500 μL of trypsin/well) and harvested by centrifugation (5 min at 2000× g) at room temperature. The pellet was resuspended in 500 μL/tube of PBS and ROS generation of 10,000 cells was measured by the fluorescence intensity. FL-1 channel (530 nm) was utilized to detect the fluorescence intensity of DCF; HE fluorescence can be measured at 585 nm, or FL-2 channel, band-pass filter. Logarithmic amplification, which produces an output signal proportional to the logarithm of the input signal, was used to detect probe fluorescence. Data quality is enhanced when the brightness levels of all probes excited off a single laser are balanced within one log scale of fluorescence intensity [40]. Flow cytometry data were analyzed using CytExpert 2.3 Software (Beckman Coulter, Inc., Brea, CA, USA).

4.8. Detection of Mitochondrial ROS (mtROS)

MitoSOX ™ Red (ThermoFisher Scientific, Massachusetts, USA) and MitoPY1 (Tocris Bioscience, Bristol, UK) indicators were used to detect the mitochondrial superoxide anion and mitochondrial hydrogen peroxide production, respectively, in intact adherent cells. The oxidation of these probes forms intermediate probe-derived radicals that are successively oxidized to generate the corresponding fluorescent products [41]. The cells were plated at a density of 2.5 × 10⁵ cells per well into six-well plates in 2 mL of complete culture medium and stained 24 h after seeding with MitoSOX™ Red or MitoPY1 (5 μΜ final concentration in 1 mL of PBS) for 20 min in the dark at 37 °C. After staining, the cells were washed by warm PBS, trypsinized (500 μL of trypsin /well) and harvested by centrifugation (5 min at 2000× g) at room temperature. The pellet was resuspended in 500 μL/tube of PBS and mtROS generation of 10,000 cells was measured by the fluorescence intensity. FL-1 channel (530 nm) was utilized to detect the fluorescence intensity of MitoPY1; FL-2 channel (585 nm) band-pass filter was utilized to measure the fluorescence intensity of MitoSOX ™ Red. Logarithmic amplification, which produces an output signal proportional to the logarithm of the input signal, was used to detect probe fluorescence. Data quality is enhanced when the brightness levels of all probes excited off a single laser are balanced within one log scale of fluorescence intensity [40]. Flow cytometry data were analyzed using CytExpert 2.3 Software (Beckman Coulter, Inc., Brea, CA, USA).

4.9. Mitochondrial Transmembrane Potential (MTP) Assay

MTP alterations were assessed by flow cytometry, using the mitochondrial potential sensitive dye 3,3′-dihexyloxacarbocyanine Iodide (DiOC6), which accumulates in mitochondria due to their negative membrane potential and can be applied to monitor the mitochondrial membrane potential using flow cytometry detection. The cells were plated at a density of 2.5 × 10⁵ cells per well into six-well plates in 2 mL of complete culture medium, harvested 24 h after seeding by centrifugation (5 min at 2000× g) at room temperature and stained with DiOC6 (40 nM in PBS, 20 min at 37 °C and 5% CO2 in the dark). Loss in DiOC6 fluorescence indicates disruption of the mitochondrial inner transmembrane potential. The probe was excited at 488 nm and emission was measured through a 530 nm (FL-1 channel) band-pass filter. Logarithmic amplification, which produces an output signal proportional to the logarithm of the input signal, was used to detect probe fluorescence. Data quality is enhanced when the brightness levels of all probes excited off a single laser are balanced within one log scale of fluorescence intensity [40]. Flow cytometry data were analyzed using CytExpert 2.3 Software (Beckman Coulter, Inc., Brea, CA, USA).

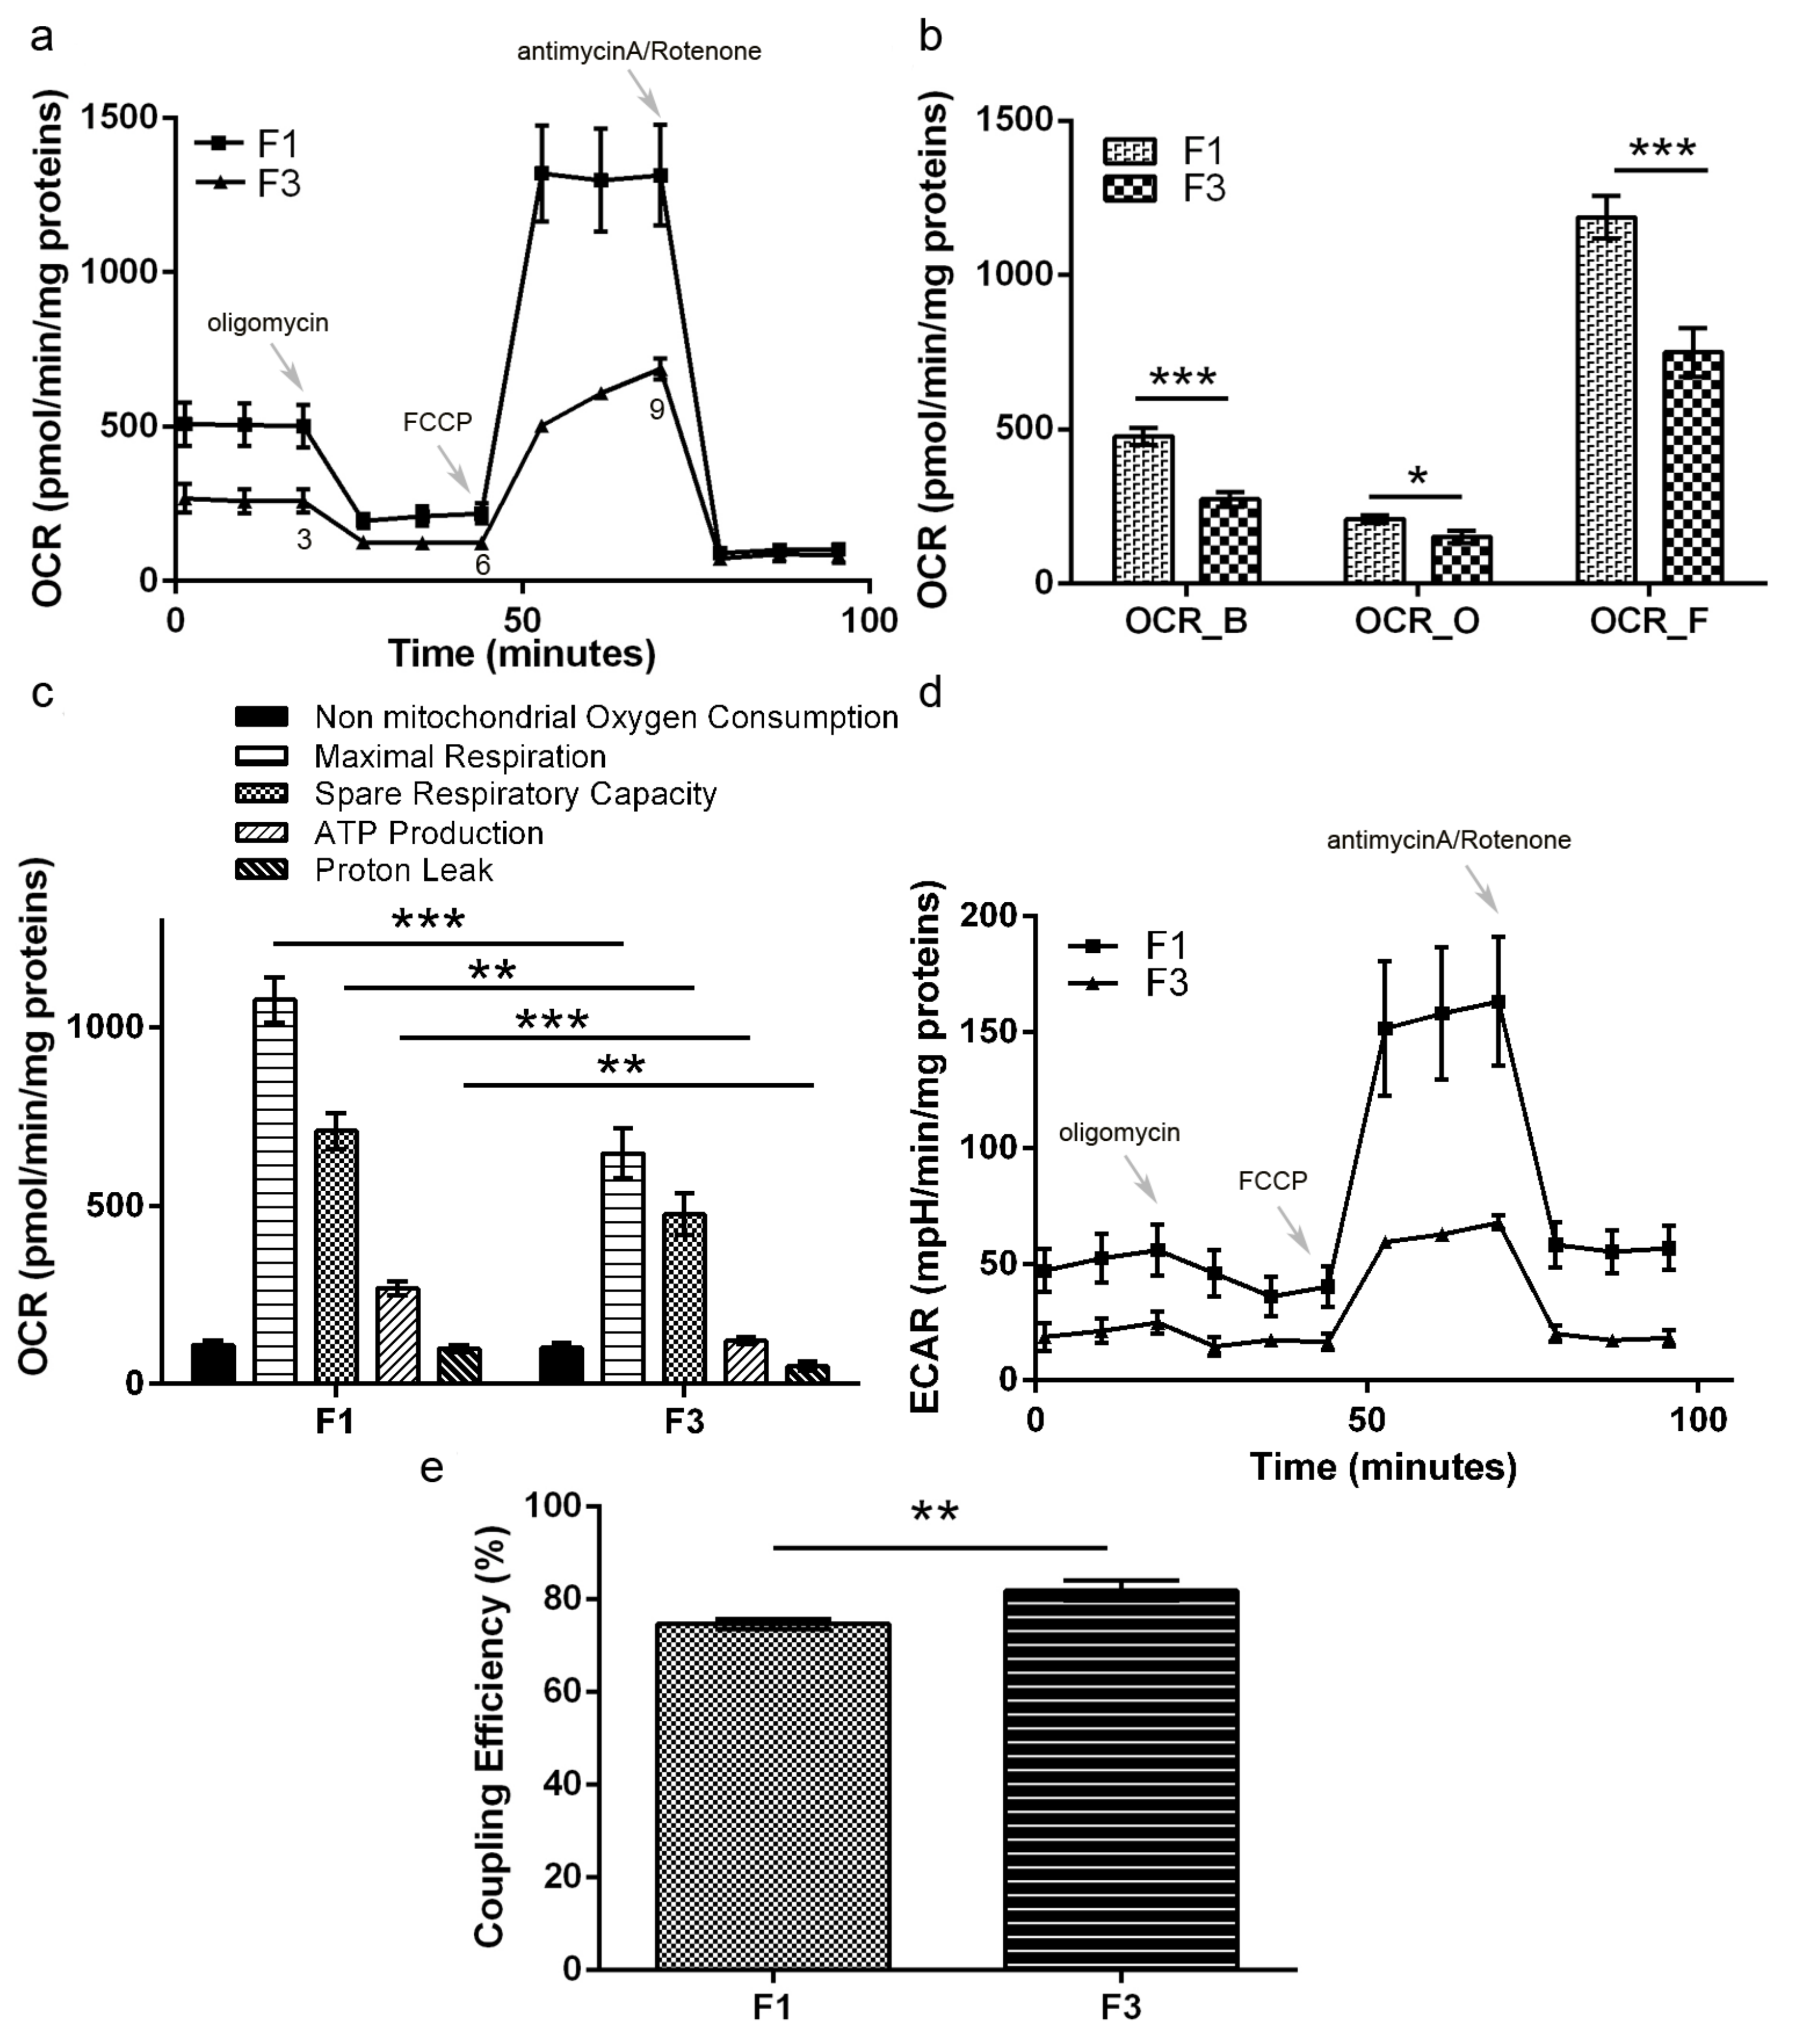
4.10. Oxygen Consumption Rate and Extra-Cellular Acidification Rate Measurements

Oxygen consumption rate (OCR) and extra-cellular acidification rate (ECAR) were measured in F1 and F3 foci with Seahorse XFe24 Analyzer (Seahorse Bioscience, Billerica, MA, USA) using Seahorse XF Cell Mito Stress Test Kit (catalog number #103015-100, purchased by Agilent Technologies, Santa Clara, CA, USA) and Agilent Seahorse XF Glycolytic Rate Assay Kit (catalog number #103344-100, purchased by Agilent Technologies, Santa Clara, CA, USA). The cells were seeded in Agilent Seahorse XF24 cell culture microplates at density of 3 × 10⁴ cells/well in 250 μL of Basal Medium Eagle and 24 h after seeding the growth medium was replaced with 525 μL/well of Seahorse XF Base Medium containing 1 mM pyruvate, 2 mM glutamine and 10 mM glucose for the Cell Mito Stress Test Kit or 1 mM pyruvate, 2 mM glutamine, 10 mM glucose and 5 mM HEPES for the Glycolytic Rate Assay Kit. Then, the plate was incubated into 37 °C non-CO2 incubator for 1 h, before starting the experiment procedure.
The sensor cartridge was calibrated by Seahorse XFe24 Analyzer. Pre-warmed oligomycin, FCCP, rotenone and antimycin A were loaded into injector ports A, B and C of sensor cartridge, to reach working concentration of 1 μM, 2 μM and 0.5 μM, respectively, for the Cell Mito Stress Test Kit.
Pre-warmed rotenone and antimycin A and 2-deoxy-D-glucose (2-DG) were loaded into injector ports A and B of sensor cartridge, to reach working concentration of 0.5 μM and 50 mM for the Glycolytic Rate Assay Kit.
OCR and ECAR were detected under basal conditions followed by the sequential addition of the drugs, to measure non-mitochondrial respiration, maximal respiration, proton leak, ATP respiration, respiratory capacity, coupling efficiency for the Cell Mito Stress Test Kit and basal glycolysis, basal proton efflux rate, compensatory glycolysis and post 2-DG acidification for the Glycolytic Rate Assay Kit [42,43,44]. After assay performance, cells were lysed and the total cellular proteins were quantified using Bradford method [29] in order to normalize the data.

4.11. Confocal Microscopy

Mitochondria fluorescence was studied by laser scanning confocal microscopy, using a Bio-Rad MRC-600 confocal microscope (Bio-Rad, Hemel Hempstead, UK) equipped with a 25 mW argon laser. The scanning head was coupled with an upright epifluorescence microscope Nikon Optiphot-2 (Nikon, Tokyo, Japan) with a 60× oil immersion objective Nikon Planapochromat (N.A. = 1.4). The fluorescence was excited at 488 nm and the emission was collected through a long pass filter above 515 nm. High sensitivity photon counting detection was used to minimize the excitation power (0.1 mW at the entry of the optical head) and preserve cell viability.
The cells were plated in 35 mm Ø Petri dishes at density of 6 × 10⁴ cells/well and 24 h after seeding the medium was removed, the cells were washed twice with phosphate buffer saline (PBS) and incubated for 10 min in 1 μM rhodamine 123 (R123) solution at 37 °C and 5% CO2. After incubation, the cells were rinsed twice with PBS and few microliters of PBS were left in the Petri dish to avoid cell drying. A coverslip was placed over the cells that were immediately imaged by confocal microscope.
To measure mitochondrial interconnectivity and elongation from confocal microscope images we used the macro designed by Dagda and colleagues [45].

4.12. Statistical Analysis

The data were tested by Student’s t-test. All calculations were conducted using the R statistics programming environment [46].

Author Contributions

Conceptualization, C.U., P.F. and M.F.; validation, M.F.; formal analysis, M.O.; investigation, M.O., M.M., A.M.V. and P.M.; resources, P.P., E.M., C.U. and P.F.; data curation, M.O.; writing—original draft preparation, A.M.V., C.U., P.F. and M.F.; writing—review and editing, M.O., M.M., A.M.V., P.P., E.M., C.U., P.F. and M.F.; supervision, M.F.; funding acquisition, C.U. and P.F. All authors have read and agreed to the published version of the manuscript.

Funding

This research was funded by the University of Milano-Bicocca (grants 2017-ATE-0335 to CU and 2017-ATE-0273 to PF).

Conflicts of Interest

The authors declare no conflict of interest.

References

  1. Järup, L.; Åkesson, A. Current status of cadmium as an environmental health problem. Toxicol. Appl. Pharmacol. 2009, 238, 201–208. [Google Scholar] [CrossRef]
  2. Strasdeit, H. The First Cadmium-Specific Enzyme. Angew. Chem. Int. Ed. Engl. 2001, 40, 707–709. [Google Scholar] [CrossRef]
  3. Callegaro, G.; Forcella, M.; Melchioretto, P.; Frattini, A.; Gribaldo, L.; Fusi, P.; Fabbri, M.; Urani, C. Toxicogenomics applied to in vitro Cell Transformation Assay reveals mechanisms of early response to cadmium. Toxicol. Vitr. 2018, 48, 232–243. [Google Scholar] [CrossRef] [PubMed]
  4. Choong, G.; Liu, Y.; Templeton, D.M. Interplay of calcium and cadmium in mediating cadmium toxicity. Chem. Biol. Interact. 2014, 211, 54–65. [Google Scholar] [CrossRef] [PubMed]
  5. Thevenod, F. Catch me if you can! Novel aspects of cadmium transport in mammalian cells. Biometals 2010, 23, 857–875. [Google Scholar] [CrossRef]
  6. Urani, C.; Melchioretto, P.; Bruschi, M.; Fabbri, M.; Sacco, M.G.; Gribaldo, L. Impact of Cadmium on Intracellular Zinc Levels in HepG2 Cells: Quantitative Evaluations and Molecular Effects. BioMed Res. Int. 2015, 2015, 949514. [Google Scholar] [CrossRef]
  7. Martelli, A.; Rousselet, E.; Dycke, C.; Bouron, A.; Moulis, J.M. Cadmium toxicity in animal cells by interference with essential metals. Biochimie 2006, 88, 1807–1814. [Google Scholar] [CrossRef]
  8. Hartwig, A.; Asmuss, M.; Blessing, H.; Hoffmann, S.; Jahnke, G.; Khandelwal, S.; Pelzer, A.; Burkle, A. Interference by toxic metal ions with zinc-dependent proteins involved in maintaining genomic stability. Food Chem. Toxicol. 2002, 40, 1179–1184. [Google Scholar] [CrossRef]
  9. Landolph, J.R. Chemical Transformation in C3H 10T1/2 Cl 8 Mouse Embryo Fibroblasts: Historical Background, Assessment of the Transformation Assay, and Evolution and Optimization of the Transformation Assay Protocol; IARC Scientific Publications: Lyon, France, 1985; Volume 67, pp. 185–203. [Google Scholar]
  10. Combes, R.D. Cell transformation assays: Are we barking up the wrong tree? Altern. Lab. Anim. 2012, 40, 115–130. [Google Scholar] [CrossRef]
  11. Corvi, R.; Vanparys, P. International prevalidation study on cell transformation assay. Preface. Mutat. Res. 2012, 744, 1–2. [Google Scholar] [CrossRef]
  12. Oldani, M.; Fabbri, M.; Melchioretto, P.; Callegaro, G.; Fusi, P.; Gribaldo, L.; Forcella, M.; Urani, C. In vitro and bioinformatics mechanistic-based approach for cadmium carcinogenicity understanding. Toxicol. Vitr. 2020, 65, 104757. [Google Scholar] [CrossRef] [PubMed]
  13. Vanparys, P.; Corvi, R.; Aardema, M.J.; Gribaldo, L.; Hayashi, M.; Hoffmann, S.; Schechtman, L. Application of in vitro cell transformation assays in regulatory toxicology for pharmaceuticals, chemicals, food products and cosmetics. Mutat. Res. 2012, 744, 111–116. [Google Scholar] [CrossRef] [PubMed]
  14. OECD. Detailed Review Paper on Cell Transformation Assays for Detection of Chemical Carcinogens; Series on Testing and Assessment; OECD: Paris, France, 2007; pp. 1–164. [Google Scholar]
  15. Reznikoff, C.A.; Brankow, D.W.; Heidelberger, C. Establishment and characterization of a cloned line of C3H mouse embryo cells sensitive to postconfluence inhibition of division. Cancer Res. 1973, 33, 3231–3238. [Google Scholar] [PubMed]
  16. Forcella, M.; Callegaro, G.; Melchioretto, P.; Gribaldo, L.; Frattini, M.; Stefanini, F.M.; Fusi, P.; Urani, C. Cadmium-transformed cells in the in vitro cell transformation assay reveal different proliferative behaviours and activated pathways. Toxicol. Vitr. 2016, 36, 71–80. [Google Scholar] [CrossRef] [PubMed]
  17. Wang, Y.; Liu, H.H.; Cao, Y.T.; Zhang, L.L.; Huang, F.; Yi, C. The Role of Mitochondrial Dynamics and Mitophagy in Carcinogenesis, Metastasis and Therapy. Front. Cell Dev. Biol. 2020, 8, 1–12. [Google Scholar] [CrossRef] [PubMed]
  18. Oldani, M.; Manzoni, M.; Villa, A.M.; Stefanini, F.M.; Melchioretto, P.; Monti, E.; Forcella, M.; Urani, C.; Fusi, P. Cadmium elicits alterations in mitochondrial morphology and functionality in C3H10T1/2Cl8 mouse embryonic fibroblasts. Biochim. Biophys. Acta Gen. Subj. 2020, 1864, 129568. [Google Scholar] [CrossRef]
  19. Mizushima, N.; Yoshimori, T. How to interpret LC3 immunoblotting. Autophagy 2007, 3, 542–545. [Google Scholar] [CrossRef]
  20. Kim, A. Mitochondria in Cancer Energy Metabolism: Culprits or Bystanders? Toxicol. Res. 2015, 31, 323–330. [Google Scholar] [CrossRef] [Green Version]
  21. Zitka, O.; Skalickova, S.; Gumulec, J.; Masarik, M.; Adam, V.; Hubalek, J.; Trnkova, L.; Kruseova, J.; Eckschlager, T.; Kizek, R. Redox status expressed as GSH:GSSG ratio as a marker for oxidative stress in paediatric tumour patients. Oncol. Lett. 2012, 4, 1247–1253. [Google Scholar] [CrossRef] [Green Version]
  22. Grazioli, S.; Pugin, J. Mitochondrial Damage-Associated Molecular Patterns: From Inflammatory Signaling to Human Diseases. Front. Immunol. 2018, 9, 832. [Google Scholar] [CrossRef]
  23. West, A.P. Mitochondrial dysfunction as a trigger of innate immune responses and inflammation. Toxicology 2017, 391, 54–63. [Google Scholar] [CrossRef]
  24. Suarez-Carmona, M.; Lesage, J.; Cataldo, D.; Gilles, C. EMT and inflammation: Inseparable actors of cancer progression. Mol. Oncol. 2017, 11, 805–823. [Google Scholar] [CrossRef]
  25. Lewis, C.A.; Parker, S.J.; Fiske, B.P.; McCloskey, D.; Gui, D.Y.; Green, C.R.; Vokes, N.I.; Feist, A.M.; Vander Heiden, M.G.; Metallo, C.M. Tracing compartmentalized NADPH metabolism in the cytosol and mitochondria of mammalian cells. Mol. Cell 2014, 55, 253–263. [Google Scholar] [CrossRef] [Green Version]
  26. Winterbourn, C.C.; Metodiewa, D. The reaction of superoxide with reduced glutathione. Arch. Biochem. Biophys. 1994, 314, 284–290. [Google Scholar] [CrossRef] [PubMed]
  27. Forcella, M.; Lau, P.; Oldani, M.; Melchioretto, P.; Bogni, A.; Gribaldo, L.; Fusi, P.; Urani, C. Neuronal specific and non-specific responses to cadmium possibly involved in neurodegeneration: A toxicogenomics study in a human neuronal cell model. Neurotoxicology 2020, 76, 162–173. [Google Scholar] [CrossRef] [PubMed]
  28. Urani, C.; Stefanini, F.M.; Bussinelli, L.; Melchioretto, P.; Crosta, G.F. Image analysis and automatic classification of transformed foci. J. Microsc. 2009, 234, 269–279. [Google Scholar] [CrossRef]
  29. Bradford, M.M. A rapid and sensitive method for the quantitation of microgram quantities of protein utilizing the principle of protein-dye binding. Anal. Biochem. 1976, 72, 248–254. [Google Scholar] [CrossRef]
  30. Bergmeyer, H.U.; Gaweh, K.G.M. Enzymes as biochemical reagents. In Methods of Enzymatic Analysis; Bergmeyer, H.U., Ed.; Academic Press: New York, NY, USA, 1974; Volume 1, pp. 427–522. [Google Scholar]
  31. Shepherd, D.; Garland, P.B. The kinetic properties of citrate synthase from rat liver mitochondria. Biochem. J. 1969, 114, 597–610. [Google Scholar] [CrossRef] [Green Version]
  32. Bergmeyer, H.U.; Gaweh, K.G.M. Enzymes. Catalase. In Methods of Enzymatic Analysis; Bergmeyer, H.U., Ed.; Academic Press: NewYork, NY, USA, 1983; Volume 2, pp. 165–166. [Google Scholar]
  33. Habig, W.H.; Pabst, M.J.; Jakoby, W.B. Glutathione S-transferases. The first enzymatic step in mercapturic acid formation. J. Biol. Chem. 1974, 249, 7130–7139. [Google Scholar] [CrossRef]
  34. Nakamura, W.; Hayashi, K.H.S. Purification and properties of rat liver glutathione peroxidase. Biochim. Biophys. Acta 1974, 358, 251–261. [Google Scholar] [CrossRef]
  35. Wang, Y.; Oberley, L.W.; Murhammer, D.W. Antioxidant defense systems of two lipidopteran insect cell lines. Free Radic. Biol. Med. 2001, 30, 1254–1262. [Google Scholar] [CrossRef]
  36. Vance, P.G.; Keele, B.B., Jr.; Rajagopalan, K.V. Superoxide dismutase from Streptococcus mutans. Isolation and characterization of two forms of the enzyme. J. Biol. Chem. 1972, 247, 4782–4786. [Google Scholar] [CrossRef]
  37. Griffith, O.W. Determination of glutathione and glutathione disulfide using glutathione reductase and 2-vinylpyridine. Anal. Biochem. 1980, 106, 207–212. [Google Scholar] [CrossRef]
  38. Smith, P.K.; Krohn, R.I.; Hermanson, G.T.; Mallia, A.K.; Gartner, F.H.; Provenzano, M.D. Measurement of protein using bicinchoninic acid. Anal. Biochem. 1985, 150, 76–85. [Google Scholar] [CrossRef]
  39. Laemmli, U.K. Cleavage of structural proteins during the assembly of the head of bacteriophage T4. Nature 1970, 227, 680–685. [Google Scholar] [CrossRef] [PubMed]
  40. Gandler, W.; Shapiro, H. Logarithmic amplifiers. Cytometry 1990, 11, 447–450. [Google Scholar] [CrossRef]
  41. Winterbourn, C.C. The challenges of using fluorescent probes to detect and quantify specific reactive oxygen species in living cells. Biochim. Biophys. Acta Gen. Subj. 2014, 1840, 730–738. [Google Scholar] [CrossRef]
  42. Invernizzi, F.; D’Amato, I.; Jensen, P.B.; Ravaglia, S.; Zeviani, M.; Tiranti, V. Microscale oxygraphy reveals OXPHOS impairment in MRC mutant cells. Mitochondrion 2012, 12, 328–335. [Google Scholar] [CrossRef]
  43. Sonntag, K.C.; Ryu, W.I.; Amirault, K.M.; Healy, R.A.; Siegel, A.J.; McPhie, D.L.; Forester, B.; Cohen, B.M. Late-onset Alzheimer’s disease is associated with inherent changes in bioenergetics profiles. Sci. Rep. 2017, 7, 1–13. [Google Scholar] [CrossRef] [Green Version]
  44. Tan, B.; Xiao, H.; Li, F.; Zeng, L.; Yin, Y. The profiles of mitochondrial respiration and glycolysis using extracellular flux analysis in porcine enterocyte IPEC-J2. Anim. Nutr. 2015, 1, 239–243. [Google Scholar] [CrossRef]
  45. Dagda, R.K.; Cherra, S.J., 3rd; Kulich, S.M.; Tandon, A.; Park, D.; Chu, C.T. Loss of PINK1 function promotes mitophagy through effects on oxidative stress and mitochondrial fission. J. Biol. Chem. 2009, 284, 13843–13855. [Google Scholar] [CrossRef] [Green Version]
  46. Team, R.C. R: A Language and Environment for Statistical Computing; R Foundation for Statistical Computing: Vienna, Austria, 2008. [Google Scholar]
Figure 1. Seahorse Mitostress analysis. (a) OCR traces, expressed as pmoles O2/min/mg proteins in F1 and F3 foci. The arrows indicate the addition time of oligomycin, FCCP and antimycin A/rotenone. The OCR profile is representative of three independent experiments. (b) The values at points 3, 6, 9 of OCR profile in panel (a) reflect OCR_B (basal), OCR_O (oligomycin) and OCR_F (FCCP). (c) Analysis of different parameters related with mitochondrial function. (d) ECAR traces, expressed as mpH/min/mg proteins, in F1 and F3 foci. The ECAR profile is representative of three independent experiments. (e) Coupling efficiency. Bars indicate the mean ± SEM obtained in three independent experiments. Statistical significance: * p < 0.05, ** p < 0.01, *** p < 0.001 (Student’s t-test).
Ijms 22 10837 g001
Figure 2. Flow cytometry analysis of Δψ in F1 and F3 foci. (a) After incubation with DiOC6 the level of cells fluorescence was measured. The results are shown in a dot plot overlay, representative of three independent experiments. (b) The fluorescence intensity of all experiments is represented by a box plot. The dark line within the box represents the median value, while the upper and lower sides of the box are the third and first quartiles, respectively. Statistical significance: * p < 0.05 (Student’s t-test).
Ijms 22 10837 g002
Figure 3. (a) Lactate dehydrogenase activity analysis in F1 and F3 foci. Results are expressed as U/mg. (b) ATP and lactate level in F1 and F3 foci. Results are expressed in nmol and normalized with respect to mg of cells. All results are shown as mean ± SEM obtained in three independent experiments. Statistical significance: * p < 0.05, *** p < 0.001 (Student’s t-test).
Ijms 22 10837 g003
Figure 4. (a) Representative Western-blot analysis performed on crude extracts, using anti-PKM2, anti-PFKFB3 and anti-GAPDH antibodies. Vinculin was used as loading control. The experiments were performed in triplicate. (b) Densitometric analysis was performed with Scion Image Software. Values are presented as means ± SEM. Statistical significance: * p < 0.05 (Student’s t-test).
Ijms 22 10837 g004
Figure 5. Seahorse glycolytic analysis in F1 and F3 foci. Analysis of different parameters related with glycolysis. Bars indicate the mean ± SEM obtained in three independent experiments. Statistical significance: * p < 0.05 (Student’s t-test).
Ijms 22 10837 g005
Figure 6. Flow cytometry analysis of ROS and superoxide anion production in F1 and F3 foci. After incubation with H2DCFDA or DHE the level of cells fluorescence was measured. Results are shown in a dot plot overlay, representative of three independent experiments (ac). The fluorescence intensity of all experiments is represented by a box plot (bd). The dark line within the box represents the median value, while the upper and lower sides of the box are the third and first quartiles, respectively. Statistical significance: * p < 0.05 (Student’s t-test).
Ijms 22 10837 g006
Figure 7. Flow cytometry analysis of mitochondrial superoxide anion and H2O2 production in F1 and F3 foci. After incubation with MitoSOX ™ Red or MitoPY1, the level of cells fluorescence was measured. Results are shown in a dot plot overlay, representative of three independent experiments (ac). The fluorescence intensity of all experiments is represented by a box plot (bd). The dark line within a box represents the median value, while the upper and lower sides of the boxes are the third and first quartiles, respectively. Statistical significance: ** p < 0.01 (Student’s t-test).
Ijms 22 10837 g007
Figure 8. Glutathione level in F1 and F3 foci. Results are expressed in nmol/mg and normalized with respect to mg of cells. Statistical significance: * p < 0.05, ** p < 0.01 (Student’s t-test).
Ijms 22 10837 g008
Figure 9. Representative mitochondrial confocal images of: (a) Healthy C3H10T1/2Cl8 cells; enlarged views: (a1) thin and filamentous mitochondria are evenly distributed in the whole cytoplasm; (a2) fluorescence is not uniform along single mitochondria showing regions with higher intensity (arrowheads). (b) Focus F1 cells; enlarged views: (b1) crowded mitochondria in the perinuclear region (arrowheads); (b2) short fragmented organelles are observed in the cytoplasm (arrows), where patches of crowded mitochondria are also seen (arrowheads). (c) Focus F3 cells; enlarged views: (c1) mitochondria are organized in an irregular network (arrows) and long filamentous mitochondria surround the cell nucleus (arrowheads); (c2) mitochondria appear thicker than those in control cells. The tips of mitochondria are often very fluorescent and swollen (arrowheads).
Ijms 22 10837 g009
Figure 10. Autophagy evaluation in F1 and F3 foci. (a) Representative Western blot analysis performed on crude extracts, using anti-P-AMPK, anti-AMPK tot and anti-LC3B antibodies. Tubulin and Vinculin were used as loading control. (b) Densitometric analysis was performed with Scion Image Software. The results are expressed as P-AMPK/AMPK tot and LC3II/LC3I ratio and are shown as mean ± SEM from three independent experiments.
Ijms 22 10837 g010
Table 1. Glycolytic metabolism and Krebs cycle enzymes activities in F1 and F3 foci. Results are expressed as U/mg and are shown as mean ± SEM obtained in three independent experiments. Statistical significance (F1 vs. F3): * p < 0.05 (Student’s t-test).
EnzymeF1F3p-Value
U/mgU/mg
Hexokinase0.028 ± 0.0030.017 ± 0.002*
Glyceraldehyde-3-phosphate dehydrogenase0.187 ± 0.0410.049 ± 0.025*
Pyruvate kinase0.031 ± 0.001 0.028 ± 0.001*
Citrate synthase0.109 ± 0,0090.087 ± 0.007 *
Malate dehydrogenase0.296 ± 0.0380.175 ± 0.022 *
Glutamate dehydrogenase0.057 ± 0.0030.068 ± 0.004*
Malic enzyme0.012 ± 0.0010.014 ± 0.0001
Glucose-6-phosphate dehydrogenase0.012 ± 0.0010.011 ± 0.0009
Isocitrate dehydrogenase0.031 ± 0.0050.025 ± 0.004
Table 2. Enzymes involved in oxidative stress defense in F1 and F3 foci. Results are expressed as U/mg and are shown as mean ± SEM obtained in three independent experiments. Statistical significance (F1 vs. F3): * p < 0.05, ** p < 0.01 (Student’s t-test).
EnzymeF1F3p-Value
U/mgU/mg
Glutathione peroxidase0.148 ± 0.0150.211 ± 0.021*
Glutathione reductase0.016 ± 0.00050.012 ± 0.001*
Glutathione S-transferase0.066 ± 0.0080.035 ± 0.007*
Catalase4.788 ± 0.5947.354 ± 0.442**
Superoxide dismutase 10.591 ± 0.0500.559 ± 0.073
Superoxide dismutase 21.750 ± 0.1701.240 ± 0.150
Table 3. Confocal images of F1 and F3 foci analysis. Results are shown as mean ± SEM obtained analyzing 30 different cells for each focus.
ParametersF1F3
Circularity0.78 ± 0.0070.75 ± 0.008
Density of mitochondrial network0.18 ± 0.0030.16 ± 0.004
Publisher’s Note: MDPI stays neutral with regard to jurisdictional claims in published maps and institutional affiliations.

