Computational Identification of Master Regulators Influencing Trypanotolerance in Cattle


Abstract
:1. Introduction
Master Regulators as Drug Targets
2. Materials and Methods
2.1. Gene Sets
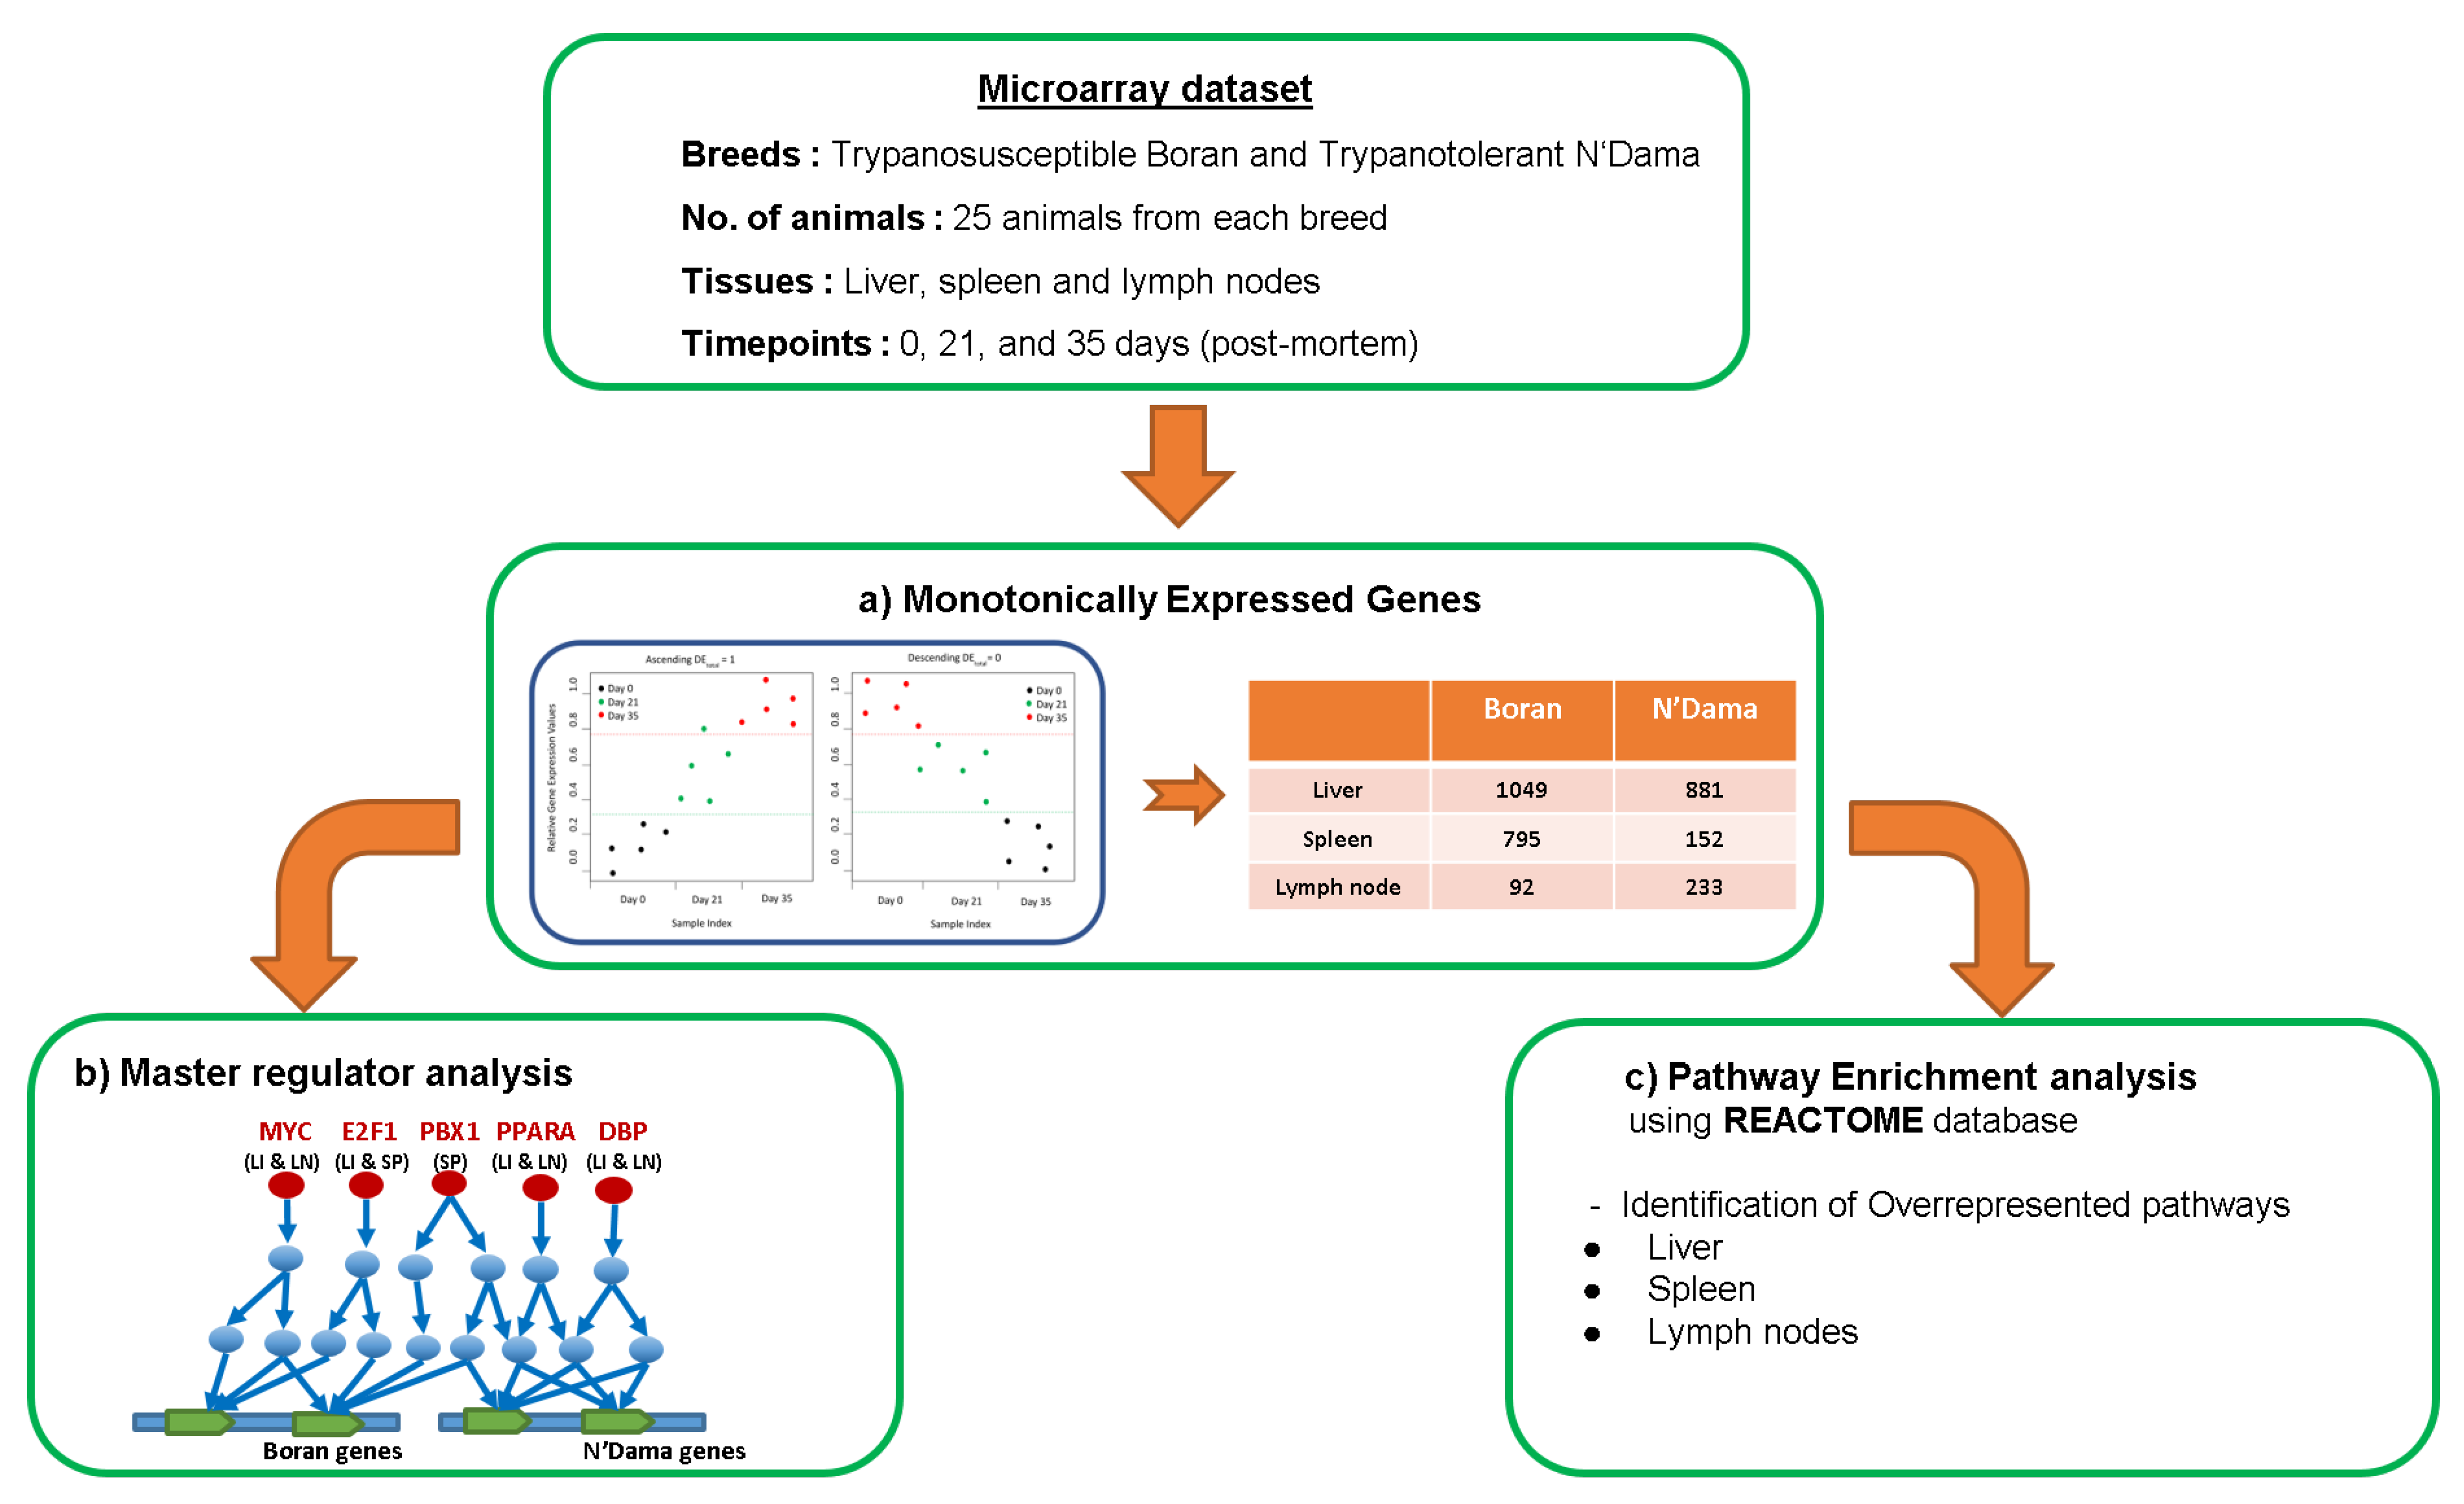
2.2. Microarray Data Set
2.3. Monotonically Expressed Genes
2.4. Finding Master Regulators and Over-Represented Pathways
3. Results
3.1. Master Regulator Analysis
3.1.1. Master Regulators in Liver
3.1.2. Master Regulators in Spleen
3.1.3. Master Regulators in Lymph Node
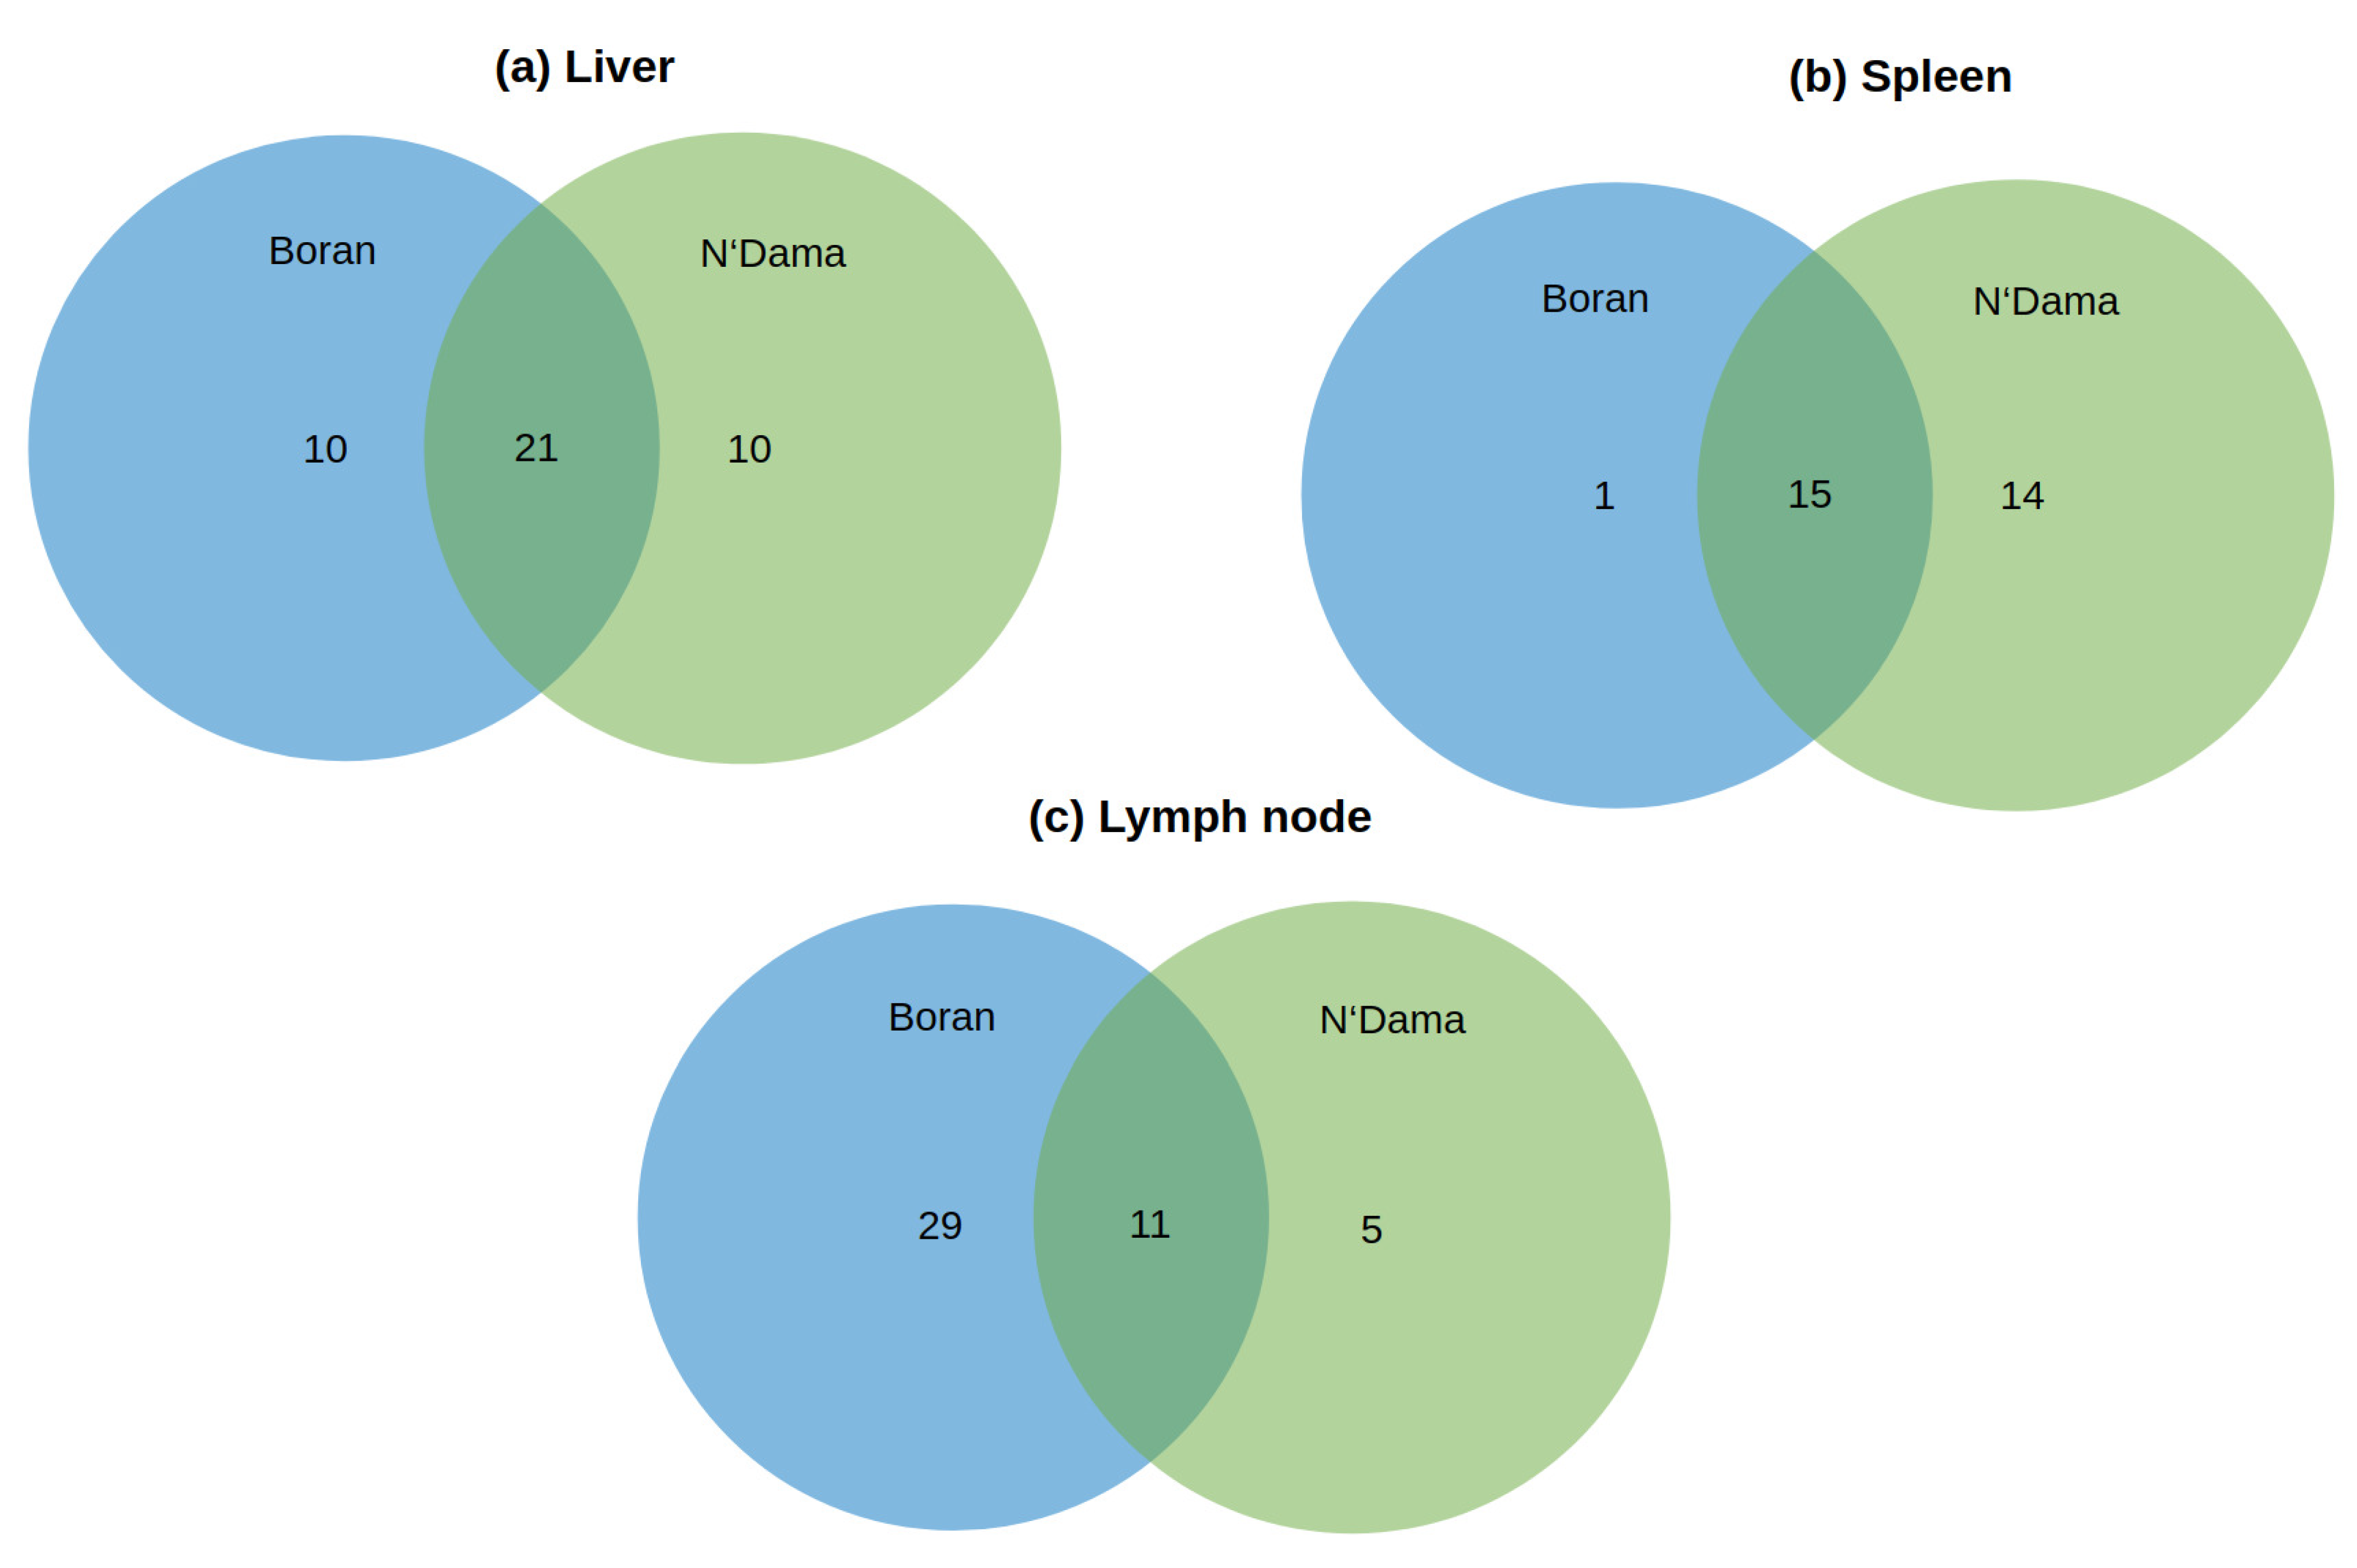
3.2. Pathway Analyses
3.2.1. Over-Represented Pathways Found for Liver Tissue
3.2.2. Over-Represented Pathways Found for Spleen Tissue
3.2.3. Over-Represented Pathways Found for Lymph Node Tissue
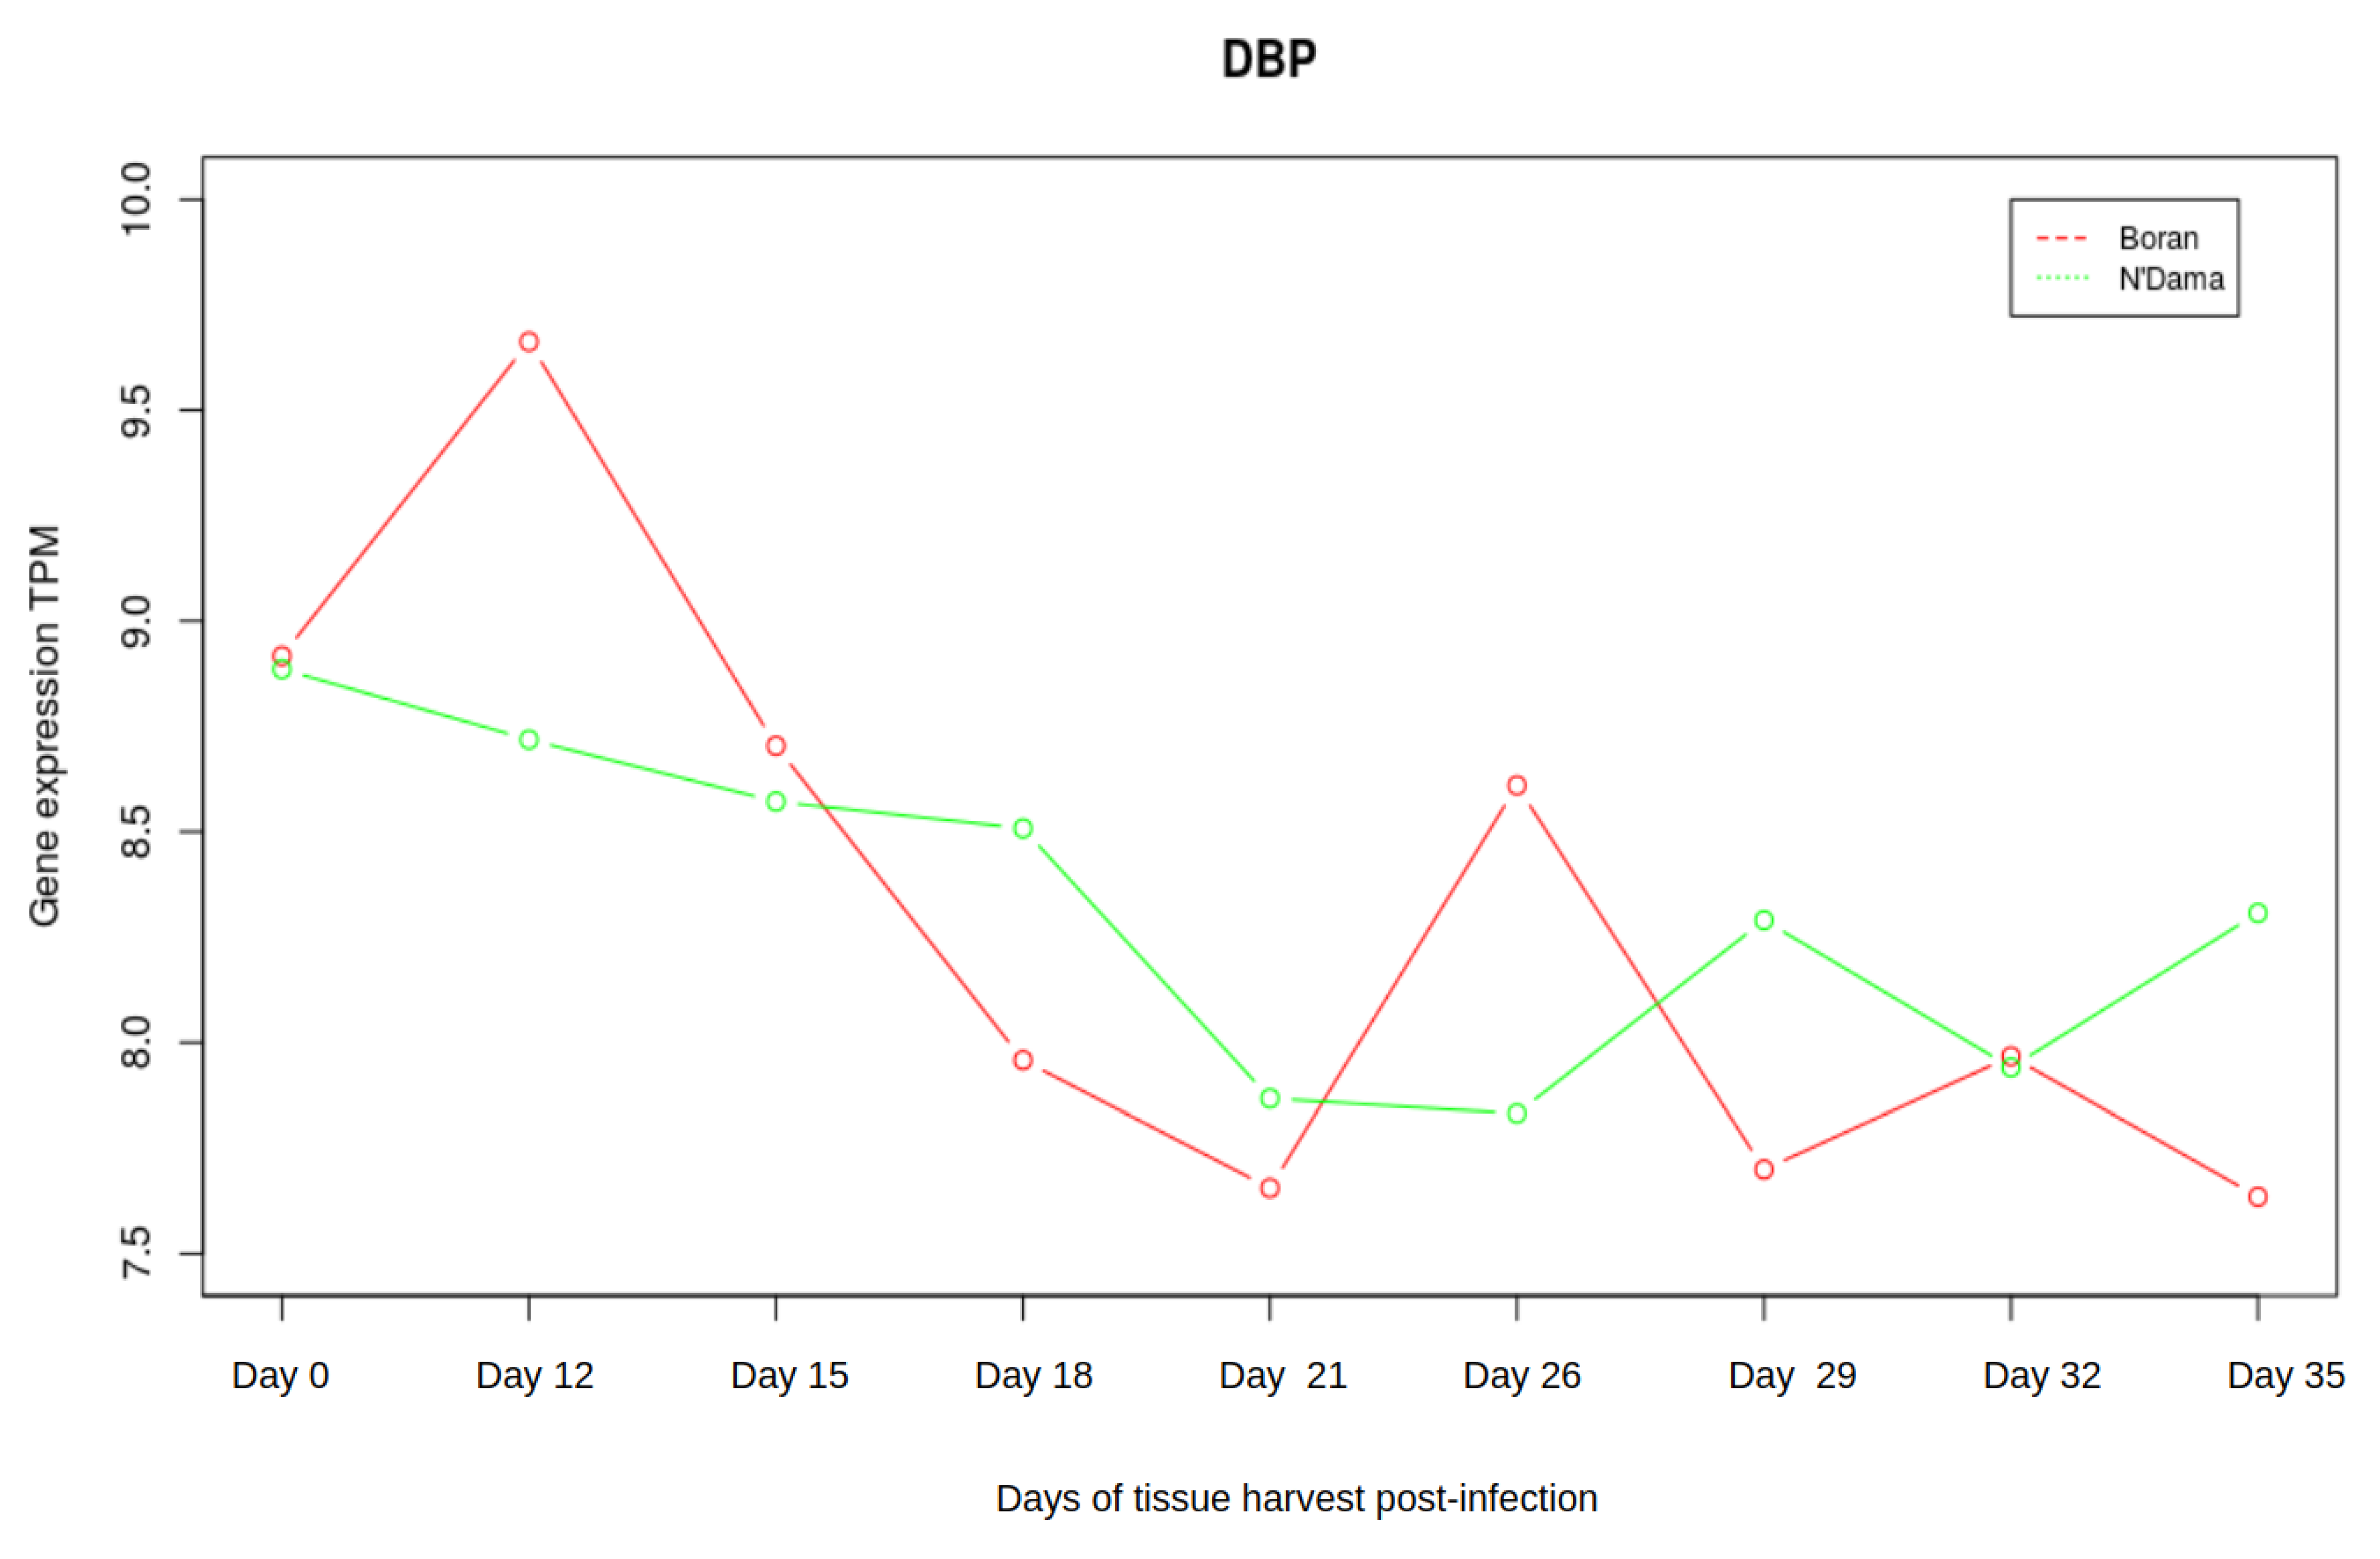
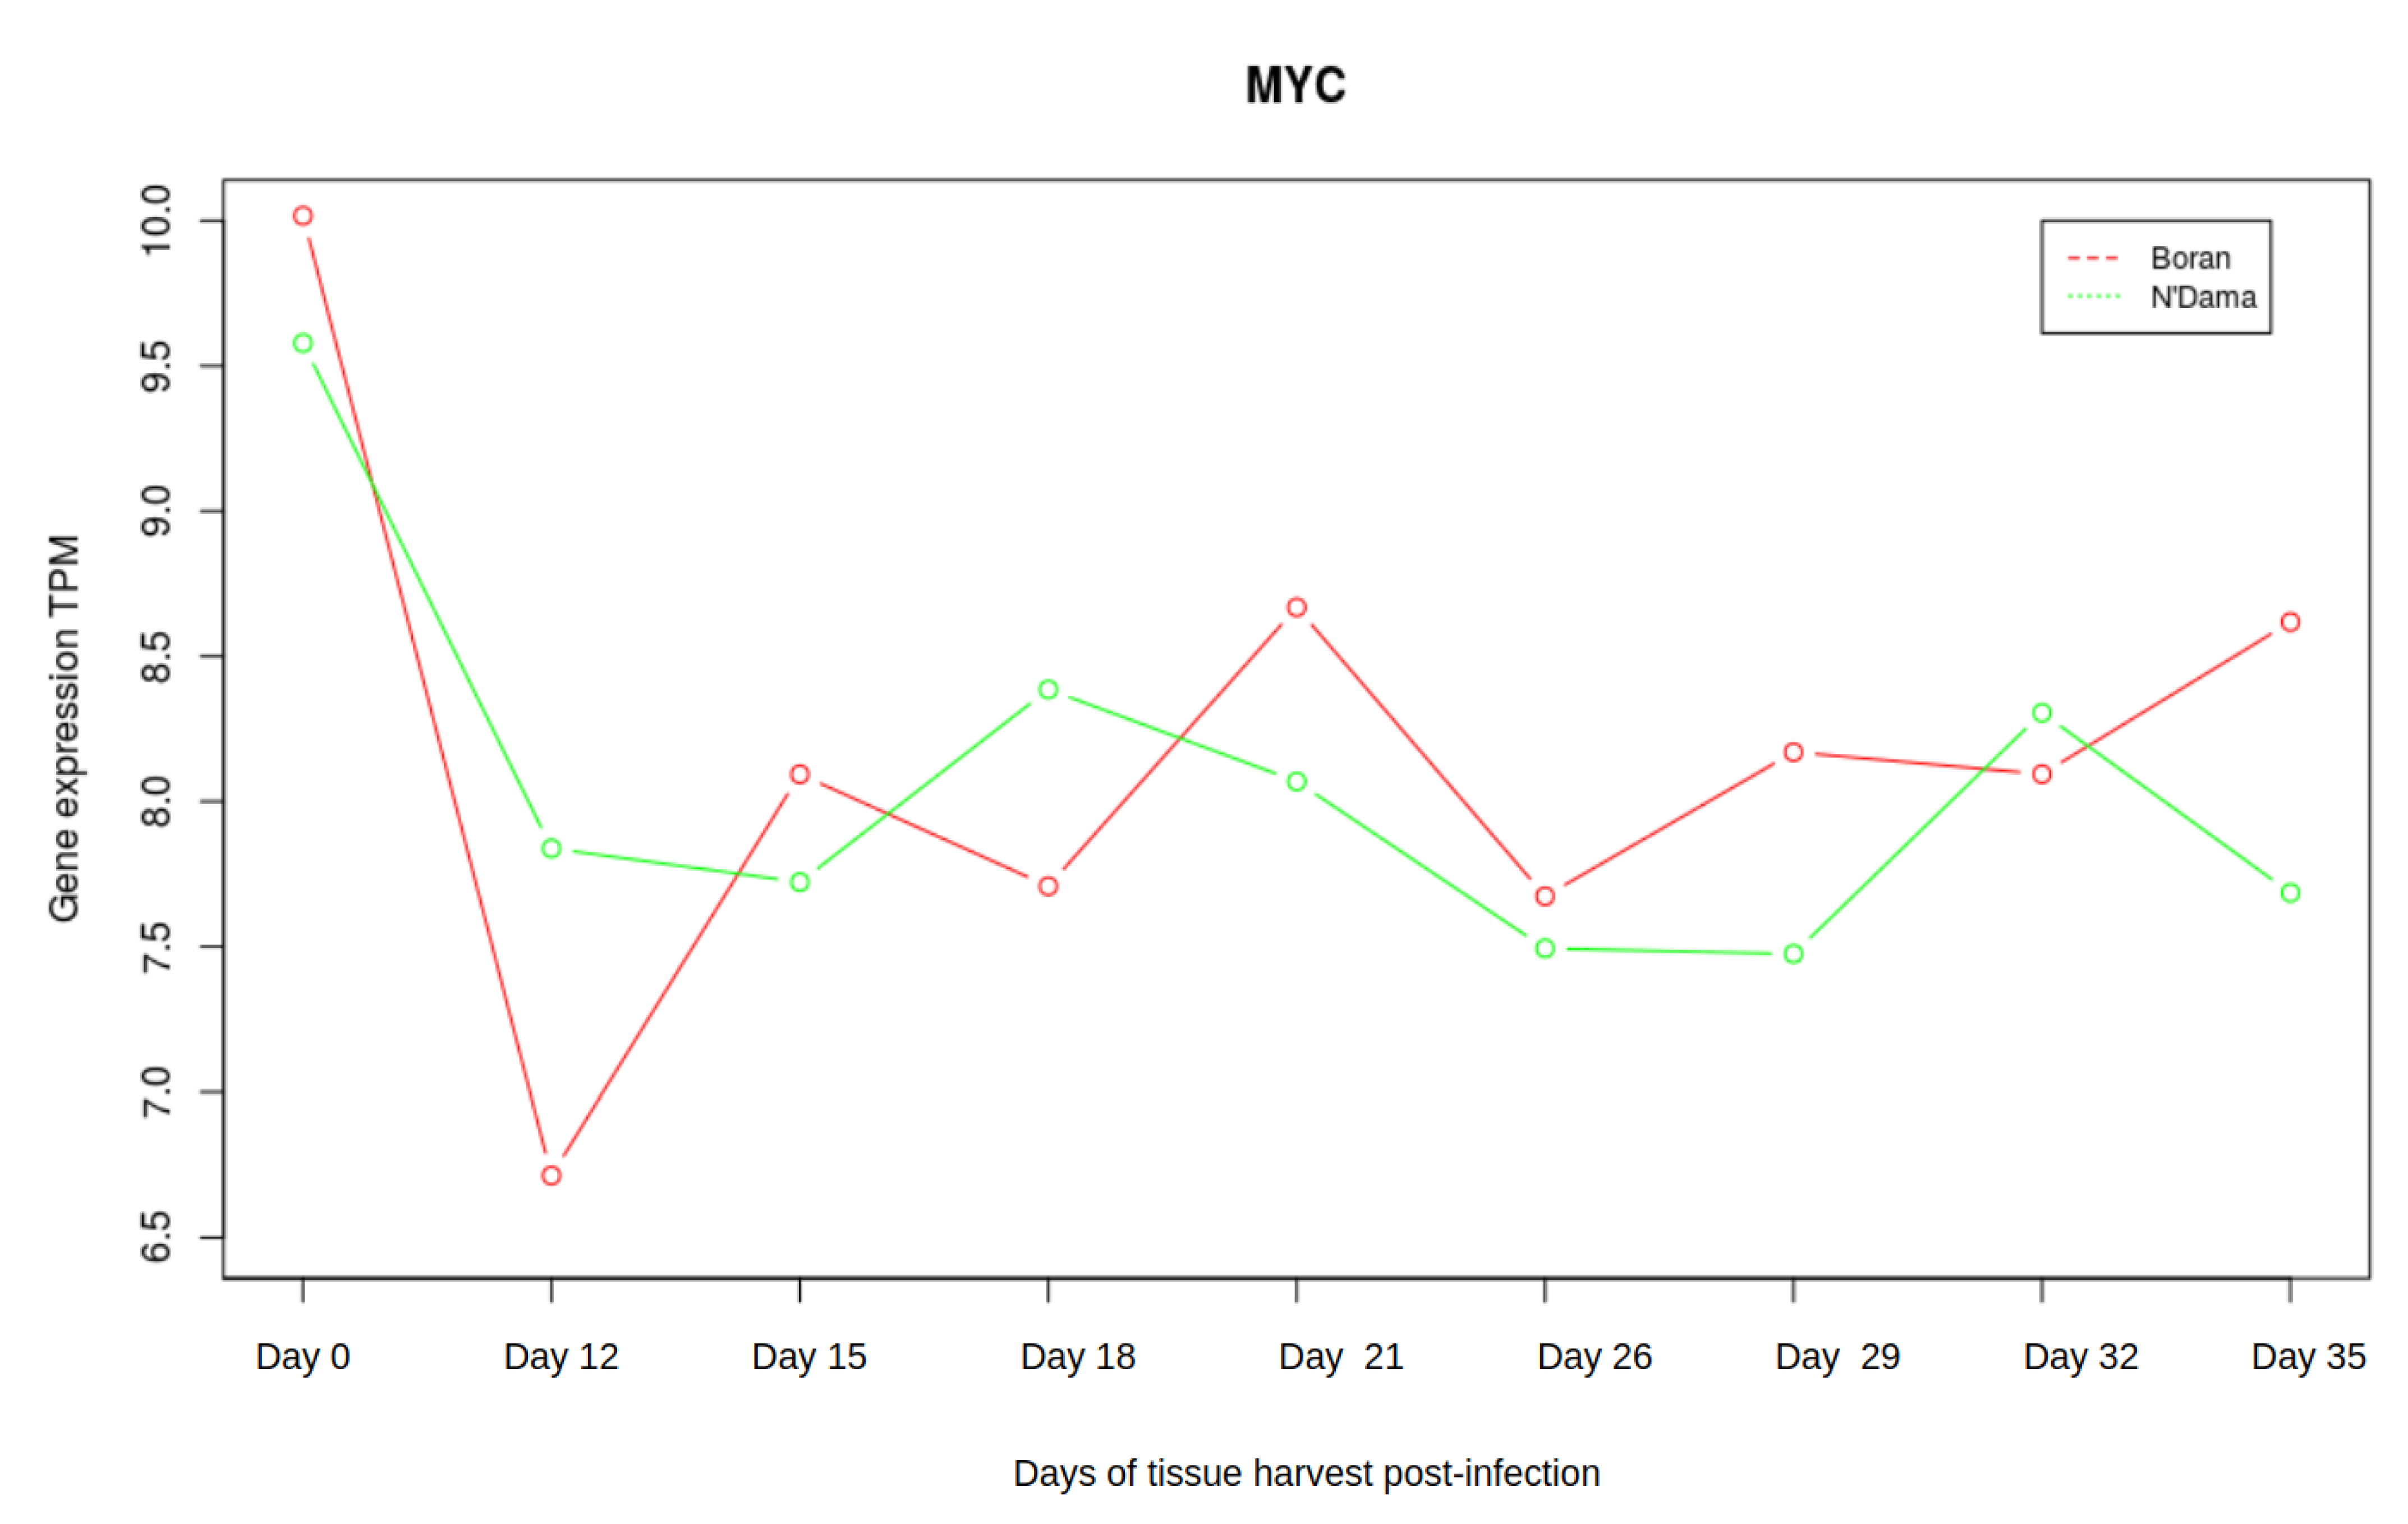
3.3. Analysis of Gene Expression Profiles of DBP and MYC
4. Discussion
Supplementary Materials
Author Contributions
Funding
Acknowledgments
Conflicts of Interest
References
- Steverding, D. Sleeping Sickness and Nagana Disease Caused by Trypanosoma. In Arthropod Borne Diseases; Springer: Berlin/Heidelberg, Germany, 2016; p. 277. [Google Scholar]
- Steverding, D. The history of African trypanosomiasis. Parasites Vectors 2008. [Google Scholar] [CrossRef] [PubMed] [Green Version]
- Hursey, B.; Slingenbergh, J. The tsetse fly and its effects on agriculture in sub-Saharan Africa. World Anim. Rev. 1995, 3–4, 67–73. [Google Scholar]
- Losos, G.J.; Ikede, B. Review of pathology of diseases in domestic and laboratory animals caused by Trypanosoma congolense, T. vivax, T. brucei, T. rhodesiense and T. gambiense. Vet. Pathol. 1972, 9, 1–79. [Google Scholar] [CrossRef] [Green Version]
- Giordani, F.; Morrison, L.J.; Rowan, T.G.; De Koning, H.P.; Barrett, M.P. The animal trypanosomiases and their chemotherapy: A review. Parasitology 2016, 143, 1862–1889. [Google Scholar] [CrossRef] [PubMed]
- Angara, T.; Ismail, A.; Ibrahim, A. Research Paper Veterinary An Overview on the Economic Impacts of Animal Trypanosomiasis; Global Journal for Research Analysis: Ahmedabad, India, 2014. [Google Scholar]
- Morrison, L.J.; Vezza, L.; Rowan, T.; Hope, J.C. Animal African trypanosomiasis: Time to increase focus on clinically relevant parasite and host species. Trends Parasitol. 2016, 32, 599–607. [Google Scholar] [CrossRef] [Green Version]
- Naessens, J. Bovine trypanotolerance: A natural ability to prevent severe anaemia and haemophagocytic syndrome? Int. J. Parasitol. 2006. [Google Scholar] [CrossRef]
- Murray, M.; Trail, J.C.; Davis, C.E.; Black, S.J. Genetic resistance to African trypanosomiasis. J. Infect. Dis. 1984. [Google Scholar] [CrossRef]
- Murray, M.; Morrison, W.I.; Whitelaw, D. Host susceptibility to African trypanosomiasis: Trypanotolerance. Adv. Parasitol. 1982, 21, 1–68. [Google Scholar]
- Courtin, D.; Berthier, D.; Thevenon, S.; Dayo, G.K.; Garcia, A.; Bucheton, B. Host genetics in African trypanosomiasis. Infect. Genet. Evol. 2008. [Google Scholar] [CrossRef]
- Starkey, P. N’Dama Cattle—A Productive Trypanotolerant Breed. FAO World Anim. Rev. 1984, 50, 2–15. [Google Scholar]
- Dargie, J.; Murray, P.; Murray, M.; Grimshaw, W.; McIntyre, W. Bovine trypanosomiasis: The red cell kinetics of Ndama and Zebu cattle infected with Trypanosoma congolense. Parasitology 1979, 78, 271–286. [Google Scholar] [CrossRef] [PubMed]
- Hassan, F.A. Climate and cattle in North Africa: A first approximation. In The Origins and Development of African Livestock: Archaeology, Genetics, Linguistics and Ethnography; University College London Press, Taylor & Francis Group: Oxford, UK, 2006; p. 61. [Google Scholar]
- Mattioli, R.; Wilson, R. Trypanosomes, tsetse and trypanotolerance: Coevolution in tropical Africa. Parassitologia 1996, 38, 531–535. [Google Scholar] [PubMed]
- Paling, R.; Moloo, S.; Scott, J.; Gettinby, G.; McOdimba, F.; Murray, M. Susceptibility of N’Dama and Boran cattle to sequential challenges with tsetse-transmitted clones of Trypanosoma congolense. Parasite Immunol. 1991, 13, 427–445. [Google Scholar] [CrossRef]
- Murray, M.; Trail, J.; d’Ieteren, G. Trypanotolerance in cattle and prospects for the control of trypanosomiasis by selective breeding. Rev. Sci. Tech. 1990, 9, 369–386. [Google Scholar] [CrossRef] [Green Version]
- Roelants, G.E. Natural resistance to African trypanosomiasis. Parasite Immunol. 1986. [Google Scholar] [CrossRef] [PubMed]
- Epstein, H. The Origin of the Domestic Animals of Africa; Africana Publishing Corporation: New York, NY, USA, 1971. [Google Scholar]
- Mekonnen, Y.A.; Gültas, M.; Effa, K.; Hanotte, O.; Schmitt, A.O. Identification of Candidate Signature Genes and Key Regulators Associated With Trypanotolerance in the Sheko Breed. Front. Genet. 2019, 10, 1095. [Google Scholar] [CrossRef] [Green Version]
- Kim, S.J.; Ka, S.; Ha, J.W.; Kim, J.; Yoo, D.; Kim, K.; Lee, H.K.; Lim, D.; Cho, S.; Hanotte, O.; et al. Cattle genome-wide analysis reveals genetic signatures in trypanotolerant N’Dama. BMC Genom. 2017, 18, 371. [Google Scholar] [CrossRef]
- O’Gorman, G.M.; Park, S.D.; Hill, E.W.; Meade, K.G.; Coussens, P.M.; Agaba, M.; Naessens, J.; Kemp, S.J.; MacHugh, D.E. Transcriptional profiling of cattle infected with Trypanosoma congolense highlights gene expression signatures underlying trypanotolerance and trypanosusceptibility. BMC Genom. 2009, 10, 207. [Google Scholar] [CrossRef] [Green Version]
- Fisher, P.; Hedeler, C.; Wolstencroft, K.; Hulme, H.; Noyes, H.; Kemp, S.; Stevens, R.; Brass, A. A systematic strategy for large-scale analysis of genotype–phenotype correlations: Identification of candidate genes involved in African trypanosomiasis. Nucleic Acids Res. 2007, 35, 5625–5633. [Google Scholar] [CrossRef]
- Hill, E.W.; O’Gorman, G.M.; Agaba, M.; Gibson, J.P.; Hanotte, O.; Kemp, S.J.; Naessens, J.; Coussens, P.M.; MacHugh, D.E. Understanding bovine trypanosomiasis and trypanotolerance: The promise of functional genomics. Vet. Immunol. Immunopathol. 2005, 105, 247–258. [Google Scholar] [CrossRef]
- Hanotte, O.; Ronin, Y.; Agaba, M.; Nilsson, P.; Gelhaus, A.; Horstmann, R.; Sugimoto, Y.; Kemp, S.; Gibson, J.; Korol, A.; et al. Mapping of quantitative trait loci controlling trypanotolerance in a cross of tolerant West African N’Dama and susceptible East African Boran cattle. Proc. Natl. Acad. Sci. USA 2003, 100, 7443–7448. [Google Scholar] [CrossRef] [PubMed] [Green Version]
- Noyes, H.; Brass, A.; Obara, I.; Anderson, S.; Archibald, A.L.; Bradley, D.G.; Fisher, P.; Freeman, A.; Gibson, J.; Gicheru, M.; et al. Genetic and expression analysis of cattle identifies candidate genes in pathways responding to Trypanosoma congolense infection. Proc. Natl. Acad. Sci. USA 2011, 108, 9304–9309. [Google Scholar] [CrossRef] [PubMed] [Green Version]
- Rajavel, A.; Heinrich, F.; Schmitt, A.O.; Gültas, M. Identifying Cattle Breed-Specific Partner Choice of Transcription Factors during the African Trypanosomiasis Disease Progression Using Bioinformatics Analysis. Vaccines 2020, 8, 246. [Google Scholar] [CrossRef] [PubMed]
- Lopez-Molina, L.; Conquet, F.; Dubois-Dauphin, M.; Schibler, U. The DBP gene is expressed according to a circadian rhythm in the suprachiasmatic nucleus and influences circadian behavior. EMBO J. 1997, 16, 6762–6771. [Google Scholar] [CrossRef] [PubMed] [Green Version]
- Fonjallaz, P.; Ossipow, V.; Wanner, G.; Schibler, U. The two PAR leucine zipper proteins, TEF and DBP, display similar circadian and tissue-specific expression, but have different target promoter preferences. EMBO J. 1996, 15, 351–362. [Google Scholar] [CrossRef]
- Wuarin, J.; Schibler, U. Expression of the liver-enriched transcriptional activator protein DBP follows a stringent circadian rhythm. Cell 1990, 63, 1257–1266. [Google Scholar] [CrossRef]
- Orozco-Solis, R.; Aguilar-Arnal, L. Circadian Regulation of Immunity Through Epigenetic Mechanisms. Front. Cell. Infect. Microbiol. 2020, 10, 96. [Google Scholar] [CrossRef] [Green Version]
- Barik, S. Molecular Interactions between Pathogens and the Circadian Clock. Int. J. Mol. Sci. 2019, 20, 5824. [Google Scholar] [CrossRef] [Green Version]
- Scheiermann, C.; Kunisaki, Y.; Frenette, P.S. Circadian control of the immune system. Nat. Rev. Immunol. 2013, 13, 190–198. [Google Scholar] [CrossRef] [Green Version]
- Hawking, F. Circadian rhythms of Trypanosoma congolense in laboratory rodents. Trans. R. Soc. Trop. Med. Hyg. 1978, 72, 592–595. [Google Scholar] [CrossRef]
- Taylor, K.A. Immune responses of cattle to African trypanosomes: Protective or pathogenic? Int. J. Parasitol. 1998, 28, 219–240. [Google Scholar] [CrossRef]
- Andrianarivo, A.G.; Muiya, P.; Opollo, M.; Loganhenfrey, L.L. Trypanosoma congolense: Comparative Effects of a Primary Infection on Bone Marrow Progenitor Cells from N’Dama and Boran Cattle. Exp. Parasitol. 1995, 80, 407–418. [Google Scholar] [CrossRef] [PubMed]
- Ramzan, F.; Klees, S.; Schmitt, A.O.; Cavero, D.; Gültas, M. Identification of Age-Specific and Common Key Regulatory Mechanisms Governing Eggshell Strength in Chicken Using Random Forests. Genes 2020, 11, 464. [Google Scholar] [CrossRef] [PubMed]
- Wlochowitz, D.; Haubrock, M.; Arackal, J.; Bleckmann, A.; Wolff, A.; Beißbarth, T.; Wingender, E.; Gültas, M. Computational identification of key regulators in two different colorectal cancer cell lines. Front. Genet. 2016, 7, 42. [Google Scholar] [CrossRef] [PubMed] [Green Version]
- Hosen, M.R.; Goody, P.R.; Zietzer, A.; Nickenig, G.; Jansen, F. MicroRNAs as master regulators of atherosclerosis: From pathogenesis to novel therapeutic options. Antioxidants Redox Signal. 2020. [Google Scholar] [CrossRef]
- Cai, W.; Zhou, W.; Han, Z.; Lei, J.; Zhuang, J.; Zhu, P.; Wu, X.; Yuan, W. Master regulator genes and their impact on major diseases. PeerJ 2020, 8, e9952. [Google Scholar] [CrossRef] [PubMed]
- Ziegler, Y.; Laws, M.J.; Guillen, V.S.; Kim, S.H.; Dey, P.; Smith, B.P.; Gong, P.; Bindman, N.; Zhao, Y.; Carlson, K.; et al. Suppression of FOXM1 activities and breast cancer growth in vitro and in vivo by a new class of compounds. NPJ Breast Cancer 2019, 5, 1–11. [Google Scholar] [CrossRef] [Green Version]
- Picaud, S.; Leonards, K.; Lambert, J.P.; Dovey, O.; Wells, C.; Fedorov, O.; Monteiro, O.; Fujisawa, T.; Wang, C.Y.; Lingard, H.; et al. Promiscuous targeting of bromodomains by bromosporine identifies BET proteins as master regulators of primary transcription response in leukemia. Sci. Adv. 2016, 2, e1600760. [Google Scholar] [CrossRef] [Green Version]
- Barillot, E.; Calzone, L.; Hupe, P.; Vert, J.P.; Zinovyev, A. Computational Systems Biology of Cancer; CRC Press: Boca Raton, FL, USA, 2012. [Google Scholar]
- Mellman, I. Dendritic cells: Master regulators of the immune response. Cancer Immunol. Res. 2013, 1, 145–149. [Google Scholar] [CrossRef] [Green Version]
- Vargas, D.M.d.; De Bastiani, M.A.; Zimmer, E.R.; Klamt, F. Alzheimer’s disease master regulators analysis: Search for potential molecular targets and drug repositioning candidates. Alzheimer Res. Ther. 2018, 10, 59. [Google Scholar] [CrossRef]
- Pan, Z.; Li, L.; Fang, Q.; Qian, Y.; Zhang, Y.; Zhu, J.; Ge, M.; Huang, P. Integrated bioinformatics analysis of master regulators in anaplastic thyroid carcinoma. BioMed Res. Int. 2019, 2019. [Google Scholar] [CrossRef]
- Wang, H.W.; Sun, H.J.; Chang, T.Y.; Lo, H.H.; Cheng, W.C.; Tseng, G.C.; Lin, C.T.; Chang, S.J.; Pal, N.R.; Chung, I.F. Discovering monotonic stemness marker genes from time-series stem cell microarray data. B Genom. Biomed. Cent. 2015, 16, S2. [Google Scholar] [CrossRef] [Green Version]
- Wingender, E.; Kel, A.E. geneXplain — eine integrierte Bioinformatik-Plattform. BIOspektrum 2012, 18, 554–556. [Google Scholar] [CrossRef]
- Koschmann, J.; Bhar, A.; Stegmaier, P.; Kel, A.E.; Wingender, E. “Upstream analysis”: An integrated promoter-pathway analysis approach to causal interpretation of microarray data. Microarrays 2015, 4, 270–286. [Google Scholar] [CrossRef] [PubMed]
- Jassal, B.; Matthews, L.; Viteri, G.; Gong, C.; Lorente, P.; Fabregat, A.; Sidiropoulos, K.; Cook, J.; Gillespie, M.; Haw, R.; et al. The reactome pathway knowledgebase. Nucleic Acids Res. 2019, 48, D498–D503. [Google Scholar] [CrossRef] [PubMed]
- Chan, S.S.K.; Kyba, M. What is a master regulator? J. Stem Cell Res. Ther. 2013, 3, 114. [Google Scholar]
- Benetatos, L.; Benetatou, A.; Vartholomatos, G. Enhancers and MYC interplay in hematopoiesis. J. Mol. Med. 2020. [Google Scholar] [CrossRef] [PubMed]
- Casey, S.C.; Tong, L.; Li, Y.; Do, R.; Walz, S.; Fitzgerald, K.N.; Gouw, A.M.; Baylot, V.; Gütgemann, I.; Eilers, M.; et al. MYC regulates the antitumor immune response through CD47 and PD-L1. Science 2016. [Google Scholar] [CrossRef] [Green Version]
- Conacci-Sorrell, M.; McFerrin, L.; Eisenman, R.N. An overview of MYC and its interactome. Cold Spring Harb. Perspect. Med. 2014. [Google Scholar] [CrossRef]
- Delgado, M.D.; León, J. Myc roles in hematopoiesis and leukemia. Genes Cancer 2010, 1, 605–616. [Google Scholar] [CrossRef] [Green Version]
- Guo, Y.; Niu, C.; Breslin, P.; Tang, M.; Zhang, S.; Wei, W.; Kini, A.R.; Paner, G.P.; Alkan, S.; Morris, S.W.; et al. c-Myc–mediated control of cell fate in megakaryocyte-erythrocyte progenitors. Blood, J. Am. Soc. Hematol. 2009, 114, 2097–2106. [Google Scholar] [CrossRef] [Green Version]
- Ohanian, M.; Rozovski, U.; Kanagal-Shamanna, R.; Abruzzo, L.V.; Loghavi, S.; Kadia, T.; Futreal, A.; Bhalla, K.; Zuo, Z.; Huh, Y.O.; et al. MYC protein expression is an important prognostic factor in acute myeloid leukemia. Leuk. Lymphoma 2019, 60, 37–48. [Google Scholar] [CrossRef] [PubMed]
- Weng, S.; Matsuura, S.; Mowery, C.T.; Stoner, S.A.; Lam, K.; Ran, D.; Davis, A.G.; Lo, M.C.; Zhang, D.E. Restoration of MYC-repressed targets mediates the negative effects of GM-CSF on RUNX1-ETO leukemogenicity. Leukemia 2017, 31, 159–169. [Google Scholar] [CrossRef]
- Matsushita, H.; Nakajima, H.; Nakamura, Y.; Tsukamoto, H.; Tanaka, Y.; Jin, G.; Yabe, M.; Asai, S.; Ono, R.; Nosaka, T.; et al. C/EBPα and C/EBPϵ induce the monocytic differentiation of myelomonocytic cells with the MLL-chimeric fusion gene. Oncogene 2008, 27, 6749–6760. [Google Scholar] [CrossRef] [Green Version]
- Shroff, E.H.; Eberlin, L.S.; Dang, V.M.; Gouw, A.M.; Gabay, M.; Adam, S.J.; Bellovin, D.I.; Trand, P.T.; Philbrick, W.M.; Garcia-Ocana, A.; et al. MYC oncogene overexpression drives renal cell carcinoma in a mouse model through glutamine metabolism. Proc. Natl. Acad. Sci. USA 2015. [Google Scholar] [CrossRef] [Green Version]
- Ventura, A.; Kirsch, D.G.; McLaughlin, M.E.; Tuveson, D.A.; Grimm, J.; Lintault, L.; Newman, J.; Reczek, E.E.; Weissleder, R.; Jacks, T. Restoration of p53 function leads to tumour regression in vivo. Nature 2007. [Google Scholar] [CrossRef]
- Hoffman, B.; Amanullah, A.; Shafarenko, M.; Liebermann, D.A. The proto-oncogene c-myc in hematopoietic development and leukemogenesis. Oncogene 2002. [Google Scholar] [CrossRef] [Green Version]
- Franco, M.; Shastri, A.J.; Boothroyd, J.C. Infection by Toxoplasma gondii specifically induces host c-Myc and the genes this pivotal transcription factor regulates. Eukaryot. Cell 2014, 13, 483–493. [Google Scholar] [CrossRef] [Green Version]
- Dessauge, F.; Hilaly, S.; Baumgartner, M.; Blumen, B.; Werling, D.; Langsley, G. c-Myc activation by Theileria parasites promotes survival of infected B-lymphocytes. Oncogene 2005, 24, 1075–1083. [Google Scholar] [CrossRef] [Green Version]
- Zhang, Y.; Xu, N.; Xu, J.; Kong, B.; Copple, B.; Guo, G.L.; Wang, L. E2F1 is a novel fibrogenic gene that regulates cholestatic liver fibrosis through the Egr-1/SHP/EID1 network. Hepatology 2014, 60, 919–930. [Google Scholar] [CrossRef] [Green Version]
- Lai, Q.; Giralt, A.; Le May, C.; Zhang, L.; Cariou, B.; Denechaud, P.D.; Fajas, L. E2F1 inhibits circulating cholesterol clearance by regulating Pcsk9 expression in the liver. JCI Insight 2017, 2. [Google Scholar] [CrossRef] [Green Version]
- Biryomumaisho, S.; Katunguka-Rwakishaya, E.; Rubaire-Akiiki, C. Serum biochemical changes in experimental Trypanosoma congolense and Trypanosoma brucei infection in Small East Africa goats. Vet. Arh. 2003, 73, 167–180. [Google Scholar]
- Tyagi, S.; Gupta, P.; Saini, A.S.; Kaushal, C.; Sharma, S. The peroxisome proliferator-activated receptor: A family of nuclear receptors role in various diseases. J. Adv. Pharm. Technol. Res. 2011, 2, 236. [Google Scholar] [CrossRef]
- Barak, Y.; Nelson, M.C.; Ong, E.S.; Jones, Y.Z.; Ruiz-Lozano, P.; Chien, K.R.; Koder, A.; Evans, R.M. PPARγ is required for placental, cardiac, and adipose tissue development. Mol. Cell 1999, 4, 585–595. [Google Scholar] [CrossRef]
- Hasenfuss, S.C.; Bakiri, L.; Thomsen, M.K.; Williams, E.G.; Auwerx, J.; Wagner, E.F. Regulation of steatohepatitis and PPARγ signaling by distinct AP-1 dimers. Cell Metab. 2014, 19, 84–95. [Google Scholar] [CrossRef] [Green Version]
- Yamazaki, T.; Shiraishi, S.; Kishimoto, K.; Miura, S.; Ezaki, O. An increase in liver PPARγ2 is an initial event to induce fatty liver in response to a diet high in butter: PPARγ2 knockdown improves fatty liver induced by high-saturated fat. J. Nutr. Biochem. 2011, 22, 543–553. [Google Scholar] [CrossRef]
- Katunguka-Rwakishaya, E.; Murray, M.; Holmes, P. Pathophysiology of Trypanosoma congolense infection in two breeds of sheep, Scottish blackface and Finn Dorset. Vet. Parasitol. 1997, 68, 215–225. [Google Scholar] [CrossRef]
- Bozek, K.; Relógio, A.; Kielbasa, S.M.; Heine, M.; Dame, C.; Kramer, A.; Herzel, H. Regulation of clock-controlled genes in mammals. PLoS ONE 2009, 4, e4882. [Google Scholar] [CrossRef]
- Takahashi, J.S. Molecular components of the circadian clock in mammals. Diabetes, Obes. Metab. 2015, 17, 6–11. [Google Scholar] [CrossRef]
- Schrem, H.; Klempnauer, J.; Borlak, J. Liver-enriched transcription factors in liver function and development. Part II: The C/EBPs and D site-binding protein in cell cycle control, carcinogenesis, circadian gene regulation, liver regeneration, apoptosis, and liver-specific gene regulation. Pharmacol. Rev. 2004, 56, 291–330. [Google Scholar] [CrossRef] [Green Version]
- Lavery, D.J.; Lopez-Molina, L.; Margueron, R.; Fleury-Olela, F.; Conquet, F.; Schibler, U.; Bonfils, C. Circadian expression of the steroid 15 α-hydroxylase (Cyp2a4) and coumarin 7-hydroxylase (Cyp2a5) genes in mouse liver is regulated by the PAR leucine zipper transcription factor DBP. Mol. Cell. Biol. 1999, 19, 6488–6499. [Google Scholar] [CrossRef] [PubMed] [Green Version]
- Lee, Y.H.; Alberta, J.A.; Gonzalez, F.J.; Waxman, D.J. Multiple, functional DBP sites on the promoter of the cholesterol 7 alpha-hydroxylase P450 gene, CYP7. Proposed role in diurnal regulation of liver gene expression. J. Biol. Chem. 1994, 269, 14681–14689. [Google Scholar] [PubMed]
- Lavery, D.J.; Schibler, U. Circadian transcription of the cholesterol 7 alpha hydroxylase gene may involve the liver-enriched bZIP protein DBP. Genes Dev. 1993, 7, 1871–1884. [Google Scholar] [CrossRef] [PubMed] [Green Version]
- Kierstein, S.; Noyes, H.; Naessens, J.; Nakamura, Y.; Pritchard, C.; Gibson, J.; Kemp, S.; Brass, A. Gene expression profiling in a mouse model for African trypanosomiasis. Genes Immun. 2006, 7, 667–679. [Google Scholar] [CrossRef] [Green Version]
- Kersten, S.; Rakhshandehroo, M.; Knoch, B.; Müller, M. Peroxisome proliferator-activated receptor alpha target genes. PPAR Res. 2010. [Google Scholar] [CrossRef] [Green Version]
- Mandard, S.; Müller, M.; Kersten, S. Peroxisome proliferator-activated receptor α target genes. Cell. Mol. Life Sci. CMLS 2004, 61, 393–416. [Google Scholar] [CrossRef]
- Gervois, P.; Mansouri, R.M. PPARα as a therapeutic target in inflammation-associated diseases. Expert Opin. Ther. Targets 2012, 16, 1113–1125. [Google Scholar] [CrossRef]
- Varga, T.; Czimmerer, Z.; Nagy, L. PPARs are a unique set of fatty acid regulated transcription factors controlling both lipid metabolism and inflammation. Biochim. Biophys. Acta Mol. Basis Dis. 2011. [Google Scholar] [CrossRef]
- Aoyama, T.; Peters, J.M.; Iritani, N.; Nakajima, T.; Furihata, K.; Hashimoto, T.; Gonzalez, F.J. Altered constitutive expression of fatty acid-metabolizing enzymes in mice lacking the peroxisome proliferator-activated receptor α (PPARα). J. Biol. Chem. 1998. [Google Scholar] [CrossRef] [Green Version]
- Abdelmegeed, M.A.; Moon, K.H.; Hardwick, J.P.; Gonzalez, F.J.; Song, B.J. Role of peroxisome proliferator-activated receptor-α in fasting-mediated oxidative stress. Free. Radic. Biol. Med. 2009. [Google Scholar] [CrossRef] [Green Version]
- Desvergne, B.; Wahli, W. Peroxisome proliferator-activated receptors: Nuclear control of metabolism. Endocr. Rev. 1999, 20, 649–688. [Google Scholar] [PubMed] [Green Version]
- Dimartino, J.F.; Selleri, L.; Traver, D.; Firpo, M.T.; Rhee, J.; Warnke, R.; O’Gorman, S.; Weissman, I.L.; Cleary, M.L. The Hox cofactor and proto-oncogene Pbx1 is required for maintenance of definitive hematopoiesis in the fetal liver. Blood 2001. [Google Scholar] [CrossRef] [PubMed] [Green Version]
- Fournier, M.; Lebert-Ghali, C.E.; Krosl, G.; Bijl, J.J. HOXA4 induces expansion of hematopoietic stem cells in vitro and confers enhancement of pro-B-cells in vivo. Stem Cells Dev. 2012, 21, 133–142. [Google Scholar] [CrossRef] [PubMed]
- Zewdu, R.; Risolino, M.; Barbulescu, A.; Ramalingam, P.; Butler, J.M.; Selleri, L. Spleen hypoplasia leads to abnormal stress hematopoiesis in mice with loss of Pbx homeoproteins in splenic mesenchyme. J. Anat. 2016, 229, 153–169. [Google Scholar] [CrossRef] [Green Version]
- Fang, F.; Wang, Y.; Li, R.; Zhao, Y.; Guo, Y.; Jiang, M.; Sun, J.; Ma, Y.; Ren, Z.; Tian, Z.; et al. Transcription factor E2F1 suppresses dendritic cell maturation. J. Immunol. 2010, 184, 6084–6091. [Google Scholar] [CrossRef] [Green Version]
- Magez, S.; Radwanska, M.; Drennan, M.; Fick, L.; Baral, T.N.; Brombacher, F.; Baetselier, P.D. Interferon-γ and nitric oxide in combination with antibodies are key protective host immune factors during Trypanosoma congolense Tc13 infections. J. Infect. Dis. 2006, 193, 1575–1583. [Google Scholar] [CrossRef] [Green Version]
- Pan, J.; Zhang, M.; Wang, J.; Wang, Q.; Xia, D.; Sun, W.; Zhang, L.; Yu, H.; Liu, Y.; Cao, X. Interferon-γ is an autocrine mediator for dendritic cell maturation. Immunol. Lett. 2004, 94, 141–151. [Google Scholar] [CrossRef]
- Wu, H.; Liu, G.; Shi, M. Interferon gamma in African trypanosome infections: Friends or foes? Front. Immunol. 2017, 8, 1105. [Google Scholar] [CrossRef]
- Cox, C.J.; Espinoza, H.M.; McWilliams, B.; Chappell, K.; Morton, L.; Hjalt, T.A.; Semina, E.V.; Amendt, B.A. Differential regulation of gene expression by PITX2 isoforms. J. Biol. Chem. 2002, 277, 25001–25010. [Google Scholar] [CrossRef] [Green Version]
- Casacuberta-Serra, S.; Soucek, L. Myc and Ras, the Bonnie and Clyde of immune evasion. Transl. Cancer Res. 2018, 7, S457. [Google Scholar] [CrossRef]
- Kortlever, R.M.; Sodir, N.M.; Wilson, C.H.; Burkhart, D.L.; Pellegrinet, L.; Swigart, L.B.; Littlewood, T.D.; Evan, G.I. Myc cooperates with Ras by programming inflammation and immune suppression. Cell 2017, 171, 1301–1315. [Google Scholar] [CrossRef] [PubMed]
- Villarino, A.V.; Gallo, E.; Abbas, A.K. STAT1-activating cytokines limit Th17 responses through both T-bet–dependent and–independent mechanisms. J. Immunol. 2010, 185, 6461–6471. [Google Scholar] [CrossRef] [PubMed] [Green Version]
- Tesmer, L.A.; Lundy, S.K.; Sarkar, S.; Fox, D.A. Th17 cells in human disease. Immunol. Rev. 2008, 223, 87–113. [Google Scholar] [CrossRef] [PubMed]
- Szabo, S.J.; Sullivan, B.M.; Peng, S.L.; Glimcher, L.H. Molecular mechanisms regulating Th1 immune responses. Annu. Rev. Immunol. 2003, 21, 713–758. [Google Scholar] [CrossRef] [PubMed]
- Okwor, I.; Muleme, H.; Jia, P.; Uzonna, J.E. Altered proinflammatory cytokine production and enhanced resistance to Trypanosoma congolense infection in lymphotoxin β-deficient mice. J. Infect. Dis. 2009, 200, 361–369. [Google Scholar] [CrossRef] [PubMed] [Green Version]
- Shi, M.; Pan, W.; Tabel, H. Experimental African trypanosomiasis: IFN-γ mediates early mortality. Eur. J. Immunol. 2003, 33, 108–118. [Google Scholar] [CrossRef]
- Zhou, Y.; Fu, B.; Xu, X.; Tong, X.; Sun, R.; Tian, Z.; Wei, H. Requirement for PBX1 in developmental programming of natural killer cells. J. Immunol. 2017, 198, 202–215. [Google Scholar]
- Cnops, J.; De Trez, C.; Stijlemans, B.; Keirsse, J.; Kauffmann, F.; Barkhuizen, M.; Keeton, R.; Boon, L.; Brombacher, F.; Magez, S. NK-, NKT-and CD8-Derived IFNγ drives myeloid cell activation and erythrophagocytosis, resulting in trypanosomosis-associated acute anemia. PLoS Pathog. 2015, 11, e1004964. [Google Scholar] [CrossRef] [Green Version]
- Ueda, H.R.; Hayashi, S.; Chen, W.; Sano, M.; Machida, M.; Shigeyoshi, Y.; Iino, M.; Hashimoto, S. System-level identification of transcriptional circuits underlying mammalian circadian clocks. Nat. Genet. 2005, 37, 187–192. [Google Scholar] [CrossRef]
- Yamaguchi, S.; Mitsui, S.; Yan, L.; Yagita, K.; Miyake, S.; Okamura, H. Role of DBP in the circadian oscillatory mechanism. Mol. Cell. Biol. 2000, 20, 4773–4781. [Google Scholar] [CrossRef] [Green Version]
- Silver, A.C.; Arjona, A.; Hughes, M.E.; Nitabach, M.N.; Fikrig, E. Circadian expression of clock genes in mouse macrophages, dendritic cells, and B cells. Brain Behav. Immun. 2012, 26, 407–413. [Google Scholar] [CrossRef] [PubMed] [Green Version]
- Keller, M.; Mazuch, J.; Abraham, U.; Eom, G.D.; Herzog, E.D.; Volk, H.D.; Kramer, A.; Maier, B. A circadian clock in macrophages controls inflammatory immune responses. Proc. Natl. Acad. Sci. USA 2009, 106, 21407–21412. [Google Scholar] [CrossRef] [PubMed] [Green Version]
- Archer, S.N.; Viola, A.U.; Kyriakopoulou, V.; von Schantz, M.; Dijk, D.J. Inter-individual differences in habitual sleep timing and entrained phase of endogenous circadian rhythms of BMAL1, PER2 and PER3 mRNA in human leukocytes. Sleep 2008, 31, 608–617. [Google Scholar] [CrossRef] [PubMed]
- Hayashi, M.; Shimba, S.; Tezuka, M. Characterization of the molecular clock in mouse peritoneal macrophages. Biol. Pharm. Bull. 2007, 30, 621–626. [Google Scholar] [CrossRef] [Green Version]
- Arjona, A.; Sarkar, D.K. The circadian gene mPer2 regulates the daily rhythm of IFN-γ. J. Interferon Cytokine Res. 2006, 26, 645–649. [Google Scholar] [CrossRef]
- Arjona, A.; Sarkar, D.K. Evidence supporting a circadian control of natural killer cell function. Brain, Behav. Immun. 2006, 20, 469–476. [Google Scholar] [CrossRef]
- Arjona, A.; Sarkar, D.K. Circadian oscillations of clock genes, cytolytic factors, and cytokines in rat NK cells. J. Immunol. 2005, 174, 7618–7624. [Google Scholar] [CrossRef] [Green Version]
- Boivin, D.B.; James, F.O.; Wu, A.; Cho-Park, P.F.; Xiong, H.; Sun, Z.S. Circadian clock genes oscillate in human peripheral blood mononuclear cells. Blood 2003, 102, 4143–4145. [Google Scholar] [CrossRef] [Green Version]
- Sha, Z.; Compans, R.W. Induction of CD4+ T-cell-independent immunoglobulin responses by inactivated influenza virus. J. Virol. 2000, 74, 4999–5005. [Google Scholar] [CrossRef]
- Oxenius, A.; Zinkernagel, R.M.; Hengartner, H. CD4+ T-cell induction and effector functions: A comparison of immunity against soluble antigens and viral infections. In Advances in Immunology; Elsevier: Amsterdam, The Netherlands, 1998; Volume 70, pp. 313–367. [Google Scholar]
- Parker, D.C. T cell-dependent B cell activation. Annu. Rev. Immunol. 1993, 11, 331–360. [Google Scholar] [CrossRef]
- Taylor, K.A.; Lutje, V.; Kennedy, D.; Authié, E.; Boulangé, A.; Logan-Henfrey, L.; Gichuki, B.; Gettinby, G. Trypanosoma congolense: B-lymphocyte responses differ between trypanotolerant and trypanosusceptible cattle. Exp. Parasitol. 1996, 83, 106–116. [Google Scholar] [CrossRef] [PubMed] [Green Version]
- Bollinger, T.; Leutz, A.; Leliavski, A.; Skrum, L.; Kovac, J.; Bonacina, L.; Benedict, C.; Lange, T.; Westermann, J.; Oster, H.; et al. Circadian clocks in mouse and human CD4+ T cells. PLoS ONE 2011, 6, e29801. [Google Scholar] [CrossRef] [PubMed]
- Jones, D.C.; Ding, X.; Daynes, R.A. Nuclear Receptor Peroxisome Proliferator-activated Receptor α (PPARα) Is Expressed in Resting Murine Lymphocytes The Pparα In T and B Lymphocytes Is Both Transactivation and Transrepression Competent. J. Biol. Chem. 2002, 277, 6838–6845. [Google Scholar] [CrossRef] [PubMed] [Green Version]
- Cunard, R.; Ricote, M.; DiCampli, D.; Archer, D.C.; Kahn, D.A.; Glass, C.K.; Kelly, C.J. Regulation of cytokine expression by ligands of peroxisome proliferator activated receptors. J. Immunol. 2002, 168, 2795–2802. [Google Scholar] [CrossRef] [PubMed] [Green Version]
- Yang, Y.; Gocke, A.R.; Lovett-Racke, A.; Drew, P.D.; Racke, M.K. PPAR alpha regulation of the immune response and autoimmune encephalomyelitis. PPAR Res. 2008, 2008. [Google Scholar] [CrossRef] [Green Version]
- Cunard, R.; DiCampli, D.; Archer, D.C.; Stevenson, J.L.; Ricote, M.; Glass, C.K.; Kelly, C.J. WY14, 643, a PPARα ligand, has profound effects on immune responses in vivo. J. Immunol. 2002, 169, 6806–6812. [Google Scholar] [CrossRef] [Green Version]
- Delerive, P.; De Bosscher, K.; Besnard, S.; Berghe, W.V.; Peters, J.M.; Gonzalez, F.J.; Fruchart, J.C.; Tedgui, A.; Haegeman, G.; Staels, B. Peroxisome proliferator-activated receptor α negatively regulates the vascular inflammatory gene response by negative cross-talk with transcription factors NF-κB and AP-1. J. Biol. Chem. 1999, 274, 32048–32054. [Google Scholar] [CrossRef] [Green Version]
- Jantsch, J.; Schödel, J. Hypoxia and hypoxia-inducible factors in myeloid cell-driven host defense and tissue homeostasis. Immunobiology 2015, 220, 305–314. [Google Scholar] [CrossRef]
- Arena, E.T.; Tinevez, J.Y.; Nigro, G.; Sansonetti, P.J.; Marteyn, B.S. The infectious hypoxia: Occurrence and causes during Shigella infection. Microbes Infect. 2017, 19, 157–165. [Google Scholar] [CrossRef]
- Waghabi, M.C.; Keramidas, M.; Bailly, S.; Degrave, W.; Mendonça-Lima, L.; Maria de Nazaré, C.S.; Maria de Nazareth, L.M.; Paciornik, S.; Araújo-Jorge, T.C.; Feige, J.J. Uptake of host cell transforming growth factor-β by Trypanosoma cruzi amastigotes in cardiomyocytes: Potential role in parasite cycle completion. Am. J. Pathol. 2005, 167, 993–1003. [Google Scholar] [CrossRef]
- Gantt, K.R.; Schultz-Cherry, S.; Rodriguez, N.; Jeronimo, S.M.; Nascimento, E.T.; Goldman, T.L.; Recker, T.J.; Miller, M.A.; Wilson, M.E. Activation of TGF-β by Leishmania chagasi: Importance for parasite survival in macrophages. J. Immunol. 2003, 170, 2613–2620. [Google Scholar] [CrossRef] [PubMed] [Green Version]
- Boutard, V.; Havouis, R.; Fouqueray, B.; Philippe, C.; Moulinoux, J.P.; Baud, L. Transforming growth factor-beta stimulates arginase activity in macrophages. Implications for the regulation of macrophage cytotoxicity. J. Immunol. 1995, 155, 2077–2084. [Google Scholar] [PubMed]
- Bogdan, C.; Nathan, C. Modulation of Macrophage Function by Transforming Growth Factor β, Interleukin-4, and Interleukin-10 a. Ann. N. Y. Acad. Sci. 1993, 685, 713–739. [Google Scholar] [CrossRef]
- Johnston, C.J.; Smyth, D.J.; Dresser, D.W.; Maizels, R.M. TGF-β in tolerance, development and regulation of immunity. Cell. Immunol. 2016, 299, 14–22. [Google Scholar] [CrossRef] [PubMed] [Green Version]
- Hansen, G.; McIntire, J.J.; Yeung, V.P.; Berry, G.; Thorbecke, G.J.; Chen, L.; DeKruyff, R.H.; Umetsu, D.T. CD4+ T helper cells engineered to produce latent TGF-β1 reverse allergen-induced airway hyperreactivity and inflammation. J. Clin. Investig. 2000, 105, 61–70. [Google Scholar] [CrossRef] [Green Version]
- Ferrão, P.M.; Nisimura, L.M.; Moreira, O.C.; Land, M.G.; Pereira, M.C.; de Mendonça-Lima, L.; Araujo-Jorge, T.C.; Waghabi, M.C.; Garzoni, L.R. Inhibition of TGF-β pathway reverts extracellular matrix remodeling in T. cruzi-infected cardiac spheroids. Exp. Cell Res. 2018, 362, 260–267. [Google Scholar] [CrossRef]
- MacLean, L.; Chisi, J.E.; Odiit, M.; Gibson, W.C.; Ferris, V.; Picozzi, K.; Sternberg, J.M. Severity of human African trypanosomiasis in East Africa is associated with geographic location, parasite genotype, and host inflammatory cytokine response profile. Infect. Immun. 2004, 72, 7040–7044. [Google Scholar] [CrossRef] [Green Version]
- Dinarello, C.A. Overview of the IL-1 family in innate inflammation and acquired immunity. Immunol. Rev. 2018, 281, 8–27. [Google Scholar] [CrossRef]
- Bass, J.; Takahashi, J.S. Circadian integration of metabolism and energetics. Science 2010, 330, 1349–1354. [Google Scholar] [CrossRef] [Green Version]
- Wang, J.; Mauvoisin, D.; Martin, E.; Atger, F.; Galindo, A.N.; Dayon, L.; Sizzano, F.; Palini, A.; Kussmann, M.; Waridel, P.; et al. Nuclear proteomics uncovers diurnal regulatory landscapes in mouse liver. Cell Metab. 2017, 25, 102–117. [Google Scholar] [CrossRef] [Green Version]
- Mauvoisin, D.; Wang, J.; Jouffe, C.; Martin, E.; Atger, F.; Waridel, P.; Quadroni, M.; Gachon, F.; Naef, F. Circadian clock-dependent and-independent rhythmic proteomes implement distinct diurnal functions in mouse liver. Proc. Natl. Acad. Sci. USA 2014, 111, 167–172. [Google Scholar] [CrossRef] [Green Version]
- Panda, S.; Antoch, M.P.; Miller, B.H.; Su, A.I.; Schook, A.B.; Straume, M.; Schultz, P.G.; Kay, S.A.; Takahashi, J.S.; Hogenesch, J.B. Coordinated transcription of key pathways in the mouse by the circadian clock. Cell 2002, 109, 307–320. [Google Scholar] [CrossRef] [Green Version]
- Taghon, T.; Thys, K.; De Smedt, M.; Weerkamp, F.; Staal, F.; Plum, J.; Leclercq, G. Homeobox gene expression profile in human hematopoietic multipotent stem cells and T-cell progenitors: Implications for human T-cell development. Leukemia 2003, 17, 1157–1163. [Google Scholar] [CrossRef] [PubMed] [Green Version]
- Taghon, T.; Stolz, F.; De Smedt, M.; Cnockaert, M.; Verhasselt, B.; Plum, J.; Leclercq, G. HOX-A10 regulates hematopoietic lineage commitment: Evidence for a monocyte-specific transcription factor. Blood, J. Am. Soc. Hematol. 2002, 99, 1197–1204. [Google Scholar] [CrossRef] [PubMed] [Green Version]
- Res, P.; Spits, H. Developmental stages in the human thymus. In Seminars in Immunology; Elsevier: Amsterdam, The Netherlands, 1999; Volume 11, pp. 39–46. [Google Scholar]
- Magli, M.C.; Largman, C.; Lawrence, H.J. Effects of HOX homeobox genes in blood cell differentiation. J. Cell. Physiol. 1997, 173, 168–177. [Google Scholar] [CrossRef]
- Niwa, H. How is pluripotency determined and maintained? Development 2007, 134, 635–646. [Google Scholar] [CrossRef] [Green Version]
- Niwa, H.; Miyazaki, J.; Smith, A.G. Quantitative expression of Oct-3/4 defines differentiation, dedifferentiation or self-renewal of ES cells. Nat. Genet. 2000, 24, 372–376. [Google Scholar] [CrossRef]
- Sun, Y.; Yang, Z.; Niu, Z.; Peng, J.; Li, Q.; Xiong, W.; Langnas, A.N.; Ma, M.Y.; Zhao, Y. MOP3, a component of the molecular clock, regulates the development of B cells. Immunology 2006, 119, 451–460. [Google Scholar] [CrossRef]
- Kuriakose, S.M.; Singh, R.; Uzonna, J.E. Host intracellular signaling events and pro-inflammatory cytokine production in African trypanosomiasis. Front. Immunol. 2016, 7, 181. [Google Scholar] [CrossRef]
- Fatouros, M.; Bourantas, K.; Bairaktari, E.; Elisaf, M.; Tsolas, O.; Cassioumis, D. Role of the spleen in lipid metabolism. Br. J. Surg. 1995, 82, 1675–1677. [Google Scholar] [CrossRef]
- Aviram, M.; Brook, J.; Tatarsky, I.; Levy, Y.; Carter, A. Increased low-density lipoprotein levels after splenectomy: A role for the spleen in cholesterol metabolism in myeloproliferative disorders. Am. J. Med Sci. 1986, 291, 25–28. [Google Scholar] [CrossRef] [PubMed]
- Egan, C.; Sukhumavasi, W.; Butcher, B.; Denkers, E. Functional aspects of Toll-like receptor/MyD88 signalling during protozoan infection: Focus on Toxoplasma gondii. Clin. Exp. Immunol. 2009, 156, 17–24. [Google Scholar] [CrossRef] [PubMed]
- Kuriakose, S.; Onyilagha, C.; Singh, R.; Olayinka-Adefemi, F.; Jia, P.; Uzonna, J.E. TLR-2-dependent activation of MAPK and STAT proteins regulates proinflammatory cytokine response and immunity to experimental Trypanosoma congolense infection. Front. Immunol. 2019, 10, 2673. [Google Scholar] [CrossRef] [PubMed]
- Sutton, C.E.; Lalor, S.J.; Sweeney, C.M.; Brereton, C.F.; Lavelle, E.C.; Mills, K.H. Interleukin-1 and IL-23 induce innate IL-17 production from gamma delta T cells, amplifying Th17 responses and autoimmunity. Immunity 2009, 31, 331–341. [Google Scholar] [CrossRef] [PubMed] [Green Version]
- Scheiermann, C.; Gibbs, J.; Ince, L.; Loudon, A. Clocking in to immunity. Nat. Rev. Immunol. 2018, 18, 423–437. [Google Scholar] [CrossRef] [PubMed]
- Curtis, A.M.; Bellet, M.M.; Sassone-Corsi, P.; O’Neill, L.A. Circadian clock proteins and immunity. Immunity 2014, 40, 178–186. [Google Scholar] [CrossRef] [Green Version]
- Barkhuizen, M.; Magez, S.; Atkinson, R.A.; Brombacher, F. Interleukin-12p70-dependent interferon-γ production is crucial for resistance in African trypanosomiasis. J. Infect. Dis. 2007, 196, 1253–1260. [Google Scholar] [CrossRef] [Green Version]
- Liu, Y.; Ragaa, E.; Li, Z.; Nuortio, L.; Mustafa, A.; Bakhiet, M. Interferon-gamma and interleukin-12 genes are preferentially expressed during early experimental African trypanosomiasis and suppressed by denervation of the spleen. Scand. J. Immunol. 1999, 50, 485–491. [Google Scholar] [CrossRef]
- Tian, S. Identification of monotonically differentially expressed genes for non-small cell lung cancer. BMC Bioinform. 2019, 20, 177. [Google Scholar] [CrossRef] [Green Version]
- Hergenhan, S.; Holtkamp, S.; Scheiermann, C. Molecular interactions between components of the circadian clock and the immune system. J. Mol. Biol. 2020. [Google Scholar] [CrossRef]
- Altman, B.J.; Hsieh, A.L.; Sengupta, A.; Krishnanaiah, S.Y.; Stine, Z.E.; Walton, Z.E.; Gouw, A.M.; Venkataraman, A.; Li, B.; Goraksha-Hicks, P.; et al. MYC disrupts the circadian clock and metabolism in cancer cells. Cell Metab. 2015, 22, 1009–1019. [Google Scholar] [CrossRef] [PubMed] [Green Version]
- Gery, S.; Koeffler, H. The Role of Circadian Regulation in Cancer; Cold Spring Harbor Symposia on Quantitative Biology, Cold Spring Harbor Laboratory Press: Cold Spring Harbor, NY, USA, 2007; Volume 72, pp. 459–464. [Google Scholar]
- Masri, S.; Sassone-Corsi, P. The emerging link between cancer, metabolism, and circadian rhythms. Nat. Med. 2018, 24, 1795. [Google Scholar] [CrossRef] [PubMed]
- Dixon, L.J.; Barnes, M.; Tang, H.; Pritchard, M.T.; Nagy, L.E. Kupffer cells in the liver. Compr. Physiol. 2013, 3, 785–797. [Google Scholar] [PubMed] [Green Version]
- Stout, R.D.; Suttles, J. Functional plasticity of macrophages: Reversible adaptation to changing microenvironments. J. Leukoc. Biol. 2004, 76, 509–513. [Google Scholar] [CrossRef] [PubMed]
- Gordon, S.; Taylor, P.R. Monocyte and macrophage heterogeneity. Nat. Rev. Immunol. 2005, 5, 953–964. [Google Scholar] [CrossRef]
- Hörhold, F.; Eisel, D.; Oswald, M.; Kolte, A.; Röll, D.; Osen, W.; Eichmüller, S.B.; König, R. Reprogramming of macrophages employing gene regulatory and metabolic network models. PLoS Comput. Biol. 2020, 16, e1007657. [Google Scholar] [CrossRef] [Green Version]
- Uzonna, J.; Kaushik, R.; Gordon, J.; Tabel, H. Cytokines and antibody responses during Trypanosoma congolense infections in two inbred mouse strains that differ in resistance. Parasite Immunol. 1999, 21, 57–71. [Google Scholar]
- Kel, A.E. Search for Master Regulators in Walking Cancer Pathways. In Biological Networks and Pathway Analysis; Springer: Berlin/Heidelberg, Germany, 2017; pp. 161–191. [Google Scholar]
- Kel, A.E.; Stegmaier, P.; Valeev, T.; Koschmann, J.; Poroikov, V.; Kel-Margoulis, O.V.; Wingender, E. Multi-omics “upstream analysis” of regulatory genomic regions helps identifying targets against methotrexate resistance of colon cancer. EuPA Open Proteom. 2016, 13, 1–13. [Google Scholar] [CrossRef] [Green Version]
- Sikdar, S.; Datta, S. A novel statistical approach for identification of the master regulator transcription factor. BMC Bioinform. 2017, 18, 1–11. [Google Scholar] [CrossRef] [Green Version]


| Boran | N’Dama | |||
|---|---|---|---|---|
| Ascending | Descending | Ascending | Descending | |
| Liver | 741 | 308 | 757 | 124 |
| Spleen | 669 | 126 | 13 | 139 |
| Lymph node | 87 | 5 | 119 | 114 |
| Boran | N’Dama | |
|---|---|---|
| Liver | MYC, E2F1, PPARG | DBP, PBX1, HOXA4, PPARA |
| Spleen | PITX2, E2F1, PBX1 | PBX1 |
| Lymph node | MYC, pSTAT1, PBX1 | DBP, PPARA |
| Liver | |||
|---|---|---|---|
| Pathway Name | Hit Names | Adjusted p-Value | |
| Boran | Cellular responses to external stimuli | Arnt, Fos, Hif1a, Hsf1 | 4.64 × 10 |
| Regulation of beta-cell development | Foxo1, Hnf4g, Nkx2.2 | 0.0032 | |
| Regulation of Hypoxia-inducible Factor (HIF) by oxygen | Arnt, Hif1a | 0.0033 | |
| Cellular response to hypoxia | Arnt, Hif1a | 0.0033 | |
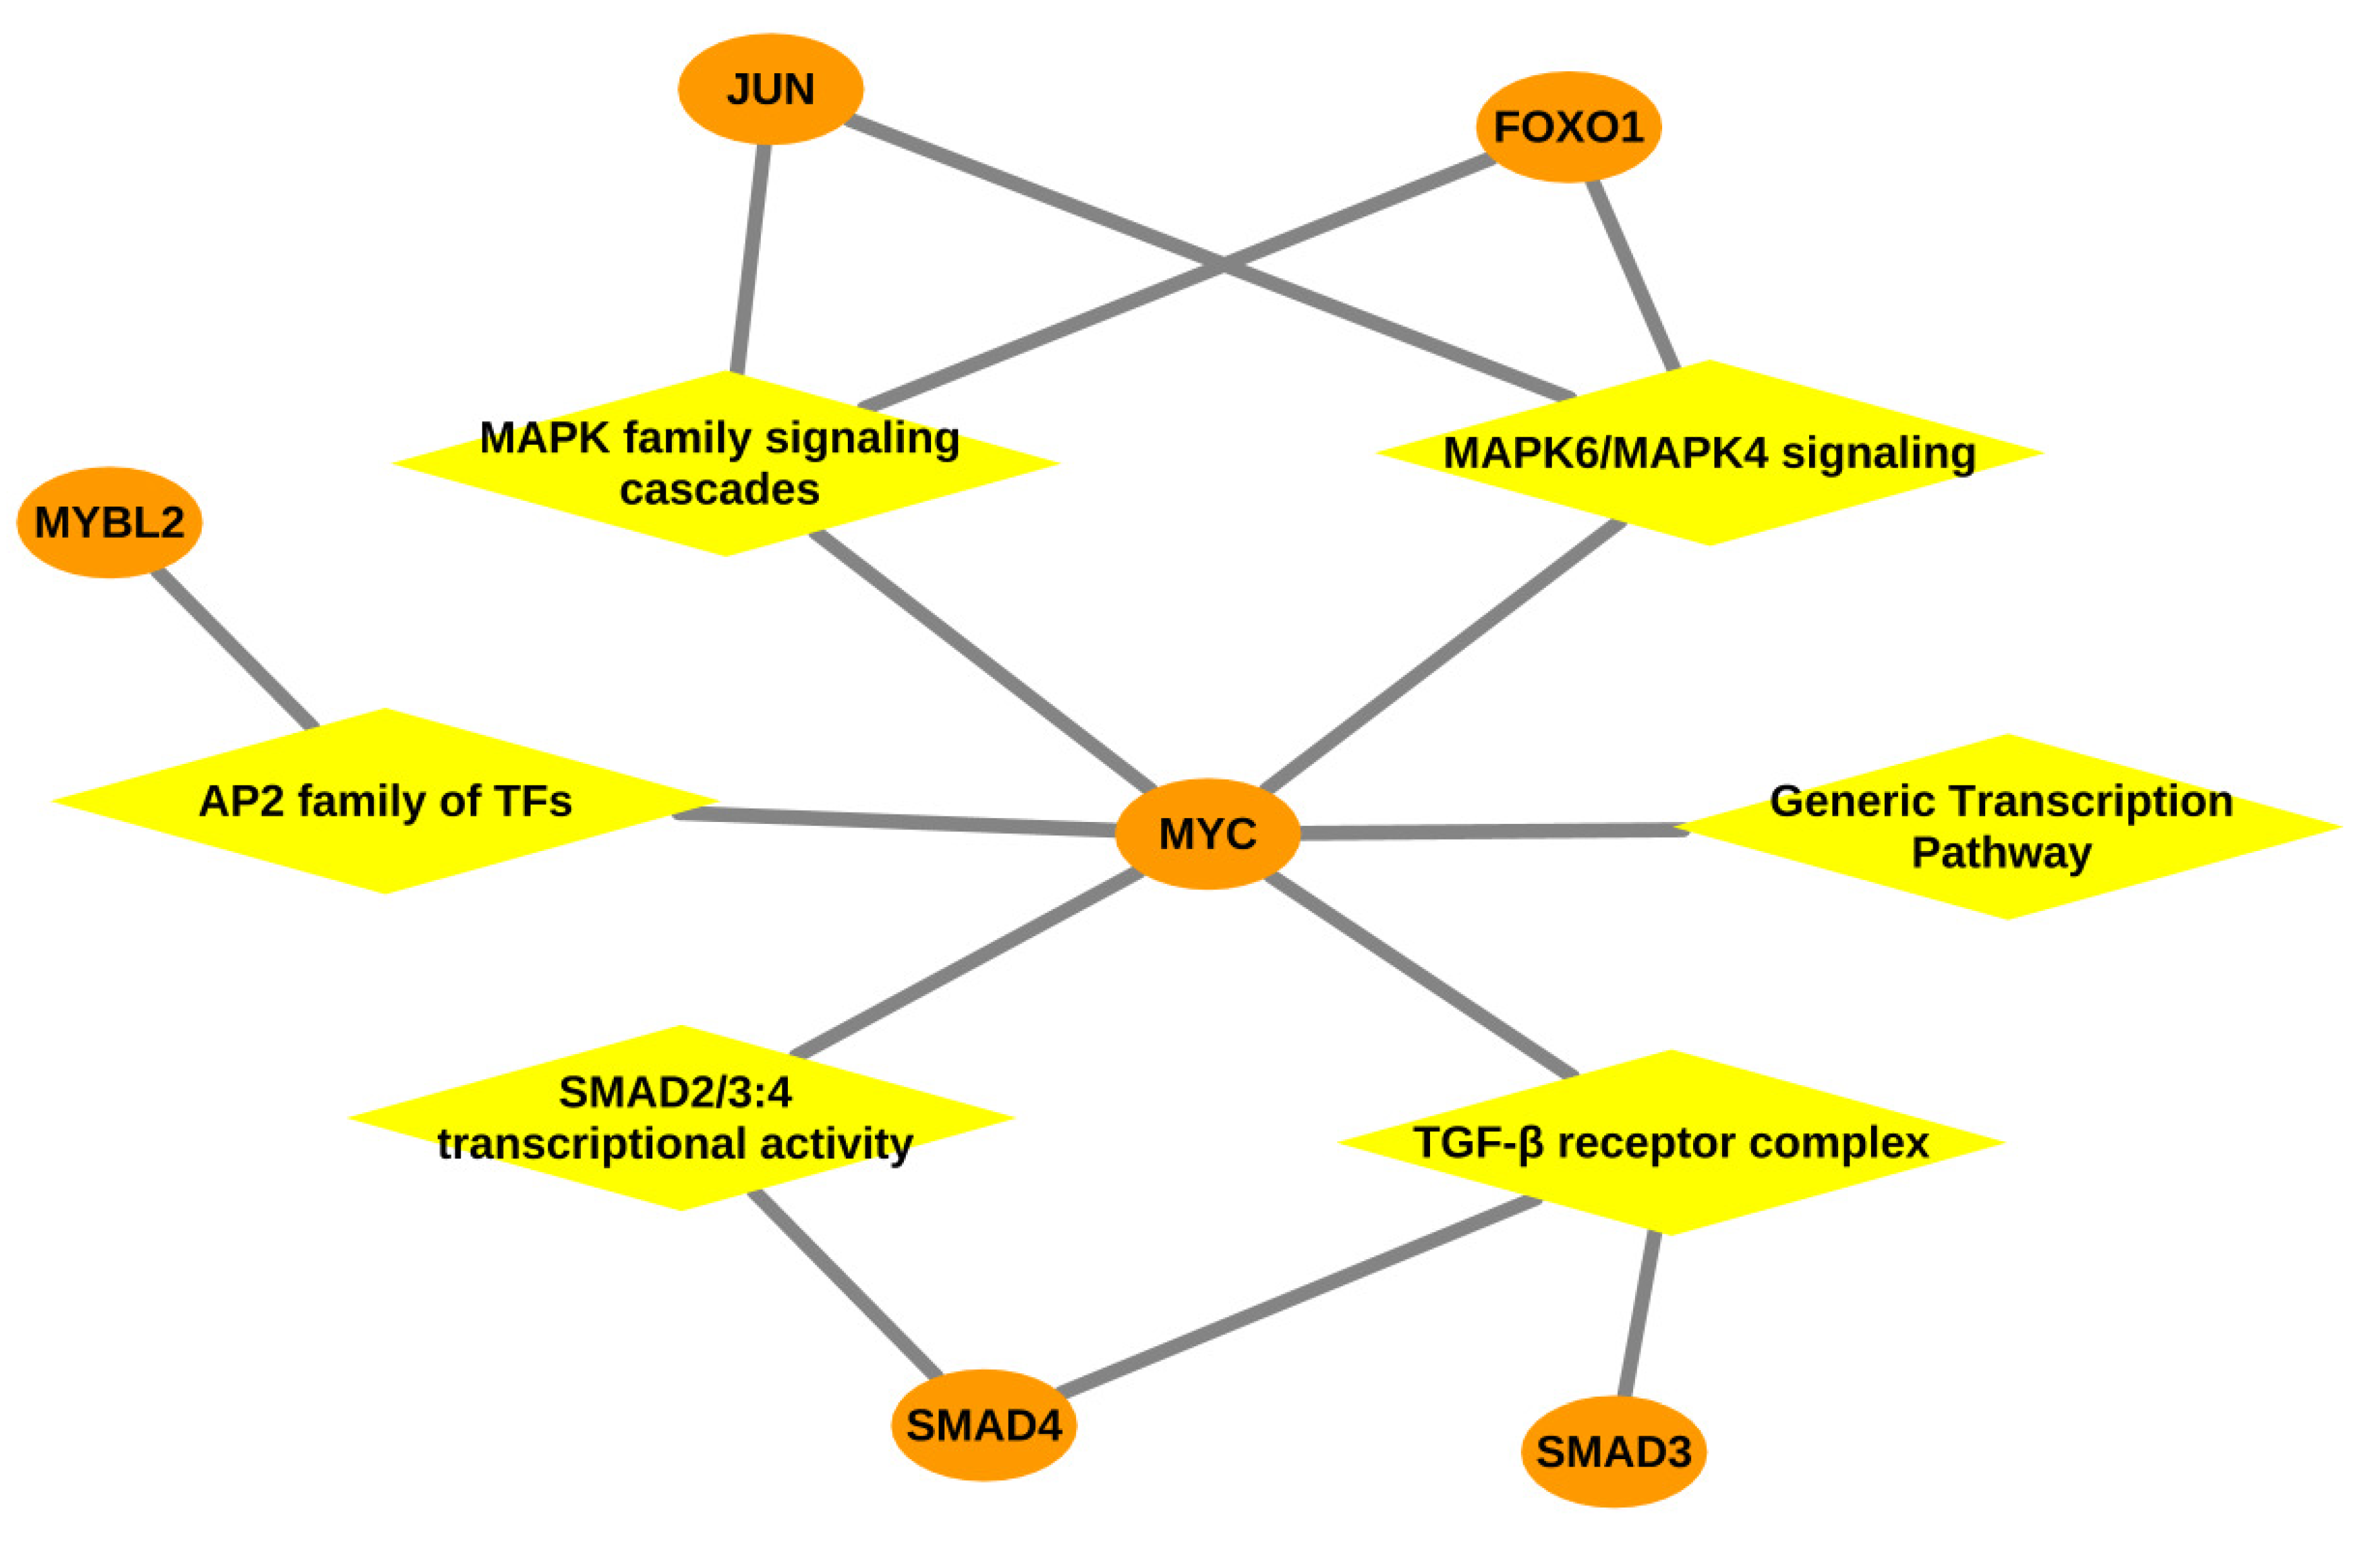
| Signaling by TGF-beta Receptor Complex | Myc, Smad3, Smad4 | 0.0036 | |
| Signaling by TGF-beta family members | Myc, Smad3, Smad4 | 0.0063 | |
| Signaling by NOTCH1 | Hif1a, Myc | 0.0105 | |
| Transcriptional activity of SMAD2/SMAD3:SMAD4 heterotrimer | Myc, Smad4 | 0.0147 | |
| Signaling by NOTCH | Hif1a, Myc | 0.0349 | |
| Interleukin-1 family signaling | Nfkb1, Smad3 | 0.0371 | |
| Cellular Senescence | Fos, Jun | 0.0416 | |
| N’Dama | PTEN Regulation | Atf, Jun | 0.0025 |
| Activation of HOX genes during differentiation | Hoxa4, Jun, Meis1 | 0.0036 | |
| Activation of anterior HOX genes in hindbrain development during early embryogenesis | Hoxa4, Jun, Meis1 | 0.0036 | |
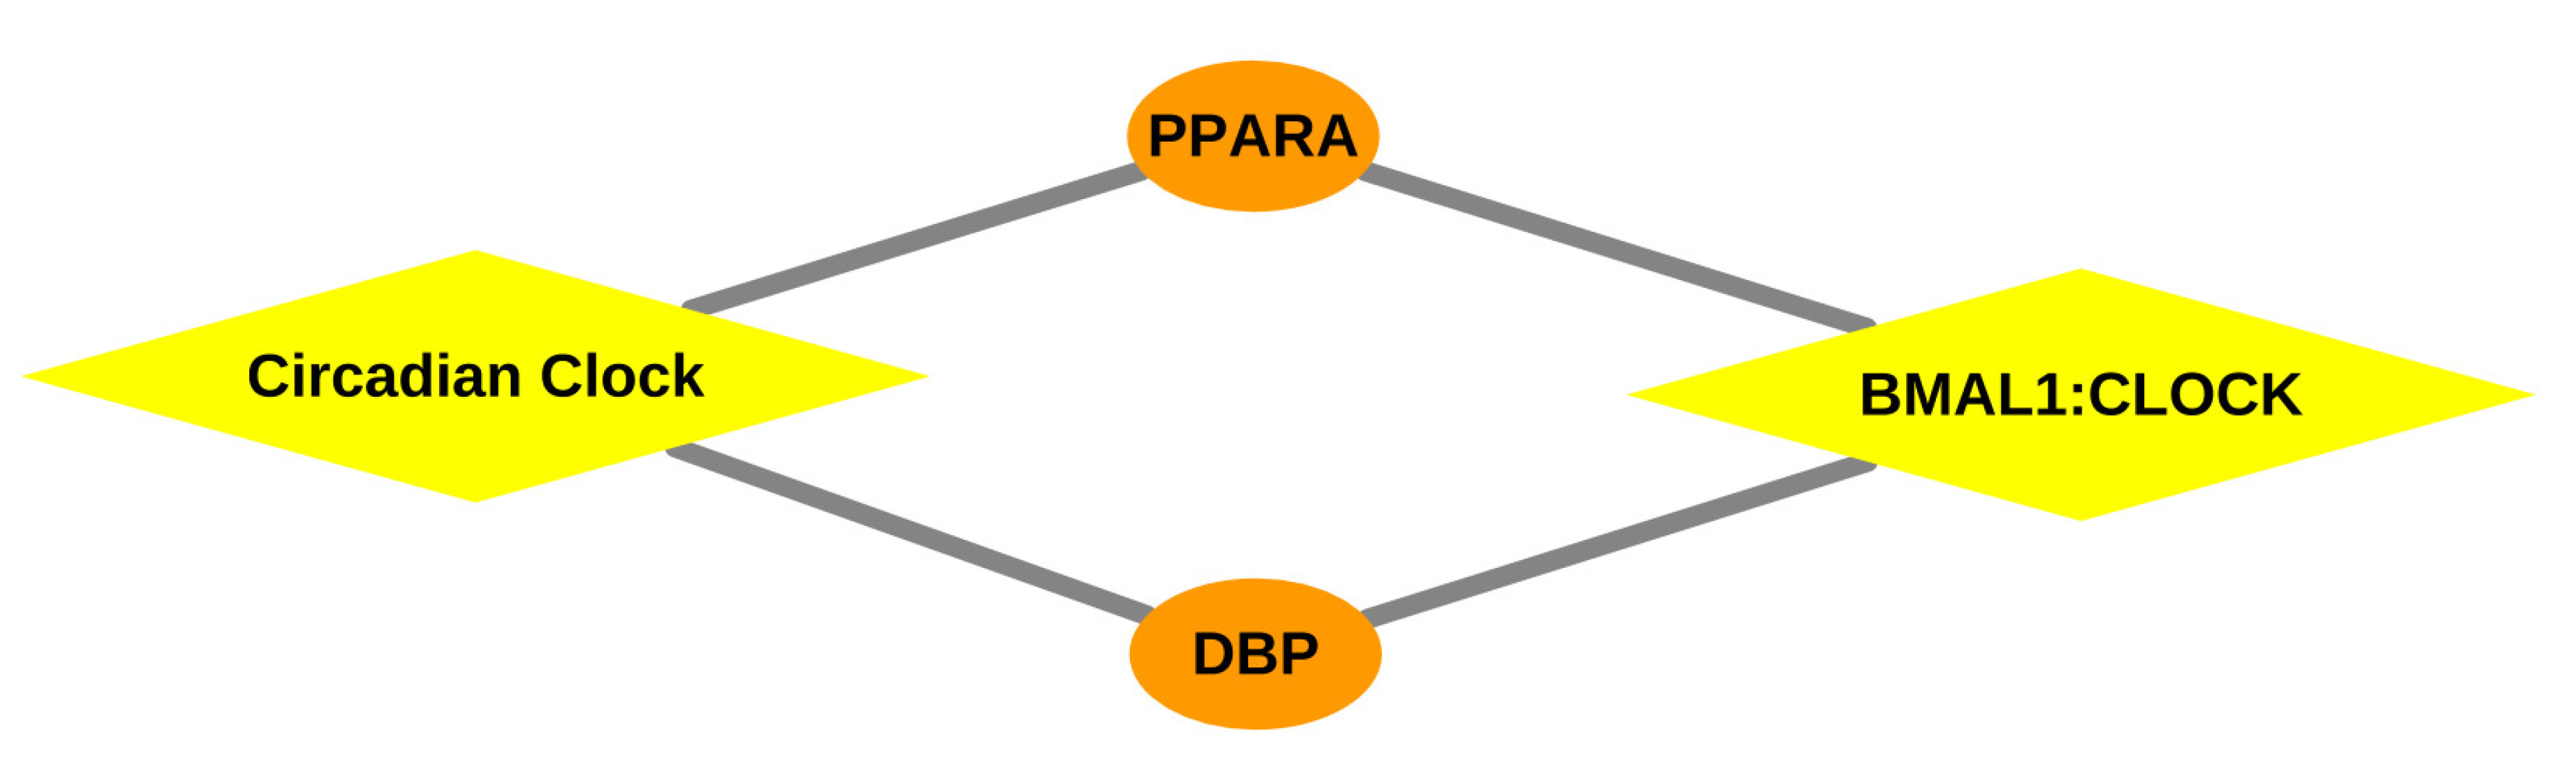
| BMAL1:CLOCK, NPAS2 activates circadian gene expression | Dbp, Ppara | 0.0161 | |
| PIP3 activates AKT signaling | Atf, Jun | 0.0229 | |
| Transcriptional regulation of pluripotent stem cells | Pbx1, Pou5f1 | 0.0229 | |
| Intracellular signaling by second messengers | Atf2, Jun | 0.0280 | |
| Transcriptional regulation by RUNX2 | Sox9, Stat1 | 0.0364 | |
| Transcriptional regulation of white adipocyte differentiation | Pparg, Rxra | 0.0424 | |
| Circadian Clock | Dbp, Ppara | 0.0488 | |
| Spleen | |||
|---|---|---|---|
| Pathway Name | Hit Names | Adjusted p-Value | |
| Boran | POU5F1 (OCT4), SOX2, NANOG activate genes related to proliferation | Pou5f1, Stat3 | 0.0034 |
| N’Dama | Oxidative Stress Induced Senescence | Fos, Jun | 0.0033 |
| BMAL1:CLOCK NPAS2 activates circadian gene expression | Dbp, Ppara | 0.0052 | |
| MAPK6/MAPK4 signaling | Foxo1, Jun | 0.0052 | |
| Signaling by NOTCH3 | Hes1, Pbx1 | 0.0052 | |
| Cellular responses to stress | Fos, Hsf1, Jun | 0.0062 | |
| Fc epsilon receptor (FCERI) signaling | Fos, Jun | 0.0067 | |
| Cellular responses to external stimuli | Fos, Hsf1, Jun | 0.0135 | |
| MAPK family signaling cascades | Foxo1, Jun | 0.0166 | |
| Circadian Clock | Dbp, Ppara | 0.0166 | |
| Signaling by NOTCH | Hes1, Pbx1 | 0.0203 | |
| Generic Transcription Pathway | E2f1, Hes1, Sox9, Stat1, Tead1 | 0.0243 | |
| Cellular Senescence | Fos, Jun | 0.0243 | |
| RNA Polymerase II Transcription | E2f1, Hes1, Sox9, Stat1, Tead1 | 0.0350 | |
| Regulation of lipid metabolism by Peroxisome proliferator-activated receptor alpha (PPARalpha) | PPara, Rxra | 0.0432 | |
| Lymph Node | |||
|---|---|---|---|
| Pathway Name | Hit Names | Adjusted p-Value | |
| Boran | MAP kinase activation in TLR cascade | Atf1, Atf2, Fos, Jun, Nfkb1 | 2.37 |
| Interleukin-17 signaling | Atf1, Atf2, Fos, Jun, Nfkb1 | 1.83 × 10 | |
| MAPK targets/ Nuclear events mediated by MAP kinases | Atf1, Atf2, Fos, Jun | 3.66 × 10 | |
| MyD88 cascade initiated on plasma membrane | Atf1, Atf2, Fos, Jun, Nfkb1 | 5.54 × 10 | |
| MyD88 dependent cascade initiated on endosome | Atf1, Atf2, Fos, Jun, Nfkb1 | 7.62 × 10 | |
| MyD88:Mal cascade initiated on plasma membrane | Atf1, Atf2, Fos, Jun, Nfkb1 | 1.03 × 10 | |
| MyD88-independent TLR4 cascade | Atf1, Atf2, Fos, Jun, Nfkb1 | 2.27 × 10 | |
| Toll Like Receptor 3 (TLR3) Cascade | Atf1, Atf2, Fos, Jun, Nfkb1 | 2.88 × 10 | |
| Toll-Like Receptors Cascades | Atf1, Atf2, Fos, Jun, Nfkb1 | 4.39 × 10 | |
| MAPK6/MAPK4 signaling | Foxo1, Jun, Myc | 4.66 × 10 | |
| Innate Immune System | Atf1, Atf2, Fos, Jun, Ltf, Nfkb1 | 9.27 × 10 | |
| Signaling by Interleukins | Atf1, Atf2, Fos, Jun, Nfkb1, Stat1, Stat3 | 0.0010 | |
| PTEN Regulation | Atf2, Jun | 0.0016 | |
| MAPK family signaling cascades | Foxo1, Jun, Myc | 0.0028 | |
| Oxidative Stress Induced Senescence | Fos, Jun | 0.0069 | |
| Cytokine Signaling in Immune system | Atf1, Atf2, Fos, Jun, Nfkb1, Stat1, Stat3 | 0.0081 | |
| Fc epsilon receptor (FCERI) signaling | Fos, Jun | 0.0138 | |
| PIP3 activates AKT signaling | Atf2, Jun | 0.0154 | |
| Transcriptional activity of SMAD2/SMAD3:SMAD4 heterotrimer | Myc, Smad4 | 0.0171 | |
| NGF signalling via TRKA from the plasma membrane | Atf1, Stat3 | 0.0171 | |
| Intracellular signaling by second messengers | Atf2, Jun | 0.0189 | |
| Immune System | Atf1, Atf2, Fos, Jun, Ltf, Nfkb1, Relb, Stat1, Stat3 | 0.0241 | |
| Transcriptional regulation by the AP-2 (TFAP2) family of transcription factors | Mybl2, Myc | 0.0311 | |
| Generic Transcription Pathway | E2f1, Mybl2, Myc, Smad4, Sox9, Stat1 | 0.0338 | |
| Mitotic G2-G2/M phases | Foxm1, Mybl2 | 0.0381 | |
| Mitotic G1-G1/S phases | E2f1, Mybl2 | 0.0381 | |
| Interleukin-1 family signaling | Nfkb1, Stat3 | 0.0430 | |
| Signaling by TGF-beta Receptor Complex | Myc, Smad4 | 0.0456 | |
| Cellular Senescence | Fos, Jun | 0.0482 | |
| N’Dama | POU5F1 (OCT4), SOX2, NANOG activate genes related to proliferation | Pou5f1, Stat3 | 0.0042 |
| BMAL1:CLOCK, NPAS2 activates circadian gene expression | Dbp, Ppara | 0.0078 | |
| Circadian Clock | Dbp, Ppara | 0.0244 | |
| Factors involved in megakaryocyte development and platelet production | Irf1, Irf2 | 0.0354 | |
| Interleukin-12 family signaling | Stat1, Stat3 | 0.0375 | |
Publisher’s Note: MDPI stays neutral with regard to jurisdictional claims in published maps and institutional affiliations. |
© 2021 by the authors. Licensee MDPI, Basel, Switzerland. This article is an open access article distributed under the terms and conditions of the Creative Commons Attribution (CC BY) license (http://creativecommons.org/licenses/by/4.0/).
Share and Cite
Rajavel, A.; Schmitt, A.O.; Gültas, M. Computational Identification of Master Regulators Influencing Trypanotolerance in Cattle. Int. J. Mol. Sci. 2021, 22, 562. https://doi.org/10.3390/ijms22020562
Rajavel A, Schmitt AO, Gültas M. Computational Identification of Master Regulators Influencing Trypanotolerance in Cattle. International Journal of Molecular Sciences. 2021; 22(2):562. https://doi.org/10.3390/ijms22020562
Chicago/Turabian StyleRajavel, Abirami, Armin Otto Schmitt, and Mehmet Gültas. 2021. "Computational Identification of Master Regulators Influencing Trypanotolerance in Cattle" International Journal of Molecular Sciences 22, no. 2: 562. https://doi.org/10.3390/ijms22020562