Article

Cytological Observations and Bulked-Segregant Analysis Coupled Global Genome Sequencing Reveal Two Genes Associated with Pollen Fertility in Tetraploid Rice

1
State Key Laboratory for Conservation and Utilization of Subtropical Agro-Bioresources, South China Agricultural University, Guangzhou 510642, China
2
Guangdong Provincial Key Laboratory of Plant Molecular Breeding, South China Agricultural University, Guangzhou 510642, China
3
College of Agriculture, South China Agricultural University, Guangzhou 510642, China
4
Guangdong Laboratory for Lingnan Modern Agriculture, South China Agricultural University, Guangzhou 510642, China
*
Authors to whom correspondence should be addressed.
These authors contributed equally to this work.
Int. J. Mol. Sci. 2021, 22(2), 841; https://doi.org/10.3390/ijms22020841
Submission received: 12 December 2020 / Revised: 11 January 2021 / Accepted: 12 January 2021 / Published: 15 January 2021
(This article belongs to the Section Molecular Plant Sciences)

Abstract

:
Neo-tetraploid rice with high fertility is a useful germplasm for polyploid rice breeding, which was developed from the crossing of different autotetraploid rice lines. However, little information is available on the molecular mechanism underlying the fertility of neo-tetraploid rice. Here, two contrasting populations of tetraploid rice, including one with high fertility (hereafter referred to as JG) and another with low fertility (hereafter referred to as JD), were generated by crossing Huaduo 3 (H3), a high fertility neo-tetraploid rice that was developed by crossing Jackson-4x with 96025-4x, and Huajingxian74-4x (T452), a low fertility autotetraploid rice parent. Cytological, global genome sequencing-based bulked-segregant (BSA-seq) and CRISPR/Cas9 technology were employed to study the genes associated with pollen fertility in neo-tetraploid rice. The embryo sacs of JG and JD lines were normal; however, pollen fertility was low in JD, which led to scarce fertilization and low seed setting. Cytological observations displayed low pollen fertility (25.1%) and approximately 31.3 and 27.2% chromosome lagging at metaphase I and II, and 28.8 and 24.8% chromosome straggling at anaphase I and II in JD, respectively. BSA-seq of F2–3 generations and RNA-seq of F4 generation detected a common fragment, i.e., 18,915,234–19,500,000, at chromosome 7, which was comprised of 78 genes associated with fertility. Among 78 genes, 9 genes had been known to be involved in meiosis and pollen development. Two mutants ny1 (LOC_Os07g32406) and ny2 (LOC_Os07g32040) were generated by CRISPR/Cas9 knockout in neo-tetraploid rice, and which exhibited low pollen fertility and abnormal chromosome behavior. Our study revealed that two unknown genes, LOC_Os07g32406 (NY1) and LOC_Os07g32040 (NY2) play an important role in pollen development of neo-tetraploid rice and provides a new perspective about the genetic mechanisms of fertility in polyploid rice.

1. Introduction

Polyploid species are widely found in plants and had higher economic value and confers greater stress resistance than diploid plants [1,2,3]. Polyploids showed stronger short-term adaptive potential during environmental change due to changes in gene expression and increased genetic diversity [3,4,5]. Autotetraploid rice was derived from diploid rice by chromosome doubling through colchicine treatment to enrich the breeding germplasm of rice, which showed great biological advantages, stress resistance and high heterosis [6,7,8,9,10]. However, low seed set is a major obstacle in the utilization of autotetraploid rice at commercial level [11,12,13,14].
Recently, two important tetraploid rice germplasms with high seed set and high pollen fertility, named as PMeS and Neo-tetraploid rice, have been developed [9,15]. These two fertile tetraploid germplasms were derived from the progenies of crosses between two intersubspecific autotetraploid rice lines. Up to now, six neo-tetraploid rice lines, including Huaduo1 to Huaduo5 and Huaduo8, have been reported by our research team [9,16,17,18]. These neo-tetraploid lines could overcome autotetraploid rice sterility and produce strong heterosis [9,16,17].
Autotetraploid lines had complicated reproductive defects, including abnormal embryo sac and pollen development, double fertilization, embryogenesis as well as endosperm development. Among these defects, high frequency of abnormal chromosome behaviors in pollen mother cells (PMC) during meiosis is one of the most common defects in autotetraploid rice [6,19]. In particular, the straggled chromosome was a main meiotic defect that led to autotetraploid sterility, including chromosome straggling at metaphase I and metaphase II, and chromosome lagging at anaphase I and anaphase II [6,19]. In contrast, neo-tetraploid lines do not show abnormal chromosomal behavior during meiosis, and hundreds of genes were differentially expressed in meiotic anthers of neo-tetraploid lines relative to autotetraploid lines [9,17,20,21]. Among these genes, the meiotic gene OsMND1, whose homolog plays a meiotic role in yeast and Arabidopsis, could partially improve the seed setting of autotetraploid line Balilla-4x by maintaining the balance of synapsis and recombination [22]. Loss of function of MOF1 increased the percentage of straggled chromosomes in neo-tetraploid line Huaduo1 [22]. However, the molecular foundation of different meiotic process between neo-tetraploids and autotetraploids remained largely unknown.
The strategy of bulked segregant analysis (BSA) proposed by Michelmore et al. [23], provides a simple and more effective approach to rapidly identify candidate genomic regions that underlie the target genes based on whole genome resequencing of bulked populations and both parents [24]. Bulked-segregant analysis coupled with global sequencing (BSA-seq) has been successfully applied to clone genes in plants, including rice [24,25,26,27,28], melon [29], soybean [30,31], tomato [32], chickpea [33,34], cucumber [35], maize [36], Brassica rapa [37], and strawberry [38]. Four sets of chromosomes in autotetraploid and neo-tetraploid rice made it difficult to map genes associated with fertility. BSA-seq is expected to the shorten period of gene identification in neo-tetraploid rice, but its application has not been demonstrated in tetraploid rice.
In the present study, we constructed F2, F3 and F4 populations derived from a cross between a neo-tetraploid line, Huaduo3 (H3), and an autotetraploid line, Huajingxian74-4x (T452). BSA-seq based on F2, F3 and F4 populations was employed to map the meiosis related region. Moreover, we identified deferentially expressed genes between high fertility lines (H3 and JG) and low fertility lines (T452 and JD) from the linkage region. Then, CRISRP/Cas9 was employed to edit the candidate genes in the neo-tetraploid line Huaduo1 (H1). As expected, the mutant lines displayed low seed set, low pollen fertility and high frequency of straggled chromosomes during meiosis. These results reveal two important meiotic genes in neo-tetraploid rice and also provide a foundation for understanding the molecular mechanism for different meiosis processes between neo-tetraploid and autotetraploid rice.

2. Results

2.1. Morphological and Cytological Observations of Bulks (JG and JD) with Different Fertility

To study the molecular foundation of the meiosis process between neo-tetraploid and autotetraploid, two extreme bulks, with high seed set and low seed set, were developed from a cross between a neo-tetraploid line, Huaduo3 (H3), and an autotetraploid line, Huajingxian74-4x (T452) (Figure S1). The high seed set bulk was named as JG, which consisted of 40 F2 plants with more than 80% seed set. The low seed set bulk was named as JD, which also contained 40 F2 plants with less than 30% seed set. JG and JD were self-crossed to generate F3 and F4 generations, while plants with less than 80% seed set in JG and more than 30% in JD were removed from both generations.
JD and T452 displayed significantly lower seed set and pollen fertility than JG and H3 (Figure 1). The seed set of H3, T452, JG and JD were 80.43%, 15.30%, 82.52% and 18.84%, respectively (Table 1, Figure 1). There was no obvious difference in embryo sac fertility among four materials (Table 1). The normal embryo sac frequencies of the JG, JD, H3 and T452 were 93.52%, 85.03%, 91.99%, and 85.24%, respectively. However, abundant stained abortive or typical abortive pollens were found in JD and T452 (Figure 1, Table S1). Pollen fertility of JD (25.08%) and T452 (23.70%) was significantly lower than JG (88.53%) and H3 (87.45%) (Table 1).
Moreover, whole-mount eosin B-staining confocal laser scanning microscopy (WE-CLSM) analysis was also employed to observe the embryogenesis and endosperm development at 3 days after flowering (DAF). In this stage, the primary endosperm nucleus began to enrich the embryo sac, expanding from the apical end to the basal (or chalaza) end and begins to form the endosperm wall, and the embryo starts to undergo cellular differentiation (Figure S2). Some abnormalities were found in these stages, including a small globular-shaped embryo sac, embryo sac degeneration, abnormal position of polar nuclei, multiple polar nuclei in the embryo sac, delayed embryo development, embryo and endosperm abnormality, embryo fertilization stagnates, an unfertilized embryo sac, and a single fertilized egg cell. The normal frequencies of fertilized samples of H3, T452, JG, and JD were 81.97%, 10.96%, 81.90% and 24.86%, respectively (Table 1). These results indicated that T452 and JD displayed defects during double fertilization and embryogenesis.

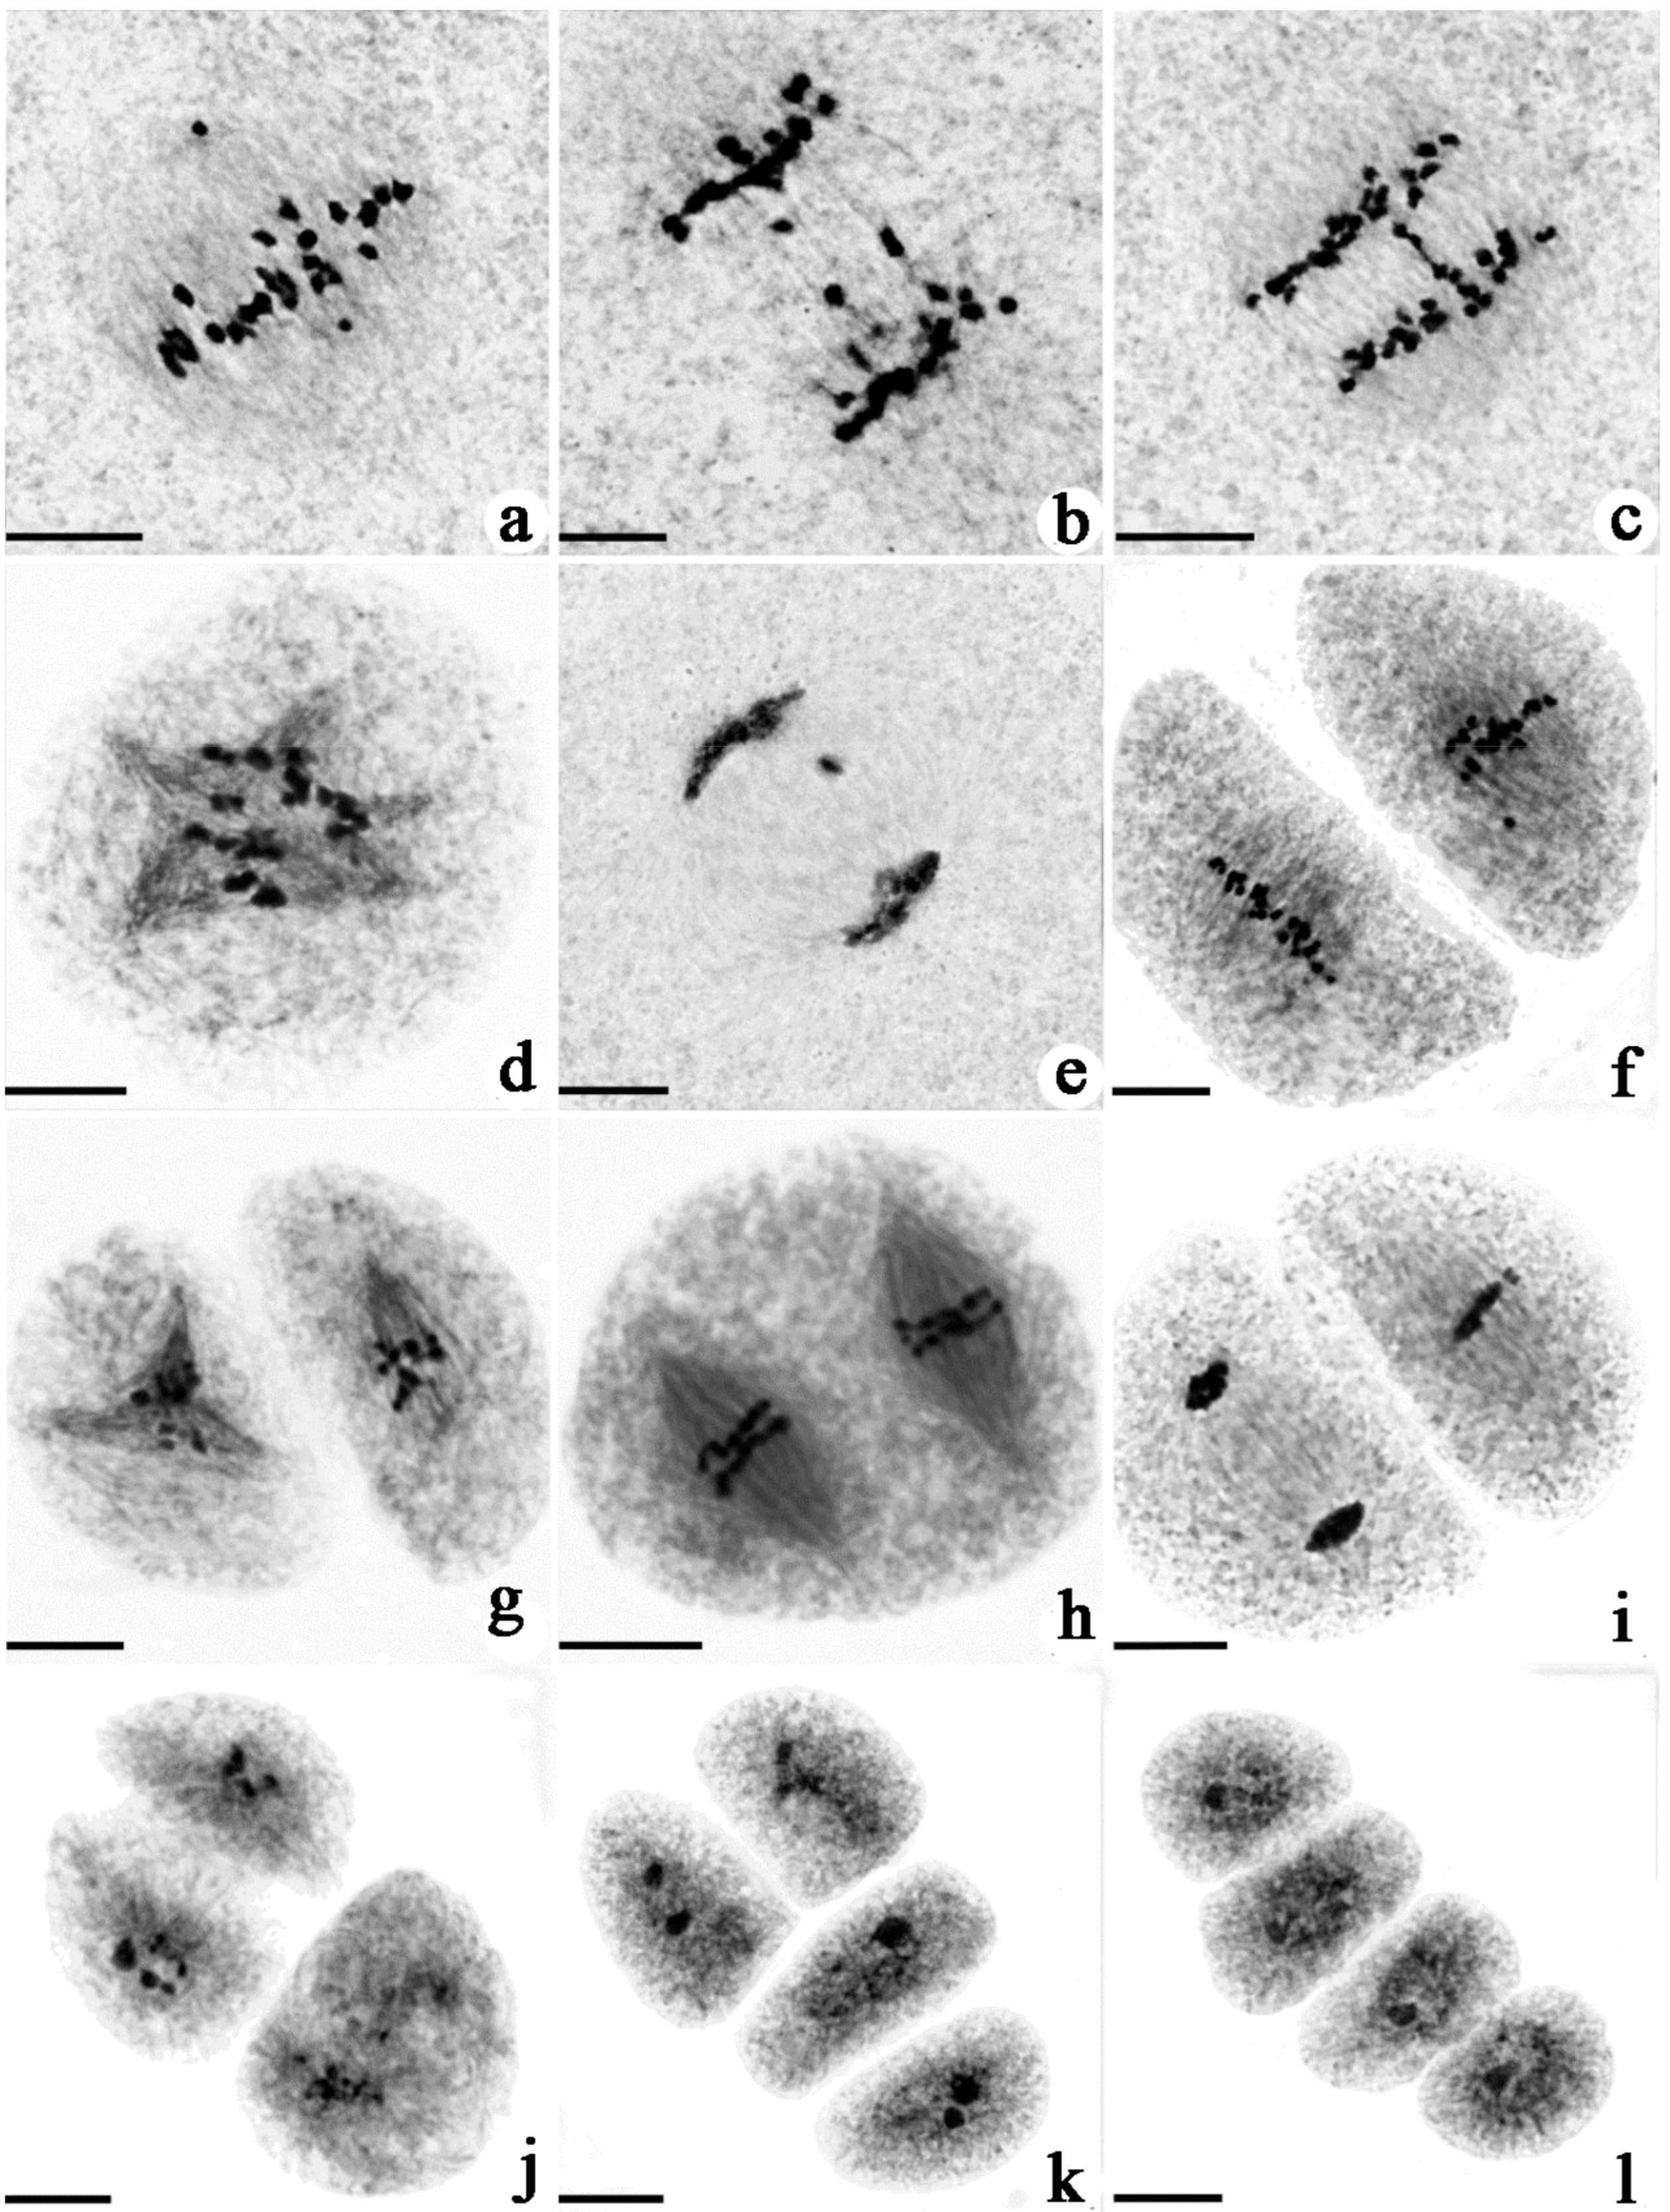
2.2. Comparison of Chromosomal Behavior between H3, T452, JG and JD

To understand the cytological difference between tetraploid rice with different fertility levels, the meiotic chromosomal behavior of PMCs was observed. The meiotic process was similar in H3, T452, JG and JD, which could be divided into nine stages, including prophase I (leptotene, zygotene, pachytene, diplotene, diakinesis), metaphase I, anaphase I, telophase I, prophase II, metaphase II, anaphase II, telophase II, and tetrad (Figure S3). Some chromosomal behavior abnormalities were found in these stages, including chromosome lagging at metaphase, chromosome straggling at anaphase, micronucleus, spindle abnormality, abnormal cell shape and asynchronous division, and abnormal triad shape (Figure 2). Four key meiotic stages—metaphase I, anaphase I, metaphase II, and anaphase II—were selected to summarize the frequency of abnormalities. JG had less abnormal PMCs compared with JD. The frequency of PMCs with abnormal chromosome behavior in JD at metaphase I, anaphase I, metaphase II, and anaphase II were 31.27%, 28.76%, 27.23% and 24.82%, while JG only displayed 16.56%, 8.36%, 2.42% and 2.07% PMCs with abnormalities (Table 1). The above results indicate that the high frequency of abnormal chromosome behavior during PMC meiosis was an important reason for the difference in pollen fertility between JG and JD.

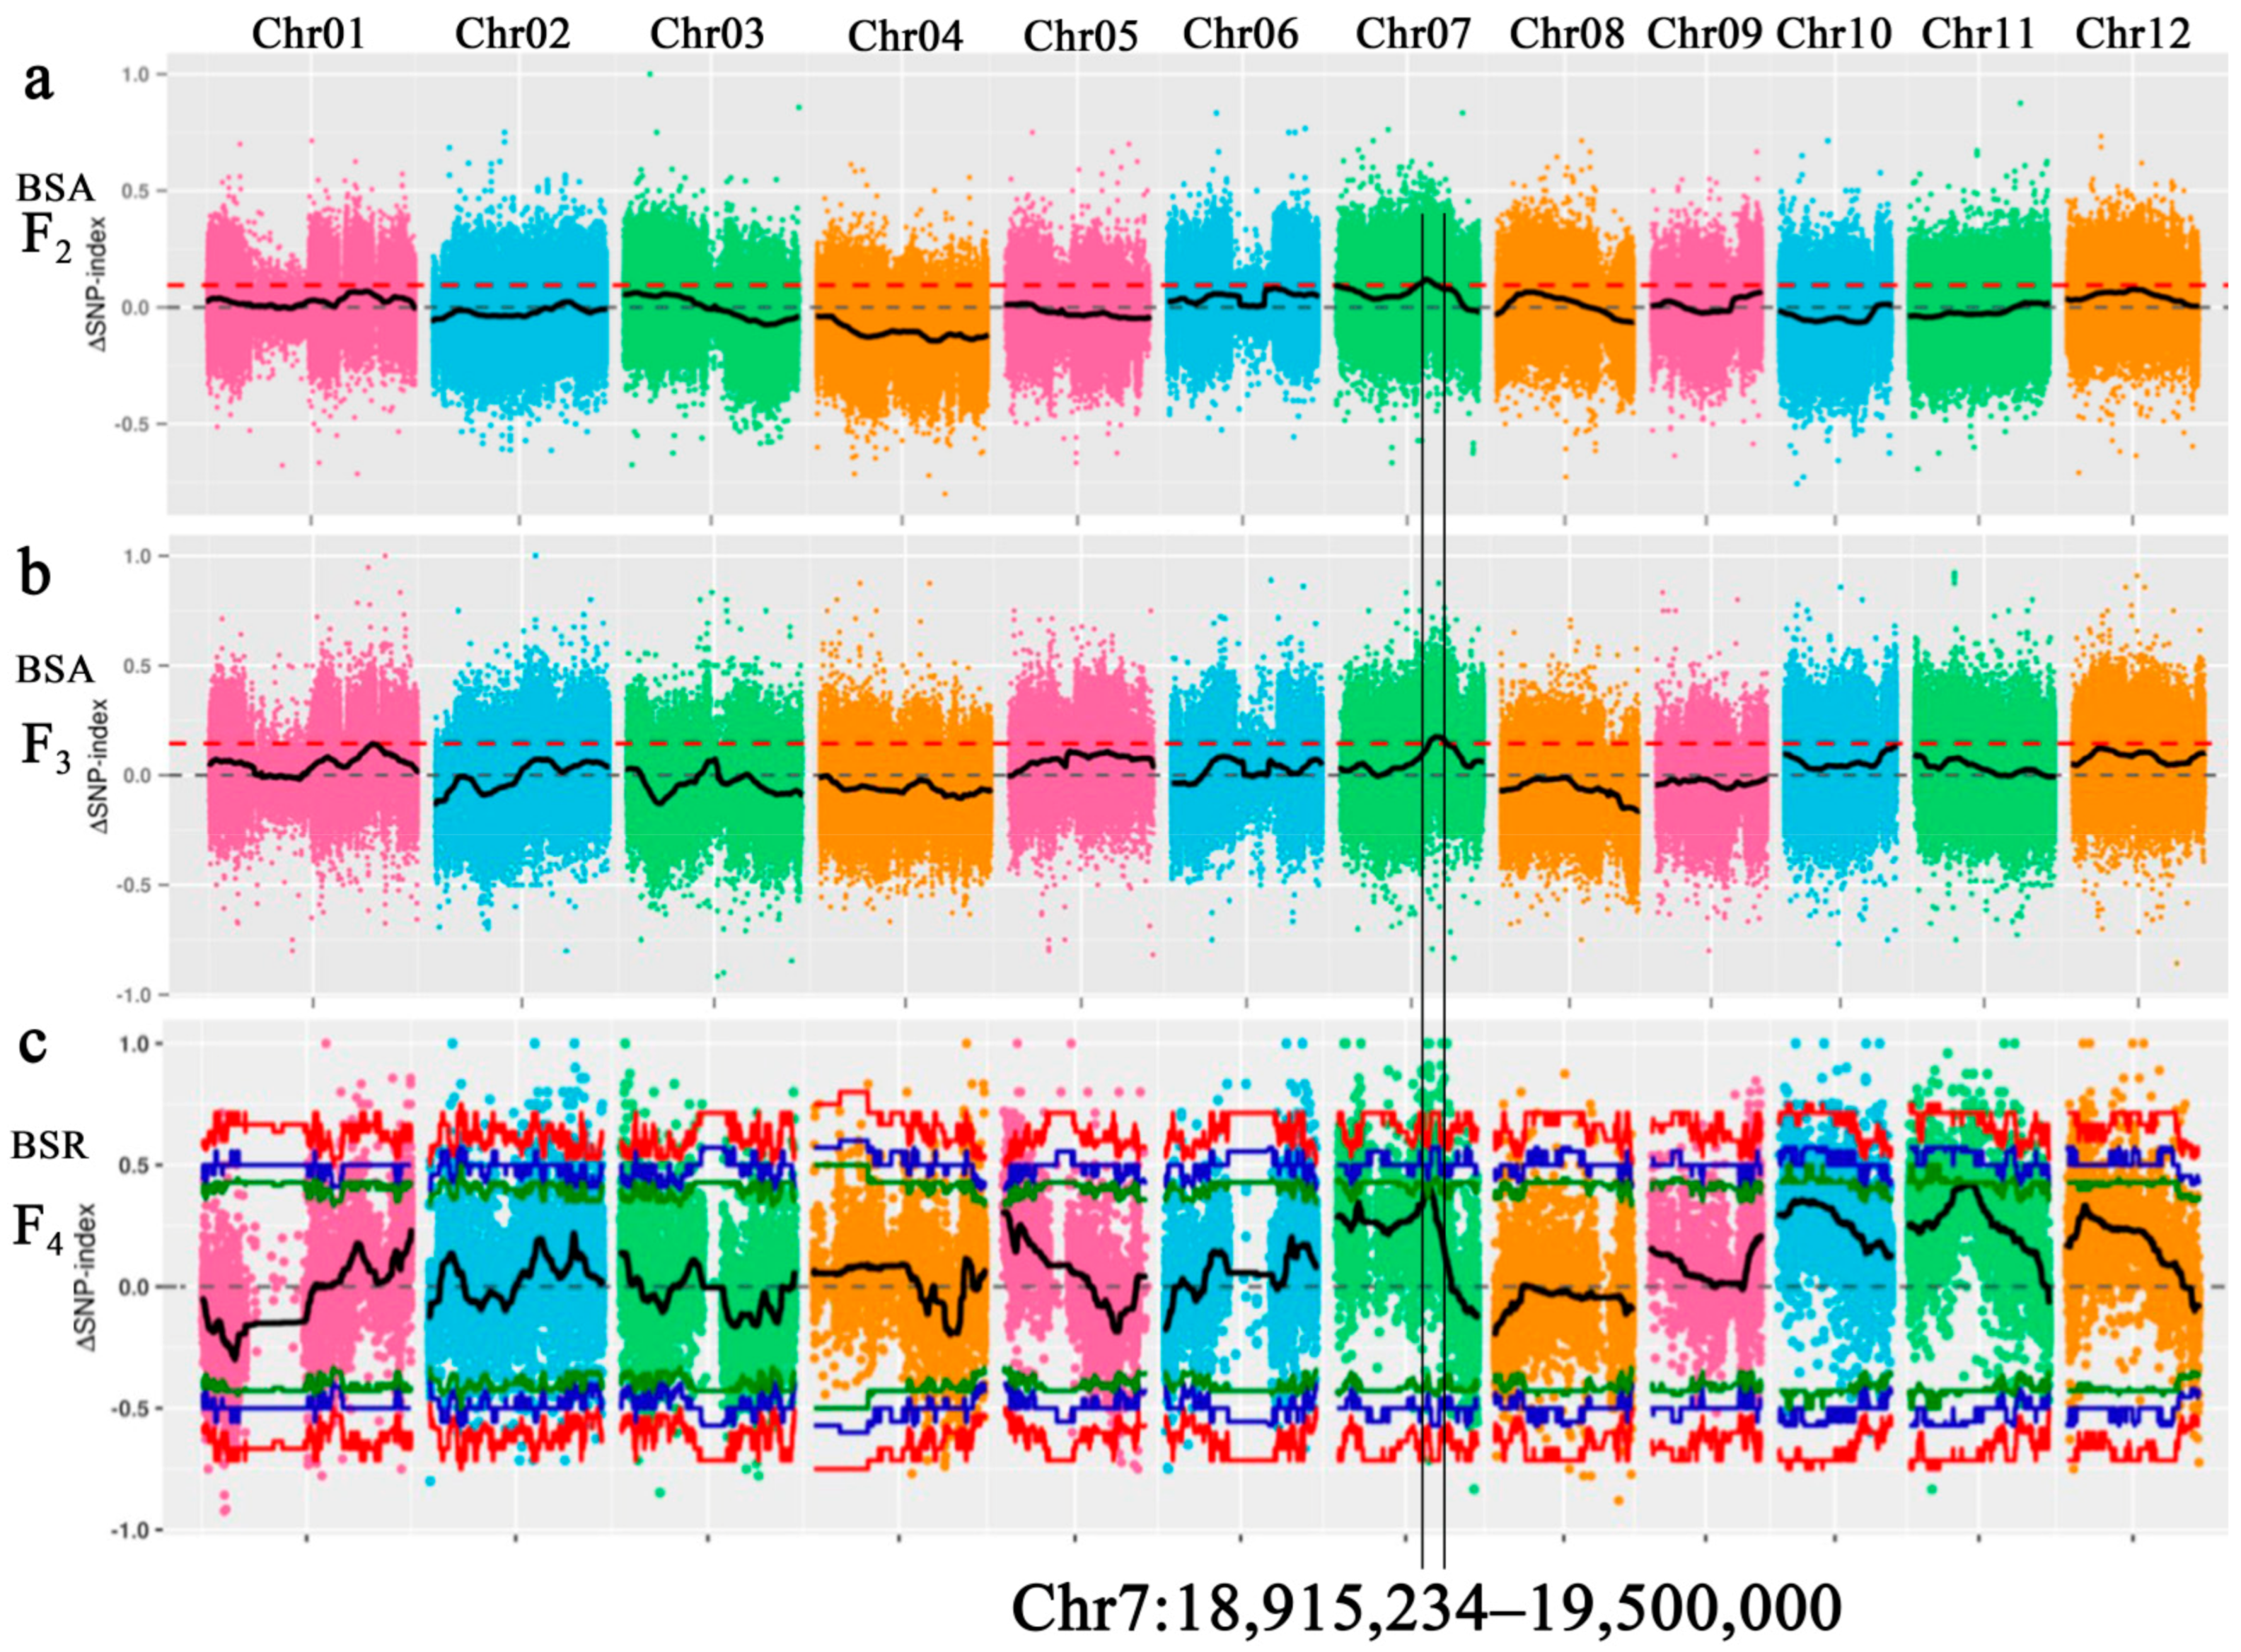
2.3. High Fertility Blocks Identification by BSA-seq and BSR-seq Using JG Bulk, JD Bulk and Their Parents

We obtained high-quality sequencing datasets with high genome coverage and average depth by BSA-seq of F2 generation (Table S2). A total of 11.68 Gb, 11.49 Gb, 33.15 Gb and 33.71 Gb clean data were obtained from H3, T452, JG bulk and JD bulk, respectively. The regions of the four samples mapped onto the reference genome were above 97.80%, the average coverage depths were 23–25 for parents and 73–74 for bulks, and the genome coverage was above 92.11% (Table S2). In total, 3,159,637 single nucleotide polymorphisms (SNPs) and insertions and deletions (InDels) polymorphic loci were identified between H3 and T452, while 2,553,364 polymorphic loci were identified between JG bulk and JD bulk. In F2, a total of 1,346,124 high-quality SNPs were obtained for ΔSNP-index analysis. Correlation analysis mapped one quantitative trait locus (QTL) (ΔSNP-index > 0.09) on chromosome 7 (18,180,000–19,500,000).
BSA-seq of F3 generation also revealed high-quality sequencing datasets as produced by F2 generation (Table S3). The regions of the four samples mapped onto the reference genome were above 98.01%, the average coverage depths were 28–34 for parents and 67 for bulks, and the genome coverage was above 91.86% (Table S3). In total, 3,159,637 polymorphic loci (SNPs and InDels) were identified between H3 and T452, while 2,553,364 polymorphic loci were identified between JG bulk and JD bulk. In F3, a total of 1,343,958 high-quality SNPs were obtained for ΔSNP-index analysis. Correlation analysis mapped three QTLs (ΔSNP-index > 0.14), including two on chromosome 1 (33,900,000–33,900,000, 33,920,000–33,940,000) and one on chromosome 7 (18,450,000–22,140,000).
A total of 6.37 Gb, 6.26 Gb, 45.97 Gb and 31.33 Gb clean data were obtained by bulked segregant RNA-seq (BSR-seq) of F4 generation from H3, T452, JG bulk and JD bulk, respectively. The Q30 base percentage was above 94.02% and the GC content in each sample sequencing data was between 55 and 57% (Table S4). In this generation, 65,202 SNPs were obtained for ΔSNP-index correlation analysis, which mapped two QTLs (ΔSNP-index > 0.90) on chromosome 7 (18,915,234–19,692,348, 19,736,756–19,748,279). Together, the results of BSA-seq and BSR-seq showed that only one high fertility QTL was mapped to the segment 18,915,234–19,500,000 on chromosome 7 (Figure 3).

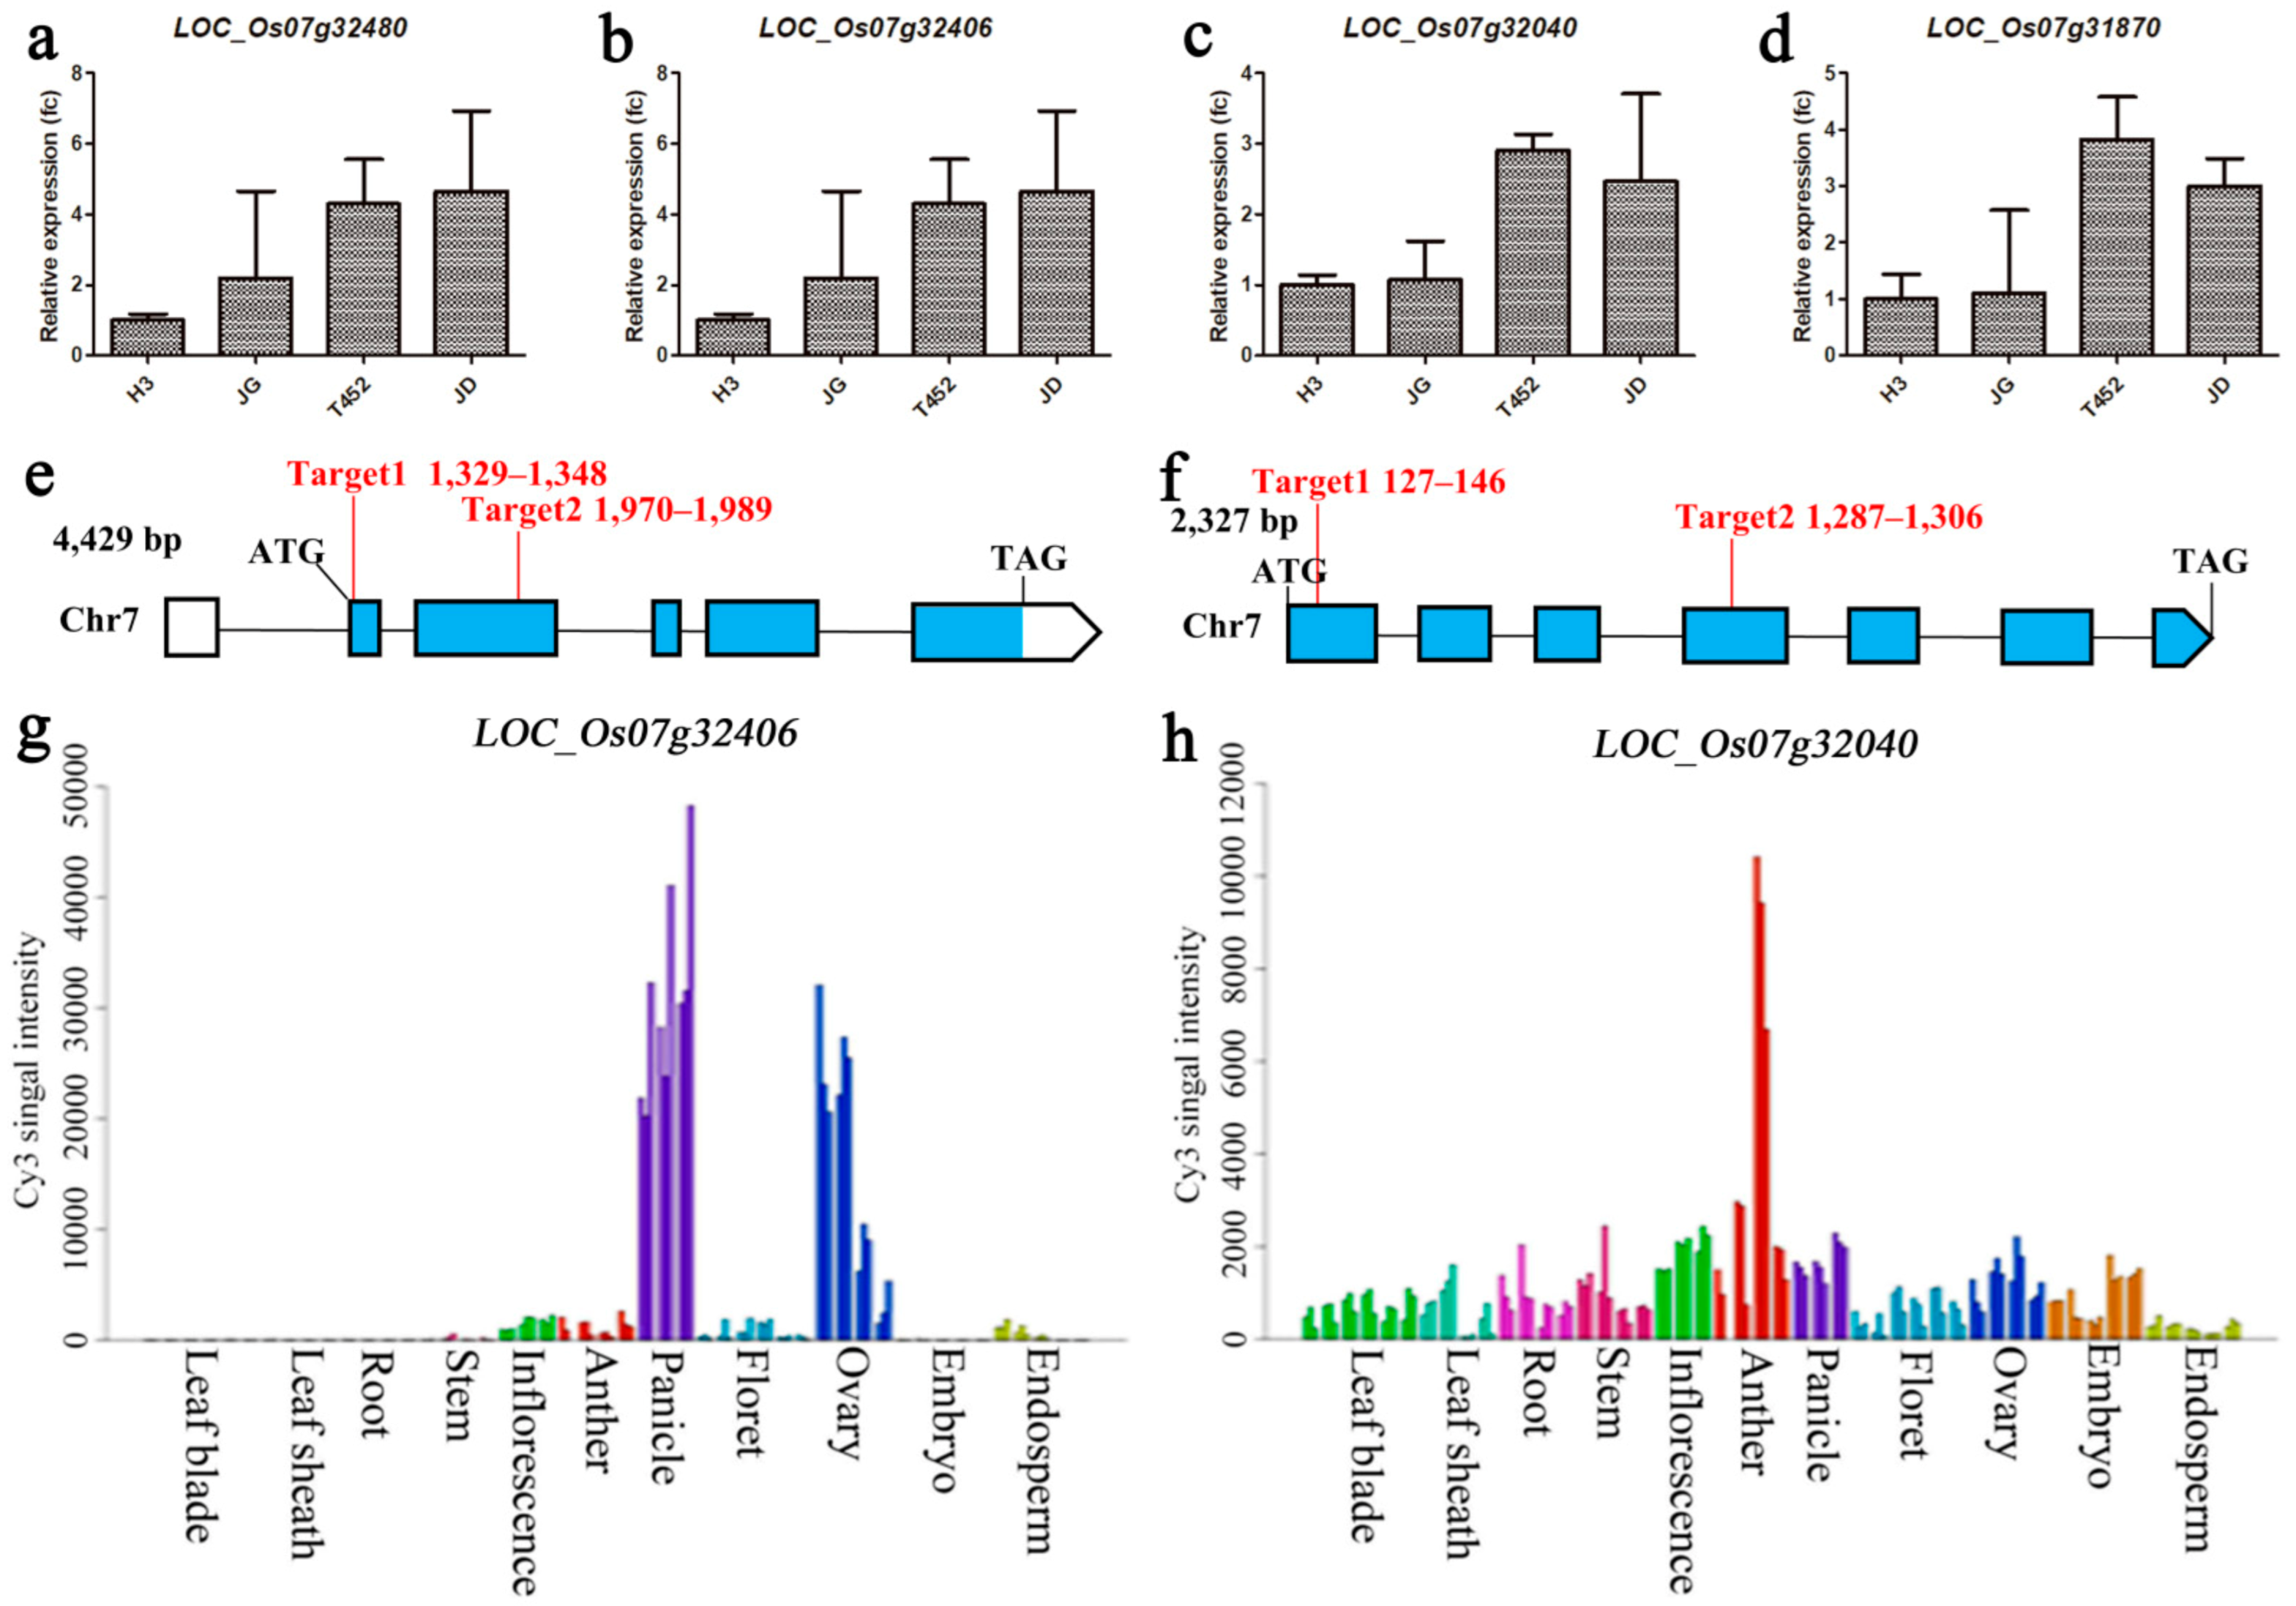
2.4. Expression Analysis of Candidate Genes in High Fertility Blocks

We detected nine genes in high fertility QTL, which were related to pollen mother cell meiosis and pollen fertility, and these nine genes were LOC_Os07g31870, LOC_Os07g32010, LOC_Os07g32020, LOC_Os07g32040, LOC_Os07g32170, LOC_Os07g32406, LOC_Os07g32480, LOC_Os07g32650 and LOC_Os07g32660. To confirm their expression levels in JG, JD and their parents, all nine genes were selected for qRT-PCR analysis at the meiosis stage. LOC_Os07g32480, LOC_Os07g32406, LOC_Os07g32040 and LOC_Os07g31870 showed down-regulation in high fertility materials (H3 and JG) relative to low fertility materials (T452 and JD) (Figure 4a–d).
According to the Rice Genome Annotation Project Database [39], LOC_Os07g32406 is comprised of 4429 base pairs (bp) with six exons and five introns (Figure 4e). The coding sequence consists of 1770 bp and it encodes a protein with 589 amino acids (aa). The LOC_Os07g32406 is designated as NY1 in this study. In gene expression profile analysis by RiceXPro [40], NY1 show high expression level in panicle and ovary (Figure 4g), suggesting that NY1 may play an important role in reproduction.
LOC_Os07g32040 is comprised of 2327 bp with seven exons and six introns (Figure 4f). The coding sequence contained 1311 bp and it encodes a eukaryotic translation initiation factor 3 sub-unit E with 426 aa. The LOC_Os07g32040 is designated as NY2 in this study. NY2 was preferentially expressed during another development (Figure 4h), suggesting that NY2 play an important role in male reproduction.

2.5. Knockout of Two Candidate Genes Causes Pollen Abortion in Neo-Tetraploid Rice

In order to explore the reproductive roles of NY1 and NY2, we generated knockout mutants of NY1 and NY2 in the neo-tetraploid line Huaduo1 by using the CRISPR/Cas9 genome editing system [41]. We obtained at least 34 independently regenerated transgenic plants of NY1 and NY2 after the transformation (Tables S5 and S6). The mutant lines were grown in the field, and the T1 and T2 mutant plants were sequenced (Tables S5 and S6). We further selected the homozygous mutants of Ny1 and Ny2 to observe the pollen fertility and pollen development process.
The ny1 and ny2 (mutant lines) showed normal plant types as well as normal vegetative development (Figure 5a). Phenotypic analysis showed that there were remarkable differences in plant growth or panicle morphology between the mutant lines and the wild type plants (Figure 5). Plant height, panicle length, panicle number, total grain number, and 1000-grain weight were significantly reduced in all mutants compared to their wild-type plants. Grain length and grain width of the mutants were similar to that of wild-type plants. Interestingly, the panicles of ny1 and ny2 showed many unfilled grains, and the seed setting rate of ny1 (43.34%) and ny2 (49.48%) were significantly lower than wild type plant (78.00%). As a consequence, grain yield in the mutants were markedly reduced compared to the wild plants (Table 2). These results revealed potential reproductive defects in ny1 and ny2. The floral developments of ny1 and ny2 were normal (Figure 5d,f), and mature embryo sac fertility of ny1, ny2 and wild type (WT) were higher than 85% (Figure 5g, Table 2), but the pollen fertility of ny1 (38.66%) and ny2 (26.65%) was significantly lower than the pollen fertility of WT (93.05%) (Figure 5c,e, Table 2). These results suggested that the low seed setting in ny1 and ny2 was associated with pollen development.

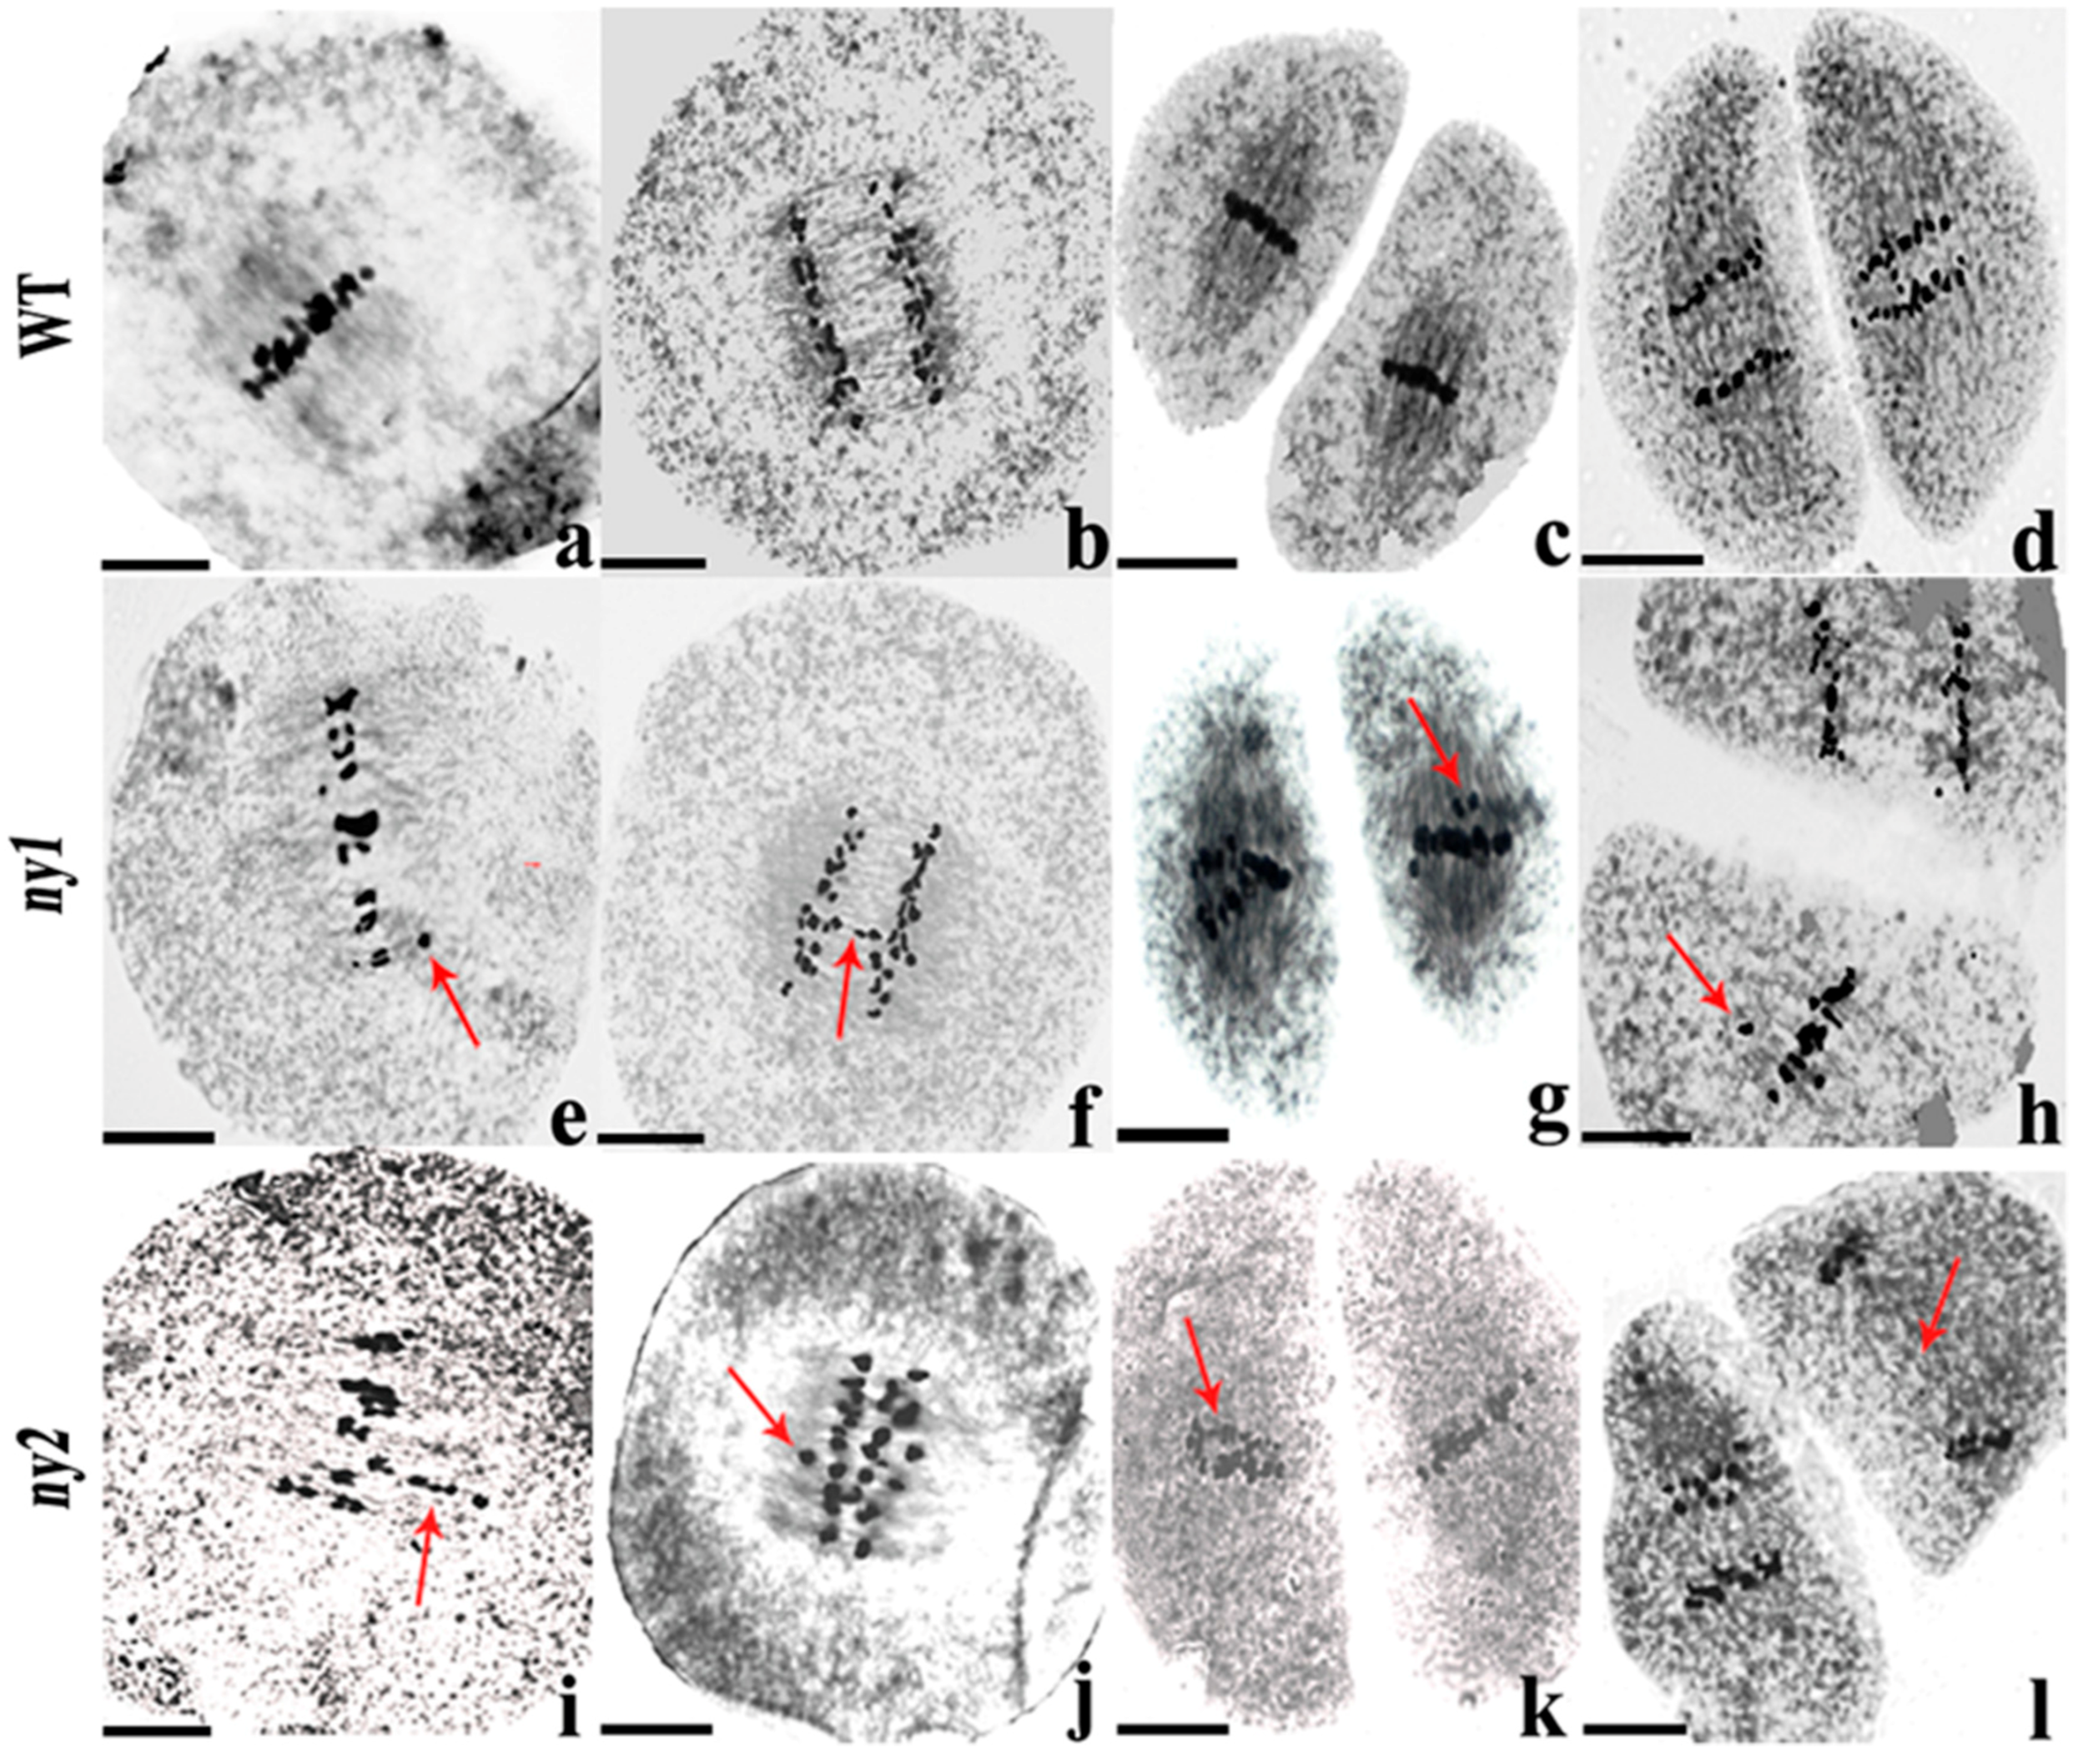
2.6. Analysis of Chromosome Behavior in ny1, ny2 and WT

To study the effects of the NY1 and NY2 genes on plant reproduction, we compared chromosome behavior of meiotic pollen mother cells between ny1, ny2 and WT. We detected few abnormalities in WT plants. However, there were remarkable differences in meiosis process of ny1 and ny2 compared to WT plants. At metaphase I, 64.71% of 561 observed ny1 PMCs and 65.97% of 238 observed ny2 PMCs contained straggling chromosomes, while only 14.66% was found in WT (688). At anaphase I, 66.48% of 179 observed ny1 PMCs and 62.37% of 110 observed ny2 PMCs displayed chromosome lagging, while only 15.83% was found in WT (139). At metaphase II, 71.25% and 90.24% PMCs exhibited chromosome straggling in ny1 and ny2, while only 15.44% was found in WT (149). At anaphase II, 71.69% and 87.23% cells showed chromosome lagging in ny1 and ny2, while 51.35% was found in WT (37). The frequency of PMCs with chromosome behavior abnormalities in ny1 or ny2 were both higher than WT at these observed stages (Table 3, Figure 6). These results indicate that both NY1 and NY2 affect chromosome behavior during meiosis in neo-tetraploid rice.

3. Discussion

3.1. BSA-Seq is an Effective Technique to Identify Genes in Polyploid Plants

BSA-seq is an easy and effective tool to map QTLs associated with complex traits in plants. For example, 3.29 Mb candidate region was mapped in tomato by BSA-seq and five kompetitive allele-specific PCR KASP markers were employed to fine map a gene, Solyc01g007130, associated with leaf mold [32]. In maize, VKS1 was cloned by BSA-seq, which regulates mitosis and cytokinesis during endosperm development [36]. BSA-seq also accelerated the breeding process of rice cultivar with salt-tolerance [24].
Different types of populations were used for cloning genes in diploid plants, including common F2 [24,29,31,32,33,35], BC6F2 [36], BC4F2 [37]. In general, the F2 population is easier to develop and shorten the mapping duration than other populations. However, the ΔSNP-index peak was only higher than 0.09 in our F2 population, which could not distinguish potential QTL from other unlinked regions. Then, we further developed the F3 and F4 generations to perform BSA-seq and interesting results were obtained. The ΔSNP-index peaks were higher than 0.14 and 0.90 in F3 and F4 generations, respectively. These results suggest that F3 and F4 generation populations will be better than common the F2 population to obtain good results in polyploid plants. Similarly, the 2.45 Mb region associated with flower color was identified in Brassica juncea (allopolyploid) by using BC4 [42]. It is difficult to identify homozygous individuals from the F2 population in autotetraploid plants because of their four groups of homologous chromosomes.
BSA-seq generally maps the QTL at a Mb-level interval, which contains numbers of genes. Fine mapping is still required to be performed by using simple sequence repeat SSR markers [42], KASP markers [32], cleaved amplified polymorphic sequence CAPS markers [32] or specific length amplified fragment sequence SLAF-seq [35]. In addition, combining with expression analysis, such as qRT-PCR, RNA-seq is also helpful for further screening the candidate genes [33,35]. In this study, we combined three generation BSA-seq results to map QTL associated with fertility in a 0.59-Mb candidate region on chromosome 7. We further identified four candidate genes by qRT-PCR from this QTL and two genes were verified to reveal their reproductive roles in meiotic anthers by CRISPR/Cas9. These results suggested that BSA-seq of F3 and F4 progenies have definite advantage to identify fertility related genes in polyploid plants.

3.2. NY1 and NY2 Play Crucial Role in Pollen Mother Cell Meiosis

Meiosis process has a great effect on plant reproductive development, and chromosome behavior and configuration play an important role in pollen development [43,44]. A number of genes that the regulate meiosis process have been identified, such as OsREC8, OsSGO1, ZIP4, HEI10, MRE11, OsDMC1, OsMND1 and MOF1a. Mutants of these meiotic genes caused many chromosome abnormalities during the meiosis process because of abnormal homologous synapsis or double strand break [21,22,45,46,47,48,49,50]. The abnormal meiosis process is one of the most important factors that cause sterility in autotetraploid rice [6,17,51,52,53,54,55]. Here, low fertility lines (JD and T452) showed higher frequency of abnormal chromosome behavior than high fertility lines (JG and H3). The main chromosomal abnormalities include chromosome lagging, chromosome straggling, micronucleus, spindle abnormality, abnormal cell shape and asynchronous division, and abnormal triad shape. These results are consistent with previous studies, who also detected different types of chromosomal abnormalities in low fertility polyploid rice [6,17,18,51,52,53,54,55]
Many research studies have focused on polyploid meiotic defects. ASY1 and ASY3 are associated with meiotic stability and their derived alleles improve meiotic traits in autotetraploid Arabidopsis arenosa. From diploid to autotetraploid or from autotetraploid (low fertility) to neo-tetraploid (high fertility) rice, thousands of genes differentially expressed in meiotic anthers, including many important meiotic genes and tapetal genes like RAD51, SMC2, OsABCG26, PTC1, SSP and DPW [6,9,17,18,19,20,21,56]. Many of these differentially expressed genes (DEGs) were identified as meiosis-related genes, but still functional verifications of most of DEGs are unknown [57,58]. Recently, OsMND1 and MOF1 were found to be associated with meiotic stability in tetraploid rice [21,22]. However, the knowledge about genes/QTLs that regulates meiotic abnormalities in autotetraploid rice is still limited.
Here, we used BSA-seq to map a QTL on Chr7 that associated with meiosis development of tetraploid rice and found four differentially expressed genes in this region. Among these four genes, BRK1 (LOC_Os07g32480) encodes a Bub1-Related Kinase, which is essential for generating proper tension between homologous kinetochores at meiotic metaphase I of rice [59]. Moreover, we produced knock-out mutants of NY1 and NY2, which preferentially expressed in reproductive tissues, by the CRISPR/Cas9 system. Both ny1 and ny2 mutants exhibited significantly low pollen fertility compared to WT plants (neo-tetraploid rice). Loss of function of NY1 or NY2 increased the frequency of PMCs with abnormal chromosomes during the meiosis process, which was consistent with the meiosis process in JD (low fertility bulk). We conferred that the QTL is important to meiotic stability of tetraploid rice and consists of important essential meiotic genes. Our findings provide a foundation to understand the molecular mechanism of meiotic stability in tetraploid rice.

4. Materials and Methods

4.1. Plant Material

A high fertility neo-tetraploid rice line, Huaduo3 (H3), which was developed by crossing Jackson-4x with 96025-4x, was used to generate the F1 hybrid by crossing with a low fertility autotetraploid rice line, Huajingxian74-4x (T452) that was developed from a diploid rice cultivar (Huajingxian74-2x). F2 to F4 populations were obtained from self-fertilization progenies of F1 hybrid. Those plants with more than 80% seed setting were selected to construct JG bulk, while those plants with less than 30% seed set rate were selected to construct JD bulk in each generation. Another neo-tetraploid line, Huaduo1, was used as the receptor during CRISPR/Cas9 transgenesis to generate ny1 and ny2 mutants. All the materials were planted at the experimental farm of South China Agricultural University (SCAU) under natural conditions, and management practices followed the recommendations for the area.

4.2. Cytological Observation

The inflorescences were collected from rice plants with 0 to 4 cm between their flag leaf cushion and the second-to-last leaf cushion, fixed in Carnoy solution (ethanol: acetic acid, 3:1 v/v) for more than 24 h, and then stored in 70% ethanol. Chromosome behavior and configuration were observed and analyzed as described by Chen et al. [17]. Meiosis stages were classified and explained according to He et al. [54].
The pollen fertility was observed according to Ghouri et al. [60]. The mature pollen grains were observed by staining with 1% I2-KI under a microscope (Motic BA200, Lampertheim, Germany).
A whole-mount eosin B-staining confocal laser scanning microscopy (Leica Microsystems, Heidelberg, Germany) was used to investigate the mature embryo sac fertility according to Li et al. [13] with minor modifications. The spikelets of pre-flowering were collected and fixed in a Formaldehyde–Acetic acid–Ethanol solution (70% ethanol: acetic acid: formaldehyde = 18:1:1, v/v) for at least 24 h. Then, the samples were stored in 70% alcohol at 4 °C. The isolated ovaries were hydrated consecutively in 50%, 30%, and 10% ethanol and distilled water for 30 min, respectively. After an eosin B (10 mg/L in 4% sucrose solution) staining procedure for 10 h, the samples were dehydrated sequentially in 10%, 30%, 50%, 70%, 90%, and 100% (three times) alcohol for 30 min, respectively. The dehydrated samples were kept in a methyl salicylate and ethanol solution (1:1, v/v) for 1 h. Finally, the samples were stored in pure methyl salicylate for 1 h and observed under the Leica SPE laser scanning confocal microscope.

4.3. qRT-PCR Analysis of Candidate Gene Expression

A total of nine genes were selected for validation by qRT-PCR. The gene-specific primers (Table S7) were designed using Primer Premier 5.0 software. The total RNA was extracted by AG RNAex Pro Reagent and was reverse-transcribed into cDNA with the Evo M-MLV RT Kit of Accurate Biotechnology (Hunan, China) Co., Ltd. All operations were implemented according to the Kit instructions. The qRT-PCR reaction procedure was performed on the Lightcycler480 system (Roche, Basel, Switzerland) as follows: 30 s at 95 °C, 40 cycles of 95 °C denaturation for 10 s and 60 °C annealing and extension for 30 s. The genes relative expression levels were calculated using the 2−ΔΔCt method [61]. All qRT-PCR reactions were performed in triplicate.

4.4. Mixed Pool Construction and Analysis of Mixed Pool Sequencing Data

Young leaves of H3, T452, F2 plants and F3 plants were collected and were stored at −80 °C. The leaves of 40 F2 plants with high fertility > 80% were mixed to develop JG bulk, while leaves of 40 F2 plants with low fertility < 30% were mixed to develop JD bulk. The same work was repeated in F3 generation. The DNA from leaves of two parents and two bulks of F2 and F3 generations were extracted, and their libraries constructed and sequenced based on the manufacturer’s instructions Illumina HiSeq [62].
In the F4 generation, the meiotic anthers (identified based on spikelet length) from H3, T452, and F4 plants were collected. A total of 90 anthers were independently extracted from each plant, quick-frozen in liquid nitrogen, and stored at −80 °C. Similar to F2 and F3 generation, the F4 plants with high (>80%) and low fertility (<30%) were designated as JG and JD bulk, respectively. The anthers from 20 plants of each H3, T452, JG, and JD were mixed to construct a pool. The mixed anther samples were sent to Biomark Biotechnology Co., Ltd. for RNA extraction, libraries construction and sequencing based on the manufacturer’s instructions Illumina HiSeq [62].
The quality of the original reads (paired-end sequences) obtained by sequencing were evaluated and low-quality reads were filtered. The obtained clean reads were used for subsequent bioinformatics analysis. Aligned clean reads were mapped onto the MSU7 reference genome [63]. The GATK software was used to identify SNPs and InDels [64], and the SnpEff software was used to annotate the SNPs and InDels [65]. SNP-index and InDel-index were calculated to identify the candidate regions associated with fertility [66].

4.5. Development and Identification of Mutant Plants in Huaduo1

CRISPR/Cas9 system was used to generate mutation of candidate genes as previously reported [41]. The two targets were designed for each candidate gene to obtain single guide RNA (sgRNA) expression cassettes (U6a and U6b promoters), which were incorporated into the CRISPR/Cas9 vector pLYCRISPR/Cas9Pubi-H. Then, the vectors were transferred into Huaduo1. The target region for each mutant was amplified by PCR, and the segment was subjected to Sanger sequencing. The T2 plants of homozygous mutant were used for phenotypic and genotypic analyses. The sequences of these primers are listed in Table S7.

4.6. Investigation of Agronomic Traits and Data Analysis

Agronomic traits, including plant height, days to 50% flowering, Flag leaf length, Flag leaf width, number of panicles per plant, grain length, grain width, grain length to width ratio, 1000-grain weight, filled grains per plant, total grains per plant, grain yield per plant and seed setting, were investigated. The standard for investigating these agronomic traits was according to the protocols of People’s Republic of China for the registration of a new plant variety Distinctness, Uniformity and Stability (DUS) test guidelines of rice (Guidelines for the DUS test in China, 2012) [9]. A one-way analysis of variance (ANOVA) and Duncan’s multiple range test (DMRT) was used to identify significant (p < 0.05) differences between group averages, using the SPSS 19.0 statistical software.

5. Conclusions

In this study, BSA-seq of F2–3 generations, and RNA-seq of F4 detected a common fragment on chromosome No.7, which is comprised of 78 genes associated with fertility. Among these 78 genes, 9 genes had been known to be involved in meiosis and pollen development. Furthermore, we systematically investigated the embryo sac fertility, pollen fertility and chromosome behavior of JG and JD, and embryo sac fertility of JG and JD lines was found to be normal. However, pollen fertility was low in JD, which led to scarce fertilization and low seed setting. Moreover, Cytological observation displayed higher frequency of abnormal chromosome behaviors during meiosis in JD. Two mutants, NY1 and NY2, associated with meiosis and pollen development were generated and the gene functions were validated using CRISPR/Cas9 gene knockout, and they showed low pollen fertility and abnormal meiosis. Overall, our results provide strong evidence that NY1 and NY2 play a critical role in pollen development of neo-tetraploid rice, which in turn is vital for maintaining rice seed setting. Our findings offer a foundation for understanding the molecular mechanism of meiotic stability in tetraploid rice and provide a new perspective to genetic research of fertility in polyploid rice.

Supplementary Materials

The following are available online at https://www.mdpi.com/1422-0067/22/2/841/s1, Figure S1: Breeding procedure of JG and JD inbred lines, Figure S2: Mature embryo sac of neo-tetraploid inbred lines and their parents and embryo sac at 3 days after flowering (DAF), Figure S3: Normal chromosome behavior during pollen mother cells meiosis in JG, Table S1: Pollen fertility of JG and JD hybrid lines and their parents: title, Table S2: Quality Assessment of Whole Genome Sequencing in F2 Generation Mixed Pool, Table S3: Quality Assessment of whole genome sequencing of mixed pool in F3 Generation, Table S4: Quality evaluation of transcriptome sequencing in F4 generation pool, Table S5: Mutation results of T0 knockout ny1 and ny2 by CRISPR/Cas9, Table S6: Mutation results of T1 knockout ny1 and ny2 by CRISPR/Cas9, Table S7: List of primers used in this study.

Author Contributions

X.L. and M.Q.S. conceived and designed the experiments. N.K., Z.L., M.Q.S., Y.J. and X.L. wrote the paper. N.K., Y.J., Z.L, K.D.A. and J.W. performed the experiment and analyzed the data. X.L. and Y.J. developed the neo-tetraploid and autotetraploid rice. All authors read and approved the final version of manuscript. All authors have read and agreed to the published version of the manuscript.

Funding

This work was supported by the National Natural Science Foundation of China (NSFC) to M.Q.S. (32050410294), the Opening Foundation of State Key Laboratory for Conservation and Utilization of Subtropical Agro-Bioresources (202006) and the Key Realm R&D Program of Guangdong Province (2018B020202012).

Institutional Review Board Statement

Not applicable.

Informed Consent Statement

Not applicable.

Data Availability Statement

Not applicable.

Acknowledgments

The authors thank Shuhong Yu and other lab members for assistance.

Conflicts of Interest

The authors declare that they have no competing interests.

Abbreviations

BSABulked segregant analysis
DAFDays after flowering
DGEsDifferentially expressed genes
qRT-PCRQuantitative real-time polymerase chain reaction
PMCsPollen mother cells
QTLQuantitative trait locus
WE-CLSMWhole-mount eosin B-staining confocal laser scanning microscopy
WTWild type

References

  1. Barker, M.S.; Arrigo, N.; Baniaga, A.E.; Li, Z.; Levin, D.A. On the relative abundance of autopolyploids and allopolyploids. New Phytol. 2016, 210, 391–398. [Google Scholar] [CrossRef] [PubMed]
  2. Gebhardt, C.; Valkonen, J.P. Organization of genes controlling disease resistance in the potato genome. Annu. Rev. Phytopathol. 2001, 39, 79–102. [Google Scholar] [CrossRef] [PubMed]
  3. Van De Peer, Y.; Mizrachi, E.; Marchal, K. The evolutionary significance of polyploidy. Nat. Rev. Genet. 2017, 18, 411–424. [Google Scholar] [CrossRef] [PubMed]
  4. Soltis, D.E.; Albert, V.A.; Leebens-Mack, J.; Bell, C.D.; Paterson, A.H.; Zheng, C.; Sankoff, D.; De Pamphilis, C.W.; Wall, P.K.; Soltis, P.S. Polyploidy and angiosperm diversification. Am. J. Bot. 2009, 96, 336–348. [Google Scholar] [CrossRef] [PubMed] [Green Version]
  5. Wendel, J.F. Genome evolution in polyploids. Plant Mol. Biol. 2000, 42, 225–249. [Google Scholar] [CrossRef] [PubMed]
  6. Wu, J.; Shahid, M.Q.; Guo, H.; Yin, W.; Chen, Z.; Wang, L.; Liu, X.-D.; Lu, Y.-G. Comparative cytological and transcriptomic analysis of pollen development in autotetraploid and diploid rice. Plant Reprod. 2014, 27, 181–196. [Google Scholar] [CrossRef]
  7. Shahid, M.Q.; Liu, G.; Li, J.; Naeem, M.; Liu, X.-D. Heterosis and gene action study of agronomic traits in diploid and autotetraploid rice. Acta Agric. Scand. Sect. B: Plant Soil Sci. 2011, 61, 23–32. [Google Scholar] [CrossRef]
  8. Shahid, M.Q.; Xu, H.; Lin, S.; Chen, Z.; Naeem, M.; Li, Y.; Liu, X. Genetic analysis and hybrid vigor study of grain yield and other quantitative traits in autotetraploid rice. Pak. J. Bot. 2012, 44, 237–246. [Google Scholar]
  9. Guo, H.; Mendrikahy, J.N.; Xie, L.; Deng, J.; Lu, Z.; Wu, J.; Li, X.; Shahid, M.Q.; Liu, X. Transcriptome analysis of neo-tetraploid rice reveals specific differential gene expressions associated with fertility and heterosis. Sci. Rep. 2017, 7, 40139. [Google Scholar] [CrossRef] [Green Version]
  10. Koide, Y.; Kuniyoshi, D.; Kishima, Y. Fertile Tetraploids: New Resources for Future Rice Breeding? Front. Plant Sci. 2020, 11, 1231. [Google Scholar] [CrossRef]
  11. Wu, J.; Shahid, M.Q.; Chen, L.; Chen, Z.; Wang, L.; Liu, X.-D.; Lu, Y. Polyploidy Enhances F1 Pollen Sterility Loci Interactions That Increase Meiosis Abnormalities and Pollen Sterility in Autotetraploid Rice. Plant Physiol. 2015, 169, 2700–2717. [Google Scholar] [CrossRef] [PubMed] [Green Version]
  12. Shahid, M.Q.; Li, Y.; Saleem, M.F.; Naeem, M.; Wei, C.; Liu, X. Yield and yield components in autotetraploid and diploid rice genotypes (indica and japonica) sown in early and late seasons. Aust. J. Crop Sci. 2013, 7, 632–641. [Google Scholar]
  13. Li, X.; Shahid, M.Q.; Xiang, L.; Lu, Z.; Fang, N.; Wang, L.; Wu, J.; Chen, Z.; Liu, X.-D. Analysis of small RNAs revealed differential expressions during pollen and embryo sac development in autotetraploid rice. BMC Genom. 2017, 18, 129. [Google Scholar] [CrossRef] [Green Version]
  14. Shahid, M.Q.; Sun, J.; Wei, C.; Zhang, P.; Liu, X. Studies on the abnormality of embryo sac and pollen fertility in autotetraploid rice during different growing seasons. Pak. J. Bot. 2010, 42, 7–19. [Google Scholar]
  15. Cai, D.; Chen, J.; Chen, D.; Dai, B.; Zhang, W.; Song, Z.; Yang, Z.; Du, C.; Tang, Z.; He, Y.; et al. The breeding of two polyploid rice lines with the characteristic of polyploid meiosis stability. Sci. China Ser. C Life Sci. 2007, 50, 356–366. [Google Scholar] [CrossRef]
  16. Ghaleb, M.A.A.; Li, C.; Shahid, M.Q.; Yu, H.; Liang, J.; Chen, R.; Wu, J.; Liu, X.-D. Heterosis analysis and underlying molecular regulatory mechanism in a wide-compatible neo-tetraploid rice line with long panicles. BMC Plant Biol. 2020, 20, 1–15. [Google Scholar] [CrossRef] [Green Version]
  17. Chen, L.; Yuan, Y.; Wu, J.; Chen, Z.; Wang, L.; Shahid, M.Q.; Liu, X.-D. Carbohydrate metabolism and fertility related genes high expression levels promote heterosis in autotetraploid rice harboring double neutral genes. Rice 2019, 12, 1–20. [Google Scholar] [CrossRef] [Green Version]
  18. Bei, X.; Shahid, M.Q.; Wu, J.; Chen, Z.; Wang, L.; Liu, X.-D. Re-sequencing and transcriptome analysis reveal rich DNA variations and differential expressions of fertility-related genes in neo-tetraploid rice. PLoS ONE 2019, 14, e0214953. [Google Scholar] [CrossRef] [Green Version]
  19. Li, X.; Yu, H.; Jiao, Y.; Shahid, M.Q.; Wu, J.; Liu, X.-D. Genome-wide analysis of DNA polymorphisms, the methylome and transcriptome revealed that multiple factors are associated with low pollen fertility in autotetraploid rice. PLoS ONE 2018, 13, e0201854. [Google Scholar] [CrossRef]
  20. Wu, J.; Chen, Y.; Lin, H.; Chen, Y.; Yu, H.; Lu, Z.; Li, X.; Zhou, H.; Chen, Z.; Liu, X.-D. Comparative Cytological and Transcriptome Analysis Revealed the Normal Pollen Development Process and up-Regulation of Fertility-Related Genes in Newly Developed Tetraploid Rice. Int. J. Mol. Sci. 2020, 21, 7046. [Google Scholar] [CrossRef]
  21. Lu, Z.; Guo, X.; Huang, Z.; Xia, J.; Li, X.; Wu, J.; Yu, H.; Shahid, M.Q.; Liu, X.-D. Transcriptome and Gene Editing Analyses Reveal MOF1a Defect Alters the Expression of Genes Associated with Tapetum Development and Chromosome Behavior at Meiosis Stage Resulting in Low Pollen Fertility of Tetraploid Rice. Int. J. Mol. Sci. 2020, 21, 7489. [Google Scholar] [CrossRef]
  22. Xiong, Y.; Gan, L.; Hu, Y.; Sun, W.; Zhou, X.; Song, Z.; Zhang, X.; Li, Y.; Yang, Z.; Xu, W.; et al. OsMND1 regulates early meiosis and improves the seed set rate in polyploid rice. Plant Growth Regul. 2019, 87, 341–356. [Google Scholar] [CrossRef]
  23. Michelmore, R.W.; Paran, I.; Kesseli, R.V. Identification of markers linked to disease-resistance genes by bulked segregant analysis: A rapid method to detect markers in specific genomic regions by using segregating populations. Proc. Natl. Acad. Sci. USA 1991, 88, 9828–9832. [Google Scholar] [CrossRef] [Green Version]
  24. Takagi, H.; Tamiru, M.; Abe, A.; Yoshida, K.; Uemura, A.; Yaegashi, H.; Obara, T.; Oikawa, K.; Utsushi, H.; Kanzaki, E.; et al. MutMap accelerates breeding of a salt-tolerant rice cultivar. Nat. Biotechnol. 2015, 33, 445–449. [Google Scholar] [CrossRef]
  25. Takagi, H.; Abe, A.; Yoshida, K.; Kosugi, S.; Natsume, S.; Mitsuoka, C.; Uemura, A.; Utsushi, H.; Tamiru, M.; Takuno, S.; et al. QTL-seq: Rapid mapping of quantitative trait loci in rice by whole genome resequencing of DNA from two bulked populations. Plant J. 2013, 74, 174–183. [Google Scholar] [CrossRef]
  26. Yan, W.; Chen, Z.; Lu, J.; Xu, C.; Xie, G.; Li, Y.; Deng, X.W.; He, H.; Tang, X. Simultaneous Identification of Multiple Causal Mutations in Rice. Front. Plant Sci. 2017, 7, 2055. [Google Scholar] [CrossRef] [Green Version]
  27. Fekih, R.; Takagi, H.; Tamiru, M.; Abe, A.; Natsume, S.; Yaegashi, H.; Sharma, S.; Sharma, S.; Kanzaki, H.; Matsumura, H.; et al. MutMap+: Genetic Mapping and Mutant Identification without Crossing in Rice. PLoS ONE 2013, 8, e68529. [Google Scholar] [CrossRef]
  28. Abe, A.; Kosugi, S.; Yoshida, K.; Natsume, S.; Takagi, H.; Kanzaki, H.; Matsumura, H.; Yoshida, K.; Mitsuoka, C.; Tamiru, M.; et al. Genome sequencing reveals agronomically important loci in rice using MutMap. Nat. Biotechnol. 2012, 30, 174–178. [Google Scholar] [CrossRef] [Green Version]
  29. Li, B.; Zhao, Y.; Zhu, Q.; Zhang, Z.; Fan, C.; Amanullah, S.; Gao, P.; Luan, F. Mapping of powdery mildew resistance genes in melon (Cucumis melo L.) by bulked segregant analysis. Sci. Hortic. 2017, 220, 160–167. [Google Scholar] [CrossRef]
  30. Song, J.; Li, Z.; Liu, Z.; Guo, Y.; Qiu, L.-J. Next-Generation Sequencing from Bulked-Segregant Analysis Accelerates the Simultaneous Identification of Two Qualitative Genes in Soybean. Front. Plant Sci. 2017, 8, 919. [Google Scholar] [CrossRef] [Green Version]
  31. Zhong, C.; Sun, S.; Li, Y.; Duan, C.; Zhu, Z. Next-generation sequencing to identify candidate genes and develop diagnostic markers for a novel Phytophthora resistance gene, RpsHC18, in soybean. Theor. Appl. Genet. 2017, 131, 525–538. [Google Scholar] [CrossRef]
  32. Liu, G.; Zhao, T.; You, X.; Jiang, J.; Li, J.; Xu, X. Molecular mapping of the Cf-10 gene by combining SNP/InDel-index and linkage analysis in tomato (Solanum lycopersicum). BMC Plant Biol. 2019, 19, 15. [Google Scholar] [CrossRef] [Green Version]
  33. Das, S.; Singh, M.; Srivastava, R.; Bajaj, D.; Saxena, M.S.; Rana, J.C.; Bansal, K.C.; Tyagi, A.K.; Parida, S.K. mQTL-seq delineates functionally relevant candidate gene harbouring a major QTL regulating pod number in chickpea. DNA Res. 2015, 23, 53–65. [Google Scholar] [CrossRef] [Green Version]
  34. Singh, V.K.; Khan, A.W.; Jaganathan, D.; Thudi, M.; Roorkiwal, M.; Takagi, H.; Garg, V.; Kumar, V.; Chitikineni, A.; Gaur, P.M.; et al. QTL-seq for rapid identification of candidate genes for 100-seed weight and root/total plant dry weight ratio under rainfed conditions in chickpea. Plant Biotechnol. J. 2016, 14, 2110–2119. [Google Scholar] [CrossRef]
  35. Liang, D.; Chen, M.; Qi, X.; Xu, Q.; Zhou, F.; Chen, X. QTL Mapping by SLAF-seq and Expression Analysis of Candidate Genes for Aphid Resistance in Cucumber. Front. Plant Sci. 2016, 7, 1–8. [Google Scholar] [CrossRef] [Green Version]
  36. Huang, Y.; Wang, H.; Huang, X.; Wang, Q.; Wang, J.; An, D.; Li, J.; Wang, W.; Wu, Y. Maize VKS1 Regulates Mitosis and Cytokinesis During Early Endosperm Development. Plant Cell 2019, 31, 1238–1256. [Google Scholar] [CrossRef] [Green Version]
  37. Wang, Y.; Xiao, L.; Guo, S.; An, F.; Du, D. Fine Mapping and Whole-Genome Resequencing Identify the Seed Coat Color Gene in Brassica rapa. PLoS ONE 2016, 11, e0166464. [Google Scholar] [CrossRef] [Green Version]
  38. Luo, H.; Dai, C.; Li, Y.; Feng, J.; Liu, Z.; Kang, C. Reduced Anthocyanins in Petioles codes for a GST anthocyanin transporter that is essential for the foliage and fruit coloration in strawberry. J. Exp. Bot. 2018, 69, 2595–2608. [Google Scholar] [CrossRef] [Green Version]
  39. Ouyang, S.; Zhu, W.; Hamilton, J.; Lin, H.; Campbell, M.; Childs, K.; Thibaud-Nissen, F.; Malek, R.L.; Lee, Y.; Zheng, L.; et al. The TIGR Rice Genome Annotation Resource: Improvements and new features. Nucleic Acids Res. 2006, 35, D883–D887. [Google Scholar] [CrossRef] [Green Version]
  40. Sato, Y.; Antonio, B.A.; Namiki, N.; Takehisa, H.; Minami, H.; Kamatsuki, K.; Sugimoto, K.; Shimizu, Y.; Hirochika, H.; Nagamura, Y. RiceXPro: A platform for monitoring gene expression in japonica rice grown under natural field conditions. Nucleic Acids Res. 2010, 39, D1141–D1148. [Google Scholar] [CrossRef]
  41. Ma, X.; Zhang, Q.; Zhu, Q.; Liu, W.; Chen, Y.; Qiu, R.; Wang, B.; Yang, Z.; Li, H.; Lin, Y.; et al. A robust CRISPR/Cas9 system for convenient, high-efficiency multiplex genome editing in monocot and dicot plants. Mol. Plant. 2015, 8, 1274–1284. [Google Scholar] [CrossRef]
  42. Zhang, X.; Li, R.; Chen, L.; Niu, S.; Chen, L.; Gao, J.; Wen, J.; Yi, B.; Ma, C.; Tu, J.; et al. Fine-mapping and candidate gene analysis of the Brassica juncea white-flowered mutant Bjpc2 using the whole-genome resequencing. Mol. Genet Genom. 2018, 293, 359–370. [Google Scholar] [CrossRef]
  43. Luo, Q.; Li, Y.; Shen, Y.; Cheng, Z. Ten Years of Gene Discovery for Meiotic Event Control in Rice. J. Genet. Genom. 2014, 41, 125–137. [Google Scholar] [CrossRef] [Green Version]
  44. Kuniyoshi, D.; Masuda, I.; Kanaoka, Y.; Shimazaki-Kishi, Y.; Okamoto, Y.; Yasui, H.; Yamamoto, T.; Nagaki, K.; Hoshino, Y.; Koide, Y.; et al. Diploid Male Gametes Circumvent Hybrid Sterility Between Asian and African Rice Species. Front. Plant Sci. 2020, 11, 1–27. [Google Scholar] [CrossRef]
  45. Wang, H.; Hu, Q.; Tang, D.; Liu, X.; Du, G.; Shen, Y.; Li, Y.; Cheng, Z. OsDMC1 Is not Required for Homologous Pairing in Rice Meiosis. Plant Physiol. 2016, 171, 230–241. [Google Scholar] [CrossRef] [Green Version]
  46. Ji, J.; Tang, D.; Wang, M.; Li, Y.; Zhang, L.; Wang, K.; Li, M.; Cheng, Z. MRE11 is required for homologous synapsis and DSB processing in rice meiosis. Chromosoma 2013, 122, 363–376. [Google Scholar] [CrossRef]
  47. Wang, K.; Wang, M.; Tang, D.; Shen, Y.; Miao, C.; Hu, Q.; Lu, T.; Cheng, Z. The Role of Rice HEI10 in the Formation of Meiotic Crossovers. PLoS Genet. 2012, 8, e1002809. [Google Scholar] [CrossRef] [Green Version]
  48. Shen, Y.; Tang, D.; Wang, K.; Wang, M.; Huang, J.; Luo, W.; Luo, Q.; Hong, L.; Li, M.; Cheng, Z. ZIP4 in homologous chromosome synapsis and crossover formation in rice meiosis. J. Cell Sci. 2012, 125, 2581–2591. [Google Scholar] [CrossRef] [Green Version]
  49. Shao, T.; Tang, D.; Wang, K.; Wang, M.; Che, L.; Qin, B.; Yu, H.; Li, M.; Gu, M.; Cheng, Z. OsREC8 Is Essential for Chromatid Cohesion and Metaphase I Monopolar Orientation in Rice Meiosis. Plant Physiol. 2011, 156, 1386–1396. [Google Scholar] [CrossRef] [Green Version]
  50. Wang, M.; Tang, D.; Wang, K.; Shen, Y.; Qin, B.; Miao, C.; Li, M.; Cheng, Z. OsSGO1 maintains synaptonemal complex stabilization in addition to protecting centromeric cohesion during rice meiosis. Plant J. 2011, 67, 583–594. [Google Scholar] [CrossRef]
  51. Luan, L.; Tu, S.B.; Long, W.B.; Wang, X.; Liu, Y.H.; Kong, F.L.; He, T.; Yan, W.G.; Yu, M.Q. Cytogenetic studies on two F1 hybrids of autotetraploid rice varieties showing extremely high level of heterosis. Plant Syst. Evol. 2007, 267, 205–213. [Google Scholar] [CrossRef] [Green Version]
  52. Luan, L.; Wang, X.; Long, W.B.; Liu, Y.H.; Tu, S.B.; Xiao, X.Y.; Kong, F.L. A comparative cytogenetic study of the rice (Oryza sativa L.) autotetraploid restorers and hybrids. Генетика 2009, 45, 1074–1081. [Google Scholar] [CrossRef]
  53. He, J.-H.; Shahid, M.Q.; Chen, Z.-X.; Chen, X.-A.; Liu, X.-D.; Lu, Y.-G. Abnormal PMC microtubule distribution pattern and chromosome behavior resulted in low pollen fertility of an intersubspecific autotetraploid rice hybrid. Plant Syst. Evol. 2011, 291, 257–265. [Google Scholar] [CrossRef]
  54. He, J.H.; Shahid, M.Q.; Li, Y.J.; Guo, H.B.; Cheng, X.A.; Liu, X.-D.; Lu, Y.-G. Allelic interaction of F1 pollen sterility loci and abnormal chromosome behaviour caused pollen sterility in intersubspecific autotetraploid rice hybrids. J. Exp. Bot. 2011, 62, 4433–4445. [Google Scholar] [CrossRef] [PubMed] [Green Version]
  55. Chen, L.; Shahid, M.Q.; Wu, J.; Chen, Z.; Wang, L.; Liu, X.-D. Cytological and transcriptome analyses reveal abrupt gene expression for meiosis and saccharide metabolisms that associated with pollen abortion in autotetraploid rice. Mol. Genet. Genom. 2018, 293, 1407–1420. [Google Scholar] [CrossRef] [Green Version]
  56. Koide, Y.; Ogino, A.; Yoshikawa, T.; Kitashima, Y.; Saito, N.; Kanaoka, Y.; Onishi, K.; Yoshitake, Y.; Tsukiyama, T.; Saito, H.; et al. Lineage-specific gene acquisition or loss is involved in interspecific hybrid sterility in rice. Proc. Natl. Acad. Sci. USA 2018, 115, E1955–E1962. [Google Scholar] [CrossRef] [PubMed] [Green Version]
  57. Fujita, M.; Horiuchi, Y.; Ueda, Y.; Mizuta, Y.; Kubo, T.; Yano, K.; Yamaki, S.; Tsuda, K.; Nagata, T.; Niihama, M.; et al. Rice Expression Atlas In Reproductive Development. Plant Cell Physiol. 2010, 51, 2060–2081. [Google Scholar] [CrossRef] [Green Version]
  58. Tang, X.; Zhang, Z.-Y.; Zhang, W.-J.; Zhao, X.-M.; Li, X.; Zhang, D.; Liu, Q.-Q.; Tang, W.-H. Global Gene Profiling of Laser-Captured Pollen Mother Cells Indicates Molecular Pathways and Gene Subfamilies Involved in Rice Meiosis. Plant Physiol. 2010, 154, 1855–1870. [Google Scholar] [CrossRef] [Green Version]
  59. Wang, M.; Tang, D.; Luo, Q.; Jin, Y.; Shen, Y.; Wang, K.; Cheng, Z. BRK1, a Bub1-Related Kinase, Is Essential for Generating Proper Tension between Homologous Kinetochores at Metaphase I of Rice Meiosis. Plant Cell 2012, 24, 4961–4973. [Google Scholar] [CrossRef] [Green Version]
  60. Ghouri, F.; Zhu, J.; Yu, H.; Wu, J.; Baloch, F.S.; Liu, X.-D.; Shahid, M.Q. Deciphering global DNA variations and embryo sac fertility in autotetraploid rice line. Turk. J. Agric. For. 2019, 43, 554–568. [Google Scholar] [CrossRef] [Green Version]
  61. Livak, K.J.; Schmittgen, T.D. Analysis of relative gene expression data using real-time quantitative PCR and the 2−ΔΔCT method. Methods 2001, 25, 402–408. [Google Scholar] [CrossRef] [PubMed]
  62. Yu, H.; Shahid, M.Q.; Li, R.; Li, W.; Liu, W.; Ghouri, F.; Liu, X.-D. Genome-Wide Analysis of Genetic Variations and the Detection of Rich Variants of NBS-LRR Encoding Genes in Common Wild Rice Lines. Plant Mol. Biol. Rep. 2018, 36, 618–630. [Google Scholar] [CrossRef] [PubMed] [Green Version]
  63. Li, H.; Durbin, R. Fast and accurate short read alignment with Burrows-Wheeler transform. Bioinformatics 2009, 25, 1754–1760. [Google Scholar] [CrossRef] [PubMed] [Green Version]
  64. McKenna, A.; Hanna, M.; Banks, E.; Sivachenko, A.; Cibulskis, K.; Kernytsky, A.; Garimella, K.; Altshuler, D.; Gabriel, S.B.; Daly, M.J.; et al. The Genome Analysis Toolkit: A MapReduce framework for analyzing next-generation DNA sequencing data. Genome Res. 2010, 20, 1297–1303. [Google Scholar] [CrossRef] [Green Version]
  65. Cingolani, P.; Platts, A.; Wang, L.L.; Coon, M.; Nguyen, T.; Wang, L.; Land, S.J.; Lu, X.; Ruden, D.M. A program for annotating and predicting the effects of single nucleotide polymorphisms, SnpEff: SNPs in the genome of Drosophila melanogaster strain w1118; iso-2; iso-3. Fly 2012, 6, 80–92. [Google Scholar] [CrossRef] [Green Version]
  66. Hill, J.T.; Demarest, B.L.; Bisgrove, B.W.; Gorsi, B.; Su, Y.-C.; Yost, H.J. MMAPPR: Mutation Mapping Analysis Pipeline for Pooled RNA-seq. Genome Res. 2013, 23, 687–697. [Google Scholar] [CrossRef] [Green Version]
Figure 1. Phenotypic characterization of hybrid lines and their parents. (ad) Plant morphology of H3, T452, JG and JD at mature stage. Bars = 10 cm. (eh) Mature panicles of H3, T452, JG and JD (from left to right). Bars = 1 cm. (il) Pollen fertility of H3, T452, JG and JD. Bars = 50 μm.
Ijms 22 00841 g001
Figure 2. Abnormal chromosome behavior during pollen mother cells meiosis in JD. (a) Chromosome lagging at metaphase I; (b,c) chromosome straggling at anaphase I; (d) multipolar spindle at metaphase I; (e) micronuclei at telophase I; (f) chromosome lagging at metaphase II; (gi) abnormal cell shape and asynchronous division of chromosomes during meiosis II; (j) abnormal triad; (k) abnormal “T” shape tetrad; (l) abnormal line shape tetrad. Bars = 10 μm.
Ijms 22 00841 g002
Figure 3. Identification of the hot-region for high fertility through the single nucleotide polymorphism SNP-index association analysis method. The X-axis represents the position of 12 chromosomes of rice and the Y-axis represents the Δ (SNP-index). The color dots represent the Δ (SNP-index) value of every SNP locus. The black lines show the Δ (SNP-index) value of fitting results. (a): The Δ (SNP-index) graph of F2 generation. (b): The Δ (SNP-index) graph of F3 generation. (c): The Δ (SNP-index) graph of F4 generation. The red dotted line shows the association threshold.
Ijms 22 00841 g003
Figure 4. Expression analysis of 4 candidate genes in high fertility blocks. QRT-PCR results of LOC_Os07g32480 (a), LOC_Os07g32406 (b), LOC_Os07g32040 (c), and LOC_Os07g31870 (d). The ubiquitin gene was used as an internal control. Fc, fold change. The error bars (ad) indicate SE. The gene structure and target site for CRISPR/Cas9 of LOC_Os07g32406 (NY1) (e) and LOC_Os07g32040 (NY2) (f). The predicted expression patterns of LOC_Os07g32406 (NY1) (g) and LOC_Os07g32040 (NY2) (h).
Ijms 22 00841 g004
Figure 5. Phenotypic characterization of wild type (WT), ny1 and ny2 mutant lines. (a) Plant morphology of the WT, ny1 and ny2 mutants at mature stage. Bars = 20 cm. (b) Mature panicles. Bars = 1 cm. (c) Pollen grains observed by whole-mount eosin B-staining confocal laser scanning microscopy (WE-CLSM). Bars = 100 μm. (d) Florets. Bars = 1 mm. (e) I2-KI staining of pollen grains. Bars = 50 μm. (f) Pistils. Bars = 1 mm. (g) Mature embryo sac. Bars = 100 μm.
Ijms 22 00841 g005
Figure 6. Chromosome behavior of PMC meiosis in wild type (WT), ny1 and ny2 mutant lines. (ad) indicate metaphase I; anaphase I; metaphase II; anaphase II images of wild-type. (eh) are showing metaphase I; anaphase I; metaphase II; anaphase II images of ny1 and (il) represent metaphase I; anaphase I; metaphase II; anaphase II images of ny2. Red arrows indicate abnormal chromosomes. Bars = 50 μm.
Ijms 22 00841 g006
Table 1. Agronomic traits of JG bulk, JD bulk and their parents during early and late seasons in 2019.
TraitsH3T452JGJD
Total grains/panicle136.9 ± 13.4 B116.0 ± 25.0 C159.4 ± 22.2 D120.7 ± 46.1 BC
Seed setting (%)80.4 ± 3.0 A15.3 ± 4.7 C82.5 ± 4.2 A18.8 ± 9.8 B
Pollen fertility (%)87.5 ± 2.4 A23.7 ± 6.8 B88.5 ± 4.8 A25.1 ± 5.1 B
Embryo sac fertility (%)92.085.293.585.0
Embryo sac fertility at 3 DAF (%)82.011.081.924.9
Chromosome lagging at metaphase I (%)17.4 ± 1.713.9 ± 1.316.6 ± 2.231.3 ± 4.8
Chromosome straggling at anaphase I (%)17.6 ± 0.313.6 ± 1.48.4 ± 0.628.8 ± 7.4
Chromosome lagging at metaphase II (%)5.4 ± 0.33.1 ± 1.92.4 ± 1.427.2 ± 1.4
Chromosome straggling at anaphase II (%)0.7 ± 0.70.0 ± 0.02.1 ± 1.324.8 ± 2.0
Least significant difference (LSD) was used in the multiple comparison tests for each trait. Different letters between two samples indicate significant differences (p value < 0.01). H3, T452, JG, JD and DAF indicate Huaduo3, Huajingxian74-4x, plants with high fertility, plants with low fertility and days after flowering, respectively.
Table 2. Mean performance of agronomic traits, pollen fertility and embryo sac fertility of WT, ny1 and ny2 mutant lines.
TraitsWTny1ny2
Plant height (cm)112.0 ± 6.3 a102.2 ± 7.5 b101.6 ± 6.9 b
Days to 50% flowering101.0 ± 0.0 b107.3 ± 1.5 a109.7 ± 1.5 a
Flag leaf length (cm)35.5 ± 2.6 a29.4 ± 4.1 c32.1 ± 3.8 b
Flag leaf width (cm)2.3 ± 0.1 a2.1 ± 0.3 b2.2 ± 0.2a b
Number of panicles 6.0 ± 0.7 a4.0 ± 1.0 b4.5 ± 0.9 b
Grain length (mm)9.4 ± 0.2 a9.4 ± 0.7 a9.2 ± 0.4 a
Grain width (mm)3.5 ± 0.1 a3.3 ± 0.2 b3.4 ± 0.1 ab
Grain length to width ratio2.7 ± 0.1 b2.8 ± 0.3 a2.7 ± 0.1 ab
Panicle length (cm)27.1 ± 1.0 a23.6 ± 2.3 b23.9 ± 2.1 b
Total grains /plant768.0 ± 126.1 a293.6 ± 118.2 c372.8 ± 108.1 b
Filled grains/plant599.6 ± 94.4 a128.4 ± 76.0 c186.8 ± 72.3 b
1000-grain weight (g)36.3 ± 1.4 a26.5 ± 5.5 c29.5 ± 2.8 b
Grain yield /plant (g)21.6 ± 3.4 a3.6 ± 2.4 c5.5 ± 2.3 b
Seed setting (%)78.0 ± 4.2 a43.3 ± 14.2 b49.5 ± 10.2 b
Pollen fertility (%)93.1 ± 3.3 a38.7 ± 36.3 b26.7 ± 33.6 b
Embryo sac fertility (%)90.185.187.2
Least significant difference (LSD) was used in the multiple comparison for each trait. Different lower-case letters between two samples indicated significant differences (p value < 0.05).
Table 3. Frequency of pollen mother cells with abnormal chromosome behavior during meiosis in WT, ny1 and ny2 mutant lines.
StageWild Type (WT)ny1 (Mutant Line)ny2 (Mutant Line)
Number of CellsAbnormal (%)Number of CellsAbnormal (%)Number of CellsAbnormal (%)
Metaphase I68814.756164.723866.0
Anaphase I13915.817966.511062.4
Metaphase II14915.48071.38290.2
Anaphase II3751.411371.74787.2
Publisher’s Note: MDPI stays neutral with regard to jurisdictional claims in published maps and institutional affiliations.

