
L-NAME Administration Enhances Diabetic Kidney Disease Development in an STZ/NAD Rat Model


Abstract
:1. Introduction
2. Results
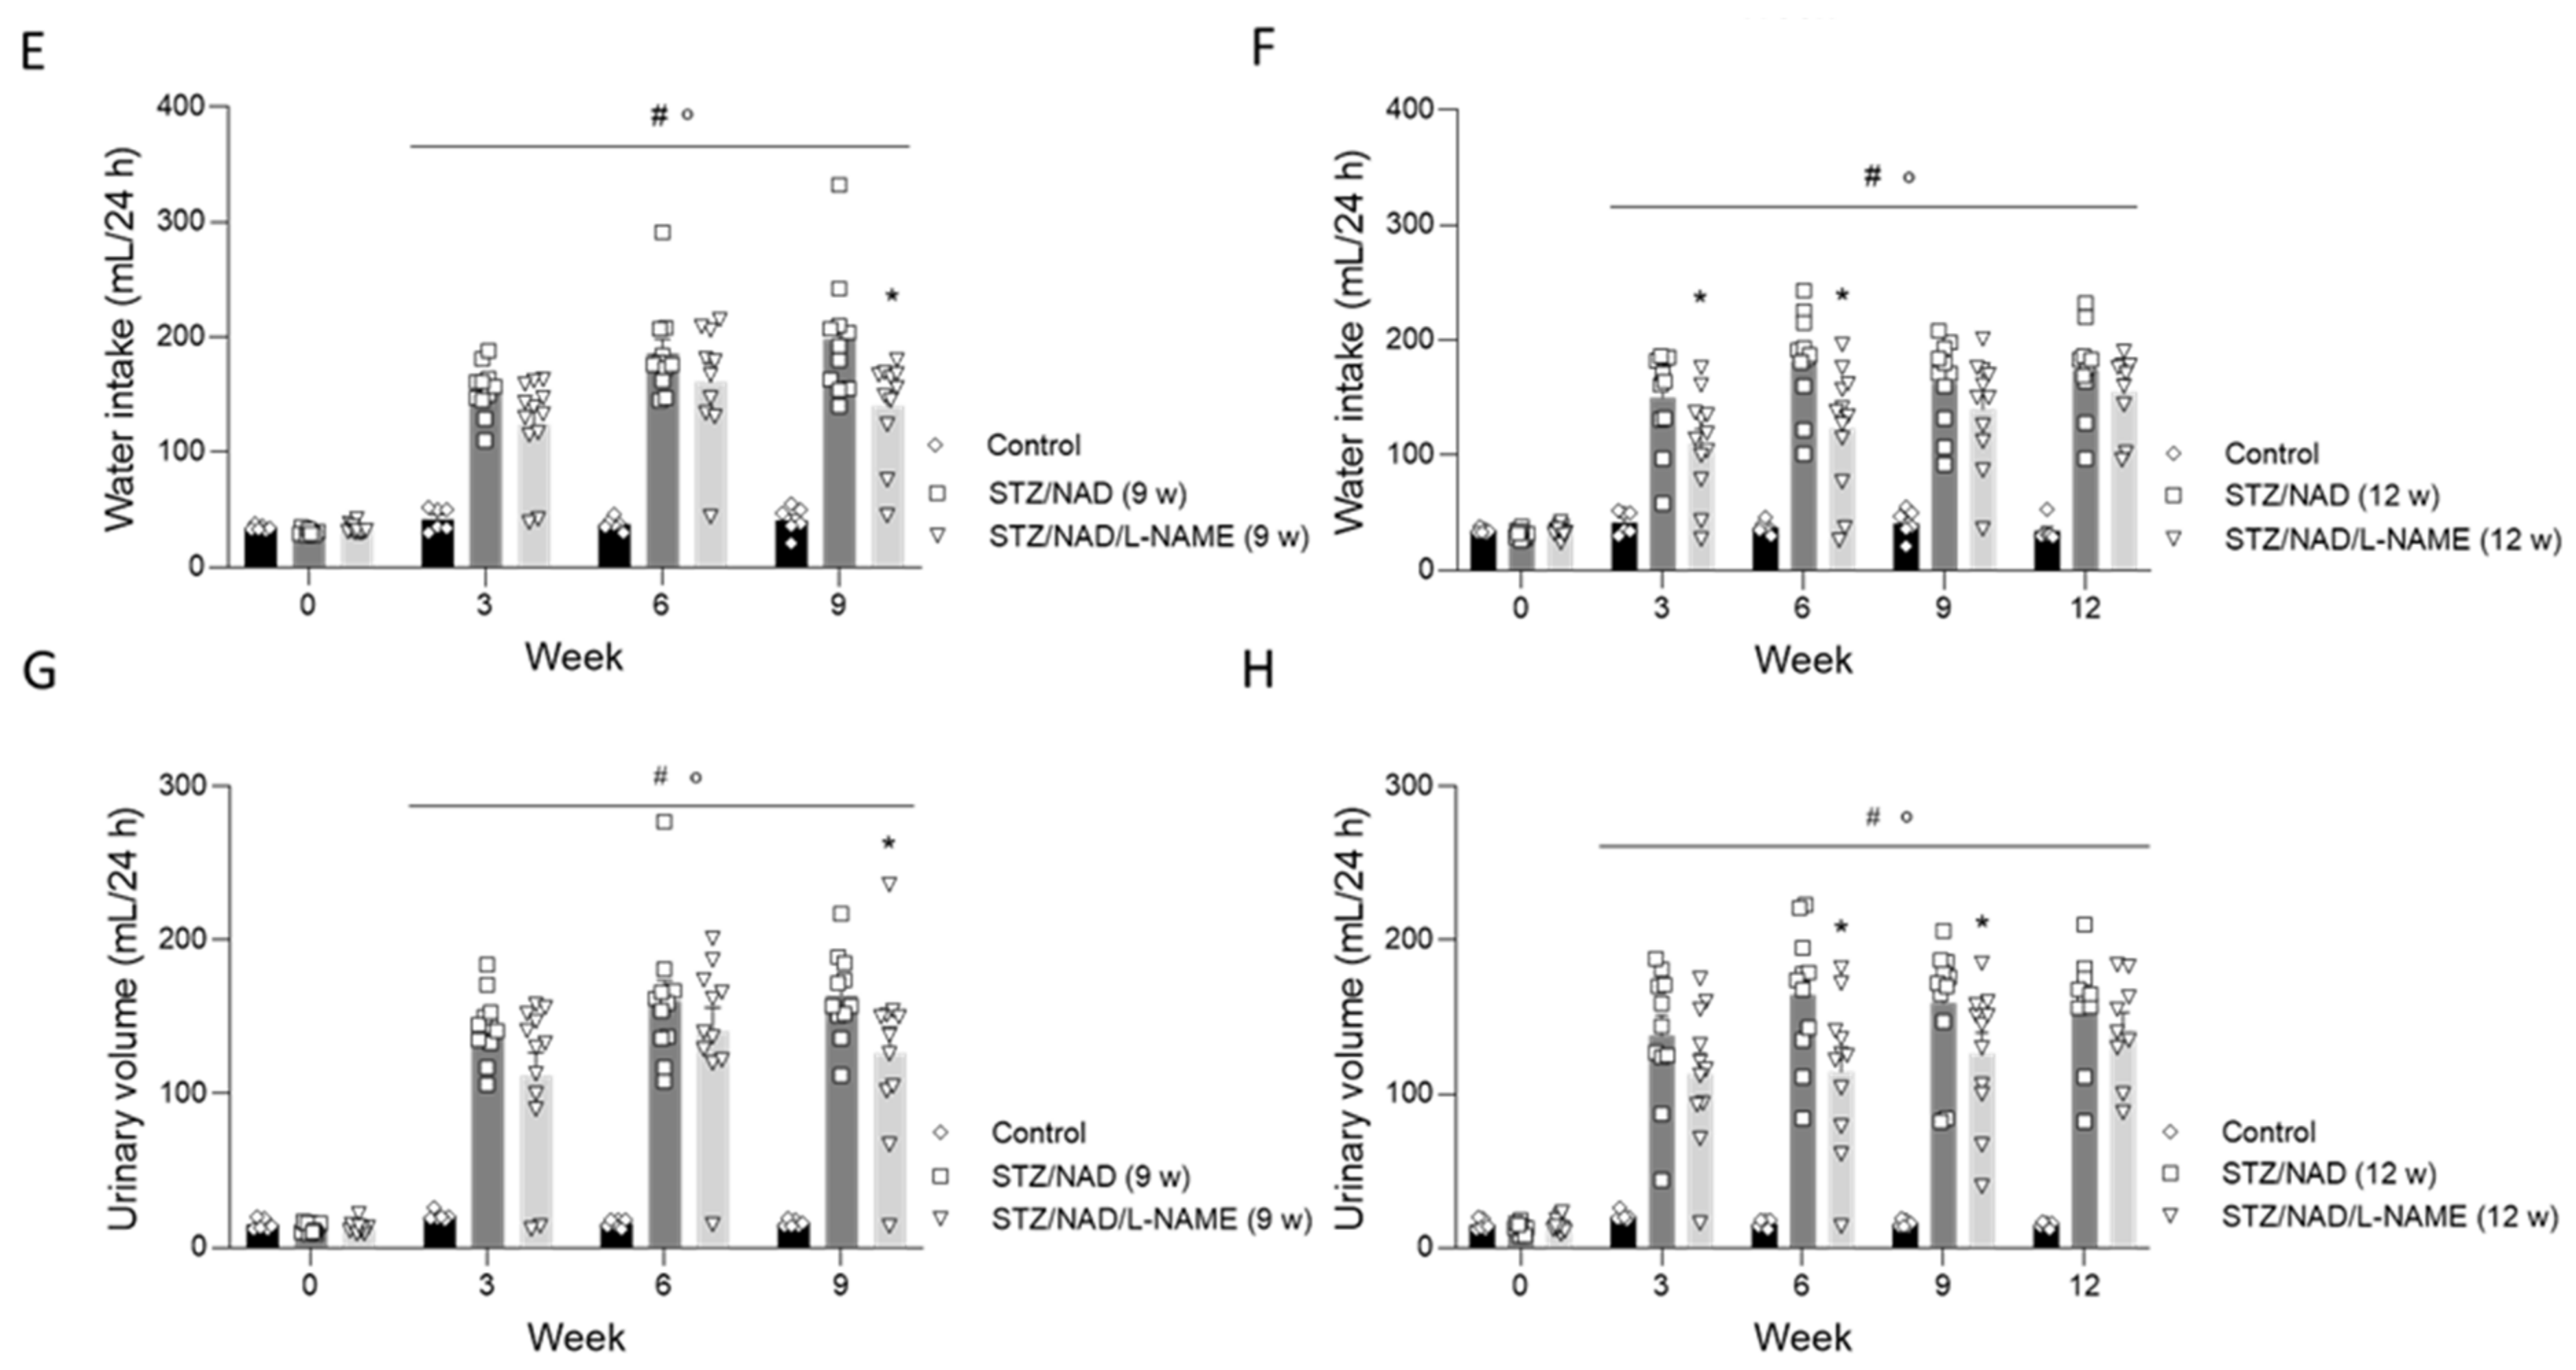
2.1. Animal Model of DKD: General Animal Aspects
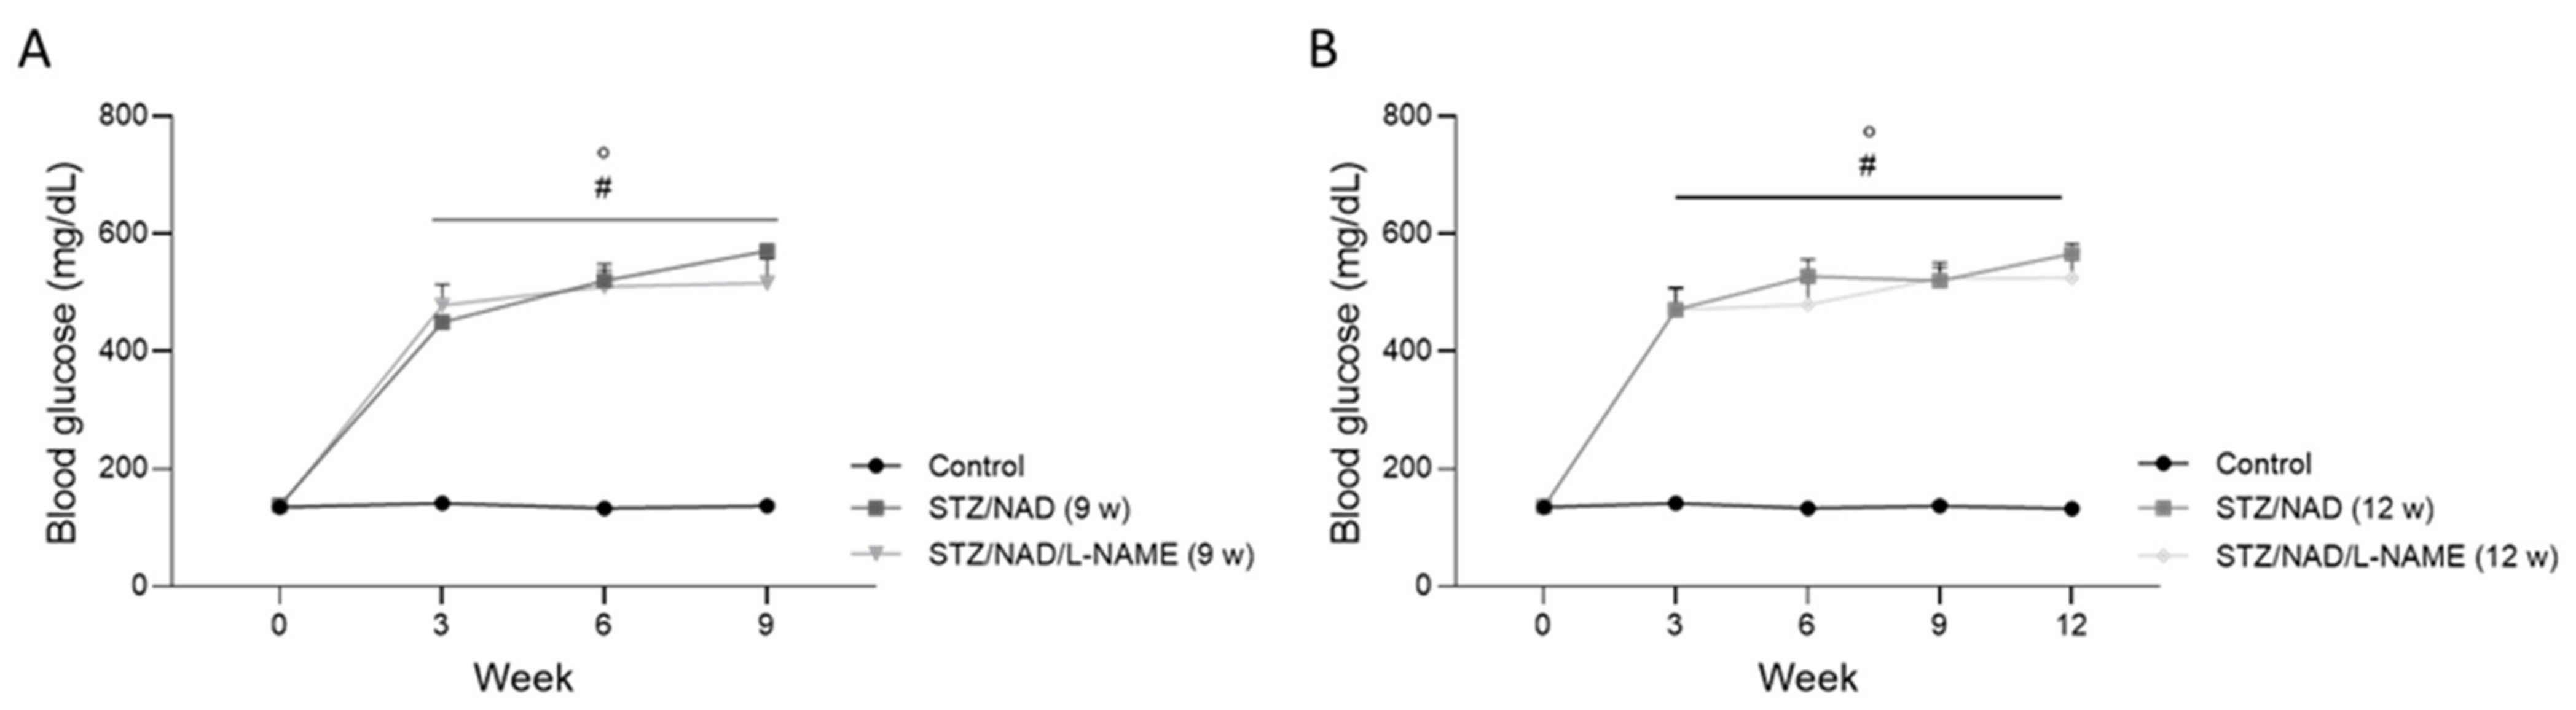
2.2. Both STZ/NAD and STZ/NAD/L-NAME Cause Glucose Intolerance in Rats
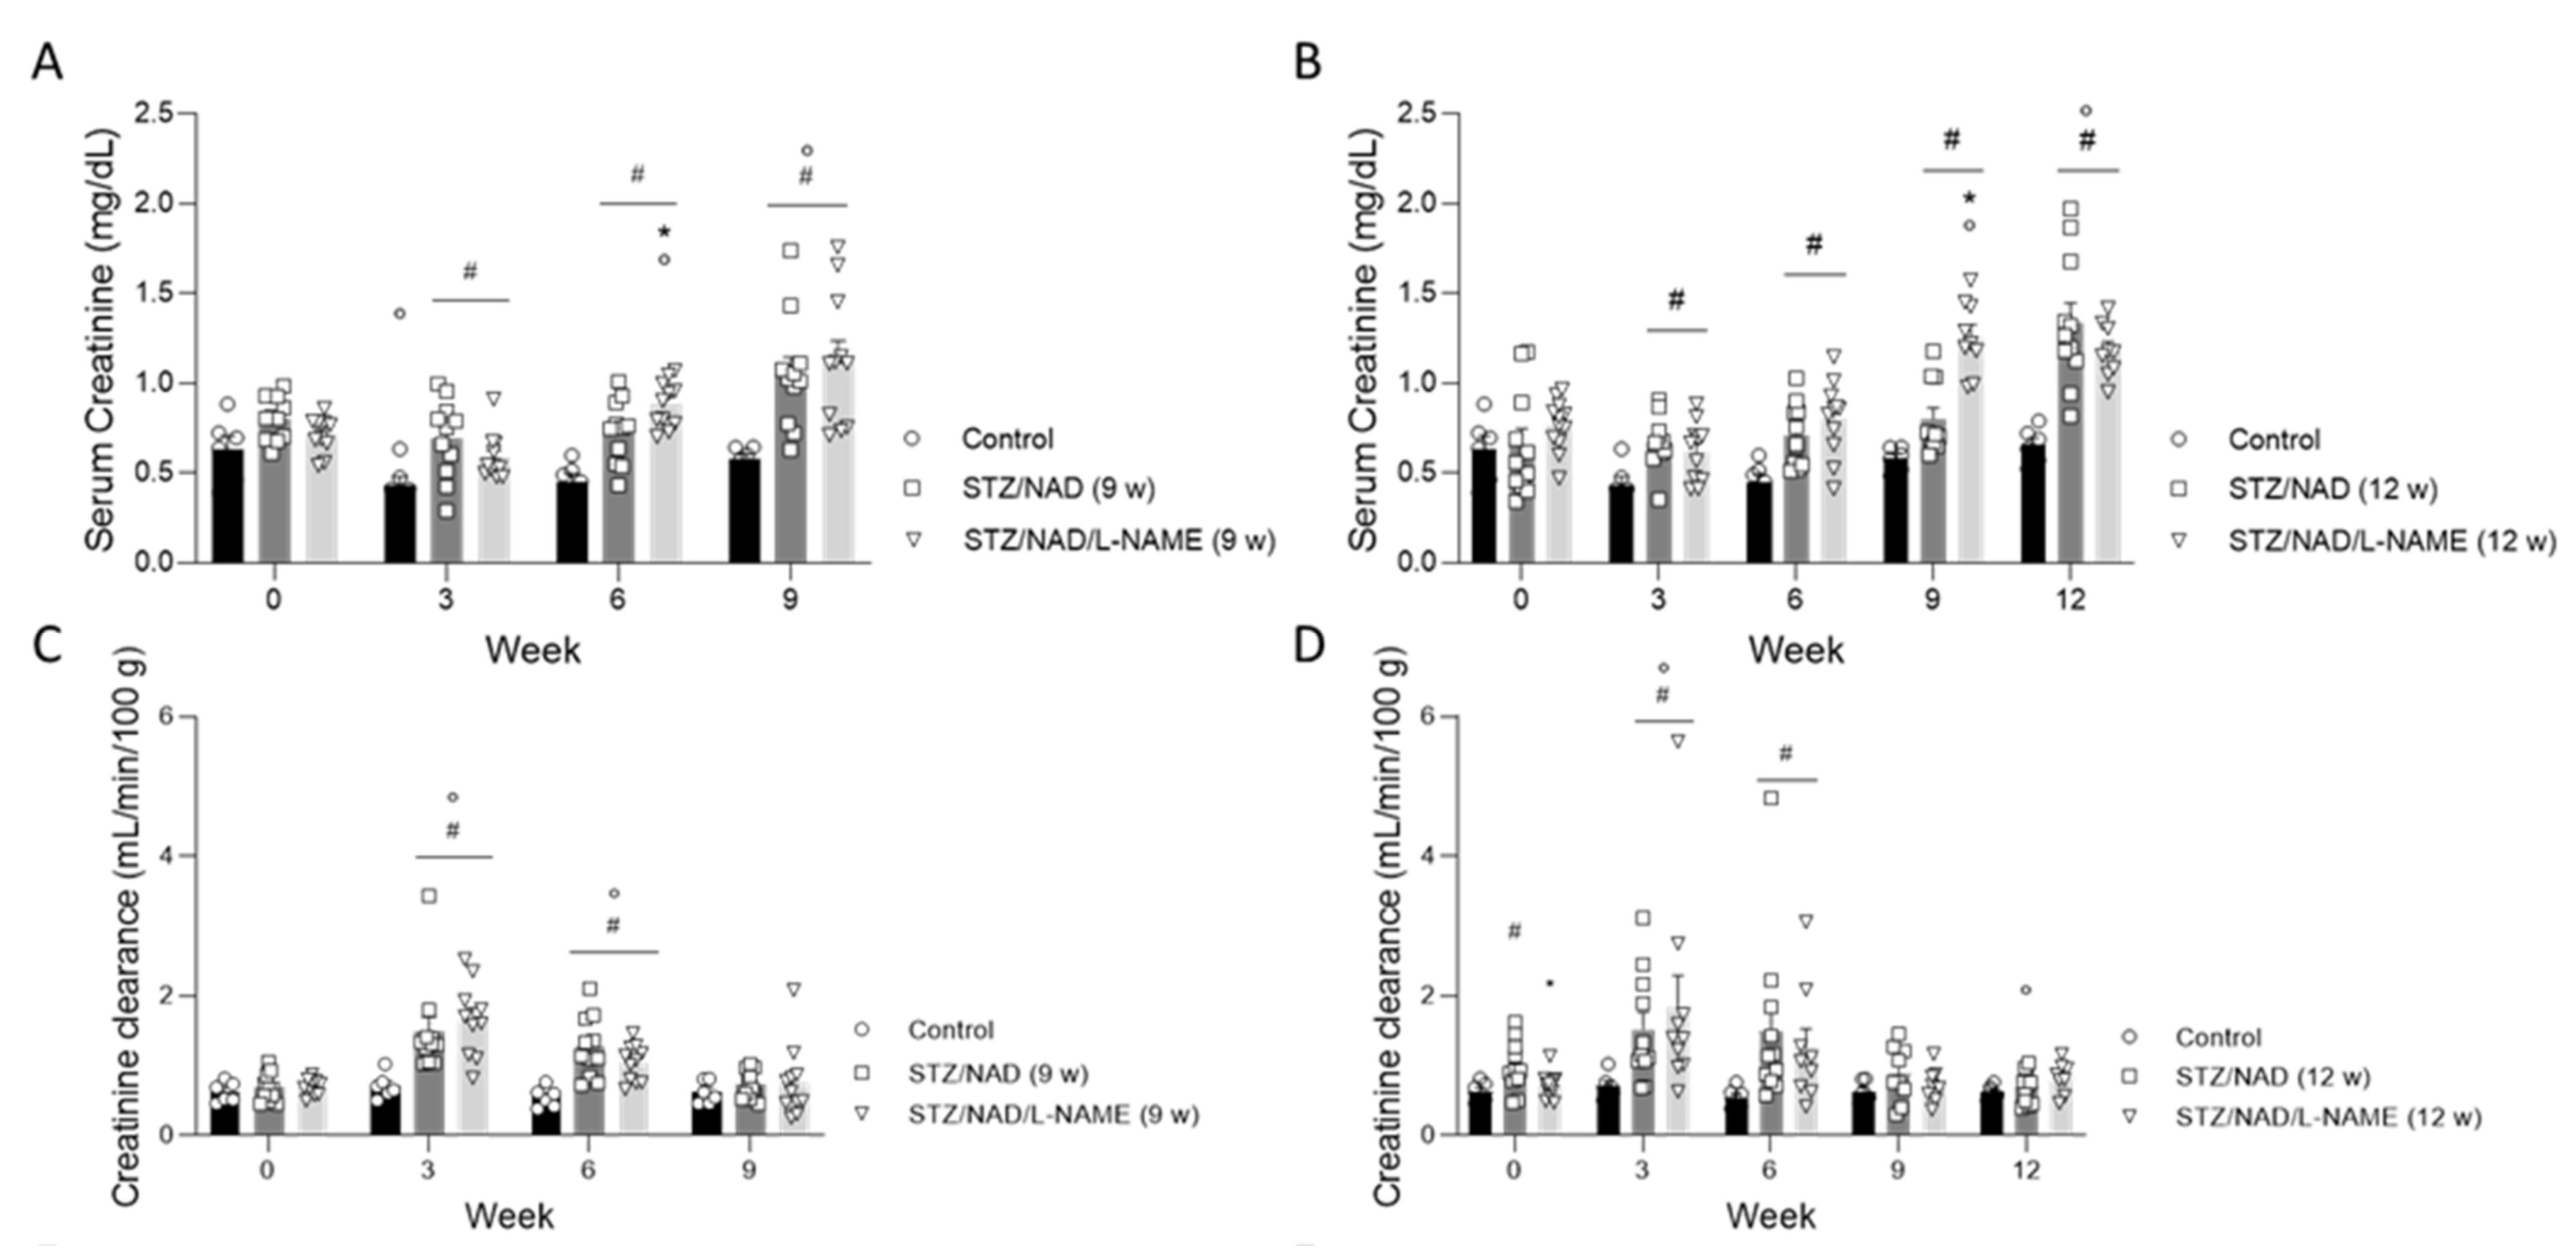
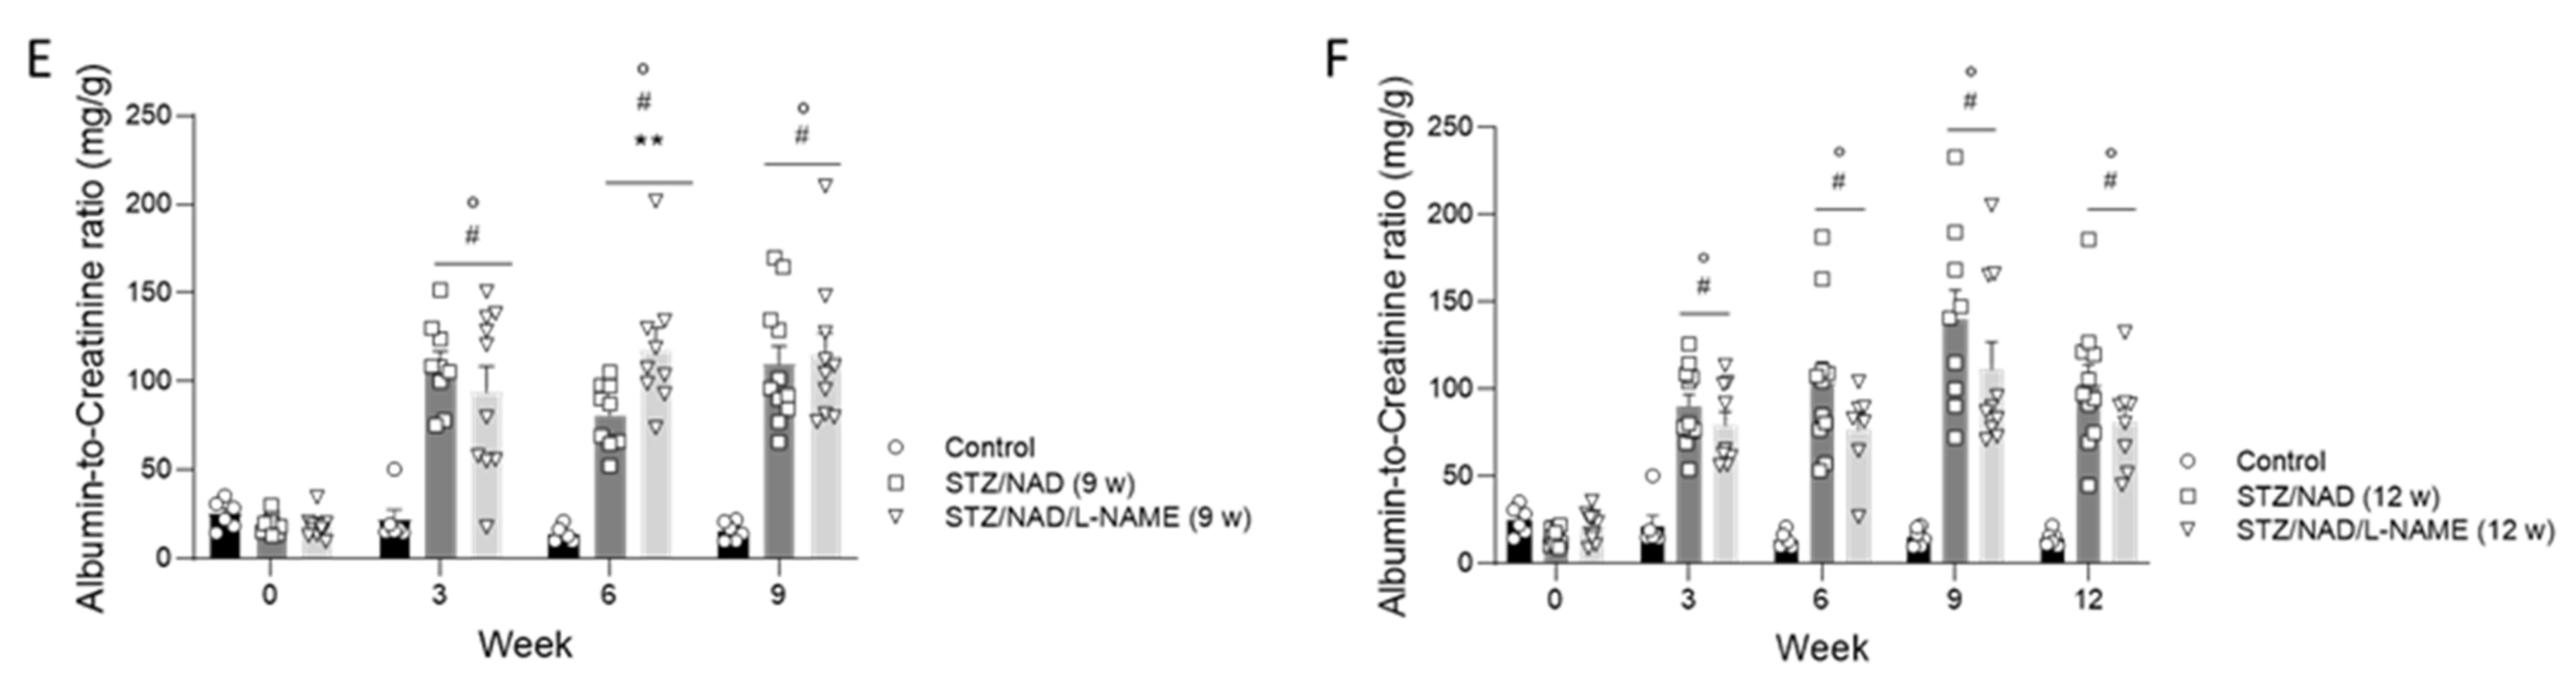
2.3. Diabetes Induction Affects Kidney Function
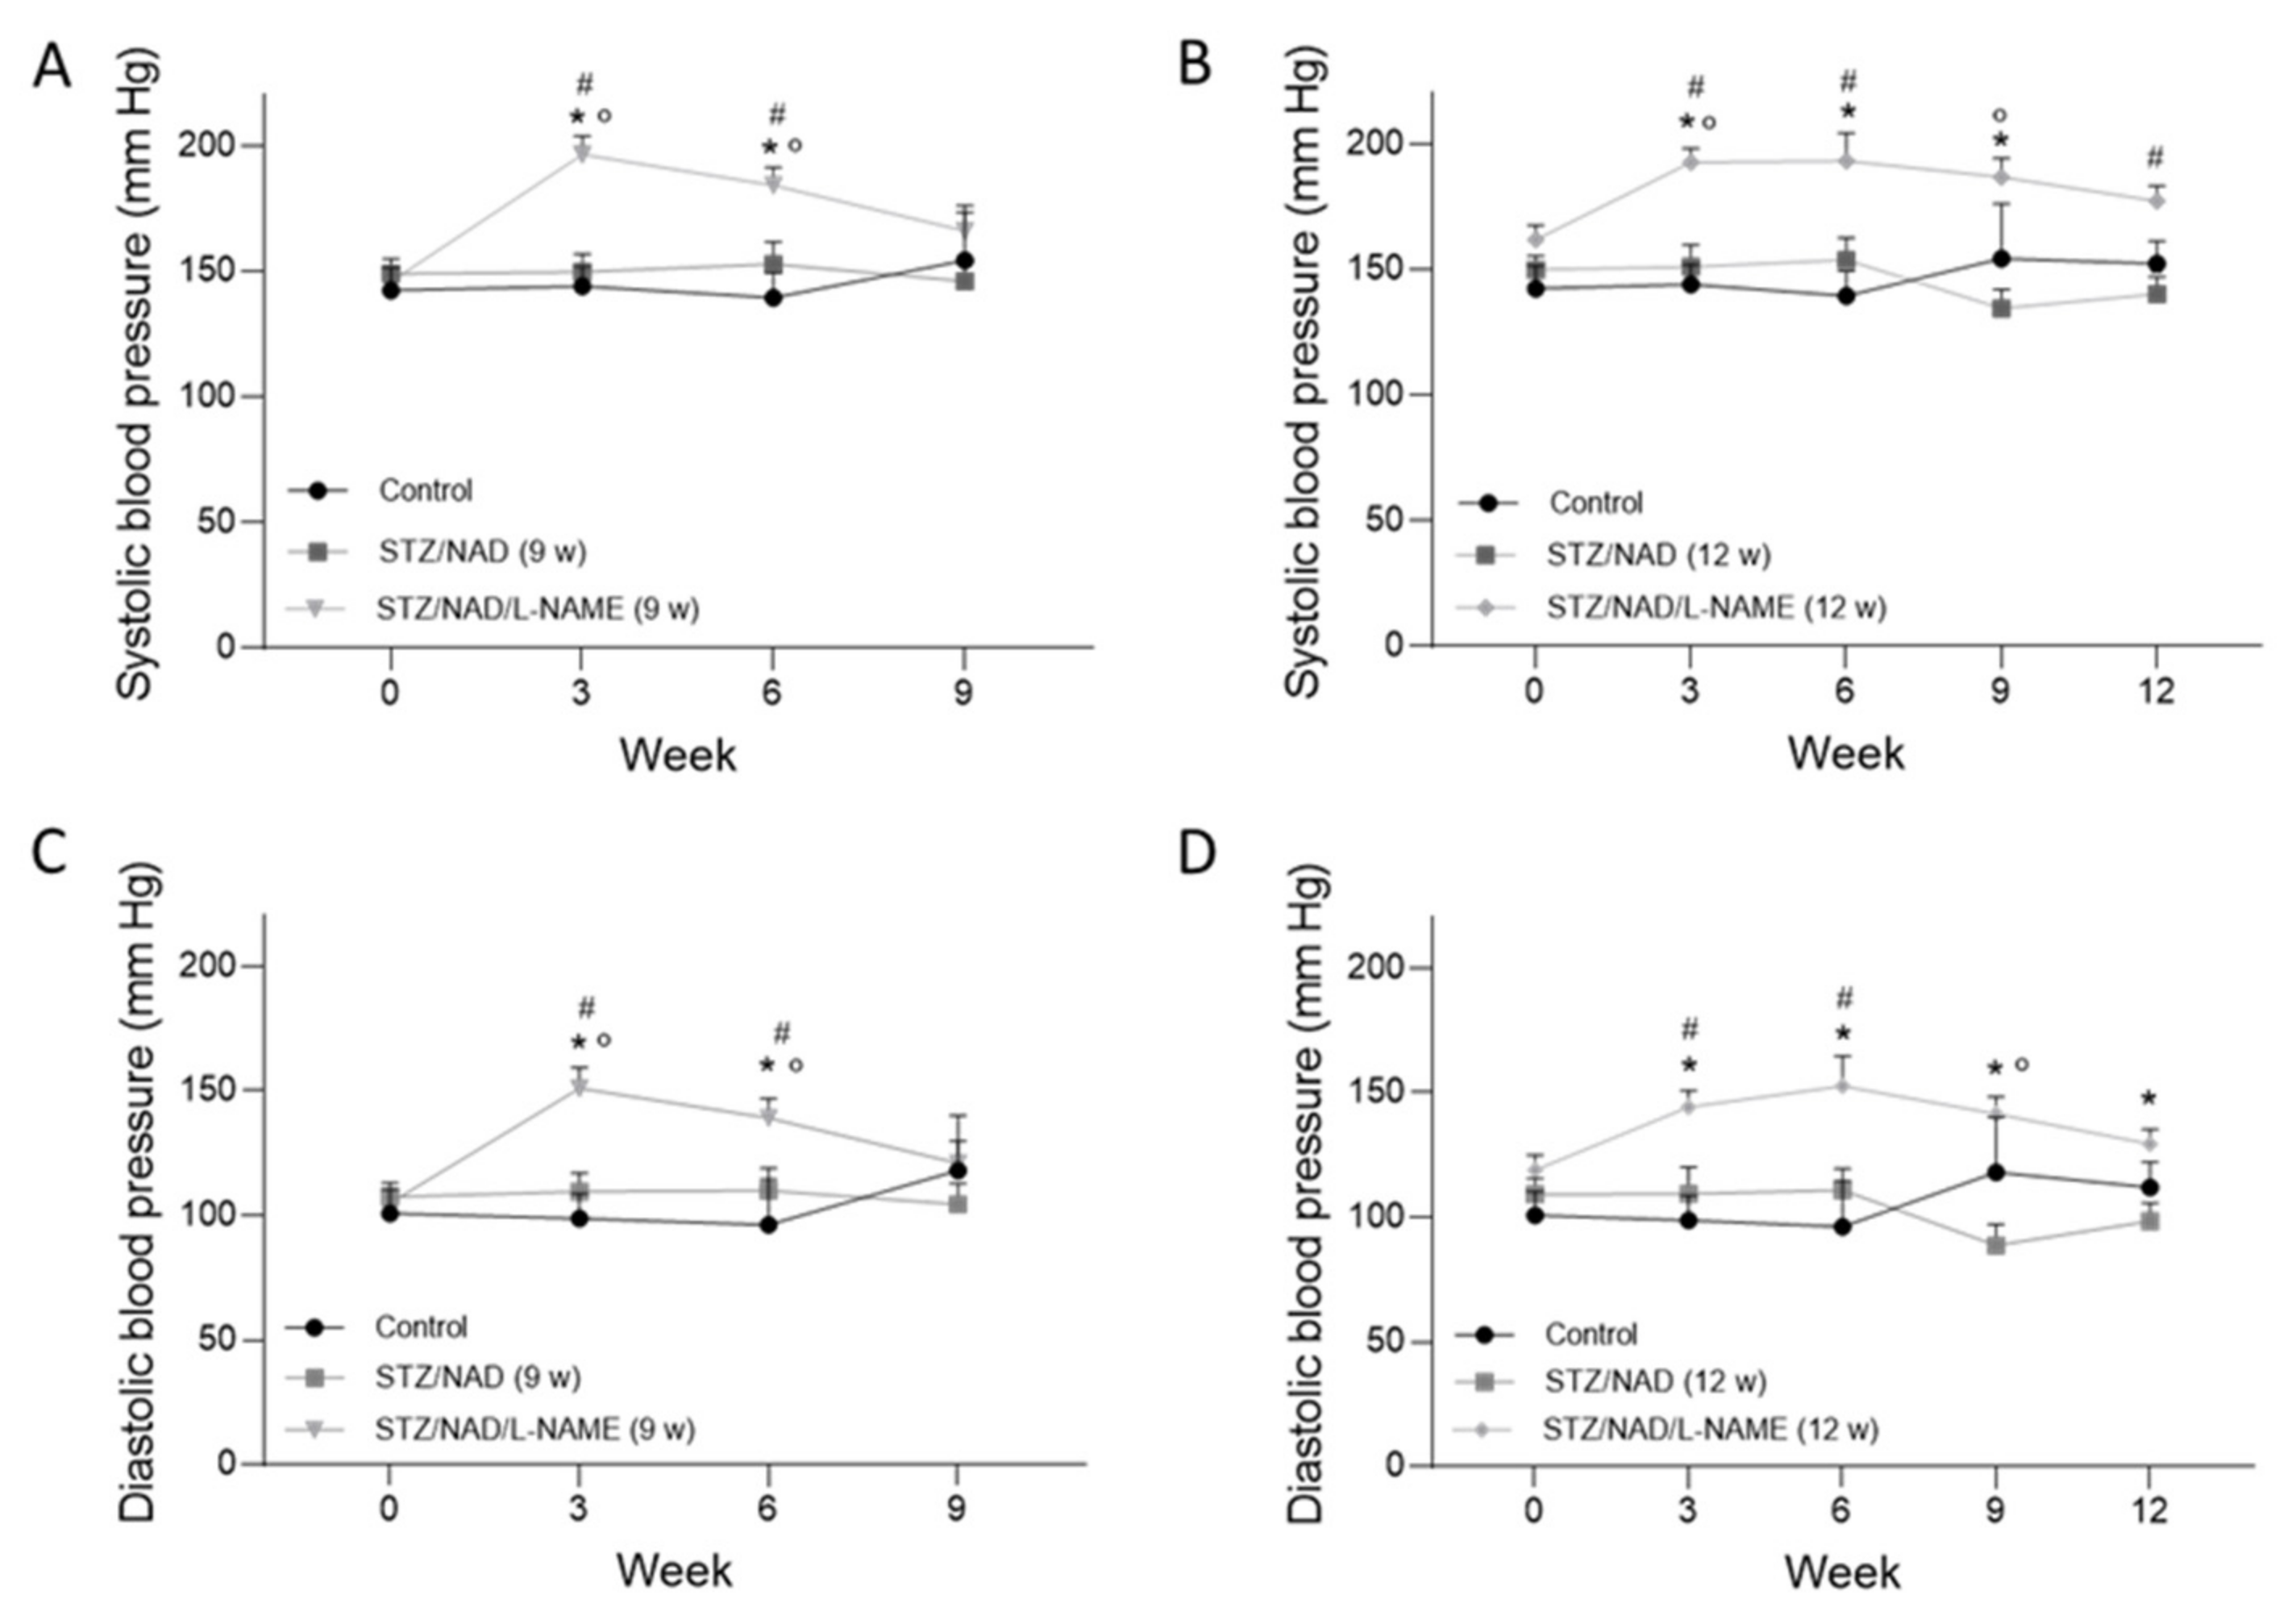
2.4. L-NAME-Induced NO-Deficiency Leads to Increased Blood Pressure
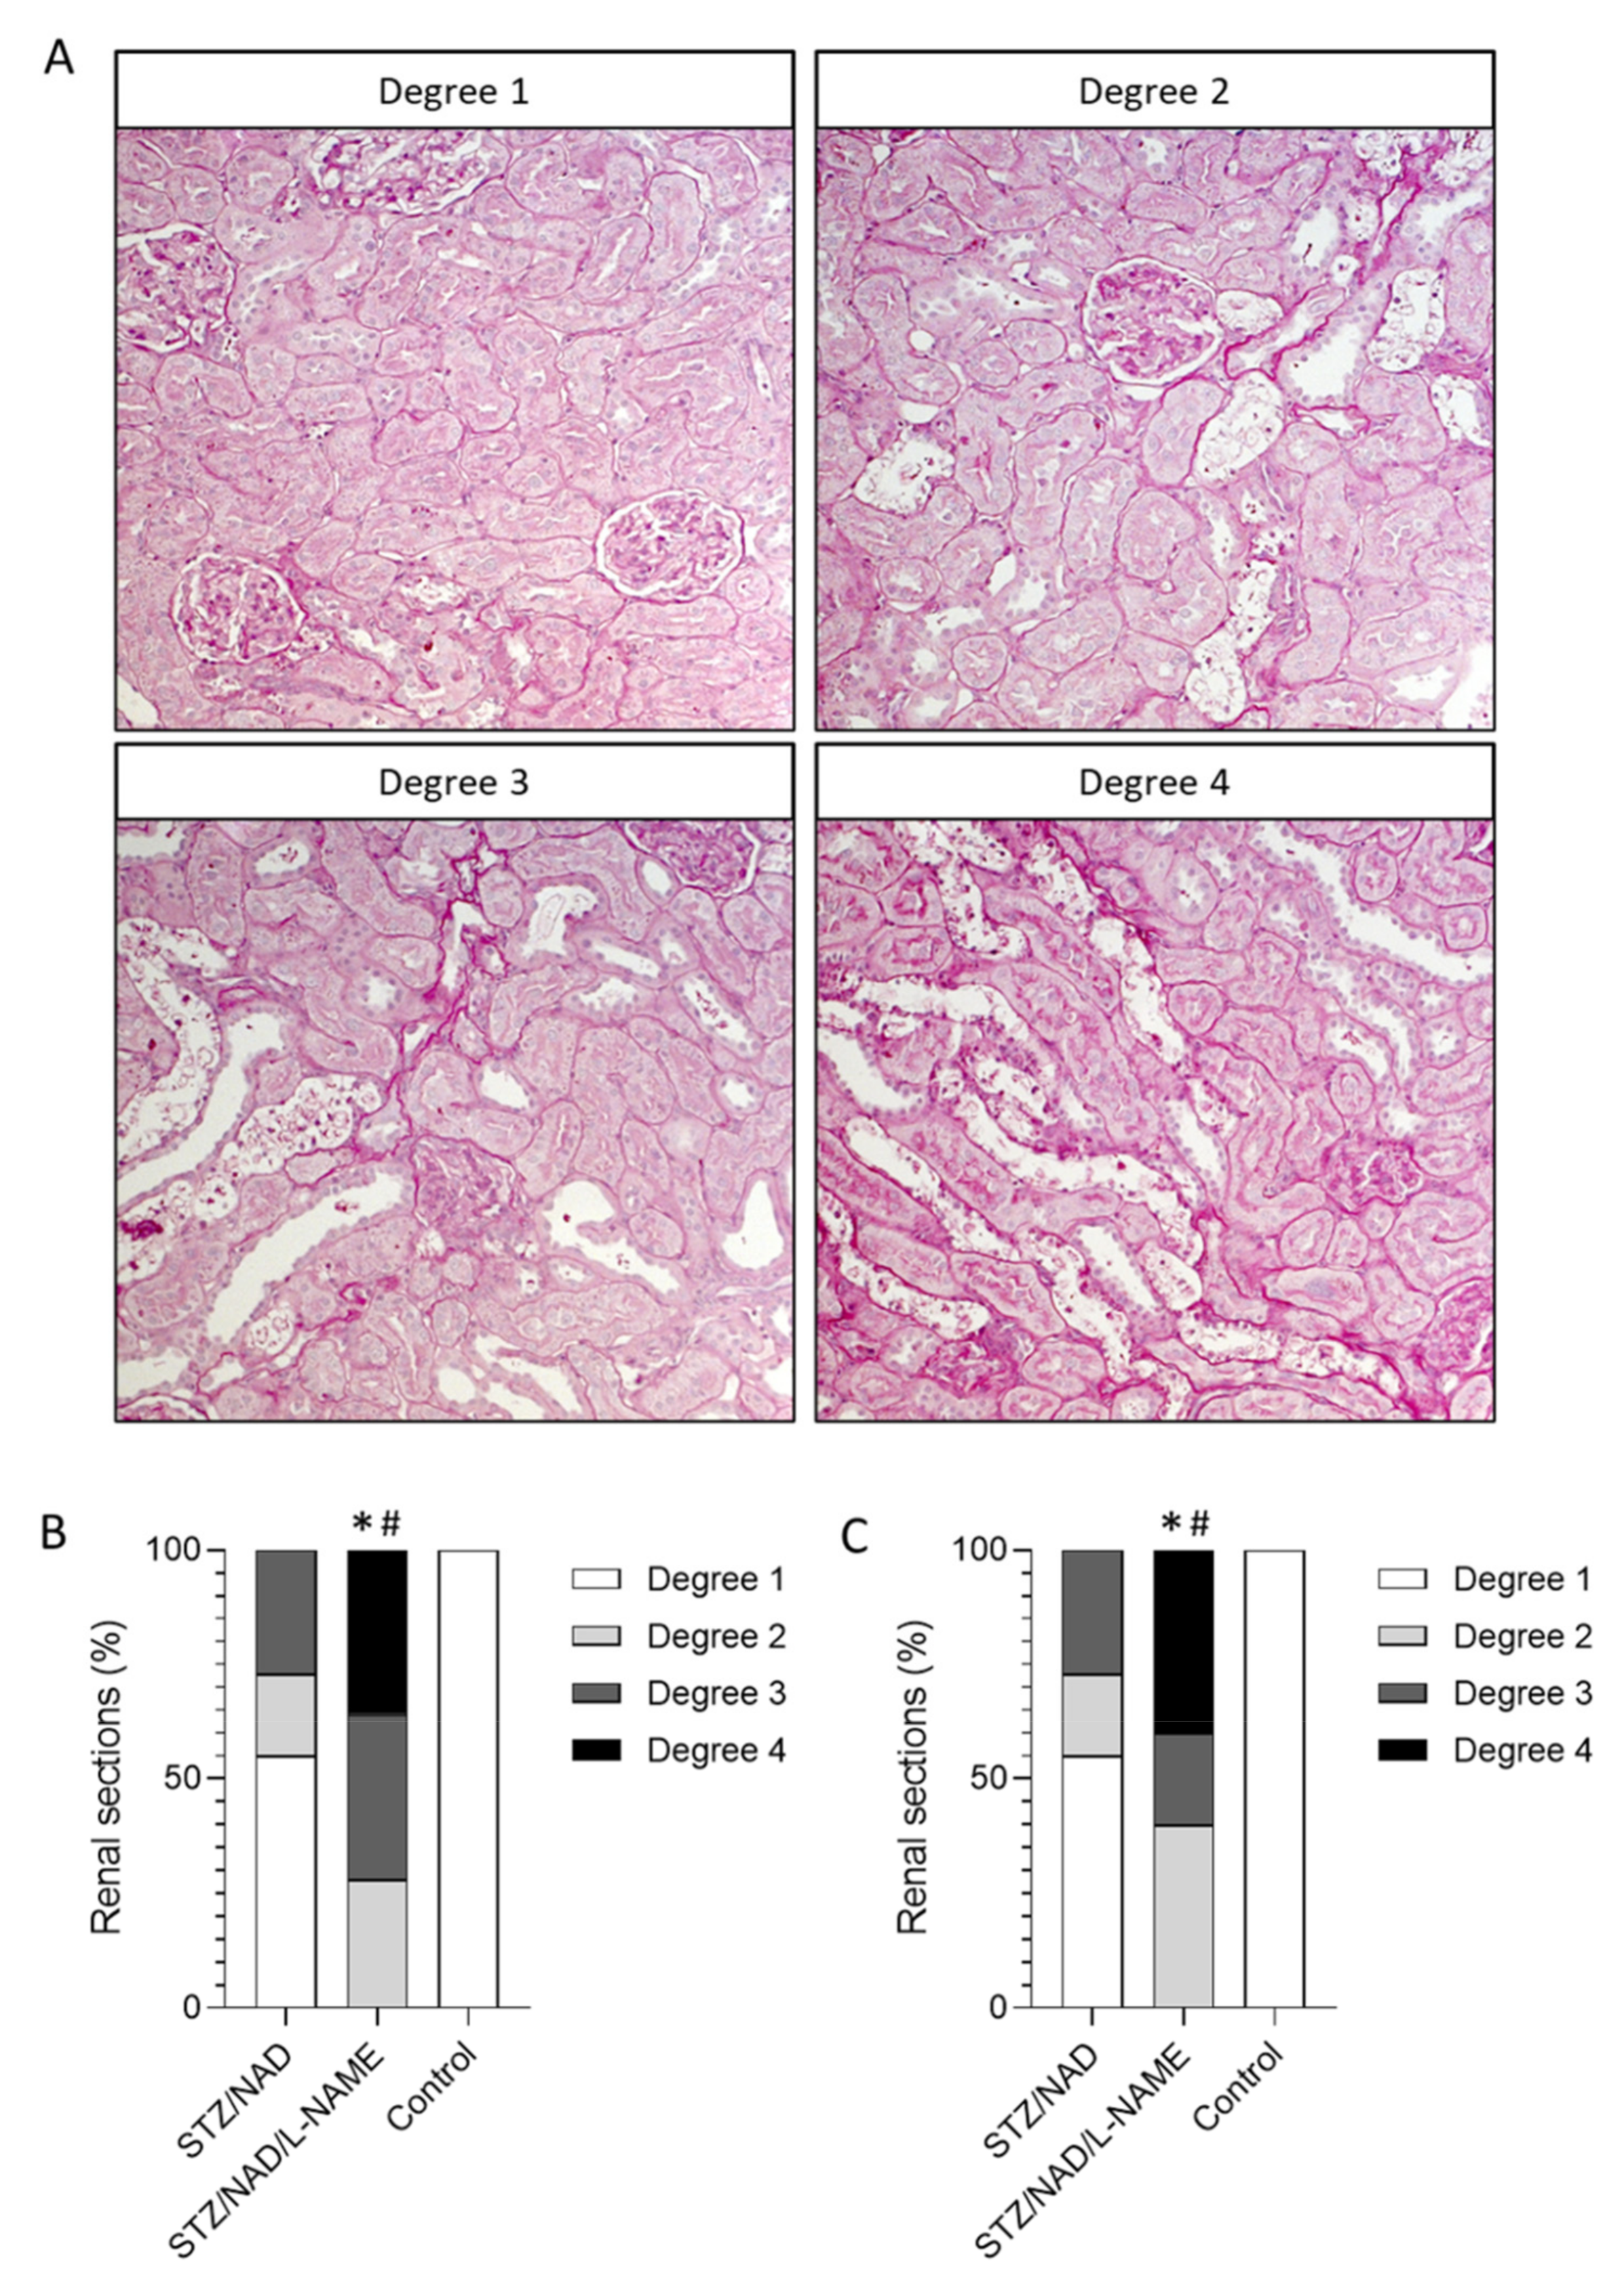
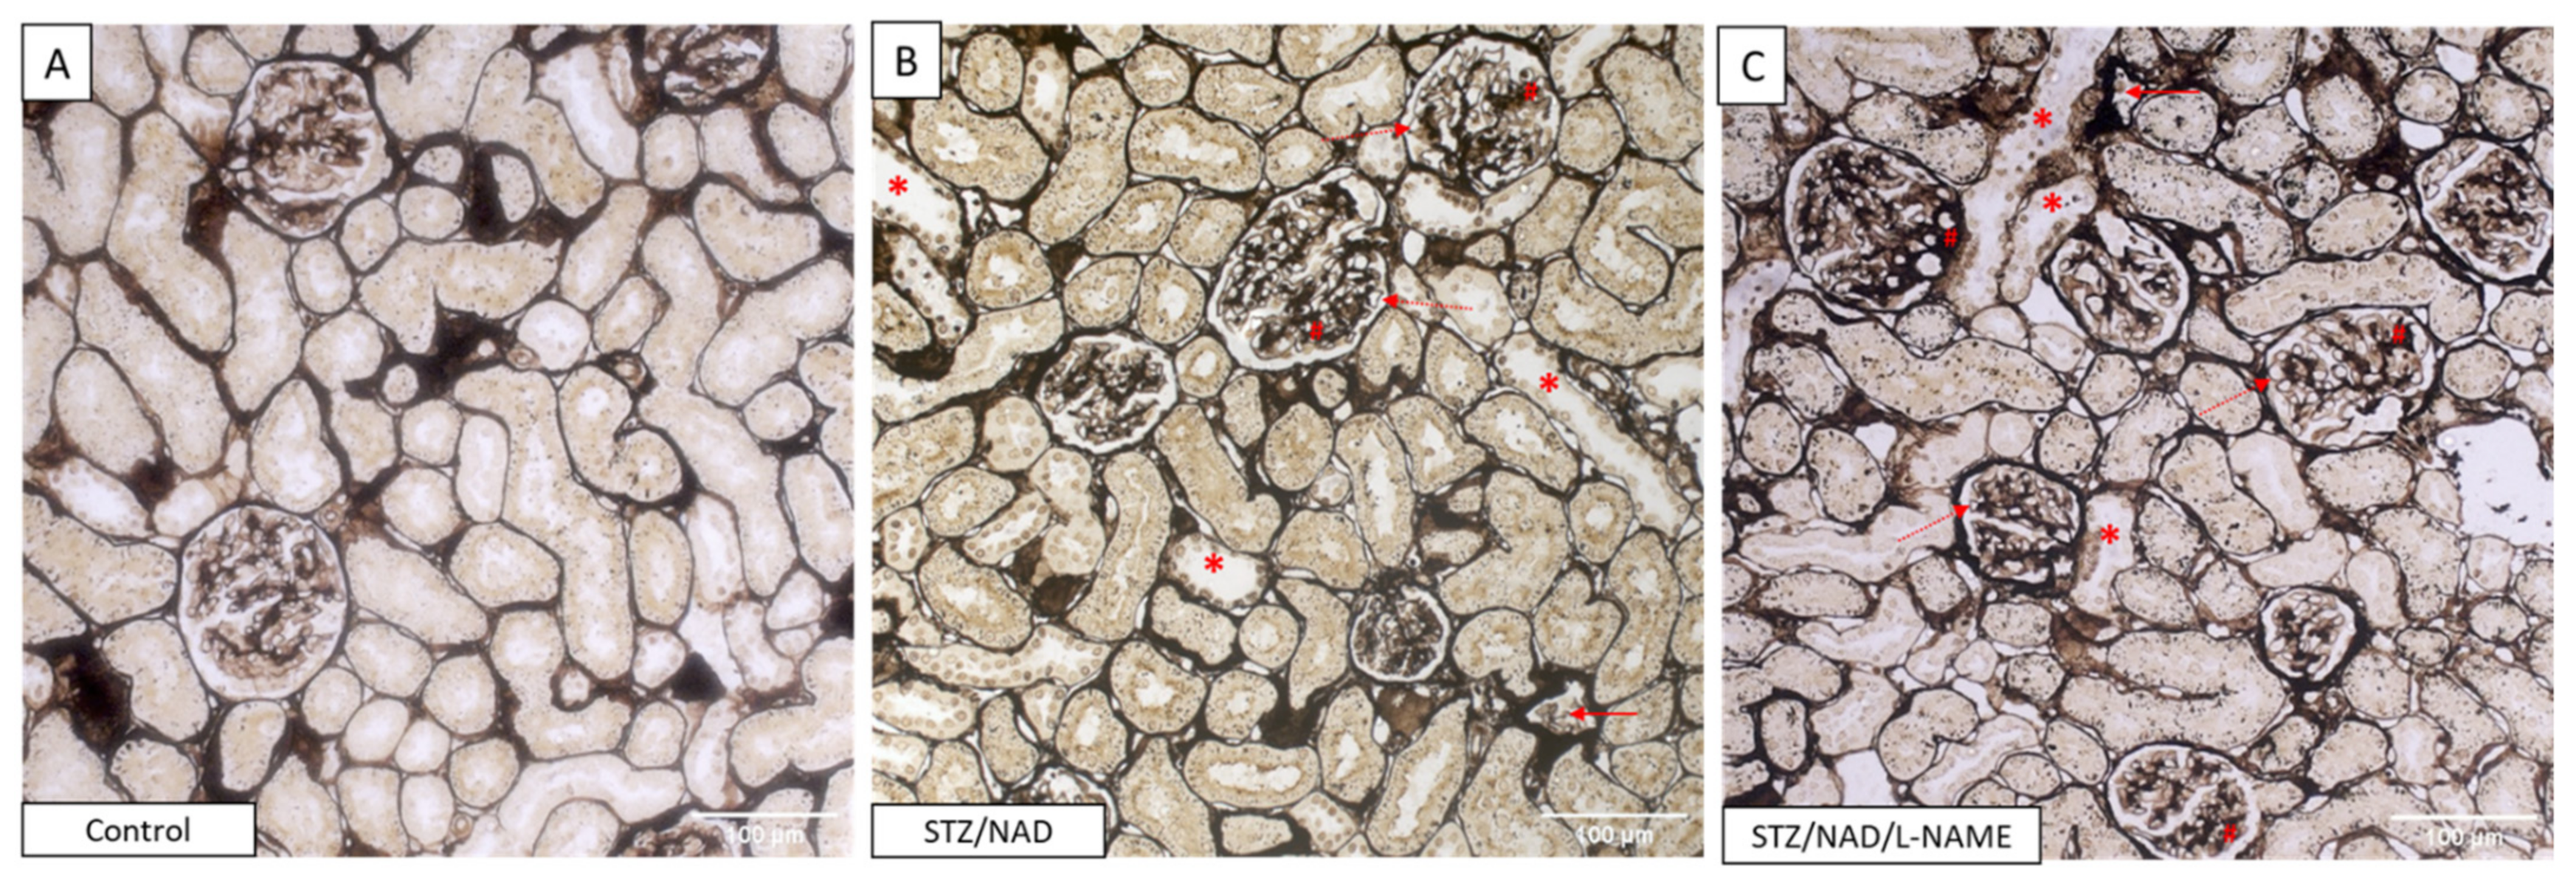
2.5. L-NAME Administration Aggravates Renal Histopathological Changes
3. Discussion
4. Materials and Methods
4.1. Drugs
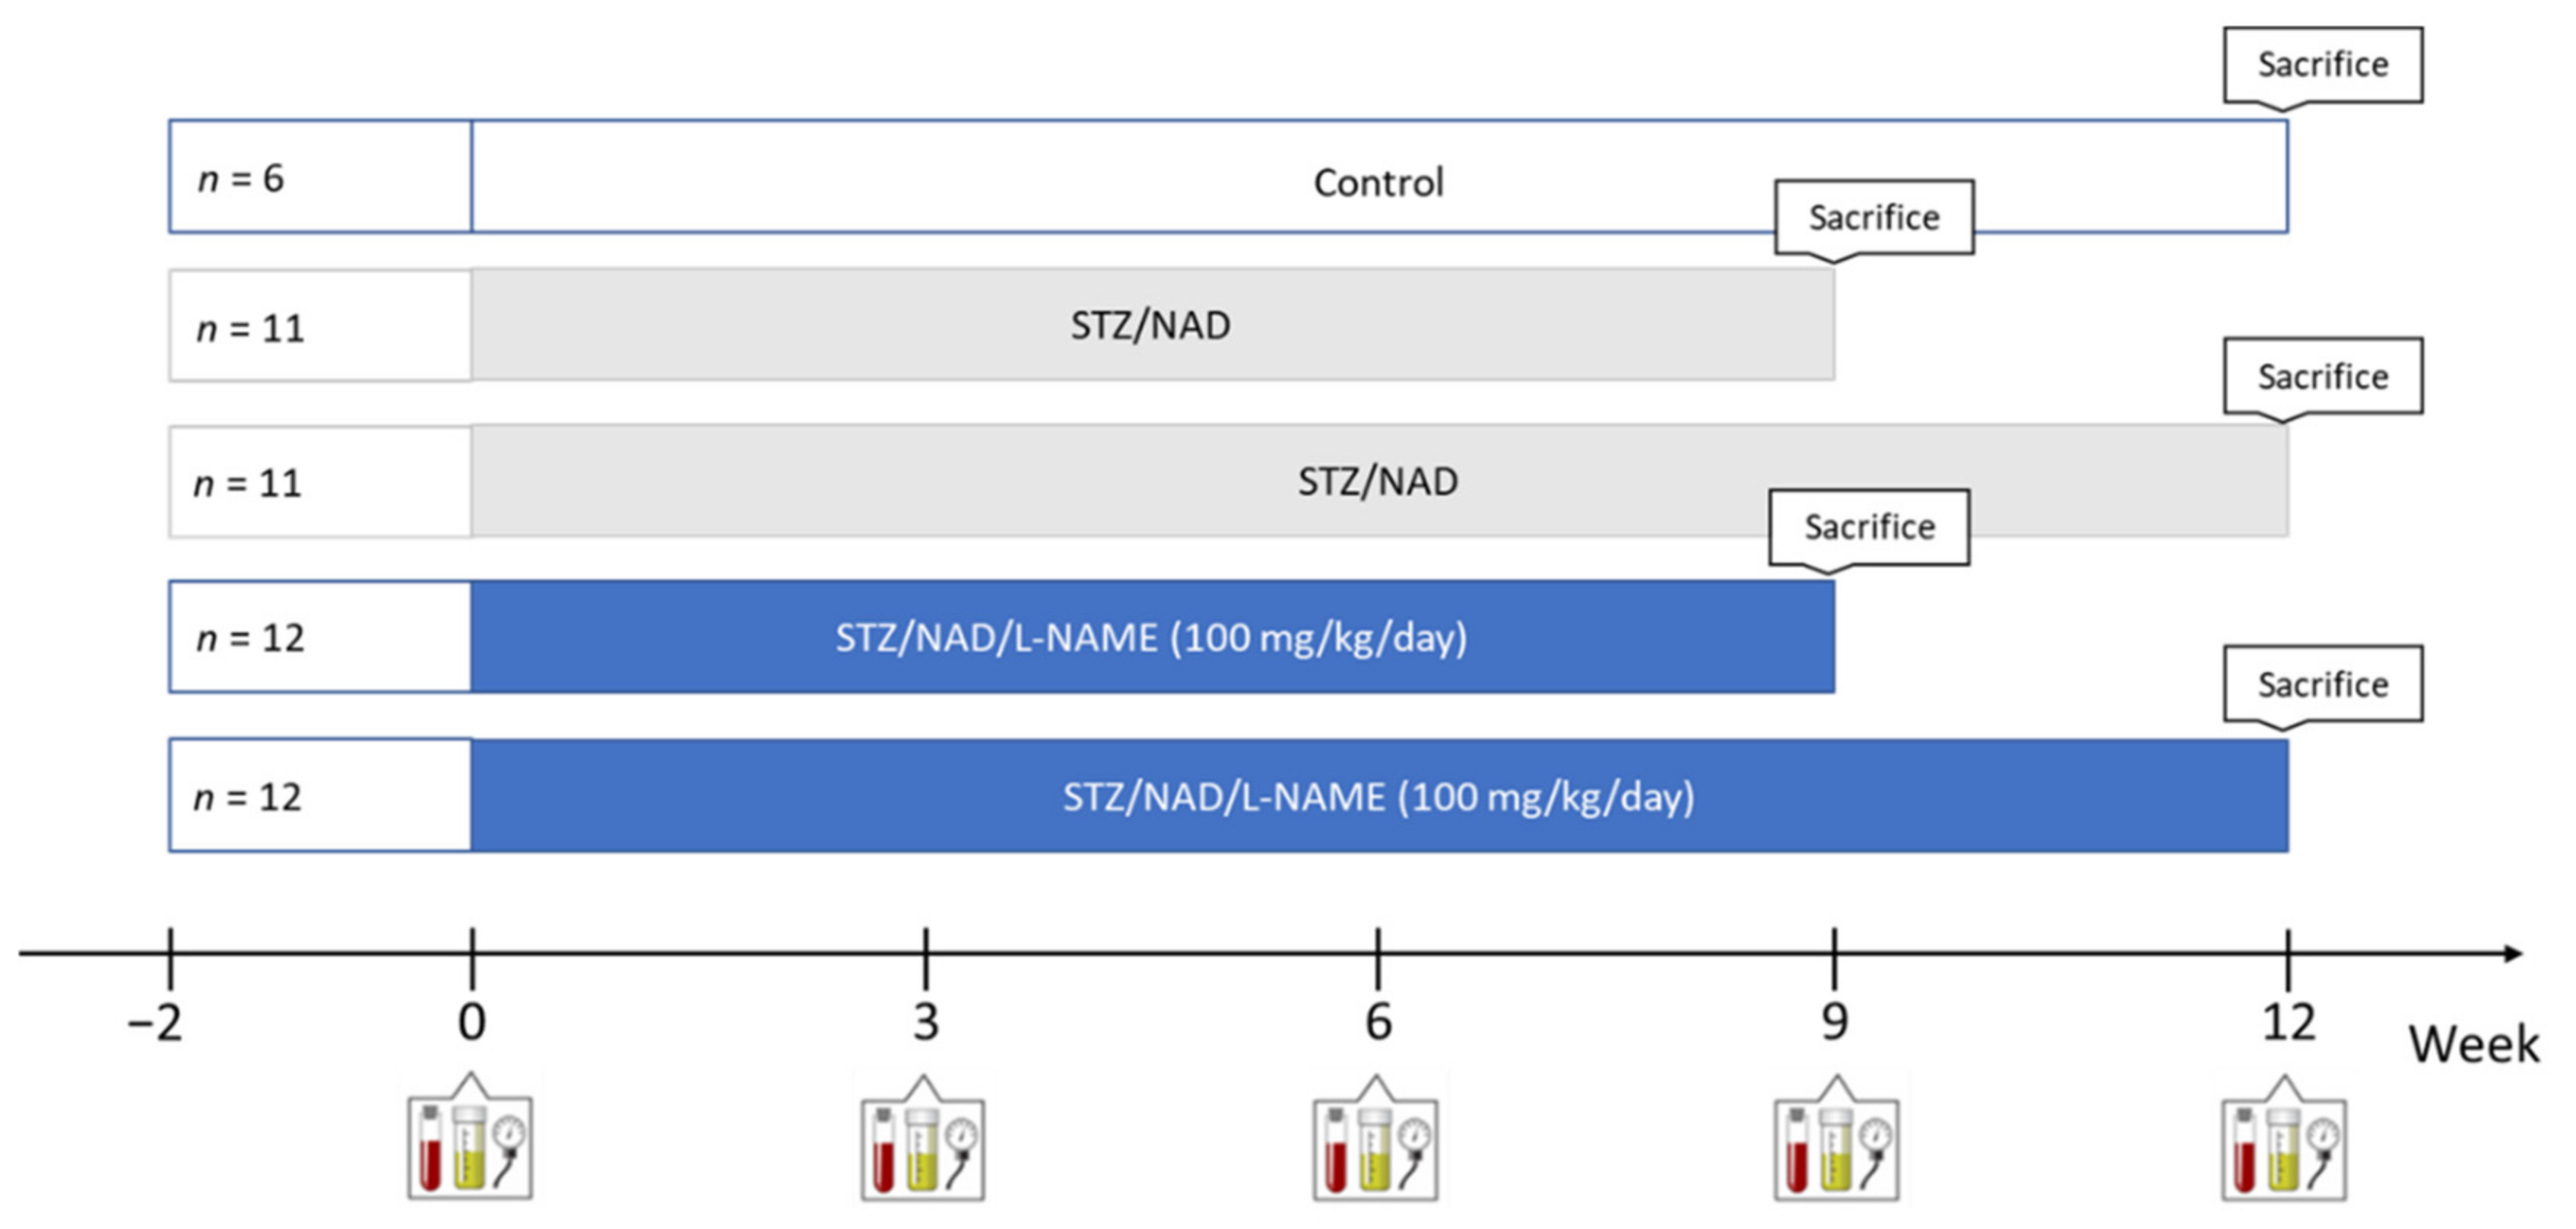
4.2. Study Design
4.3. Blood Pressure
4.4. Biochemical Analyses
4.5. Oral Glucose Tolerance Test (OGTT)
4.6. Histology
4.7. Statistics
Author Contributions
Funding
Institutional Review Board Statement
Informed Consent Statement
Data Availability Statement
Acknowledgments
Conflicts of Interest
References
- Tonneijck, L.; Muskiet, M.; Smits, M.; Van Bommel, E.J.; Heerspink, H.J.L.; Van Raalte, D.H.; Joles, J.A. Glomerular Hyperfiltration in Diabetes: Mechanisms, Clinical Significance, and Treatment. J. Am. Soc. Nephrol. 2017, 28, 1023–1039. [Google Scholar] [CrossRef] [Green Version]
- Gheith, O.; Farouk, N.; Nampoory, N.; Halim, M.A.; Al-Otaibi, T. Diabetic kidney disease: World-wide difference of prevalence and risk factors. J. Nephropharmacol. 2015, 5, 49–56. [Google Scholar] [CrossRef] [PubMed]
- Persson, F.; Rossing, P. Diagnosis of diabetic kidney disease: State of the art and future perspective. Kidney Int. Suppl. 2018, 8, 2–7. [Google Scholar] [CrossRef] [PubMed] [Green Version]
- Clarkson, M.; Brenner, B.; Magee, C. Diabetic Nephropathy. In Pocket Companion to Brenner and Rector’s the Kidney, 8th ed.; Saunders/Elsevier: Philadelphia, PA, USA, 2010; pp. 345–359. [Google Scholar]
- Mullins, L.J.; Conway, B.R.; Menzies, R.I.; Denby, L.; Mullins, J.J. Renal disease pathophysiology and treatment: Contributions from the rat. Dis. Model. Mech. 2016, 9, 1419–1433. [Google Scholar] [CrossRef] [PubMed] [Green Version]
- Betz, B.; Conway, B.R. An Update on the Use of Animal Models in Diabetic Nephropathy Research. Curr. Diabetes Rep. 2016, 16, 18. [Google Scholar] [CrossRef] [Green Version]
- Baerts, L.; Glorie, L.; Maho, W.; Eelen, A.; Verhulst, A.; D’Haese, P.; Covaci, A.; De Meester, I. Potential impact of sitagliptin on collagen-derived dipeptides in diabetic osteoporosis. Pharmacol. Res. 2015, 100, 336–340. [Google Scholar] [CrossRef]
- Sasson, A.N.; Cherney, D.Z.I. Renal hyperfiltration related to diabetes mellitus and obesity in human disease. World J. Diabetes 2012, 3, 1–6. [Google Scholar] [CrossRef] [PubMed]
- Helal, I.; Fick-Brosnahan, G.M.; Reed-Gitomer, B.; Schrier, R.W. Glomerular hyperfiltration: Definitions, mechanisms and clinical implications. Nat. Rev. Nephrol. 2012, 8, 293–300. [Google Scholar] [CrossRef]
- Hermann, M.; Flammer, A.; Lüscher, T.F. Nitric Oxide in Hypertension. J. Clin. Hypertens. 2006, 8, 17–29. [Google Scholar] [CrossRef] [PubMed]
- Libianto, R.; Batu, D.; MacIsaac, R.J.; Cooper, M.E.; Ekinci, E.I. Pathophysiological Links Between Diabetes and Blood Pressure. Can. J. Cardiol. 2018, 34, 585–594. [Google Scholar] [CrossRef]
- Knapp, M.; Tu, X.; Wu, R. Vascular endothelial dysfunction, a major mediator in diabetic cardiomyopathy. Acta Pharmacol. Sin. 2018, 40, 1–8. [Google Scholar] [CrossRef]
- Nakayama, T.; Sato, W.; Kosugi, T.; Zhang, L.; Campbell-Thompson, M.; Yoshimura, A.; Croker, B.P.; Johnson, R.J.; Nakagawa, T. Endothelial injury due to eNOS deficiency accelerates the progression of chronic renal disease in the mouse. Am. J. Physiol. Physiol. 2009, 296, F317–F327. [Google Scholar] [CrossRef] [PubMed] [Green Version]
- De Faria, J.B.L.; Silva, K.C.; De Faria, J.M.L. The contribution of hypertension to diabetic nephropathy and retinopathy: The role of inflammation and oxidative stress. Hypertens. Res. 2011, 34, 413–422. [Google Scholar] [CrossRef]
- Patney, V.; Whaley-Connell, A.; Bakris, G. Hypertension Management in Diabetic Kidney Disease. Diabetes Spectr. 2015, 28, 175–180. [Google Scholar] [CrossRef] [PubMed] [Green Version]
- Kitada, M.; Ogura, Y.; Koya, D. Rodent models of diabetic nephropathy: Their utility and limitations. Int. J. Nephrol. Renov. Dis. 2016, 9, 279–290. [Google Scholar] [CrossRef] [Green Version]
- Fried, L.F.; Emanuele, N.; Zhang, J.H.; Brophy, M.; Conner, T.A.; Duckworth, W.; Leehey, D.J.; McCullough, P.A.; O’Connor, T.; Palevsky, P.; et al. Combined Angiotensin Inhibition for the Treatment of Diabetic Nephropathy. N. Engl. J. Med. 2013, 369, 1892–1903. [Google Scholar] [CrossRef] [PubMed] [Green Version]
- Klessens, C.Q.; Woutman, T.D.; Veraar, K.A.; Zandbergen, M.; Valk, E.J.; Rotmans, J.; Wolterbeek, R.; Bruijn, J.A.; Bajema, I.M. An autopsy study suggests that diabetic nephropathy is underdiagnosed. Kidney Int. 2016, 90, 149–156. [Google Scholar] [CrossRef] [PubMed]
- Persson, P.; Hansell, P.; Palm, F. Tubular reabsorption and diabetes-induced glomerular hyperfiltration. Acta Physiol. 2010, 200, 3–10. [Google Scholar] [CrossRef] [Green Version]
- Ito, S.; Abe, K. Tubuloglomerular Feedback. Jpn. Heart J. 1996, 37, 153–163. [Google Scholar] [CrossRef] [Green Version]
- Jerums, G.; Premaratne, E.; Panagiotopoulos, S.; MacIsaac, R.J. The clinical significance of hyperfiltration in diabetes. Diabetologia 2010, 53, 2093–2104. [Google Scholar] [CrossRef] [Green Version]
- Perkovic, V.; Jardine, M.J.; Neal, B.; Bompoint, S.; Heerspink, H.J.L.; Charytan, D.M.; Edwards, R.; Agarwal, R.; Bakris, G.; Bull, S.; et al. Canagliflozin and Renal Outcomes in Type 2 Diabetes and Nephropathy. N. Engl. J. Med. 2019, 380, 2295–2306. [Google Scholar] [CrossRef] [Green Version]
- Neuen, B.; Young, T.; Heerspink, H.J.L.; Neal, B.; Perkovic, V.; Billot, L.; Mahaffey, K.W.; Charytan, D.M.; Wheeler, D.C.; Arnott, C.; et al. SGLT2 inhibitors for the prevention of kidney failure in patients with type 2 diabetes: A systematic review and meta-analysis. Lancet Diabetes Endocrinol. 2019, 7, 845–854. [Google Scholar] [CrossRef]
- Kanwar, Y.S.; Sun, L.; Xie, P.; Liu, F.-Y.; Chen, S. A Glimpse of Various Pathogenetic Mechanisms of Diabetic Nephropathy. Annu. Rev. Pathol. Mech. Dis. 2011, 6, 395–423. [Google Scholar] [CrossRef] [Green Version]
- Ames, M.K.; Atkins, C.E.; Pitt, B. The renin-angiotensin-aldosterone system and its suppression. J. Vet. Intern. Med. 2018, 33, 363–382. [Google Scholar] [CrossRef] [PubMed] [Green Version]
- Karalliedde, J.; Viberti, G. Evidence for renoprotection by blockade of the renin–angiotensin–aldosterone system in hypertension and diabetes. J. Hum. Hypertens. 2006, 20, 239–253. [Google Scholar] [CrossRef] [PubMed]
- Nauta, F.L.; Scheven, L.; Meijer, E.; Van Oeveren, W.; De Jong, P.E.; Bakker, S.J.; Gansevoort, R.T. Glomerular and Tubular Damage Markers in Individuals with Progressive Albuminuria. Clin. J. Am. Soc. Nephrol. 2013, 8, 1106–1114. [Google Scholar] [CrossRef] [Green Version]
- Higashi, Y.; Kihara, Y.; Noma, K. Endothelial dysfunction and hypertension in aging. Hypertens. Res. 2012, 35, 1039–1047. [Google Scholar] [CrossRef] [Green Version]
- Li, B.; He, X.; Lei, S.-S.; Zhou, F.-C.; Zhang, N.-Y.; Chen, Y.-H.; Wang, Y.-Z.; Su, J.; Yu, J.-J.; Li, L.-Z.; et al. Hypertensive Rats Treated Chronically With Nω-Nitro-L-Arginine Methyl Ester (L-NAME) Induced Disorder of Hepatic Fatty Acid Metabolism and Intestinal Pathophysiology. Front. Pharmacol. 2020, 10, 1677. [Google Scholar] [CrossRef] [PubMed] [Green Version]
- Paulis, L.; Zicha, J.; Kunes, J.; Hojna, S.; Behuliak, M.; Celec, P.; Kojšová, S.; Pechanova, O.; Simko, F. Regression of L-NAME–Induced Hypertension: The Role of Nitric Oxide and Endothelium-Derived Constricting Factor. Hypertens. Res. 2008, 31, 793–803. [Google Scholar] [CrossRef] [Green Version]
- Liu, T.; Zhang, M.; Mukosera, G.T.; Borchardt, D.; Li, Q.; Tipple, T.; Ahmed, A.; Power, G.G.; Blood, A.B. L-NAME releases nitric oxide and potentiates subsequent nitroglycerin-mediated vasodilation. Redox Biol. 2019, 26, 101238. [Google Scholar] [CrossRef]
- Di Vincenzo, A.; Bettini, S.; Russo, L.; Mazzocut, S.; Mauer, M.; Fioretto, P. Renal structure in type 2 diabetes: Facts and misconceptions. J. Nephrol. 2020, 33, 901–907. [Google Scholar] [CrossRef] [PubMed]
- Fioretto, P.; Caramori, M.L.; Mauer, M. The kidney in diabetes: Dynamic pathways of injury and repair. The Camillo Golgi Lecture 2007. Diabetologia 2008, 51, 1347–1355. [Google Scholar] [CrossRef] [PubMed] [Green Version]


| Week | Group | Blood Glucose Concentration (mg/dL) | |||
|---|---|---|---|---|---|
| 0 min | 30 min | 90 min | 180 min | ||
| 9 | Control | 105 ± 4 | 130 ± 6 ° | 129 ± 6 ° | 115 ± 9 |
| STZ/NAD | 285 ± 40 # | 504 ± 24 °# | 533 ± 22 °# | 505 ± 17 °# | |
| STZ/NAD/L-NAME | 440 ± 55 # | 505 ± 47 °# | 517 ± 44 °# | 476 ± 49 °# | |
| 12 | Control | 100 ± 4 | 133 ± 3 ° | 128 ± 5 ° | 113 ± 7 |
| STZ/NAD | 369 ± 48 # | 499 ± 44 °# | 514 ± 31 °# | 505 ± 40 °# | |
| STZ/NAD/L-NAME | 407 ± 49 # | 513 ± 34 °# | 525 ± 35 °# | 459 ± 46 # | |
Publisher’s Note: MDPI stays neutral with regard to jurisdictional claims in published maps and institutional affiliations. |
© 2021 by the authors. Licensee MDPI, Basel, Switzerland. This article is an open access article distributed under the terms and conditions of the Creative Commons Attribution (CC BY) license (https://creativecommons.org/licenses/by/4.0/).
Share and Cite
Corremans, R.; D’Haese, P.C.; Vervaet, B.A.; Verhulst, A. L-NAME Administration Enhances Diabetic Kidney Disease Development in an STZ/NAD Rat Model. Int. J. Mol. Sci. 2021, 22, 12767. https://doi.org/10.3390/ijms222312767
Corremans R, D’Haese PC, Vervaet BA, Verhulst A. L-NAME Administration Enhances Diabetic Kidney Disease Development in an STZ/NAD Rat Model. International Journal of Molecular Sciences. 2021; 22(23):12767. https://doi.org/10.3390/ijms222312767
Chicago/Turabian StyleCorremans, Raphaëlle, Patrick C. D’Haese, Benjamin A. Vervaet, and Anja Verhulst. 2021. "L-NAME Administration Enhances Diabetic Kidney Disease Development in an STZ/NAD Rat Model" International Journal of Molecular Sciences 22, no. 23: 12767. https://doi.org/10.3390/ijms222312767