Abstract
A study of the influence of chronic alcohol intoxication, constant illumination and their combined effects on the morphofunctional state of the rat liver and the circadian rhythms (CR) of the studied parameters of the organism was carried out. It was found that both alcohol and constant illumination caused significant changes in the structure of the liver, as well as in the circadian rhythmicity of micromorphometric parameters of hepatocytes, ALT, and total and direct bilirubin rhythms; however, the combined effects of ethanol and constant illumination had the most significant effect on the studied parameters of the organism. These two factors caused disturbances in the circadian rhythms of the micromorphometric parameters of hepatocytes, disruption of the circadian rhythms of total protein, albumin, AST, ALT, and direct and total bilirubin, as well as disturbances in the expression and rhythmicity of the studied clock genes against a background of the development of an inflammatory process in the liver.
1. Introduction
Alcohol abuse is one of the most important health and social problems in modern society. Furthermore, the liver is one of the organs most significantly affected by alcohol intoxication. Systematic alcohol consumption leads to disruption of the structure and function of the liver, which, in turn, alters the metabolism of other organs. Alcoholic liver disease (ALD) include several sequential clinical and morphological forms, which are stages of a single pathological process caused by prolonged alcohol use [1,2].
The rhythmicity of vital processes, which is one of the fundamental properties of living matter, includes periodic changes and the integration of various processes specific to biological systems at different levels of organization [3]. For biological processes, rhythms with different frequencies from fractions of a second to tens of years are described, but one of the most significant types of biorhythms in mammals, including humans, are diurnal or circadian rhythms (CR) [4,5]. The separate CRs of distinct biological processes in the various organ systems form a precisely coordinated ensemble—the chronostructure of the organism. The presence of an organized rhythmic structure of biological processes provides the necessary order of their occurrence, which determines the maintenance of the functioning of body systems at an optimal level [6,7,8,9].
The coordination of mammalian CRs is genetically determined, but at the same time, it is plastically modulated under the influence of periodic factors in the external and internal environment—synchronizers, or pacemakers [10,11]—the leading role of which is played by the light cycle. Violation of the normal rhythm (changes in the amplitude and/or phase characteristics of the rhythm) of the vital processes of an organism causes the appearance of desynchronosis, which can lead to the development of diseases and pathological conditions [12,13,14,15,16].
To date, it has been established that most of the CRs of the liver, as in other organs, are autonomous in the absence of the influence of external pacemakers. In hepatocytes, the biological clock at the molecular level, which ensures CR autonomy, includes the Bmal gene paired with the Clock gene, the Per gene family (Per1, Per2, Per3), and the Cry genes (Cry1, Cry2, encoding cryptochrome proteins) [17,18]. It has been shown that the rhythm of expression of clock genes persists in the dark, but also that a number of rhythms can be destroyed [19,20]. It has been proven that the main function of changes in light and darkness, as a pacemaker, is to influence the CR period and the amplitude, gene expression, and harmonization of rhythms with each other [21].
The main drivers of circadian rhythms in mammals are the suprachiasmatic nuclei of the hypothalamus (SCN). From the outside, the rhythm-organizing function of the SCN is modulated by environmental time setters, the main of which is light. In addition, correction of the functional state of pacemakers in the brain and beyond is carried out by various neurotransmitters and hormones. The leading role in the external regulation of liver CRs belongs to the hypothalamus–pituitary–adrenal axis and the pineal gland [22]. Another time setter that determines the CR structure of a number of organs, including the liver, is feeding. Metabolic processes easily get out of control of the SCN when food intake is desynchronized with normal daily activity. In this situation, mealtime (feeding time) becomes the dominant control factor [23,24,25].
A significant factor in the disorganization of biorhythms in the modern world is so-called light pollution, which causes a disruption of the light–dark cycle. For many reasons of social origin (overtime and shift work, prolonged interaction with digital equipment, transmeridian flights, etc.), a modern person is almost inevitably exposed to abundant exposure to artificial lighting at night, which often leads to the development of desynchronosis [26]. At present, the effect of light at night on CRs is well described. It has been established that light pollution, provoking desynchronosis, can be one of the causes of a number of pathologies [27]. It was shown that changes in lipid and carbohydrate metabolism correlate with the level of light pollution [28,29], disruptions of the light cycle are one of the possible preconditions for the occurrence of metabolic syndrome and can increase the risk of developing type 2 diabetes mellitus and atherosclerosis [16,30]. There is evidence that changes caused by chronic desynchronosis can lead to the development of malignant liver tumors [31,32].
Likewise, ethanol has a pronounced chronodestructive effect on the CRs of organisms that largely determines increases in the susceptibility of the gastrointestinal tract and liver to alcohol-induced damage and makes a significant contribution to the severity of alcohol pathology [33,34,35,36,37]. As such, in alcoholism, CR synchronization disorders are one of the first symptoms [38,39].
A large amount of data [35,40] has shown that Clock- and Per2-knockout mice develop alcohol-induced steatosis, fibrosis, and cirrhosis of the liver much faster than controls. In turn, inflammation and cytokines, being two of the key components of the pathogenesis of alcoholic liver damage [41,42], can also disrupt the normal functioning of circadian genes [43,44].
Nevertheless, the literature available to us does not describe the effects of the joint impact of chronic alcohol intoxication (CAI) and constant lighting both on the structure of the liver and on its CRs, although both of these factors are chrono-destructive and affect the morphofunctional integrity of this organ. Based on this, we conducted a study of the effect of constant illumination, 21-day alcohol intoxication and the combined influence of these factors on the structure, function and some CRs of the liver.
The modification of morphological state of hepatocytes, which has a wide range of variations, is a reflection of their functional changes [45]. The linear dimensions of hepatocytes and their nuclei, their nuclear–cytoplasmic ratio, a number of other micromorphometric parameters, as well as some biochemical and immunohistochemical parameters, are significant indicators for assessing the state of the liver [46].
2. Results
2.1. Influence of Constant Lighting and CAI on the Morphofunctional Condition of the Liver
The morphological pattern of the liver in the rats of the control group corresponded to the age norm, i.e., the liver had a preserved structure of hepatic cords, composed of polygonal hepatocytes with a rounded, centrally located nucleus without signs of dystrophic changes and necrosis (Figure 1A). In the liver of rats in the first experimental group, a significant number of vacuole-containing hepatocytes were found (Figure 1B). The control staining with Sudan-III verified the presence of lipid drops in the cytoplasm of the hepatocytes in this group, which indicates the beginning of the development of fatty degeneration of the liver. At the same time, in this group, we observe both single cells and groups of hepatocytes in a state of necrosis and apoptosis (Figure 2A).
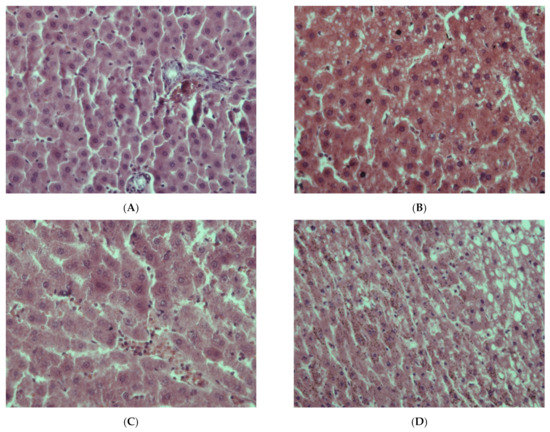
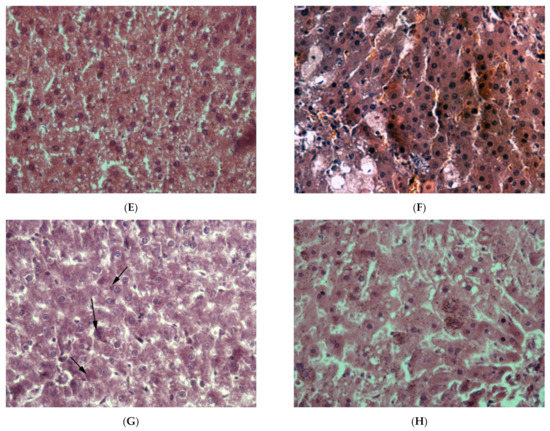
Figure 1.
Liver of rats: (A)—Control; (B)—EtOH; (C)—CL; (D–F)—EtOH + CL; (G)—EtOH + CL, arrows indicate the Mallory–Denk bodies; (H)—EtOH + CL, Hematoxylin–eosin staining. (A–C,E–H) ×400, (D) ×200. Note: hereafter, Control—control group, EtOH—first experimental group, CL—second experimental group, EtOH + CL—third experimental group.
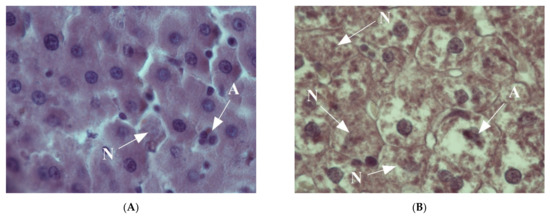
Figure 2.
Livers of rats: (A)—Control; (B)—EtOH + CL. Arrows show the cells in conditions of: A—apoptosis; N—necrosis. Hematoxylin–eosin staining, ×1000.
The livers of rats of the second experimental group retained a practically normal structure, but single necrotic hepatocytes appeared in them, as well as cells with signs of fatty degeneration, in which the presence of small lipid-containing vacuoles was noted (Figure 1C).
In the livers of rats of the third experimental group, a pattern representative of the development of alcoholic hepatitis was revealed (Figure 1D–F); inclusions of lipofuscin and Mallory–Denk bodies were also found (Figure 1G,H). Numerous necrotic cells were noted, as well as cells in the process of apoptosis (Figure 2B), and infiltrates consisting of neutrophilic leukocytes, lymphocytes and macrophages. A significant portion of the hepatocytes were in a state of small- and large-droplet fatty degeneration (Figure 3). The cord structure of the organ was violated, and the small monomorphic regenerate nodes (false lobules), separated by narrow layers of connective tissue, were revealed.
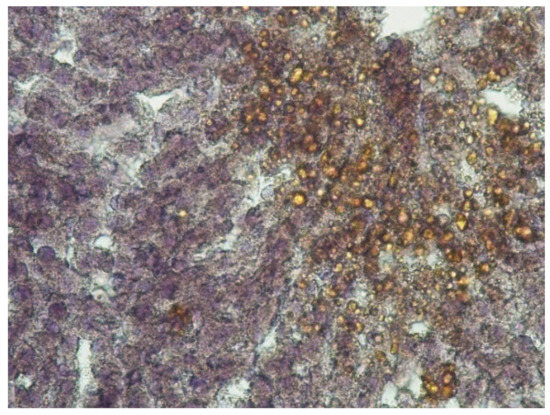
Figure 3.
Lipid-containing vacuoles in the hepatocytes. EtOH + CL. Sudan-III staining with hematoxylin afterstain, ×200.
The results of the karyometry showed that the perimeters of the hepatocyte nuclei, as well as their cross-sectional areas and volumes in the first and second experimental groups largely corresponded to the parameters of the control group; however, in the third experimental group, there was a significant decrease in these parameters as compared to the controls, and the ratio of the nucleus volume to the area was also significantly reduced (Table 1)—at the same time, the NCR values in this group were significantly lower than in the first group, and were the lowest in the second group.

Table 1.
Results of the micromorphometric study of hepatocytes of rats.
The value of the mean diameter of the nuclei of hepatocytes, on the contrary, was significantly higher in the second group in comparison to the control parameters— which also indicates a change in the elongation index and shape of the nuclei.
While constant illumination (second group) led to a significant increase in the cross-sectional area of hepatocytes, a significant number of small cells were detected in the liver under the combined effect of ethanol and constant illumination (third group), which was manifested by a decrease in the mean cross-sectional area of the hepatocytes in comparison to the second group, to values close to those of the control group. In the third group, changes were noted only in terms of the parameters of the shape of nuclei (contour index, coefficient of form), while the values of their diameters and elongation indices were identical to those of the control group. Changes in the proportion of binuclear cells were statistically significant only in the livers of animals in the second group.
2.2. Study of the Diurnal Dynamics of Cross-Sectional Areas of Nuclei, Areas of Cells, and NCR
When considering the daily dynamics of the studied parameters, it was found that they significantly differed in the experimental groups from the control parameters (Figure 4, Figure 5 and Figure 6).
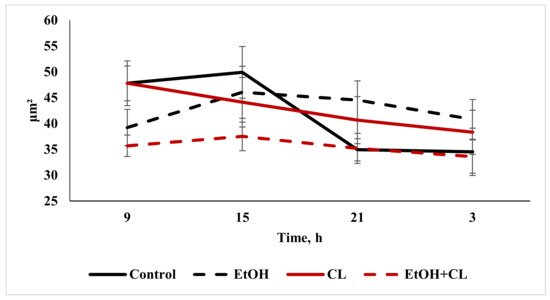
Figure 4.
Daily dynamics of area of nuclei of hepatocytes of rats.
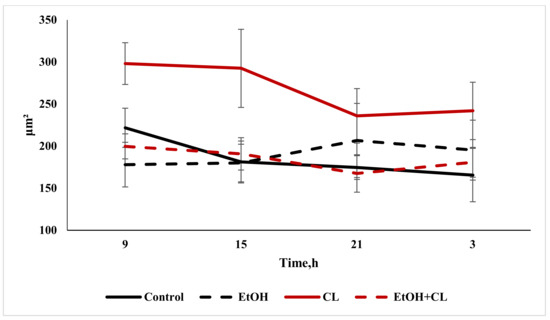
Figure 5.
Daily dynamics of area of hepatocytes in rats.
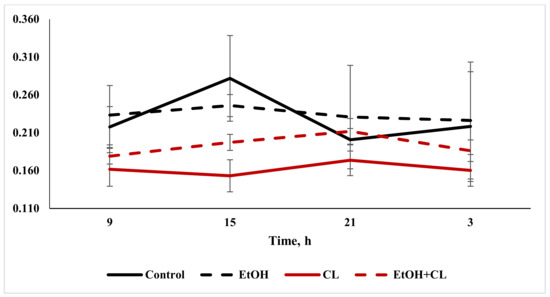
Figure 6.
Daily dynamics of NCR in hepatocytes of rats.
The results of the cosinor analysis (Table 2) indicated the presence of a reliable circadian rhythm in the parameters of the area of the nuclei, the area of the cell and the NCR in the hepatocytes of the rats in the control group. In the first experimental group, as a result of three weeks of alcohol intoxication, the CRs of the cell area and the NCR were destroyed and the rhythm of the nuclear area was shifted (Table 2).
Table 2.
Cosinor analysis of the micromorphometric parameters of rat livers.
Constant lighting led to the destruction of the rhythm of the NCR and a significant shift in the rhythms of nuclei and cells (Table 2).
In the third experimental group, despite the disrupted rhythm of the nucleus area, the rhythms of the cell area and the NCR were preserved (Table 2).
2.3. Influence of Constant Lighting and CAI on Several Biochemical Parameters
Analysis of glucose content in the blood plasma of rats allowed us to establish that, in animals of the first and second groups, the value of this parameter increased from 7.10 ± 1.51 mmol/L in the control group to 9.11 ± 2.88 mmol/L and 8.26 ± 1.35 mmol/L, respectively—at the same time, in animals of the third group, the glucose content was much lower: 5.70 ± 1.40 (Figure 7; Table 3).
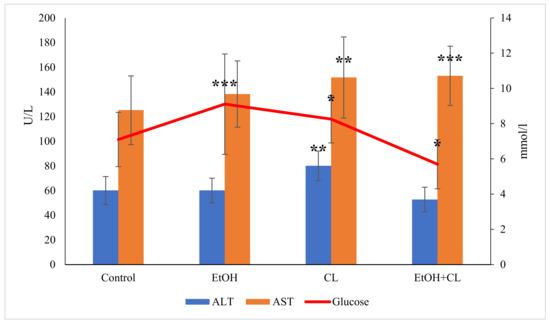
Figure 7.
Glucose content and activity of ALT and AST in the blood plasma of rats, * p < 0.05, ** p < 0.01, *** p < 0.001.
Table 3.
Cosinor analysis of the biochemical parameters of rat livers.
The value of ALT was almost unchanged in the first and third experimental groups, at 60.12 ± 9.93 U/L and 52.81 ± 10.00 U/L, respectively, against 60.16 ± 11.37 U/L in the control group. The activity of ALT in the blood plasma of rats in the second group increased to 80.10 ± 10.50 U/L, which was higher than the values of all the other groups (Figure 7).
The activity of AST in the control group was 125.2 ± 27.90 U/L; in the second and third groups it increased significantly to 151.80 ± 32.99 U/L and 153.1 ± 24.06 U/L, respectively.
The total protein content in the blood plasma of animals in the control group was 68.55 ± 8.19 g/L; at the same time, in the blood plasma of rats in the experimental groups it was lower: 59.71 ± 8.52 g/L in the first, 60.87 ± 8.22 g/L in the second and 61.96 ± 6.68 g/L in the third group (Figure 8).
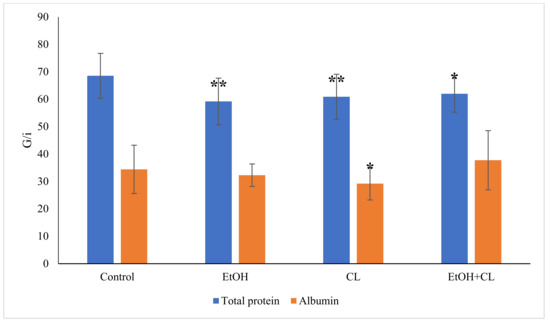
Figure 8.
Total protein and albumin content in the blood plasma of rats, * p < 0.05, ** p < 0.01.
The albumin content decreased significantly only in the second group, at 29.17 ± 5.91 g/L against 34.44 ± 8.80 g/L in the control group (Figure 8).
When analyzing the content of direct bilirubin, there were no significant differences from the control level of 10.64 ± 3.33 µmol/L. Total bilirubin content increased significantly in the blood of animals in the first and third groups, reaching levels of 30.15 ± 9.50 µmol/L against 21.12 ± 9.16 µmol/L in the control group (Figure 9).
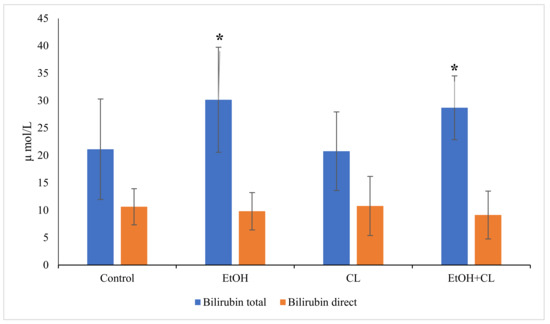
Figure 9.
Content of direct and total bilirubin in the blood plasma of rats, * p < 0.05.
2.4. Influence of Constant Lighting and CAI on the Organization of the Circadian Rhythms of Several Biochemical Parameters
Analysis of the daily rhythm of glucose allowed us to detect the presence of a maximum level of this parameter at 15:00, with minimum values at 3:00 in the blood plasma of rats in the control group. In animals of the first group, at a maximum at 21:00, the same minimum was maintained. In the second group, the same extrema as in the control group were highlighted on the smoothed chronogram, and in the animals of the third group, the maximum fell at 9:00, with a minimum at 21:00 (Figure 10).
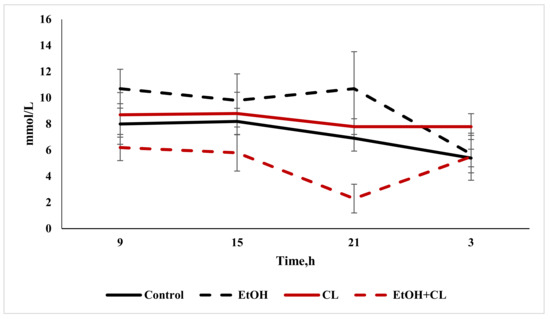
Figure 10.
Daily fluctuations in blood glucose of rats.
The results of the cosinor analysis indicated the presence of reliable CRs for this parameter in animals of all groups. With sufficiently pronounced amplitude fluctuations, the acrophases of the rhythm occurred during the daytime in all groups (Table 3).
The diurnal rhythm of ALT in the blood plasma of rats in the control group showed its maximum at 9:00 and its minimum at 3:00. In animals of first group, the maximum value shifted at 15:00, with the minimum at 9:00. The ALT rhythm in the second group was a little more pronounced than in the control, with the same extrema. In the blood plasma of rats of the third group, the maximum activity of the enzyme was noted at 15:00, and it was least active at 9:00 (Figure 11).
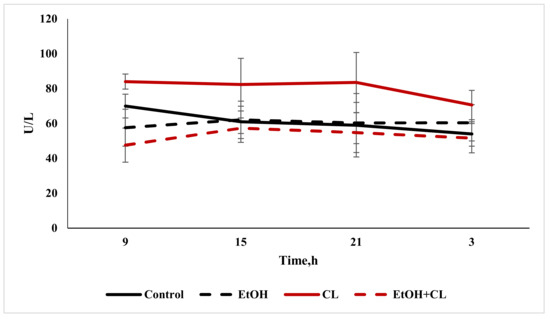
Figure 11.
Daily fluctuations in the activity of ALT in the blood plasma of rats.
The results of the cosinor analysis showed the presence of a reliable CR of activity of ALT in rats of the control group only.
Analysis of the daily activity of AST in the blood of rats in the control group made it possible to establish the presence of a maximum at 15:00 with a minimum at 9:00. In the first group, with the same maximum, the minimum point of the rhythm shifted at 3:00; in the second group, with a maximum at 9:00, the minimum values were noted at 21:00; and the chronogram of the third group was characterized by a maximum value at 9:00, and a minimum at 3:00 (Figure 12).
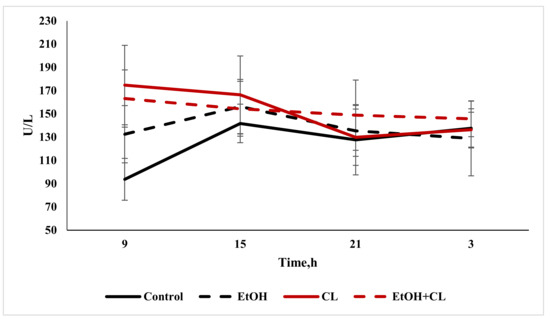
Figure 12.
Daily fluctuations in the activity of AST in the blood plasma of rats.
Cosinor analysis showed the presence of a reliable CR of activity for AST in the control group, and also in animals of the first and second control groups, which significantly differed from the control parameters.
The maximum total protein content in the blood plasma of rats in the control group was found at 15:00, with a decrease at 3:00. Under the influence of ethanol under fixed lighting conditions, the maximum total protein content occurred at 15:00, with a minimum at 9 h; under constant lighting, the maximum total protein level was noted at 9:00, and the minimum at 21:00. In the blood plasma of rats in the third group, the lowest protein content was noted at 9:00, with the maximum occurring at 15:00 (Figure 13).
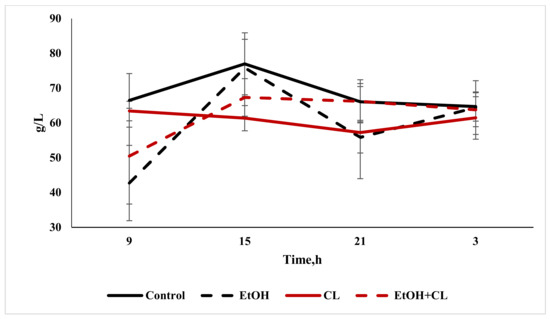
Figure 13.
Daily fluctuations in total protein levels in the blood plasma of rats.
Cosinor analysis made it possible to establish the CRs of the total protein levels, differing in their phase-amplitude characteristics, in each group—except for the third.
The maximum content of albumin in the control group was noted at 15:00; furthermore, its content decreased to a minimum at 3:00. In animals of the first group, with the same maximum, the minimum albumin content was found at 21:00—while in the second group, the minimum level was noted at 9 h, with a maximum at 3:00. In the third group, with a minimum at 21:00, the levels of this protein increased significantly by 3:00 (Figure 14).
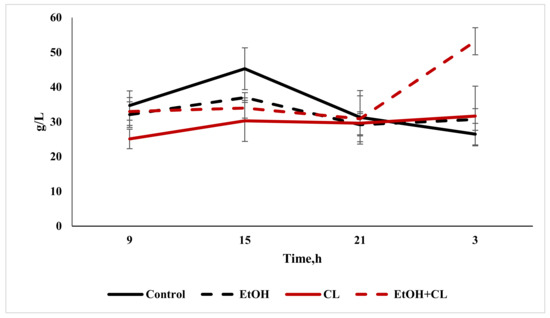
Figure 14.
Daily fluctuations in albumin levels in the blood plasma of rats.
As in the case of total protein levels, the same CRs for albumin were found in the control group and in the first and second experimental groups.
The maximum value of direct bilirubin content in the blood of control rats was found at 21:00 and the minimum at 9:00. In the rats of the first group, with a maximum at 15:00, the decrease in bilirubin content to a minimum occurred at 3:00. In animals of the second group, the maximum value of direct bilirubin content was also noted at 15:00, with a minimum at 3:00—but in rats of the third group on the other hand, the maximum occurred at 3:00, and the minimum at 15:00 (Figure 15).
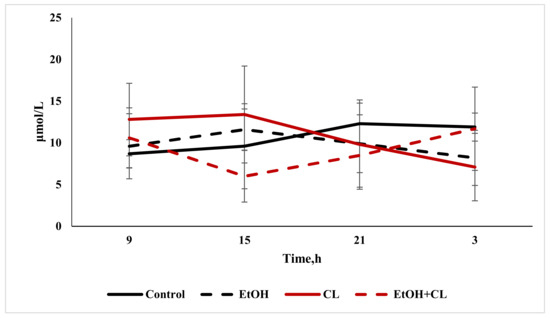
Figure 15.
Daily fluctuations of direct bilirubin content in the blood plasma of rats.
The results of the cosinor analysis made it possible to establish a reliable CR of direct bilirubin in rats of the control group only.
Daily fluctuations in the level of total bilirubin in the blood plasma of rats in the control group were characterized by a minimum at 9:00 and maximum values at 3:00. In the first and second groups, the rhythm was significantly smoothed—in the former with a maximum at 15:00 and a minimum at 21:00; in the latter, contrarily, the maximum was noted at 21:00, with a minimum at 15:00. In the third group, maximum values of total bilirubin level were found at 3:00, and minimum values at 15:00 (Figure 16).
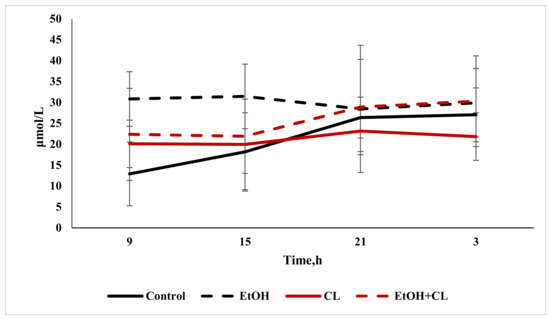
Figure 16.
Daily fluctuations of total bilirubin in the blood plasma of rats.
According to the results of the cosinor analysis, a reliable CR for this parameter was noted in the control group only.
2.5. Influence of Constant Illumination and CAI on Gene Expression
Results of immunohistochemical studies testify that the proportion of Ki-67-positive cells significantly increased in the liver of rats in the third group. The intensity of p53 expression was significantly higher than in the controls in the hepatocytes of rats from all the experimental groups. At the same time, in animals of the experimental groups, the proportion of Bmal1-positive cells significantly decreased, but the number of cells displaying Per2 expression increased. Expression of Adh5 significantly increased in the liver cells of animals in the first and third experimental groups (Table 4).
Table 4.
Results of the immunohistochemical study on rat hepatocytes, * p < 0.05, ** p < 0.01, *** p < 0.001.
2.6. Influence of Constant Lighting and CAI on the Organization of Circadian Rhythms for the Expression of Several Genes
When studying the diurnal dynamics of Ki-67 expression, we found that in the control group, the maximum expression was observed at night, and the minimum in the daytime. In the hepatocytes of rats of the first experimental group, the maximum expression was noted at 9:00, and the minimum at 21:00. In the rats of the second group, showing the same maximum, the minimum values were noted at 3:00. In the hepatocytes of animals of the third group, the maximum expression of Ki-67 was noted at 15:00, and the minimum at 3:00 (Figure 17).
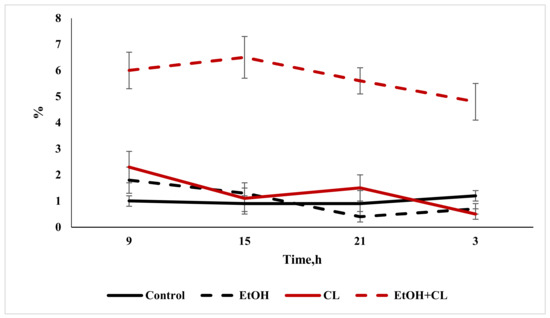
Figure 17.
Daily fluctuations in the expression of Ki-67 in rat hepatocytes.
The cosinor analysis made it possible to establish reliable CRs for Ki-67 expression in the hepatocytes of rats of the control group and the first group, with pronounced amplitude-phase differences between them (Table 4).
When considering the daily dynamics of p53 expression in the control and first experimental group, the maximum gene expression was found at 15:00, with a minimum at 9:00. In animals of the second group, the minimum occurs by 3:00, and in rats of the third group, with the same minimum at 3:00, the maximum values were noted in 9:00. Chronograms in the last two groups are smoothed (Figure 18).
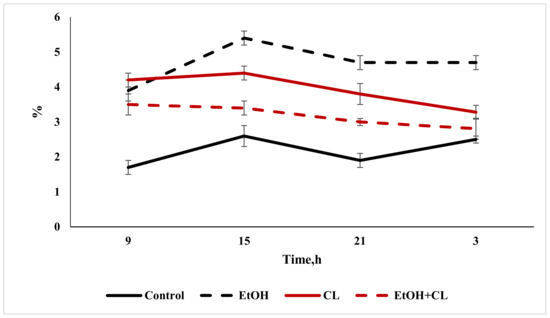
Figure 18.
Daily fluctuations in the expression of p53 in rat hepatocytes.
The cosinor analysis conducted showed the presence of significant CRs for p53 expression in the liver of rats of the control and first groups (Table 5).
Table 5.
Cosinor analysis of biochemical parameters in the livers of rats.
When studying the daily dynamics of Bmal1 expression in the hepatocytes of rats of the control group, we found a maximum at 15:00 and a minimum at 3:00. In animals of the first and third experimental groups, the maximum was noted at 9:00, with the same minimum as in the controls. In the hepatocytes of rats of the second group, with a maximum at 9:00, the minimum shifted by 21:00 (Figure 19).
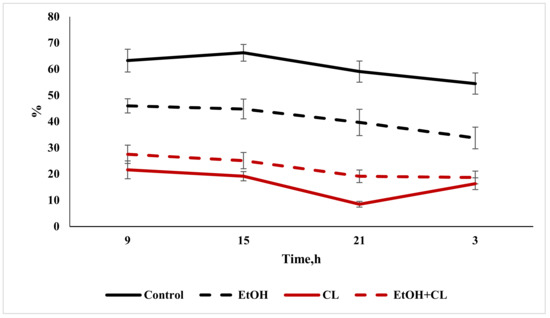
Figure 19.
Daily fluctuations in the expression of Bmal1 in rat hepatocytes.
At the same time, the results of the cosinor analysis showed the presence of reliable CRs for this parameter only in the hepatocytes of the animals of the control and the second experimental groups.
The daily rhythmicity of Per2 expression in the hepatocytes of intact animals was characterized by a maximum at 3:00 and a minimum at 15:00. In the liver of rats in the first experimental group, the maximum shifted by 21:00, and the minimum expression was noted at 9:00. In the animals of the second group, with a maximum at 15:00, the minimum was displaced by 3:00, and in the third group, with a smooth rhythm, the maximum was noted at 3:00 and the minimum at 21:00 (Figure 20).
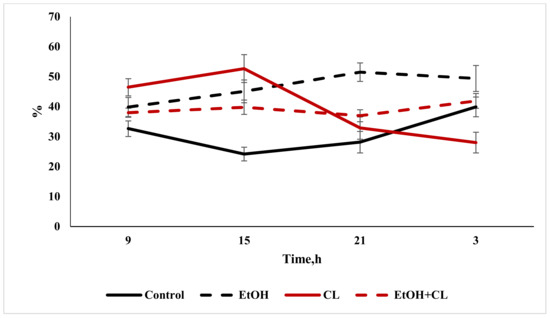
Figure 20.
Daily fluctuations in the expression of Per2 in rat hepatocytes.
The cosinor analysis also showed the presence of reliable CRs for the expression of Per2 in the control and second experimental groups.
In the hepatocytes of rats in the control and second experimental groups, daily fluctuations of Adh5 were extremely weak—the maximum expression in the controls was found at 9:00, with a minimum at 21:00; in the second group, both extrema were shifted to the previous time points. In the rats of the first experimental group, the maximum was noted at 3:00, and the minimum at 15:00; in the animals of the third group, the pattern of the rhythm was opposite (Figure 21).
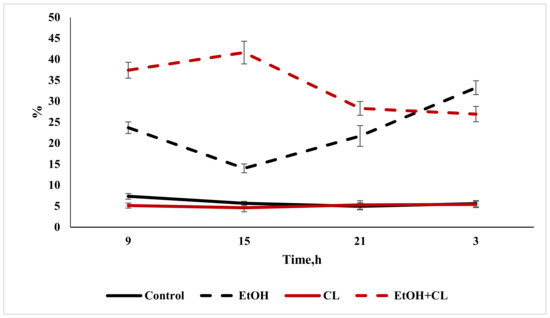
Figure 21.
Daily fluctuations in the expression of Adh5 in rat hepatocytes.
According to the cosinor analysis, CRs for Adh5 expression were observed in the control group, as well as in the hepatocytes of the animals of the first and third experimental groups.
3. Discussion
The analysis of pathomorphological changes in the liver allowed us to establish that the joint influence of two factors—constant lighting and chronic alcoholic intoxication—leads to significant alterations in the morphofunctional condition of the liver within three weeks.
In particular, if the influence of alcohol under a regime of alternating light and darkness provokes the occurrence of fatty degeneration of the liver, the same factor in combination with constant illumination will lead to the development of hepatitis; in some animals, there were already signs characteristic of liver cirrhosis.
The mechanisms underlying the development and progression of liver pathologies are not completely clear [47], but there are a number of common features in the pathogenesis of ALD and NAFLD [48]. The basis of alcoholic liver disease, as well as that of NAFLD, which can be combined, is steatosis (fatty liver), which is considered a benign and reversible condition. The mechanism of transformation of steatosis into steatohepatitis includes several pathogenetic links that are identical in both non-alcoholic and alcoholic liver damage. In the case of persistence of the damaging factor (in NAFLD, the state of insulin resistance), regeneration slows down and hepatocytes are replaced by an excess amount of extracellular matrix proteins, including fibrillar collagen—the distribution of which depends on the damaging factor. NAFLD is characterized by a perihepatocellular centrilobular fibrosis, while for ALD, a pericentral or perisinusoidal fibrosis is characteristic. Fibrosis can progress to septa and cirrhosis formation. In addition, it has been shown that in the development of NAFLD, a disruption of the day/night cycle is one of the contributory factors [49].
The conducted study established that chronic alcohol intoxication under conditions of a fixed light regime over three weeks does not provoke considerable changes in the studied micromorphometric parameters of hepatocytes, which is associated with the short-term influence of ethanol on the liver.
In the liver of rats in the second experimental group, there were significant deviations in several parameters from the values of the control group (hypertrophy of hepatocytes, changes in diameters of nuclei, etc.).
According to some sources, hypertrophy of hepatocytes is observed in cases of polyploidization of nuclei and in the formation of binuclear cells; however, a decrease in the proportion of binuclear hepatocytes occurs in the liver of rats in this group, which indicates a suppression of proliferative processes [50]. It has been shown [51] that melatonin has the ability to activate the proliferation of hepatocytes by inhibiting IKKα, JNK1 and cJUN (c-Jun N-terminal kinases), which oppress mitotic and apoptotic activity, and that the absence of pineal melatonin causes a decrease in mitotic activity [52]. It is known that increases in the number of binuclear hepatocytes is one of the effects of melatonin [53].
At the same time, a number of researchers have suggested that some functions of di- and polyploid hepatocytes may differ. It has been found that diploid hepatocytes accelerate liver regeneration caused by resection and can accelerate compensatory regeneration after acute injury, and that polyploid cells protect the organ from tumor initiation in hepatocellular carcinoma and promote adaptation to chronic damage [54,55,56]. Kreutzer C. [57] has proposed the consideration of nuclear ploidy as a new factor in hepatocyte diversity and has described various biological functions in polyploid and diploid hepatocytes.
In turn, an increase in the linear dimensions of hepatocytes after three weeks under constant illumination is the result of an increase in their functional activity. Growth in the size of hepatocytes can be an indicator of the activation of intracellular plastic processes that increase the energy capabilities of cells. Such changes have been described for the liver under conditions of chronic stress, such as the 21 day darkness deprivation.
Enhancements in the areas of hepatocytes are associated with an increase in levels of stress hormones. Stimulation of α1-adrenoreceptors increases the nuclear volume of hepatocytes and the density of nucleoli due to the release of intracellular Ca2+ and the subsequent activation of DNA polymerase. In addition, endotoxins and TNFα increase the volume of hepatocytes by activation of signaling pathways and retention of sodium and water [58,59].
In turn, the development of small-drop fatty degeneration in hepatocytes under stress is a described phenomenon; it correlates with the duration of stress exposure [60,61], is associated with an increase in the level of adrenal cortex hormones—primarily glucocorticoids, which cause an increase in the expression of serotonin 5-HT2A and 5-HT2B receptors and tryptophan hydroxylase 1—as well as in the synthesis of serotonin [62]. The accumulation of lipid droplets by hepatocytes under stress is accompanied by an increase in lipolysis gene expression and β-oxidation of fatty acids [63,64].
Increases in mean nuclear diameter, along with a simultaneous decrease in their elongation index and a tendency to increase in size, indicates the development of pathological changes in the nuclei [65].
In hepatocytes of rats of the third experimental group, the deviations in the values of the studied karyometric parameters (a decrease in the cross-sectional area, perimeter and volume of the nuclei, a decrease in the NCR as well as in the ratio of the volume of the nucleus to its area, and an increase in the proportion of binuclear hepatocytes) from the control parameters were more pronounced. At the same time, a decrease in the contour index against the background of an increased coefficient of form indicated ongoing processes of nuclear decomposition, which were more pronounced than in the previous groups—making it possible to identify them by previously described methods of light microscopy [66].
In the hepatocytes of the animals in this group, a significant increase in the expression of Ki-67 was noted. These data testify that the combined effect of two stress factors leads to an intensification of the proliferative process, i.e., reparative regeneration.
In turn, an increase in p53 expression in the hepatocytes of rats of all the experimental groups indicated an increase in the apoptotic activity of hepatocytes under the influence of the studied factors [67]. Decreases in the expression of Bmal1 and increases in the expression of its antagonist Per2 served as a confirmation of the chronodestructive effects of both constant lighting and ethanol. It is natural that the expression of Adh5 was higher in the hepatocytes of rats that consumed ethanol.
As a result of the study, it was found that both alcohol intoxication and constant illumination cause significant changes in the structure of the CRs of the studied parameters, both as separate and combined actions. The CR of the area of the nucleus, although it changes under the influence of ethanol and constant illumination, acting separately, is disrupted only under the combined action of these two factors.
The most stable and least labile CR was the CR of the cell area. Being disrupted in the liver of rats of the first experimental group, it was present in the second and third groups, with characteristics close to the control group. The influence of alcohol manifested itself differently in relation to this parameter, depending on the lighting regime—causing rhythm disruption under a fixed light regime, but not exerting the same effect under constant lighting.
We did not find an explanation for this fact in the available literature. However, it can be assumed that in the first experimental group, ethanol, influencing the pineal gland, causes a disturbance in the rhythm of the functioning of this organ—indirectly causing the destruction of the CR of the cell area. In animals of the second and third experimental groups, under constant illumination, there was no production of pineal melatonin, but it can be assumed that the role of pacemaker in this case was played by some other structure or process that does not depend on the action of ethanol and melatonin. This assumption is supported by the closeness of the CR acrophases in these groups. Intracellular processes associated with the regulation of the rhythms of the molecules that form the cytoskeleton of the cell can be proposed as candidates for this role. Thus, the maximum content of actin fibers in hepatocytes, and, accordingly, their largest sizes, was observed at 10:00 [68], and the acrophases of the rhythms of hepatocyte sizes established by us were at 10:13 in the control, 11:37 in the second and 10:09 in the third experimental groups.
It is noteworthy that the CRs of p53 and Ki-67 were observed only in the control group and in animals of the first group, albeit with an altered rhythm. Thus, the leading role in the destruction of these CRs belonged to the constant lighting condition. At the same time, the CRs of the clock genes were found only in the control and the second experimental group, which is caused by the leading role of ethanol in the disruption of these rhythms.
The rhythm of Adh5 was disrupted only in the second group. Apparently, violation of the lighting regime causes its breakdown, and the presence of CRs in rats of the first and third experimental groups was caused by the fact that light was not the pacemaker, but the time at which the ethanol was drunk was.
Chronic alcohol intoxication causes a complex of metabolic disorders that complicate the toxic effects of alcohol. In turn, dark deprivation is a significant stress factor that also affects metabolism.
Thus, the hyperglycemia we found in animals of the first and second experimental groups is explained in the first case by the well-known effect of CAI, which can cause disorders of carbohydrate metabolism, manifesting in both hyper- (more often) and in hypoglycemia [68,69], and in the second case by a response to stressful effects. At the same time, a significant decrease in the levels of this metabolite in the blood plasma of rats of the third group was caused by a disruption of the adaptation process. In addition, hyperglycemia in the blood of rats of the first group could be explained by the development of gluconeogenesis, since overexposure to ethanol is known to lead to insulin resistance in the liver, which increases the enzymatic capacity of gluconeogenesis and lipogenesis and decreases glycogen synthesis by inhibiting the PI3K/AKT signaling pathway in the liver [70].
The level of transaminases in the blood plasma of rats of the first group did not differ from the controls; in the second group we noted an increase in the levels of both ALT and AST, but in the third group only the level of AST was increased. Changes in the levels of enzymes in the second group may be associated with the destruction of hepatocytes under constant illumination, and the picture in the third group is explained by the combined effect of both factors; an isolated increase in AST may be associated with a pyridoxine (vitamin B6) deficiency that often develops during CAI, as a result of which, ALT activity in hepatocytes decreases. In addition, alcohol promotes the release of mitochondrial AST from hepatocytes without their obvious damage. A decrease in the level of total protein was noted in the blood plasma of rats of all the experimental groups. Hypoproteinemia is a well-known phenomenon that disrupts the morphofunctional integrity of the liver. It is noteworthy that a decrease in albumin levels occurred only in rats of the second experimental group, which suggests that constant illumination causes significant disturbances in the protein-synthesizing function of the liver [71,72].
An increase in the level of direct bilirubin in the blood of rats of the first and third experimental groups is a well-known effect of CAI.
The rhythms of glucose metabolism are determined by diurnal variations in a variety of metabolic pathways, including peripheral insulin sensitivity, β-cell sensitivity, insulin clearance, the sleep–wake cycle, etc. [73]. The existence of various circadian phenotypes in humans has also been shown [74], which suggests their presence in rodents. The CRs of glucose appears to be the most stable, being destroyed in none of the groups, although they did undergo some changes.
We found that the circadian rhythm of ALT was more resistant to the effects of the investigated factors, being disturbed only in rats of third group, while the CRs of AST were absent in rats of all the experimental groups.
It is notable that both the CRs of total protein in the blood plasma and of albumin, being altered in animals of the first and second experimental groups, were destroyed in the third group; this testifies, on the one hand, to the resistance of these rhythms to the effects of external desynchronizers, and also to the strong chronodestructive effects of the combination of ethanol and constant illumination.
The least resistant CRs to the action of the investigated chronodestructors were the CRs of total and direct bilirubin, which were destroyed in all the experimental groups.
4. Materials and Methods
4.1. Object of the Study
This study was conducted on 160 male rats of Wistar outbred stock at an age of 6 months, with a body weight of 350 g. Animals were taken from the “Stolbovaya” affiliate of the FSBIS Scientific Center for Biomedical Technologies of the Federal Medical and Biological Agency. All animals were kept for three weeks in standard laboratory conditions, in plastic cages with free access to water and food. Initially, the animals were kept in natural lighting, at a temperature of 20–22 °C and a relative humidity of 60–70%. The rats had free access to drinking water and briquetted food. Keeping of animals and experiments were performed in accordance with the European Convention for the Protection of Vertebrate Animals used for Experimental and other Scientific Purposes (Strasbourg, 18 March 1986). This research was approved by the Bioethical Committee of the Federal State Budgetary Scientific Institution “Research Institute of Human Morphology”, protocol № 27/3 dated 11.10.2021.
4.2. Design of Study
Rats were divided into 4 equal groups. To model the KhAI we used a 15% aqueous solution of ethanol [75].
The control group (n = 40) was kept under a fixed light regime (light:dark/10:14 h with lights on at 8:00 and off at 18:00).
The first group, (EtOH; n = 40) was kept under the same conditions as the controls, but a 15% aqueous ethanol solution was offered daily as a drink ad libitum instead of water.
The second group, (CL; n = 40) was kept under a regime of constant light.
The third group (EtOH + CL; n = 40), was kept under a regime of constant light and received as a drink a 15% aqueous solution of ethanol ad libitum.
The criterion for selecting rats for the study, along with the absence of visible abnormalities in condition and behavior, was the initial preference for a 15% solution of ethyl alcohol in comparison with tap water. For this, a preliminary experiment was carried out for 3 days in individual cages with free access to both liquids.
During the experiment, the volume of the consumed ethanol solution was determined daily, and then the mass of alcohol per 1 kg of body weight was calculated. On average, the animals drank 15.48 ± 1.28 mL/day, which in terms of absolute ethanol is 7 g/kg of body weight.
Euthanasia was carried out three weeks after the start of the experiment in a carbon dioxide chamber equipped with a device for the upper gas supply (100% CO2) at 9.00, 15.00, 21.00 and 3.00. The chamber volume was filled with gas at a rate of 20% per minute to avoid dyspnea and pain in animals. Previously, the rectal temperature of the animals was measured and blood sampling for hematological and biochemical studies was made. After sacrifice, evisceration was performed.
4.3. Morphological, Morphometric and Histochemical Methods
The liver was fixed in 10% neutral buffered formalin with further passage through alcohols of increasing concentration (50°, 60°, 70°, 80° and 96°) and xylol, followed by pouring into Histomix histological medium (BioVitrum, Moscow, Russia). When conducting studies of organs embedded in paraffin, serial sections with a thickness of 5–6 μm were prepared. Histological sections were made on the rotor microtome MPS-2 (USSR). Hematoxylin–eosin staining was carried out according to the standard technique. Stained sections were put into a BioMount mounting medium (BioVitrum, Moscow, Russia).
Fragments of the liver were frozen for subsequent histological examination, and using a freezing table for the MFT -01 “Unicon” microtome, serial frozen sections with a thickness of 6–8 μm were prepared. To confirm the presence of fatty degeneration, standard staining of frozen sections with a solution of Sudan-III in 70% ethyl alcohol was performed.
Microscopy of histological preparations was performed using a Nikon Eclipse 80I microscope with use of a Nikon DI-FI digital camera (Tokyo, Japan). Eyepieces ×10, ×15, objectives ×4, ×10, ×20, ×40, ×100 were used for microscopy. Microscopy of histological preparations was performed using a Nikon Eclipse 80I microscope with the use of a Nikon DI-FI digital camera (Tokyo, Japan). From each studied preparation, 10 digital images of randomly selected visual fields were taken at a magnification of ×400, ×1000, with the use of which karyo- and cytometry were subsequently carried out. In morphometric studies, the Fiji software package, a program built on the basis of ImageJ v2 with appropriate plugins, was used [76]. The measurements were carried out in micrometers after preliminary geometric calibration on an object-micrometer scale digitized with the same magnification. Micromorphometry was performed only for mononuclear interphase hepatocytes without signs of pathological changes. The proportion of binuclear hepatocytes was also determined.
With the use of ImageJ, the cross-sectional areas of nuclei (area of nucleus, Sn), the small (d) and long (D) diameters of nuclei, the perimeters of nuclei (Pn), the cross-sectional areas of cells (area of cell, Scell), and the small (a) and long (b) diameters of cells were determined.
The parameters were calculated with the use of appropriate formulae.
The nuclear-cytoplasmic ratio was calculated by the formula:
where: Sn—area of nucleus of cell; Sc—area of cytoplasm.
NCR = Sn/Sc
The mean diameters of the nuclei were calculated by the formula:
where D—long diameter, d—small diameter [77].
M = (D + d)/2
The volumes of the nuclei were calculated by the formula:
where M—mean diameter of nuclei.
Vn = 0.523 M3
The volumes of the cells were calculated by the formula:
where M—mean diameter of cells.
Vc = 0.523 M3
The nucleus volume to nucleus area ratio (V/A coefficient) was calculated by the formula:
where Vn is the mean volume of nuclei, An—mean area of nuclei.
Vn/An
The elongation index of the nucleus was calculated by the formula:
where D—long diameter, d—small diameter [76].
EI = D/d
For calculation of the coefficient of form, the following formula was used:
where Sn—area of nucleus, Pn—perimeter of nucleus [48].
CF = 4 × π × Sn/Pn2
The contour index of the nucleus, which reflects the topography of its surface, was determined by the formula:
where Sn—the area of nucleus, Pn—perimeter of nucleus [77].
CI = Pn/√ Sn
4.4. Immunohistochemical Methods
To carry out immunohistochemical reactions, liver sections were dewaxed, rehydrated and treated with 3% hydrogen peroxide solution to block endogenous peroxidase. Then, the slices were put into an Ultra V Block (Thermo Fisher Scientific, Waltham, MA, USA) solution; the antigens were previously unmasked by boiling in citrate buffer (pH 6.0). Immunohistochemical reactions with primary antibodies were performed.
The following antibodies were used:
- Ki-67—Rabbit polyclonal (Cloud-Clone Corp., Katy, TX, USA), 1:300;
- Per2—Rabbit polyclonal (Cloud-Clone Corp., Katy, TX, USA), 1:200;
- Bmal1—Rabbit polyclonal (Cloud-Clone Corp., Katy, TX, USA), 1:200;
- p53—Rabbit polyclonal (Cloud-Clone Corp., Katy, TX, USA), 1:200;
- Adh5—Rabbit polyclonal (Cloud-Clone Corp., Katy, TX, USA), 1:300.
Sections were incubated with antibodies for 60 min at room temperature. The UltraVision Quanto Detection System (Thermo Fisher Scientific; Waltham, MA, USA) set was used as a detection system.
Reactions with replacement of primary antibodies with phosphate buffer solution served as controls.
After the sections acquired a blue hue, the slides were removed, dehydrated in alcohols of ascending concentrations and xylene according to the standard scheme, and embedded in the BioMount mounting medium (BioVitrum, Moscow, Russia).
The results of the immunohistochemical reactions were assessed by the proportion of stained cells or cell nuclei (depending on the localization of the antigen) in relation to the total number of hepatocytes. The evaluation was carried out in 4 fields of view at a magnification of × 400.
Cells stained with the appropriate antibodies were counted in the preparations, and then the corresponding index was calculated as the ratio of stained cells to the total number of cells (%).
4.5. Biochemical Methods
The levels of the studied parameters were determined in blood plasma using a StatFax-3300 analyzer (Palm City, FL, USA) with the corresponding Spinreact kits (Barcelona, Spain): total protein, albumin, alanine aminotransferase (ALT), aspartate aminotransferase (AST), direct bilirubin, total bilirubin, and glucose were determined.
4.6. Methods for Statistical Processing
The obtained data were analyzed using the “GraphPad Prism 6.0” software by calculating the mean values, standard deviation, and mean error of the arithmetic mean. The data in the text, tables and graphs are presented as M ± m, where M is the mean and m is the SD. Numerical rows characterizing the daily fluctuations of the studied physiological rhythms of animals were subjected to mathematical processing, on the basis of which the group chronograms were drawn. The shapes of the chronograms were studied and the average daily values were calculated. To identify differences between control and experimental groups, we performed univariate analyses (using ANOVA or Kruskal–Wallis where appropriate) for clinical parameters and laboratories. Differences were considered statistically significant at p < 0.05.
For statistical calculation of the amplitude and acrophase of CRs, we performed cosinor analysis, which is an international, generally recognized method for the unified study of biological rhythms, using the CosinorEllipse2006-1.1 program.
Cosinor analysis was employed to analyze wave processes and process chronobiological data. The presence of a reliable circadian rhythm was determined, as well as its acrophase and amplitude. The output information of the cosinor analysis was the main parameters of the rhythms: mezor, i.e., the value of the average level of the sinusoid (h); the amplitude of the sinusoid (A); and the acrophase (Phi), that is, the time of the onset of the maximum of the function. The mezor coincides in magnitude with the average daily value of the investigated function. The acrophase is a measure of the peak time of total rhythmic variability over a 24 h period, i.e., the time of the onset of the maximum of the function. The amplitude corresponds to half of the total rhythmic variability in the cycle. The acrophase is expressed in hours; amplitude values are expressed in the same units as the studied variables [78].
5. Conclusions
The results of the micromorphometry indicated significant changes in the studied parameters of the hepatocytes, which were least expressed in the first experimental group, and which affected the liver cells of the rats of the third experimental group the most. In the hepatocytes of animals of all three experimental groups, there was a significant change in the chronostructure, which manifested itself in the disruption and/or alteration of the studied CRs and the occurrence of desynchronosis. The most stable and least labile CR was the CR of the cell area. In the presence of changes in the biochemical parameters typical of ethanol intoxication, a significant change or destruction of their CRs in all the studied groups of animals was noted. Both ethanol and constant illumination caused changes in the level of expression and circadian rhythms of the studied genes; however, the greatest chronodestructive effect was observed with the combined actions of these factors.
Alcohol intoxication, which occurred against a background of a melatonin deficiency caused by constant lighting, was accompanied by a significantly greater severity, prevalence, and intensity of inflammatory tissue reactions and a variety of manifestations of liver pathology in all animals. Under these conditions, understanding the mechanisms of the modeled pathology opens up prospects for both etiotropic treatment and pathogenetic targeting.
Author Contributions
M.A.K., Y.A.K., D.A.A. conceived the study and designed the experiment; M.A.K., L.A.M., I.C. collected the data and performed the analysis; M.A.K. wrote the paper; Y.A.K., D.A.A. edited the manuscript. All authors have read and agreed to the published version of the manuscript.
Funding
This research was carried out within the framework of the State Assignment to A.P. Avtsyn Research Institute of Human Morphology.
Institutional Review Board Statement
Keeping of animals and experiments were performed in accordance with the European Convention for the Protection of Vertebrate Animals used for Experimental and other Scientific Purposes (Strasbourg, 18 March 1986). This research was approved by the Bioethical Committee of the Federal State Budgetary Scientific Institution “Research Institute of Human Morphology”, protocol No. 27/3 dated 11 October 2021.
Informed Consent Statement
Not applicable.
Data Availability Statement
The data presented in this study are available within the article text, tables and figures.
Conflicts of Interest
The authors declare no conflict of interest.
References
- Rehm, J. The risks associated with alcohol use and alcoholism. Alcohol Res. Health 2011, 34, 135–143. [Google Scholar]
- Seitz, H.K.; Neuman, M.G. The History of Alcoholic Liver Disease: From an Unrecognized Disease to One of the Most Frequent Diseases in Hepatology. J. Clin. Med. 2021, 10, 858. [Google Scholar] [CrossRef] [PubMed]
- Forger, D.B. Biological Clocks, Rhythms, and Oscillations. In The Theory of Biological Timekeeping; MIT Press: Cambridge, MA, USA, 2017. [Google Scholar]
- McKenna, H.; Van Der Horst, G.T.J.; Reiss, I.; Martin, D. Clinical chronobiology: A timely consideration in critical care medicine. Crit. Care 2018, 22, 124. [Google Scholar] [CrossRef] [PubMed]
- Walker, W.H.; Walton, J.C.; DeVries, A.C.; Nelson, R.J. Circadian rhythm disruption and mental health. Transl. Psychiatry 2020, 10, 28. [Google Scholar] [CrossRef] [PubMed]
- Eckel-Mahan, K.; Sassone-Corsi, P. Metabolism and the circadian clock converge. Physiol. Rev. 2013, 93, 107–135. [Google Scholar] [CrossRef]
- Roenneberg, T.; Merrow, M. The Circadian Clock and Human Health. Curr. Biol. 2016, 26, R432–R443. [Google Scholar] [CrossRef]
- Panda, S. Circadian physiology of metabolism. Science 2016, 354, 1008–1015. [Google Scholar] [CrossRef]
- Zimmet, P.; Alberti, K.G.M.M.; Stern, N.; Bilu, C.; El-Osta, A.; Einat, H.; Kronfeld-Schor, N. The Circadian Syndrome: Is the Metabolic Syndrome and much more! J. Intern. Med. 2019, 286, 181–191. [Google Scholar] [CrossRef]
- Foster, R.G.; Roenneberg, T. Human responses to the geophysical daily, annual and lunar cycles. Curr. Biol. 2008, 18, R784–R794. [Google Scholar] [CrossRef]
- Michel, S.; Meijer, J.H. From clock to functional pacemaker. Eur. J. Neurosci. 2020, 51, 482–493. [Google Scholar] [CrossRef]
- Jasser, S.A.; Blask, D.E.; Brainard, G.C. Light during darkness and cancer: Relationships in circadian photoreception and tumor biology. Cancer Causes Control 2006, 17, 515–523. [Google Scholar] [CrossRef]
- Fonken, L.K.; Workman, J.L.; Walton, J.C.; Weil, Z.M.; Morris, J.S.; Haim, A.; Nelson, R.J. Light at night increases body mass by shifting the time of food intake. Proc. Natl. Acad. Sci. USA 2010, 107, 18664–18669. [Google Scholar] [CrossRef]
- Verlande, A.; Masri, S. Circadian Clocks and Cancer: Timekeeping Governs Cellular Metabolism. Trends Endocrinol. Metab. 2019, 30, 445–458. [Google Scholar] [CrossRef] [PubMed]
- Anisimov, V.N. Light desynchronosis and health. Light Eng. 2019, 27, 3. [Google Scholar] [CrossRef]
- Leng, Y.; Musiek, E.S.; Hu, K.; Cappuccio, F.P.; Yaffe, K. Association between circadian rhythms and neurodegenerative diseases. Lancet Neurol. 2019, 18, 307–318. [Google Scholar] [CrossRef]
- Kim, P.; Oster, H.; Lehnert, H. Coupling the Circadian Clock to Homeostasis: The Role of Period in Timing Physiology. Endocr. Rev. 2019, 40, 66–95. [Google Scholar] [CrossRef] [PubMed]
- Shi, D.; Chen, J.; Wang, J.; Yao, J.; Huang, Y.; Zhang, G.; Bao, Z. Circadian Clock Genes in the Metabolism of Non-alcoholic Fatty Liver Disease. Front Physiol. 2019, 10, 423. [Google Scholar] [CrossRef]
- Lamia, K.A.; Storch, K.-F.; Weitz, C.J. Physiological significance of a peripheral tissue circadian clock. Proc. Natl. Acad. Sci. USA 2008, 105, 15172–15177. [Google Scholar] [CrossRef]
- Koronowski, K.B.; Kinouchi, K.; Welz, P.-S.; Smith, J.G.; Zinna, V.M.; Shi, J.; Samad, M.; Chen, S.; Magnan, C.N.; Kinchen, J.M.; et al. Defining the Independence of the Liver Circadian Clock. Cell 2019, 177, 1448.e14–1462.e14. [Google Scholar] [CrossRef]
- Li, H.; Zhang, S.; Zhang, W. Endogenous circadian time genes expressions in the liver of mice under constant darkness. BMC Genom. 2020, 21, 224. [Google Scholar] [CrossRef]
- Sinturel, F.; Gos, P.; Petrenko, V.; Hagedorn, C.; Kreppel, F.; Storch, K.-F.; Knutti, D.; Liani, A.; Weitz, C.; Emmenegger, Y.; et al. Circadian hepatocyte clocks keep synchrony in the absence of a master pacemaker in the suprachiasmatic nucleus or other extrahepatic clocks. Genes Dev. 2021, 35, 329–334. [Google Scholar] [CrossRef] [PubMed]
- Bechtold, D.A. Energy-responsive timekeeping. J. Genet. 2008, 87, 447–458. [Google Scholar] [CrossRef]
- Engin, A. Circadian Rhythms in Diet-Induced Obesity. Adv. Exp. Med. Biol. 2017, 960, 19–52. [Google Scholar] [PubMed]
- Westerterp-Plantenga, M.S. Challenging energy balance—during sensitivity to food reward and modulatory factors implying a risk for overweight—During body weight management including dietary restraint and medium-high protein diets. Physiol. Behav. 2020, 221, 112879. [Google Scholar] [CrossRef] [PubMed]
- Fárková, E.; Schneider, J.; Šmotek, M.; Bakštein, E.; Herlesová, J.; Kopřivová, J.; Šrámková, P.; Pichlerová, D.; Fried, M. Weight loss in conservative treatment of obesity in women is associated with physical activity and circadian phenotype: A longitudinal observational study. Biopsychosoc. Med. 2019, 13, 24. [Google Scholar] [CrossRef]
- Tähkämö, L.; Partonen, T.; Pesonen, A.-K. Systematic review of light exposure impact on human circadian rhythm. Chronobiol. Int. 2019, 36, 151–170. [Google Scholar] [CrossRef]
- Aho, V.; Ollila, H.; Kronholm, E.; Bondia-Pons, I.; Soininen, P.; Kangas, A.; Hilvo, M.; Seppälä, I.; Kettunen, J.; Oikonen, M.; et al. Prolonged sleep restriction induces changes in pathways involved in cholesterol metabolism and inflammatory responses. Sci. Rep. 2016, 6, 24828. [Google Scholar] [CrossRef] [PubMed]
- Poggiogalle, E.; Jamshed, H.; Peterson, C.M. Circadian regulation of glucose, lipid, and energy metabolism in humans. Metabolism 2018, 84, 11–27. [Google Scholar] [CrossRef]
- Mota, M.C.; Silva, C.M.; Balieiro, L.C.T.; Fahmy, W.M.; Crispim, C.A. Social jetlag and metabolic control in non-communicable chronic diseases: A study addressing different obesity statuses. Sci. Rep. 2017, 7, 6358. [Google Scholar] [CrossRef]
- Masri, S.; Sassone-Corsi, P. The emerging link between cancer, metabolism, and circadian rhythms. Nat. Med. 2018, 24, 1795–1803. [Google Scholar] [CrossRef]
- Yalçin, M.; El-Athman, R.; Ouk, K.; Priller, J.; Relógio, A. Analysis of the Circadian Regulation of Cancer Hallmarks by a Cross-Platform Study of Colorectal Cancer Time-Series Data Reveals an Association with Genes Involved in Huntington’s Disease. Cancers 2020, 12, 963. [Google Scholar] [CrossRef] [PubMed]
- Keshavarzian, A.; Holmes, E.W.; Patel, M.; Iber, F.; Fields, J.Z.; Pethkar, S. Leaky gut in alcoholic cirrhosis: A possible mechanism for alcohol-induced liver damage. Am. J. Gastroenterol. 1999, 94, 200–207. [Google Scholar] [CrossRef] [PubMed]
- Delcò, F.; Tchambaz, L.; Schlienger, R.; Drewe, J.; Krähenbühl, S. Dose adjustment in patients with liver disease. Drug Saf. 2005, 28, 529–545. [Google Scholar] [CrossRef] [PubMed]
- Swanson, G.; Forsyth, C.B.; Tang, Y.; Shaikh, M.; Zhang, L.; Turek, F.W.; Keshavarzian, A. Role of intestinal circadian genes in alcohol-induced gut leakiness. Alcohol. Clin. Exp. Res. 2011, 35, 1305–1314. [Google Scholar] [CrossRef] [PubMed]
- Summa, K.C.; Voigt, R.M.; Forsyth, C.B.; Shaikh, M.; Cavanaugh, K.; Tang, Y.; Vitaterna, M.H.; Song, S.; Turek, F.W.; Keshavarzian, A. Disruption of the Circadian Clock in Mice Increases Intestinal Permeability and Promotes Alcohol-Induced Hepatic Pathology and Inflammation. PLoS ONE 2013, 8, e67102. [Google Scholar]
- Bailey, S.M. Emerging role of circadian clock disruption in alcohol-induced liver disease. Am. J. Physiol. Liver Physiol. 2018, 315, G364–G373. [Google Scholar] [CrossRef]
- Rosenwasser, A.M. Chronobiology of ethanol: Animal models. Alcohol 2015, 49, 311–319. [Google Scholar] [CrossRef]
- Davis, B.T.; Voigt, R.M.; Shaikh, M.; Forsyth, C.B.; Keshavarzian, A. Circadian Mechanisms in Alcohol Use Disorder and Tissue Injury. Alcohol Clin. Exp. Res. 2018, 42, 668–677. [Google Scholar] [CrossRef]
- Forsyth, C.B.; Voigt, R.M.; Shaikh, M.; Tang, Y.; Cederbaum, A.I.; Turek, F.W.; Keshavarzian, A. Role for intestinal CYP2E1 in alcohol-induced circadian gene-mediated intestinal hyperpermeability. Am. J. Physiol. Liver Physiol. 2013, 305, G185–G195. [Google Scholar] [CrossRef]
- An, L.; Wang, X.; Cederbaum, A.I. Cytokines in alcoholic liver disease. Arch. Toxicol. 2012, 86, 1337–1348. [Google Scholar] [CrossRef]
- Kawaratani, H.; Tsujimoto, T.; Douhara, A.; Takaya, H.; Moriya, K.; Namisaki, T.; Noguchi, R.; Yoshiji, H.; Fujimoto, M.; Fukui, H. The effect of inflammatory cytokines in alcoholic liver disease. Mediat. Inflamm. 2013, 2013, 495156. [Google Scholar] [CrossRef] [PubMed]
- Haas, S.; Straub, R.H. Disruption of rhythms of molecular clocks in primary synovial fibroblasts of patients with osteoarthritis and rheumatoid arthritis, role of IL-1β/TNF. Arthritis Res. Ther. 2012, 14, R122. [Google Scholar] [CrossRef] [PubMed]
- Lopez, M.; Meier, D.; Müller, A.; Franken, P.; Fujita, J.; Fontana, A. Tumor necrosis factor and transforming growth factor β regulate clock genes by controlling the expression of the cold inducible RNA-binding protein (CIRBP). J. Biol. Chem. 2014, 289, 2736–2744. [Google Scholar] [CrossRef] [PubMed]
- Li, W.; Li, L.; Hui, L. Cell Plasticity in Liver Regeneration. Trends Cell Biol. 2020, 30, 329–338. [Google Scholar] [CrossRef]
- Junatas, K.L.; Tonar, Z.; Kubíková, T.; Liška, V.; Pálek, R.; Mik, P.; Králíčková, M.; Witter, K. Stereological analysis of size and density of hepatocytes in the porcine liver. J. Anat. 2017, 230, 575–588. [Google Scholar] [CrossRef]
- Tarantino, G.; Vincenzo, C.; Domenico, C. Nonalcoholic fatty liver disease: A challenge from mechanisms to therapy. Clin. Med. 2020, 9, 15. [Google Scholar] [CrossRef]
- Rowell, R.J.; Quentin, M.A. An overview of the genetics, mechanisms and management of NAFLD and ALD. Clin. Med. 2015, 15, s77–s82. [Google Scholar] [CrossRef]
- Shetty, A.; Hsu, J.W.; Manka, P.P. Role of the Circadian Clock in the Metabolic Syndrome and Nonalcoholic Fatty Liver Disease. Dig. Dis. Sci. 2018, 63, 3187–3206. [Google Scholar] [CrossRef]
- Miyaoka, Y.; Ebato, K.; Kato, H.; Arakawa, S.; Shimizu, S.; Miyajima, A. Hypertrophy and unconventional cell division of hepatocytes underlie liver regeneration. Curr. Biol. 2012, 22, 1166–1175. [Google Scholar] [CrossRef]
- Abbasoglu, O.; Berker, M.; Ayhan, A.; Palaoglu, S.; Sayek, I. The effect of the pineal gland on liver regeneration in rats. J. Hepatol. 1995, 23, 578–581. [Google Scholar] [CrossRef]
- Liang, R.; Nickkholgh, A.; Hoffmann, K.; Kern, M.; Schneider, H.; Sobirey, M.; Zorn, M.; Büchler, M.W.; Schemmer, P. Melatonin protects from hepatic reperfusion injury through inhibition of IKK and JNK pathways and modification of cell proliferation. J. Pineal Res. 2009, 46, 8–14. [Google Scholar] [CrossRef]
- Yanko, R. The combined influence of the intermittent normobaric hypoxia and melatonin on morphofunctional activity of the rat’s liver parenchyma. Bull. Taras Shevchenko Natl. Univ. Kyiv-Probl. Physiol. Funct. Regul. 2018, 25, 36–40. [Google Scholar]
- Wilkinson, P.D.; Duncan, A.W. Differential Roles for Diploid and Polyploid Hepatocytes in Acute and Chronic Liver Injury. In Seminars in Liver Disease; Thieme Medical Publishers: New York, NY, USA, 2020. [Google Scholar]
- Wilkinson, P.; Alencastro, F.; Delgado, E.; Leek, M.P.; Weirich, M.P.; Otero, P.A.; Roy, N.; Brown, W.K.; Oertel, M.; Duncan, A.W. Polyploid hepatocytes facilitate adaptation and regeneration to chronic liver injury. Am. J. Pathol. 2019, 189, 1241–1255. [Google Scholar] [CrossRef]
- Matsumoto, T.; Wakefield, L.; Peters, A.; Peto, M.; Spellman, P.; Grompe, M. Proliferative polyploid cells give rise to tumors via ploidy reduction. Nat. Commun. 2021, 12, 646. [Google Scholar] [CrossRef] [PubMed]
- Kreutz, C.; MacNelly, S.; Follo, M.; Wäldin, A.; Binninger-Lacour, P.; Timmer, J.; Bartolomé-Rodríguez, M.M. Hepatocyte ploidy is a diversity factor for liver homeostasis. Front Physiol. 2017, 8, 862. [Google Scholar] [CrossRef] [PubMed]
- Kobayashi, T.; Saito, Y.; Ohtake, Y.; Maruko, A.; Yamamoto, Y.; Yamamoto, F.; Kuwahara, Y.; Fukumoto, M.; Fukumoto, M.; Ohkubo, Y. Effect of aging on norepinephrine-related proliferative response in primary cultured periportal and perivenous hepatocytes. Am. J. Physiol. Liver Physiol. 2012, 303, G861–G869. [Google Scholar] [CrossRef][Green Version]
- Lang, F. Mechanisms and significance of cell volume regulation. J Am Coll. Nutr. 2007, 26, 613S–623S. [Google Scholar] [CrossRef]
- Corona-Pérez, A.; Díaz-Muñoz, M.; Rodríguez, I.S.; Cuevas, E.; Martínez-Gómez, M.; Castelán, F.; Rodríguez-Antolín, J.; Nicolás-Toledo, L. High sucrose intake ameliorates the accumulation of hepatic triacylglycerol promoted by restraint stress in young rats. Lipids 2015, 50, 1103–1113. [Google Scholar] [CrossRef]
- Vásquez, B.; Sandoval, C.; Smith, R.L.; Del Sol, M. Effects of early and late adverse experiences on morphological characteristics of Sprague-Dawley rat liver subjected to stress during adulthood. Int. J. Clin. Exp. Pathol. 2014, 7, 4627–4635. [Google Scholar]
- Fu, J.; Ma, S.; Li, X.; An, S.; Li, T.; Guo, K.; Lin, M.; Qu, W.; Dong, X.; Han, X.; et al. Long-term stress with hyperglucocorticoidemia-induced hepatic steatosis with VLDL overproduction is dependent on both 5-HT2 receptor and 5-HT synthesis in liver. Int. J. Biol. Sci. 2016, 12, 219–234. [Google Scholar] [CrossRef]
- Konstandi, M.; Shah, Y.M.; Matsubara, T.; Gonzalez, F.J. Role of PPARα and HNF4α in stress-mediated alterations in lipid homeostasis. PLoS ONE. 2013, 8, e70675. [Google Scholar] [CrossRef]
- Schott, M.B.; Rasineni, K.; Weller, S.G.; Schulze, R.J.; Sletten, A.C.; Casey, C.A.; McNiven, M.A. β-Adrenergic induction of lipolysis in hepatocytes is inhibited by ethanol exposure. J. Biol. Chem. 2017, 292, 11815–11828. [Google Scholar] [CrossRef]
- Rodrigues, F.M.; Adélio, J.I.; Santana, V.O.; De Marco Ornelas, E.; de Souza, R.R.; Cardoso, C.G.; Da Veiga, G.L.; Fonseca, F.L.A.; Maifrino, L.B.M. Physical exercise alters hepatic morphology of low-density lipoprotein receptor knockout ovariectomized mice. Med. Mol. Morphol. 2019, 52, 15–22. [Google Scholar] [CrossRef] [PubMed]
- Tsomaia, K.; Patarashvili, L.; Karumidze, N.; Bebiashvili, I.; Azmaipharashvili, E.; Modebadze, I. Liver structural transformation after partial hepatectomy and repeated partial hepatectomy in rats: A renewed view on liver regeneration. World J. Gastroenterol. 2020, 26, 3899–3916. [Google Scholar] [CrossRef] [PubMed]
- Tobari, M.; Hashimoto, E.; Kabutake, A. Genderspecific clinicopathological features in nonalcoholic steatohepatitis. Gastroenterology 2007, 132, 815. [Google Scholar]
- Uchiyama, Y. Rhythms in morphology and function of hepatocytes. J. Gastroenterol. Hepatol. 1990, 5, 321–333. [Google Scholar] [CrossRef] [PubMed]
- Idrovo, J.-P.; Shults, J.A.; Curtis, B.J.; Chen, M.M.; Kovacs, E.J. Alcohol Intoxication and the Postburn Gastrointestinal Hormonal Response. J. Burn. Care Res. 2019, 40, 785–791. [Google Scholar] [CrossRef]
- Cheng, Q.; Li, Y.W.; Yang, C.F.; Zhong, Y.J.; Li, L. Ethanol-induced hepatic insulin resistance is ameliorated by methyl ferulic acid through the PI3K/AKT signaling pathway. Front. Pharmacol. 2019, 10, 949. [Google Scholar] [CrossRef] [PubMed]
- Lin, Y.; Ying, Y.Y.; Li, S.X.; Wang, S.J.; Gong, Q.H.; Li, H. Association between alcohol consumption and metabolic syndrome among Chinese adults. Public Health Nutr. 2021, 24, 4582–4590. [Google Scholar] [CrossRef]
- Haller, E.W.; Wittmers, L.E. Ethanol-induced hypothermia and hyperglycemia in genetically obese mice. Life Sci. 1989, 44, 1377–1385. [Google Scholar] [CrossRef]
- Müssig, K.; Schleicher, E.D.; Häring, H.-U.; Riessen, R. Satisfactory outcome after severe ethanol-induced lactic acidosis and hypoglycemia. J. Emerg. Med. 2008, 34, 337–338. [Google Scholar] [CrossRef]
- Chua, E.C.-P.; Shui, G.; Lee, I.T.-G.; Lau, P.; Tan, L.-C.; Yeo, S.C.; Lam, B.D.; Bulchand, S.; Summers, S.A.; Puvanendran, K.; et al. Extensive diversity in circadian regulation of plasma lipids and evidence for different circadian metabolic phenotypes in humans. Proc. Natl. Acad. Sci. USA 2013, 110, 14468–14473. [Google Scholar] [CrossRef]
- Rodd-Henricks, Z.A.; Bell, R.L.; Kuc, K.A.; Murphy, J.M.; McBride, W.J.; Lumeng, L.; Li, T.K. Effects of ethanol exposure on subsequent acquisition and extinction of ethanol self-administration and expression of alcohol-seeking behavior in adult alcohol-preferring (P) rats: I. Periadolescent exposure. Alcohol Clin. Exp. Res. 2002, 26, 1632–1641. [Google Scholar] [CrossRef] [PubMed]
- Smitha, T.; Sharada, P.; Girish, H. Morphometry of the basal cell layer of oral leukoplakia and oral squamous cell carcinoma using computer-aided image analysis. J. Oral Maxillofac. Pathol. 2011, 15, 26–33. [Google Scholar] [CrossRef] [PubMed]
- Broeke, J.; Pérez, J.M.M.; Pascau, J. Image Processing with ImageJ; Packt Publishing: Birmingham, UK, 2015; p. 346. [Google Scholar]
- Cornelissen, G. Cosinor-based rhythmometry. Theor. Biol. Med. Model 2014, 11, 16. [Google Scholar] [CrossRef] [PubMed]


Publisher’s Note: MDPI stays neutral with regard to jurisdictional claims in published maps and institutional affiliations. |
© 2021 by the authors. Licensee MDPI, Basel, Switzerland. This article is an open access article distributed under the terms and conditions of the Creative Commons Attribution (CC BY) license (https://creativecommons.org/licenses/by/4.0/).