
Stimulation of Sulfonamides Antibacterial Drugs Activity as a Result of Complexation with Ru(III): Physicochemical and Biological Study

 ,
,  ,
, 
Abstract
:
1. Introduction
2. Results and Discussion
2.1. Structural Analyses of New RuIII Coordination Compounds
2.2. ATR Data to Structure Determination
2.3. NMR Investigation
2.4. X-ray Diffraction Studies
2.5. UV-Vis Analysis and Electrical Conductance
2.6. TG-DTG Analysis
2.7. Electrospray Ionization Mass Spectrometry Analysis (ESI-MS)
2.8. Interaction Affinity to CT-DNA Biomolecule
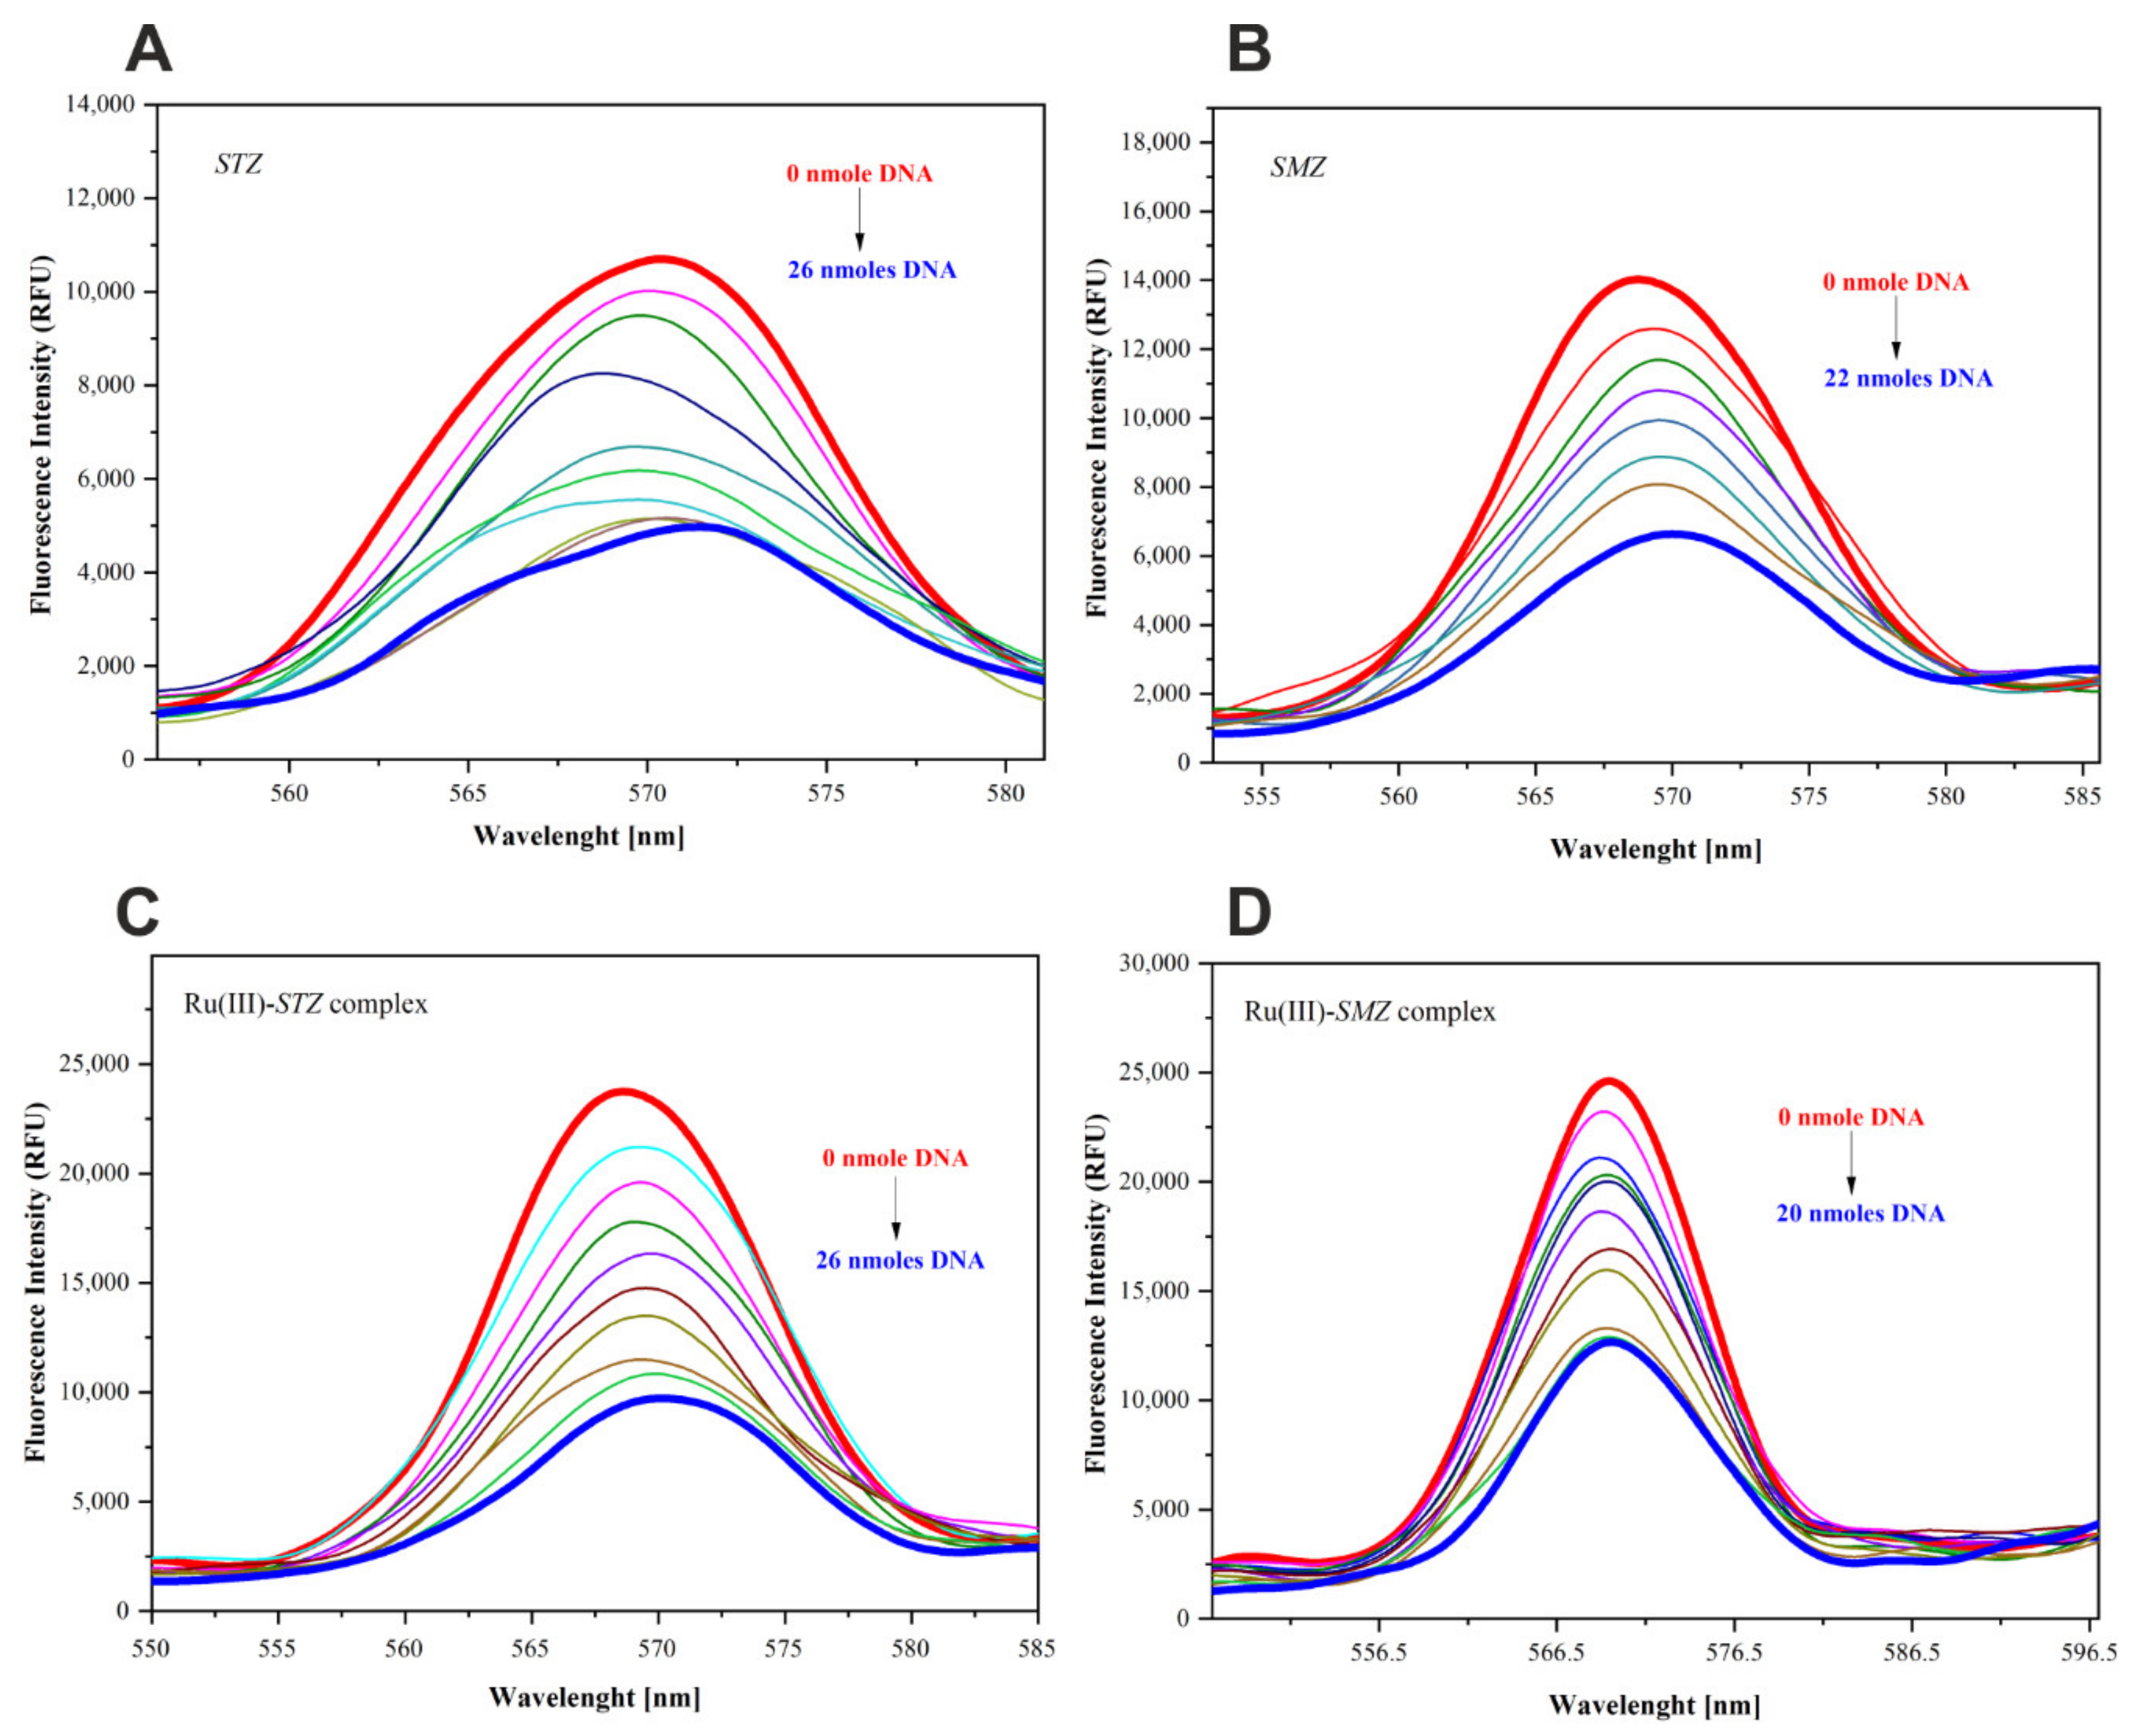
2.9. Fluorescence Quenching Study
2.10. Association Constants and the Number of Binding Sites
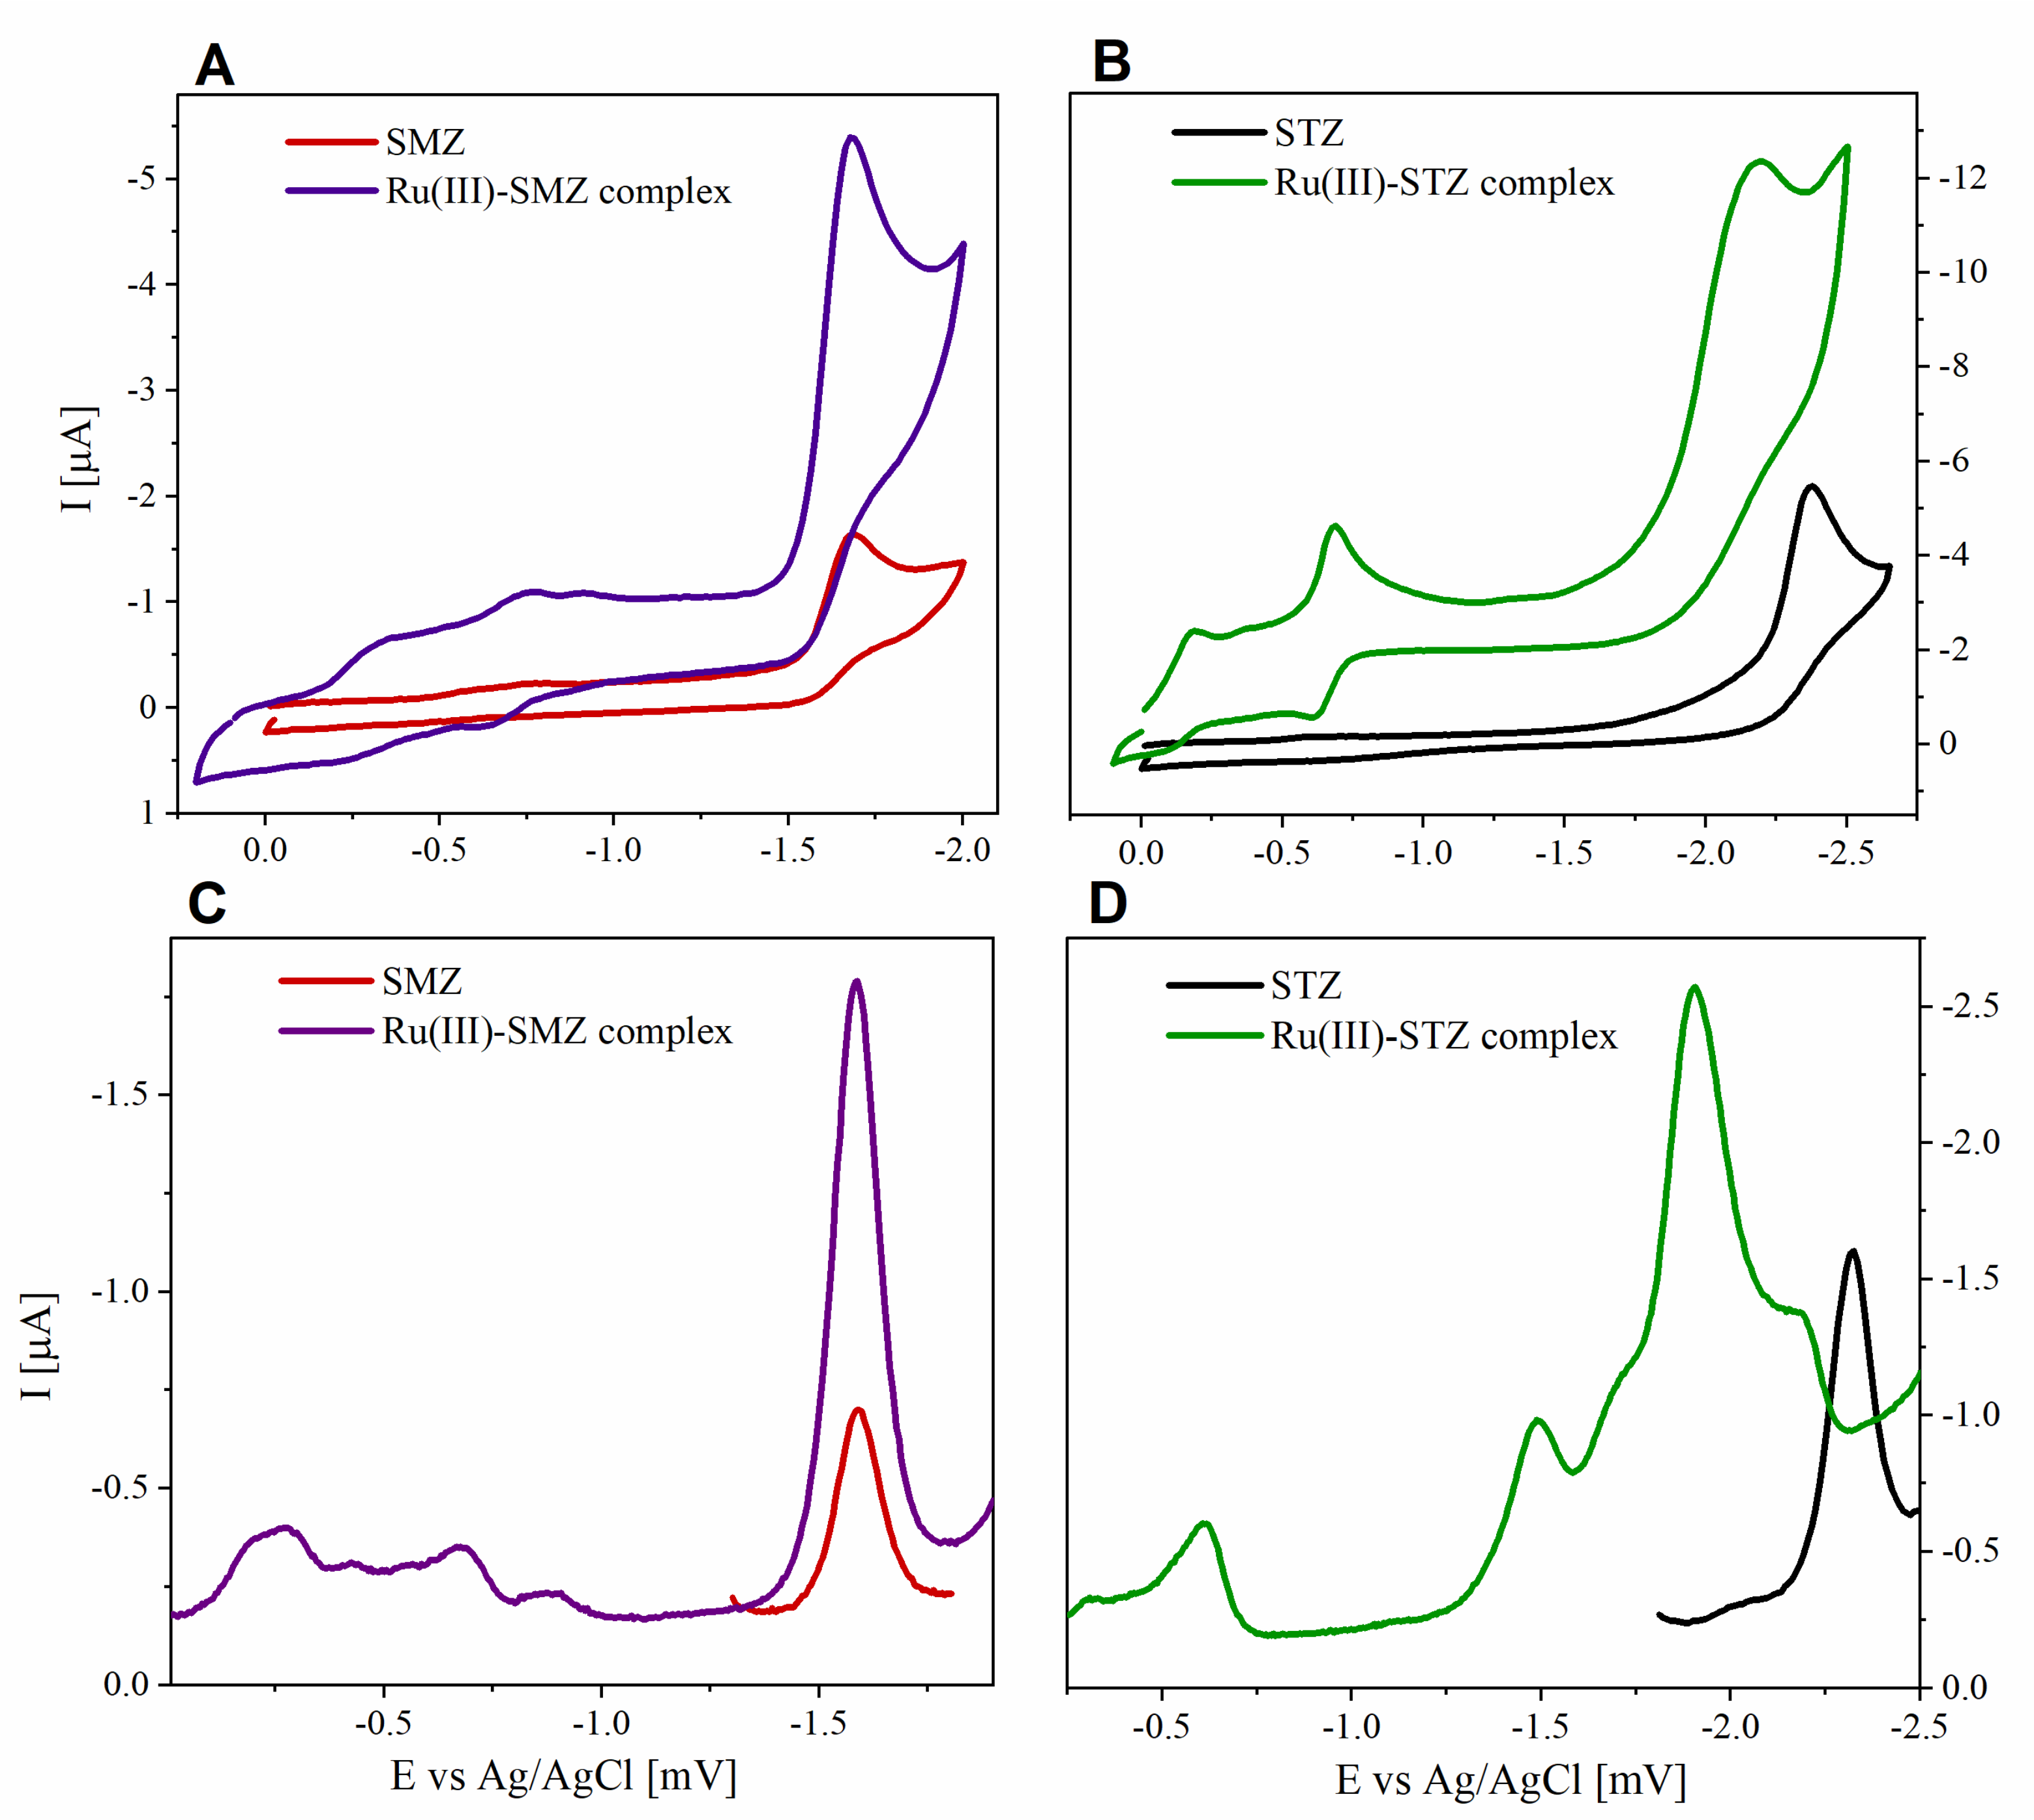
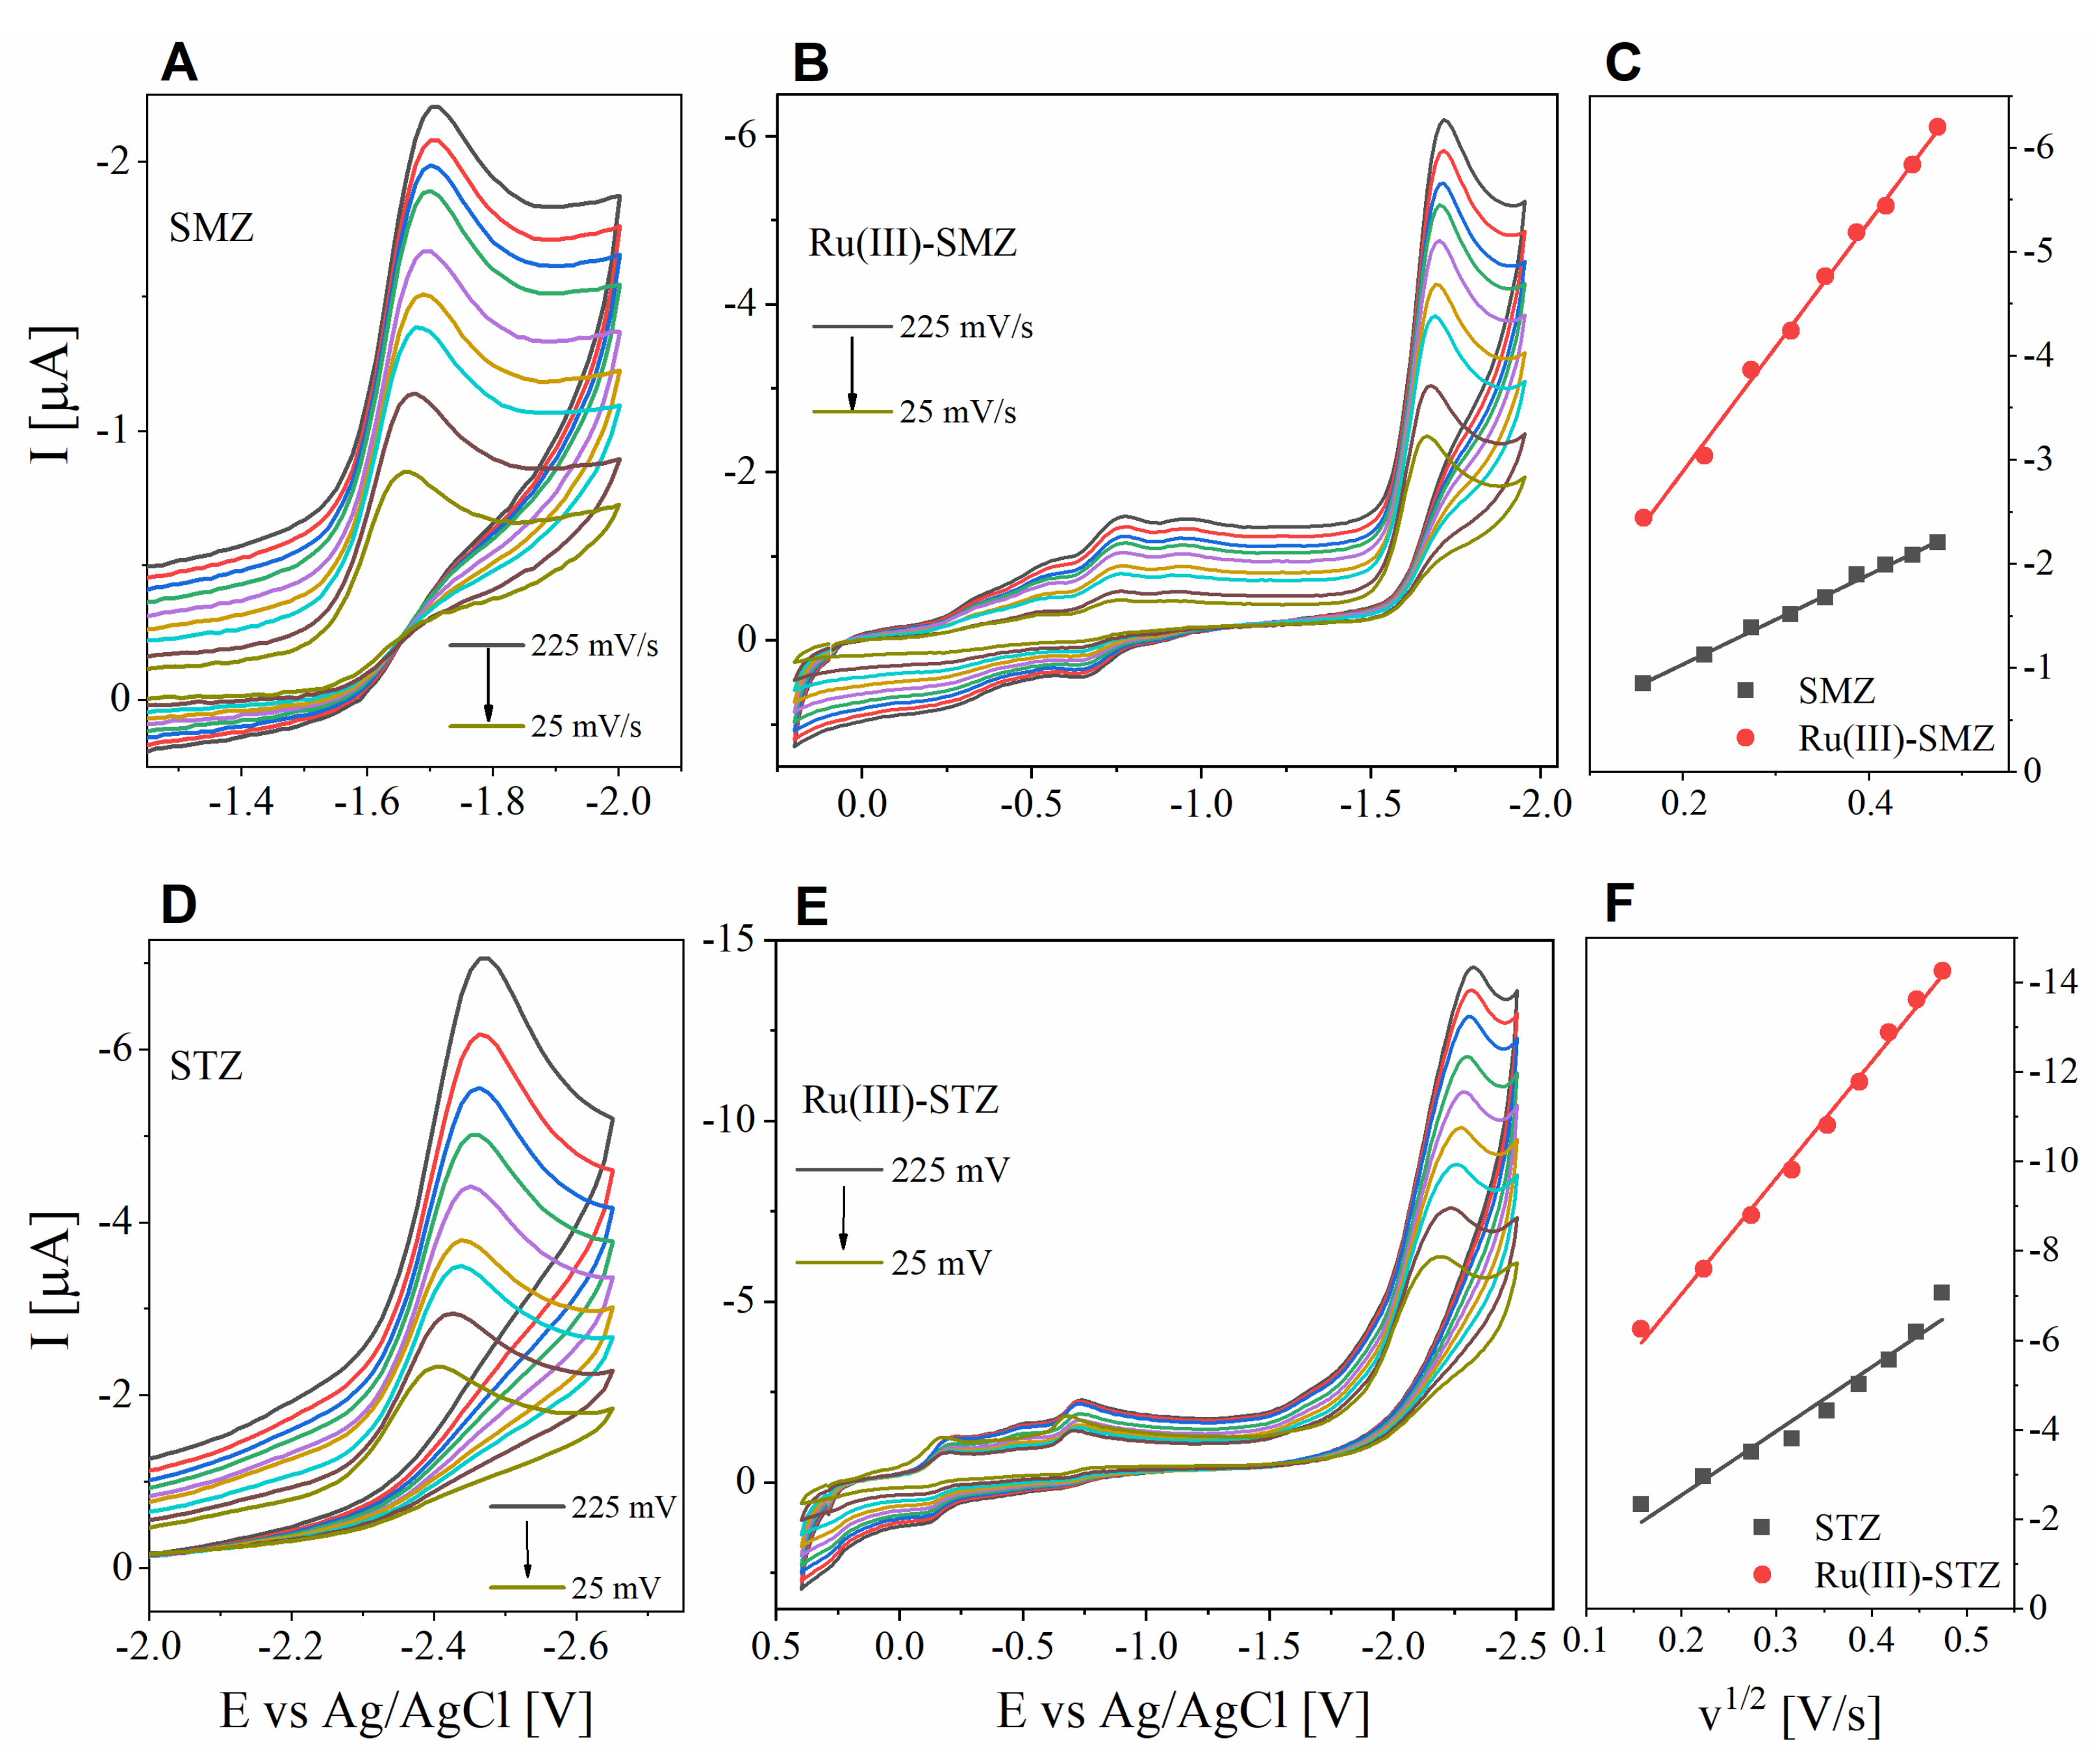
2.11. Electrochemical Profile
2.12. Antimicrobial Activity—Minimal Inhibitory Concentration
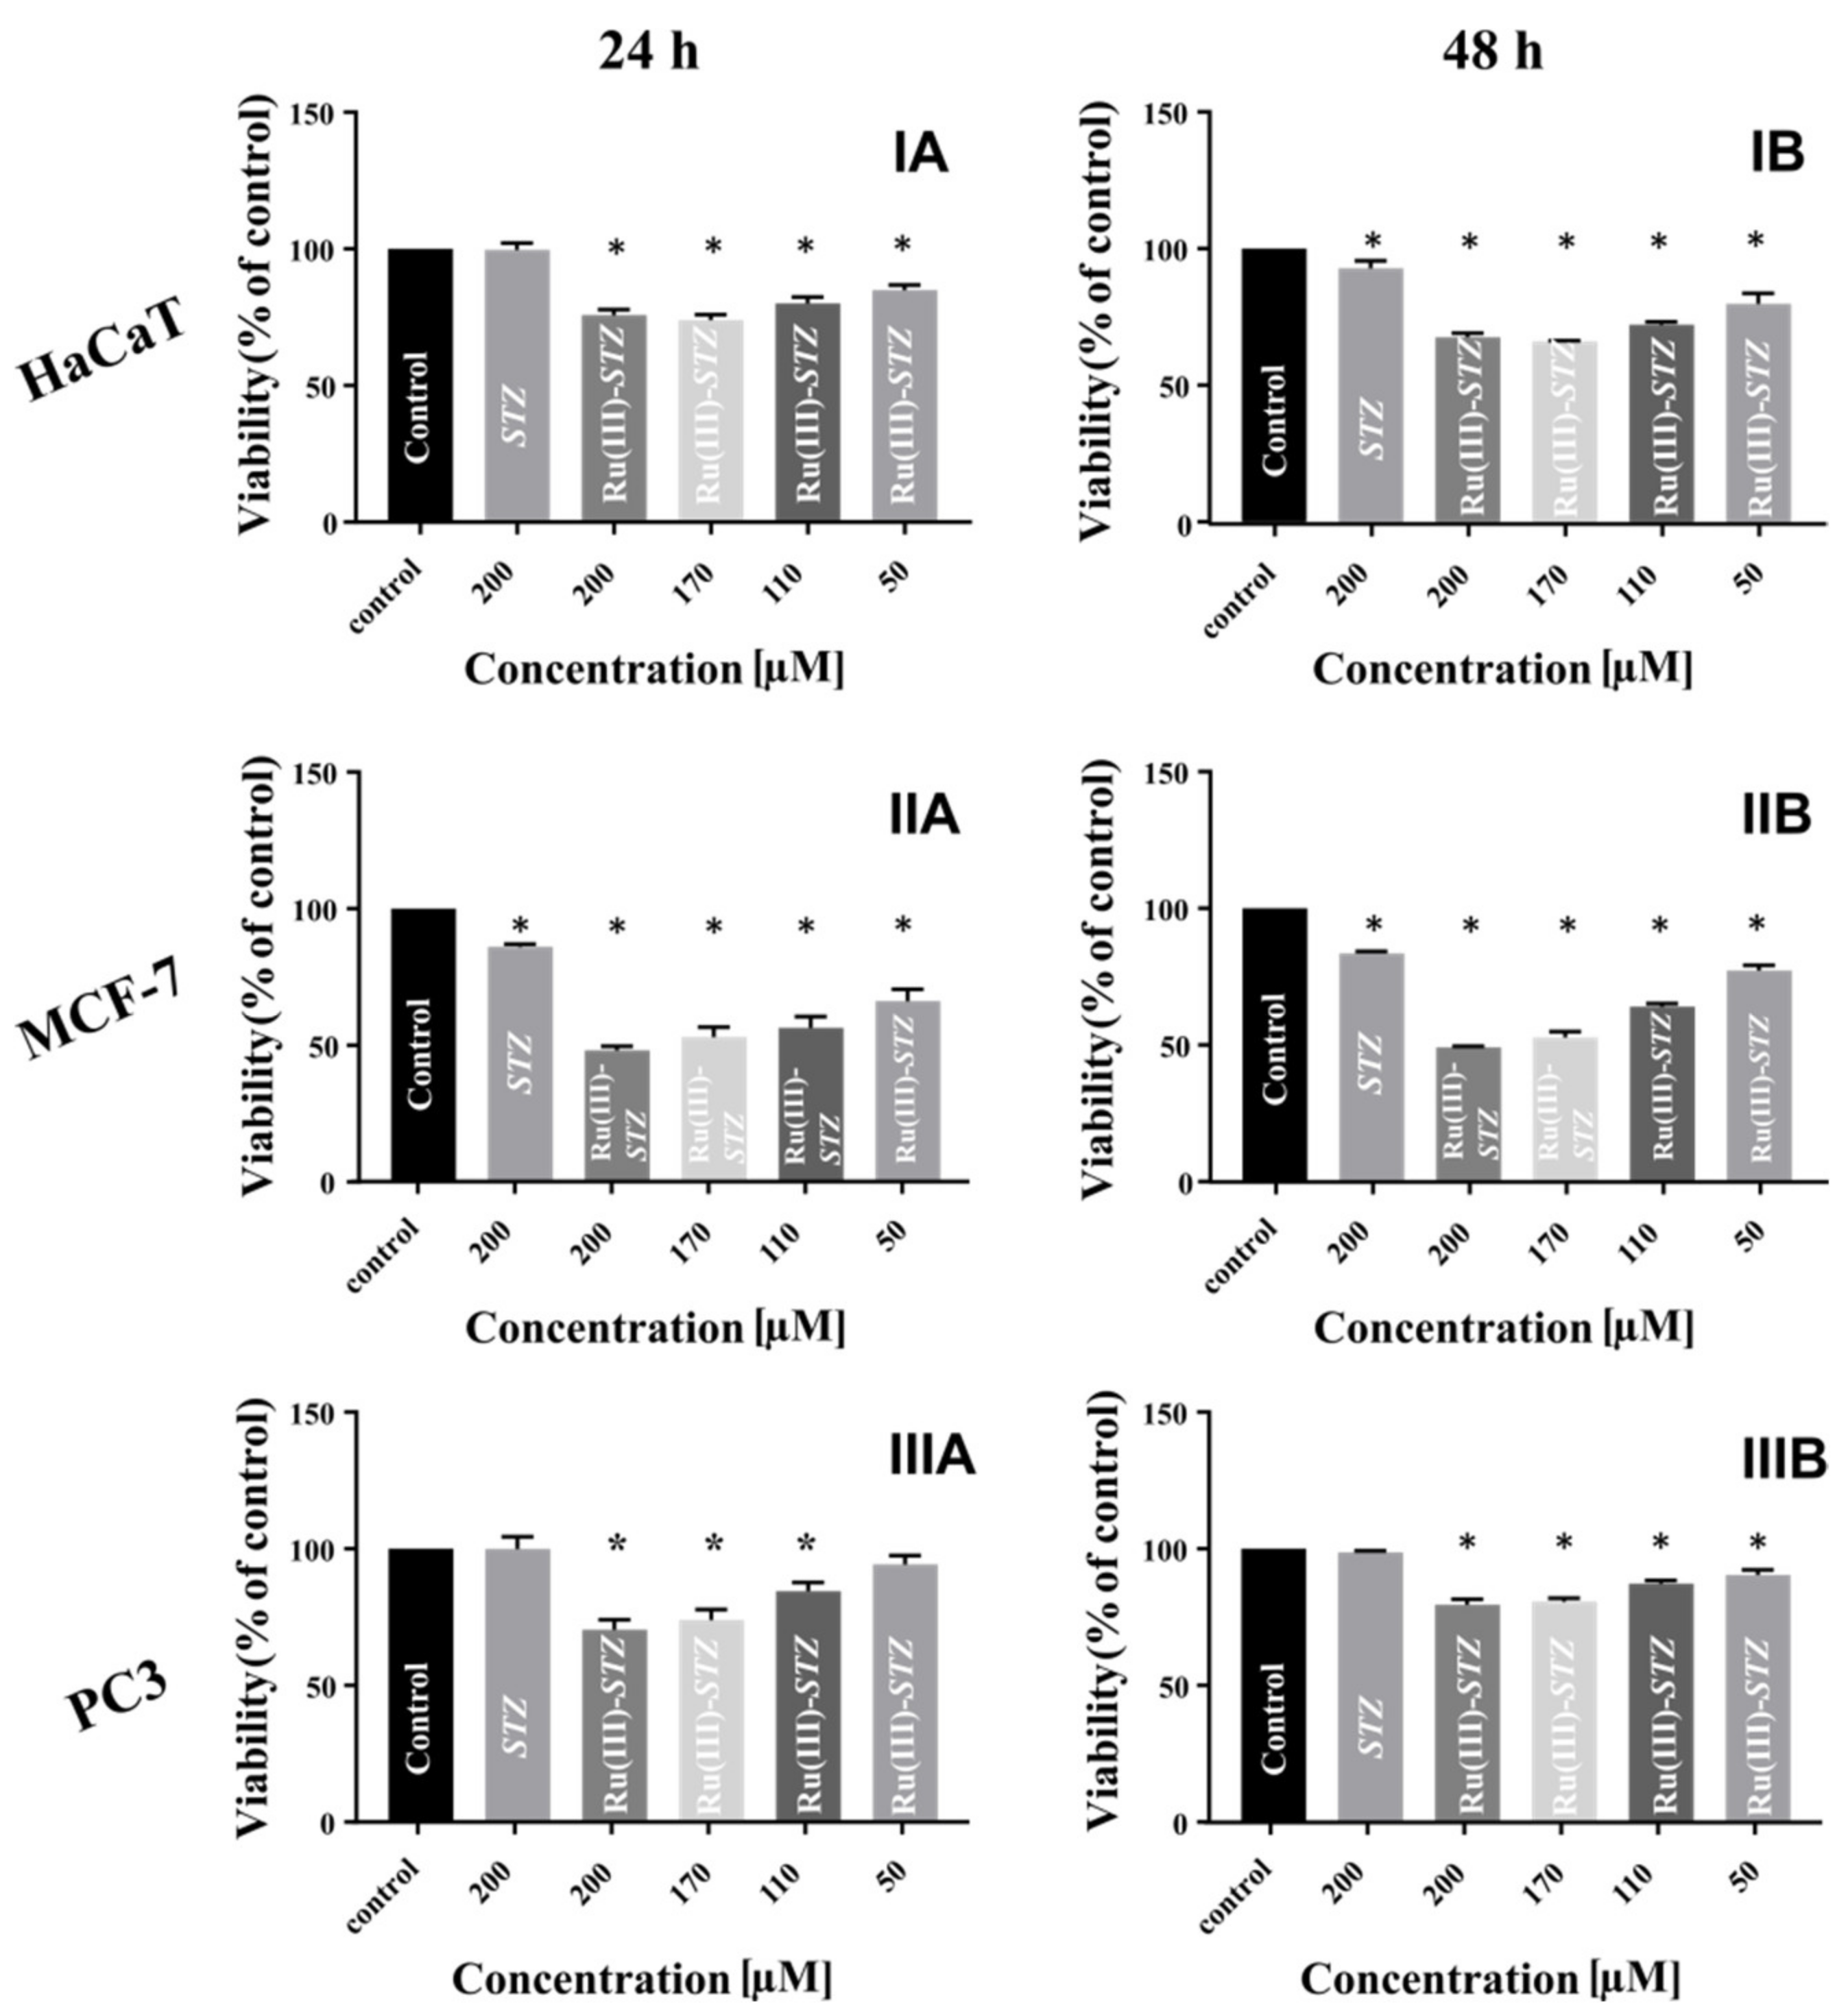
2.13. Cytotoxicity Assay
3. Materials and Methods
3.1. Materials
3.2. General Methods
3.3. Synthesis of [RuCl(OH2)(STZ)2]Cl2·H2O (1)
3.4. Preparation of the [RuCl2(SMZ)2]Cl Complex (2)
3.5. Interaction Affinity to CT-DNA Biomolecule
3.6. Fluorescence Spectroscopy
3.7. Electrochemical Profile
3.8. MIC Determination
3.9. Cytotoxicity Assay
4. Conclusions
Supplementary Materials
Author Contributions
Funding
Institutional Review Board Statement
Informed Consent Statement
Conflicts of Interest
References
- Dodds, D.R. Antibiotic Resistance: A Current Epilogue. Biochem. Pharmacol. 2017, 134, 139–146. [Google Scholar] [CrossRef] [PubMed]
- CDC. Antibiotic Resistance Threats in the United States; U.S. Department of Health and Human Services, CDC: Atlanta, GA, USA, 2019. [Google Scholar] [CrossRef] [Green Version]
- Sánchez-Osuna, M.; Cortés, P.; Barbé, J.; Erill, I. Origin of the Mobile Di-hydro-pteroate Synthase Gene Determining Sulfonamide Resistance in Clinical Isolates. Front. Microbiol. 2019, 9, 3332. [Google Scholar] [CrossRef] [PubMed] [Green Version]
- Nunes, O.C.; Manaia, C.M.; Kolvenbach, B.A.; Corvini, P.F.X. Living with Sulfonamides: A Diverse Range of Mechanisms Observed in Bacteria. Appl. Microbiol. Biotechnol. 2020, 104, 10389–10408. [Google Scholar] [CrossRef] [PubMed]
- Baran, W.; Adamek, E.; Ziemiańska, J.; Sobczak, A. Effects of the Presence of Sulfonamides in the Environment and their Influence on Human Health. J. Hazard. Mater. 2011, 196, 1–15. [Google Scholar] [CrossRef]
- Wang, S.; Wang, J. Biodegradation and Metabolic Pathway of Sulfamethoxazole by a Novel Strain Acinetobacter sp. Appl. Microbiol. Biotechnol. 2018, 102, 425–432. [Google Scholar] [CrossRef]
- Wang, J.; Wang, S. Microbial Degradation of Sulfamethoxazole in the Environment. Appl. Microbiol. Biotechnol. 2018, 102, 3573–3582. [Google Scholar] [CrossRef]
- Wang, L.; You, L.; Zhang, J.; Yang, T.; Zhang, W.; Zhang, Z.; Liu, P.; Wu, S.; Zhao, F.; Ma, J. Biodegradation of Sulfadiazine in Microbial Fuel Cells: Reaction Mechanism, Biotoxicity Removal and the Correlation with Reactor Microbes. J. Hazard. Mater. 2018, 360, 402–411. [Google Scholar] [CrossRef]
- Reis, P.J.; Homem, V.; Alves, A.; Vilar, V.J.; Manaia, C.M.; Nunes, O.C. Insights on Sulfamethoxazole Bio-transformation by Environmental Proteobacteria Isolates. J. Hazard. Mater. 2018, 358, 310–318. [Google Scholar] [CrossRef]
- Perri, R.; Kolvenbach, B.A.; Corvini, P.F. Subsistence and Complexity of Antimicrobial Resistance on a Community-wide Level. Environ. Microbiol. 2020, 22, 2463–2468. [Google Scholar] [CrossRef]
- Sumrra, S.H.; Hassan, A.U.; Imran, M.; Khalid, M.; Mughal, E.U.; Zafar, M.N.; Tahir, M.N.; Muhammad, A.R.; Braga, A.A. Synthesis, Characterization, and Biological Screening of Metal Complexes of Novel Sulfonamide Derivatives: Experimental and Theoretical Analysis of Sulfonamide Crystal. Appl. Organomet. Chem. 2020, 34, e5623. [Google Scholar] [CrossRef]
- Ebrahimi, H.P.; Hadi, J.S.; Almayah, A.A.; Bolandnazar, Z.; Swadi, A.G.; Ebrahimi, A. Metal-Based Biologically Active Azoles and β-lactams Derived from Sulfa Drugs. Bioorg. Med. Chem. 2016, 24, 1121–1131. [Google Scholar] [CrossRef]
- Yousuf, I.; Bashir, M. Metallodrugs in Medicine: Present, Past, and Future Prospects. In Advances in Metallodrugs: Preparation and Applications in Medicinal Chemistry; Shahid-ul-Islam, Hashmi, A.A., Khan, S.A., Eds.; Scrivener Publishing LLC: Beverly, MA, USA, 2020; pp. 1–39. [Google Scholar] [CrossRef]
- Anthony, E.J.; Bolitho, E.M.; Bridgewater, H.E.; Carter, O.W.; Donnelly, J.M.; Imberti, C.; Lant, E.C.; Lermyte, F.; Needham, R.J.; Palau, M. Metallodrugs are Unique: Opportunities and Challenges of Discovery and Development. Chem. Sci. 2020, 11, 12888–12917. [Google Scholar] [CrossRef]
- Mjos, K.D.; Orvig, C. Metallodrugs in Medicinal Inorganic Chemistry. Chem. Rev. 2014, 114, 4540–4563. [Google Scholar] [CrossRef]
- Kumar, M.; Kumar, G.; Kant, A.; Masram, D.T. Role of Metallodrugs in Medicinal Inorganic Chemistry. In Advances in Metallodrugs: Preparation and Applications in Medicinal Chemistry; Shahid-ul-Islam, Hashmi, A.A., Khan, S.A., Eds.; John Wiley & Sons, Inc.: Hoboken, NJ, USA, 2020; pp. 71–113. [Google Scholar] [CrossRef]
- Kumar, M.; Masram, D.T. Evaluation of DNA, BSA, and HSA Binding Propensity of Copper (II) Complex with N-donor Ligand 2, 2′-dipyridylamine. Polyhedron 2019, 157, 511–520. [Google Scholar] [CrossRef]
- Kumar, M.; Kumar, G.; Mogha, N.K.; Jain, R.; Hussain, F.; Masram, D.T. Structure, DNA/Proteins Binding, Docking and Cytotoxicity Studies of Copper (II) Complexes with the First Quinolone Drug Nalidixic Acid and 2, 2’-Dipyridylamine. Spectrochim. Acta A Mol. Biomol. Spectrosc. 2019, 212, 94–104. [Google Scholar] [CrossRef]
- Kumar, M.; Kumar, G.; Dadure, K.M.; Masram, D.T. Copper (II) Complexes Based on Levofloxacin and 2N-Donor Ligands: Synthesis, Crystal Structures and In Vitro Biological Evaluation. N. J. Chem. 2019, 43, 15462–15481. [Google Scholar] [CrossRef]
- Antonarakis, E.S.; Emadi, A. Ruthenium-based Chemotherapeutics: Are They Ready for Prime Time? Cancer Chemother. Pharmacol. 2010, 66, 1–9. [Google Scholar] [CrossRef] [Green Version]
- Ang, W.H.; Casini, A.; Sava, G.; Dyson, P.J. Organometallic Ruthenium-based Antitumor Compounds with Novel Modes of Action. J. Organomet. Chem. 2011, 96, 989–998. [Google Scholar] [CrossRef]
- Bergamo, A.; Sava, G. Ruthenium Complexes Can Target Determinants of Tumour Malignancy. Dalton Trans. 2007, 13, 1267–1272. [Google Scholar] [CrossRef]
- Kenny, R.G.; Marmion, C.J. Toward Multi-Targeted Platinum and Ruthenium Drugs- a New Paradigm in Cancer Drug Treatment Regimens? Chem. Rev. 2019, 119, 1058–1137. [Google Scholar] [CrossRef]
- Capasso, C.; Supuran, C.T. Sulfa and Trimethoprim-like Drugs–antimetabolites Acting as Parbonic Anhydrase, Dihydropteroate Synthase and Dihydrofolate Reductase Inhibitors. J. Enzyme Inhib. Med. Chem. 2014, 29, 379–387. [Google Scholar] [CrossRef] [PubMed]
- Pippi, B.; Joaquim, A.R.; Lopes, W.; Machado, G.R.M.; Bergamo, V.Z.; Giuliani, L.M.; Abegg, M.A.; Cruz, L.; Vainstein, M.H.; Fuentefria, A.M.; et al. 8-Hydroxyquinoline-5-sulfonamides are Promising Antifungal Candidates for the Topical Treatment of Dermatomycosis. J. Appl. Microbiol. 2020, 128, 1038–1049. [Google Scholar] [CrossRef] [PubMed]
- Hopkins, M.D.; Abebe, F.A.; Scott, K.A.; Ozmer, G.L.; Sheir, A.A.; Schroeder, L.J.; Sheaff, R.J.; Lamar, A.A. Synthesis and Identification of Heteroaromatic N-benzyl Sulfonamides as Potential Aticancer Agents. Org. Biomol. Chem. 2019, 17, 8391–8402. [Google Scholar] [CrossRef]
- Abbas, A.; Murtaza, S.; Tahir, M.N.; Shamim, S.; Sirajuddin, M.; Rana, U.A.; Naseem, K.; Rafique, H. Synthesis, Antioxidant, Enzyme Inhibition and DNA Binding Studies of Novel N-benzylated Derivatives of Sulfonamide. J. Mol. Struct. 2016, 1117, 269–275. [Google Scholar] [CrossRef]
- Barnabas, M.J.; Parambadath, S.; Nagappan, S.; Ha, C.S. Sulfamerazine Schiff-Base Complex Intercalated Layered Double Hydroxide: Synthesis, Characterization, and Antimicrobial Activity. Heliyon 2019, 5, e01521. [Google Scholar] [CrossRef] [Green Version]
- Aday, B.; Sola, P.; Çolak, F.; Kaya, M. Synthesis of Novel Sulfonamide Analogs Containing Sulfamerazine/Sulfaguanidine and Their Biological Activities. J. Enzym. Inhib. Med. Chem. 2016, 31, 1005–1010. [Google Scholar] [CrossRef] [Green Version]
- Mansour, A.M. Molecular Structure and Spectroscopic Properties of Novel Manganese (II) Complex with Sulfamethazine Drug. J. Mol. Struct. 2013, 1035, 114–123. [Google Scholar] [CrossRef]
- Meşeli, T.; Doğan, Ş.D.; Gündüz, M.G.; Kökbudak, Z.; Bogojevic, S.S.; Noonan, T.; Vojnovic, S.; Wolber, G.; Nikodinovic-Runic, J. Design, Synthesis, Antibacterial Activity Evaluation and Molecular Modeling Studies of New Sulfonamides Containing a Sulfathiazole Moiety. N. J. Chem. 2021, 45, 8166–8177. [Google Scholar] [CrossRef]
- Nunes, J.H.B.; de Paiva, R.E.F.; Cuin, A.; da Costa Ferreira, A.M.; Lustri, W.R.; Corbi, P.P. Synthesis, Spectroscopic Characterization, Crystallographic Studies and Antibacterial Assays of New Copper (II) Complexes with Sulfathiazole and Nimesulide. J. Mol. Struct. 2016, 1112, 14–20. [Google Scholar] [CrossRef]
- Hosny, W.M. Synthesis and Equilibrium Studies of the Metal Complexes of 4-Amino-N-(2,6-dimethyl-4-pyrimidinyl)-benzenesulfonamide (Sulphadimidine). Synth. React. Inorg. Met. Org. Chem. 1997, 27, 197–220. [Google Scholar] [CrossRef]
- Hangan, A.C.; Borodi, G.; Stan, R.L.; Páll, E.; Cenariu, M.; Oprean, L.S.; Sevastre, B. Synthesis, Crystal Structure, DNA Cleavage and Antitumor Activity of Two Copper (II) Complexes with N-sulfonamide Ligand. Inorganica Chim. Acta 2018, 482, 884–893. [Google Scholar] [CrossRef]
- Shoaib Ahmad Shah, S.; Ashfaq, M.; Najam, T.; Mehboob Ahmed, M.; Shaheen, S.; Tabassum, R.; Abida Ejaz, S. Synthesis of Sulfonamides, Metal Complexes and the Study of in vitro Biological Activities. Curr. Bioact. Compd. 2013, 9, 211–220. [Google Scholar] [CrossRef]
- Bonez, P.C.; Agertt, V.A.; Rossi, G.G.; dos Santos Siqueira, F.; Siqueira, J.D.; Marques, L.L.; de Oliviera, G.N.M.; Vianna Santos, R.C.; de Campos, M.M.A. Sulfonamides Complexed with Metals as Mycobacterial Biofilms Inhibitors. J. Clin. Tuberc. Other Mycobact. Dis. 2021, 23, 100217. [Google Scholar] [CrossRef]
- Refat, M.S.; Sharshar, T.; Elsabawy, K.M.; El-Sayed, M.Y.; Adam, A.M.A. Synthesis, Physicochemical Characterization and Anticancer Screening of Sulfa Drug Ruthenium Complexes as Anticancer Agent. J. Mol. Liq. 2016, 222, 334–349. [Google Scholar] [CrossRef]
- Yang, X.L.; Liu, J.; Yang, L.; Zhang, X.Y. Synthesis, Characterization, and Susceptibility of Bacteria of Selenium Dioxide Complexes with Sulfadrugs. Synth. React. Inorg. Nano Met. Chem. 2005, 35, 761–766. [Google Scholar] [CrossRef]
- Nakamoto, K. Infrared and Raman Spectra of Inorganic and Cooridnation Compounds; John Wiley & Sons, Inc.: Hoboken, NJ, USA, 2002. [Google Scholar]
- Delferro, M.; Marchiò, L.; Tegoni, M.; Tardito, S.; Franchi-Gazzola, R.; Lanfranchi, M. Synthesis, Structural Characterisation and Solution Chemistry of Ruthenium (III) Triazole-thiadiazine Complexes. Dalton Trans. 2009, 19, 3766–3773. [Google Scholar] [CrossRef]
- Velders, A.H.; van der Geest, B.; Kooijman, H.; Spek, A.L.; Haasnoot, J.G.; Reedijk, J. Ruthenium (III) Coordination to the Exocyclic Nitrogen of 9-Methyladenine and Stabilisation of the Rare Imine Tautomer by Intramolecular Hydrogen Bonding. Eur. J. Inorg. Chem. 2001, 2001, 369–372. [Google Scholar] [CrossRef]
- Bacac, M.; Hotze, A.C.G.; van der Schilden, K.; Haasnoot, J.G.; Pacor, S.; Alessio, E.; Sava, G.; Reedijk, J. The Hydrolysis of the Anti-cancer Ruthenium Complex NAMI-A Affects its DNA Binding and Antimetastatic Activity: An NMR evaluation. J. Inorg. Biochem. 2004, 98, 402. [Google Scholar] [CrossRef]
- Günther, H. NMR Spectroscopy: Basic Principles, Concepts, and Applications in Chemistry; John Wiley & Sons, Inc.: Hoboken, NJ, USA, 2001; pp. 128–250. ISBN 3527674772. [Google Scholar]
- Garza-Ortiz, A.; Maheswari, P.U.; Siegler, M.; Spek, A.L.; Reedijk, J. Ruthenium (III) Chloride Complex with a Tridentate Bis (Arylimino) Pyridine Ligand: Synthesis, Spectra, X-ray Structure, 9-ethylguanine Binding Pattern, and In Vitro Cytotoxicity. Inorg. Chem. 2008, 47, 6964–6973. [Google Scholar] [CrossRef]
- Dayan, S.; Kalaycioglu, N.O.; Daran, J.C.; Labande, A.; Poli, R. Synthesis and Characterization of Half-Sandwich Ruthenium Complexes Containing Aromatic Sulfonamides Bearing Pyridinyl Rings: Catalysts for Transfer Hydrogenation of Acetophenone Derivatives. Eur. J. Inorg. Chem. 2013, 2013, 3224–3232. [Google Scholar] [CrossRef]
- Beyerlein, K.; Cervellino, A.; Leoni, M.; Snyder, R.L.; Scardi, P. Debye Equation versus Whole Powder Pattern Modelling: Real versus Reciprocal Space Modelling of Nanomaterials. Z. Kristallogr. Suppl. 2009, 30, 85–90. [Google Scholar] [CrossRef] [Green Version]
- Fondo, M.; Portela-García, C.; Baleeiro-Tadiotto, A.H.; García-Deibe, A.M.; Sanmartín-Matalobos, J. A Useful Route to Metal Complexes of Poorly Coordinating Sulfonamides. Eur. J. Inorg. Chem. 2015, 2015, 2744–2751. [Google Scholar] [CrossRef]
- Jouad, E.M.; Riou, A.; Allain, M.; Khan, M.A.; Bouet, G.M. Synthesis, Structural and Spectral Studies of 5-Methyl 2-furaldehyde Thiosemicarbazone and Its Co, Ni, Cu and Cd Complexes. Polyhedron 2001, 20, 67–74. [Google Scholar] [CrossRef] [Green Version]
- Doležel, P.; Kubáň, V. Mass Spectrometric Study of Platinum Complexes Based on Cisplatin. Chem. Pap. 2002, 56, 236–240. [Google Scholar]
- Musumeci, D.; Rozza, L.; Merlino, A.; Paduano, L.; Marzo, T.; Massai, L.; Massai, L.; Montesarchio, D. Interaction of Anticancer Ru (III) Complexes with Single Stranded and Duplex DNA Model Systems. Dalton Trans. 2015, 44, 13914–13925. [Google Scholar] [CrossRef]
- Hofstadler, S.A.; Sannes-Lowery, K.A. Applications of ESI-MS in Drug Discovery: Interrogation of Noncovalent Complexes. Nat. Rev. Drug Disc. 2006, 5, 585–595. [Google Scholar] [CrossRef]
- Chylewska, A.; Biedulska, M.; Makowski, M. Multi-Analytical Studies about Physico-Chemical Properties of Ni (II)-Vitamin B6 Coordination Compounds and Their CT-DNA Interactions. J. Mol. Liq. 2017, 243, 771–780. [Google Scholar] [CrossRef]
- Al-Said, M.S.; Ghorab, M.M.; Al-Qasoumi, S.I.; El-Hossary, E.M.; Noaman, E. Synthesis and In Vitro Anticancer Screening of Some Novel 4-[2-Amino-3-cyano-4-substituted-5, 6, 7, 8-tetrahydroquinolin-1-(4H)-yl] benzenesulfonamides. Eur. J. Med. Chem. 2010, 45, 3011–3018. [Google Scholar] [CrossRef]
- Krishnamoorthy, P.; Sathyadevi, P.; Cowley, A.H.; Butorac, R.R.; Dharmaraj, N. Evaluation of DNA Binding, DNA Cleavage, Protein Binding and In Vitro Cytotoxic Activities of Bivalent Transition Metal Hydrazone Complexes. Eur. J. Med. Chem. 2011, 46, 3376–3387. [Google Scholar] [CrossRef]
- Khan, G.S.; Shah, A.; Baker, D. Chemistry of DNA Minor Groove Binding Agents. J. Photochem. Photobiol. B Biol. 2012, 115, 105–118. [Google Scholar] [CrossRef]
- Topala, T.; Bodoki, A.; Oprean, L.; Oprean, R. Experimental Techniques Employed in the Study of Metal Complexes-DNA–Interactions. Farmacia 2014, 62, 1049–1061. [Google Scholar]
- Antonisamy, J.D.; Senthilkumar, M.; Dash, S. Effect of Anions on Fluorescence Quenching of Rhodamine B–Pluronic F127 Complex. Phys. Chem. Liq. 2020, 58, 164–174. [Google Scholar] [CrossRef]
- Ramotowska, S.; Zarzeczańska, D.; Dąbkowska, I.; Wcisło, A.; Niedziałkowski, P.; Czaczyk, E.; Grobelna, B.; Ossowski, T. Hydrogen Bonding and Protonation Effects in Amino Acids’ Anthraquinone Derivatives-Spectroscopic and Electrochemical Studies. Spectrochim. Acta A Mol. Biomol. Spectrosc. 2019, 222, 117226. [Google Scholar] [CrossRef]
- Buriez, O.; Labbé, E. Disclosing the Redox Metabolism of Drugs: The Essential Role of Electrochemistry. Curr. Opin. Electrochem. 2020, 24, 63–68. [Google Scholar] [CrossRef]
- Devine, A.; Hegarty, C.; Casimero, C.; Molyneaux, R.L.; Smith, R.B.; Cardosi, M.F.; Davis, J. Electrochemically Initiated Release: Exploring New Modalities for Controlled Drug Release. J. Electroanal. Chem. 2020, 872, 113926. [Google Scholar] [CrossRef]
- Moreno, E.; Pérez-Silanes, S.; Gouravaram, S.; Macharam, A.; Ancizu, S.; Torres, E.; Aldana, I.; Monge, A.; Crawford, P.W. 1, 4-Di-N-oxide Quinoxaline-2-carboxamide: Cyclic Voltammetry and Relationship Between Electrochemical Behavior, Structure and Anti-tuberculosis Activity. Electrochim. Acta 2011, 56, 3270–3275. [Google Scholar] [CrossRef]
- Moreno-Viguri, E.; Pérez-Silanes, S. Quinoxaline 1, 4-Di-N-oxide Derivatives: Interest in the Treatment of Chagas Disease. Rev. Virtual Quím 2013, 5, 1101–1119. [Google Scholar] [CrossRef]
- Canales, C.; Ramos, D.; Fierro, A.; Antilén, M. Electrochemical, Theoretical and Analytical Studies of the Electro-oxidation of Sulfamerazine and Norfloxacin on a Glassy Carbon Electrode. Electrochim. Acta 2019, 318, 847–856. [Google Scholar] [CrossRef]
- Śliwińska-Hill, U.; Celmer, J. Związki Koordynacyjne Rutenu jako Leki w Nowoczesnej Terapii Przeciwnowotworowej. Nowotwory 2015, 65, 517–528. [Google Scholar] [CrossRef] [Green Version]
- Zahn, R.; Coullerez, G.; Vörös, J.; Zambelli, T. Effect of Polyelectrolyte Interdiffusion on Electron Transport in Redox-active Polyelectrolyte Multilayers. J. Mater. Chem. 2012, 22, 11073–11078. [Google Scholar] [CrossRef]
- García-Miranda Ferrari, A.; Foster, C.W.; Kelly, P.J.; Brownson, D.A.; Banks, C.E. Determination of the Electrochemical Area of Screen-printed Electrochemical Sensing Platforms. Biosensors 2018, 8, 53. [Google Scholar] [CrossRef] [Green Version]
- Valencia, D.P.; González, F.J. Estimation of Diffusion Coefficients by Using a Linear Correlation Between the Diffusion Coefficient and Molecular Weight. J. Electroanal. Chem. 2012, 681, 121–126. [Google Scholar] [CrossRef]
- Munteanu, A.-C.; Uivarosi, V. Ruthenium Complexes in the Fight against Pathogenic Microorganisms. An Extensive Review. Pharmaceutics 2021, 13, 874. [Google Scholar] [CrossRef]
- De Oliveira, D.M.P.; Forde, B.M.; Kidd, T.J.; Harris, P.N.A.; Schembrl, M.A.; Beatson, S.A.; Paterson, D.L.; Walker, M.J. Antimicrobial Resistance in ESKAPE Pathogenes. Clin. Microbiol. Rev. 2020, 33, 1–49. [Google Scholar] [CrossRef]
- Tačić, A.; Nikolić, V.; Nikolić, L.; Savić, I. Antimicrobial Sulfonamide Drugs. Adv. Technol. 2017, 6, 58–71. [Google Scholar] [CrossRef] [Green Version]
- Sur, V.P.; Mazumdar, A.; Kopel, P.; Mukherjee, S.; Vítek, P.; Michalkova, H.; Vaculovičová, M.; Moulick, A.A. Novel Ruthenium Based Coordination Compound Against Pathogenic Bacteria. Int. J. Mol. Sci. 2020, 21, 2656. [Google Scholar] [CrossRef]
- Filipović, N.R.; Bjelogrlić, S.; Todorović, T.R.; Blagojević, V.A.; Muller, C.D.; Marinković, A.; Vujčić, M.; Janović, B.; Malešević, A.S.; Begović, N.; et al. Ni(II) Complex with Bishydrazone Ligand: Synthesis, Characterization, DNA Binding Studies and Pro-apoptotic and Pro-differentiation Induction in Human Cancerous Cell Lines. RSC Adv. 2016, 6, 108726–108740. [Google Scholar] [CrossRef] [Green Version]
- Jitianu, A.; Ilies, M.A.; Scozzafava, A.; Supuran, C.T. Synthesis and Carbonic Anhydrase Inhibitory Activity of 5-Benzoylamido-and 5-(3-Nitrobenzoylamido)-1, 3, 4-thiadiazole-2-sulfonamide and their Metal Complexes. Main Group Met. Chem. 1997, 20, 151–156. [Google Scholar] [CrossRef]
- Chylewska, A.; Biedulska, M.; Głębocka, A.; Raczyńska, E.D.; Makowski, M. Drug-like Properties and Complete Physicochemical Profile of Pyrazine-2-amidoxime: A Combined Multi-experimental and Computational Studies. J. Mol. Liq. 2019, 276, 453–470. [Google Scholar] [CrossRef]
- Thornsberry, C. Antimicrobial Susceptibility Testing: General Considerations. In Manual of Clinical Microbiology, 5th ed.; Balows, A., Hausler, W.J., Herrmann, K.L., Isenberg, H.D., Shadomy, H.J., Eds.; American Society for Microbiology: Washington, DC, USA, 1991; pp. 1059–1201. ISBN 1-55581-030-6. [Google Scholar]

| Sulfonamido (–SO2NH–) | Anilino (–NH2) | ||||||
|---|---|---|---|---|---|---|---|
| ν(Ru-Cl) | νs(SO2) | νas(SO2) | ν(NH) | δ(NH) | νs(NH) | νas(NH) | |
| RuCl3·H2O | 458 | - | - | - | - | - | - |
| Sulfathiazole STZ | - | 1129 | 1318 | 3271 | 1590 | 3319 | 3351 |
| [RuCl(OH2)(STZ)2]Cl2·H2O (1) | 458 | 1137 | 1316 | 3100 | 1577 | 3368 | 3470 |
| Sulfamerazine SMZ | - | 1156 | 1324 | 3251 | 1633 | 3375 | 3484 |
| [RuCl2(SMZ)2]Cl (2) | 448 * | 1156 | 1302 | 3251 | 1633 | 3363 | 3466 |
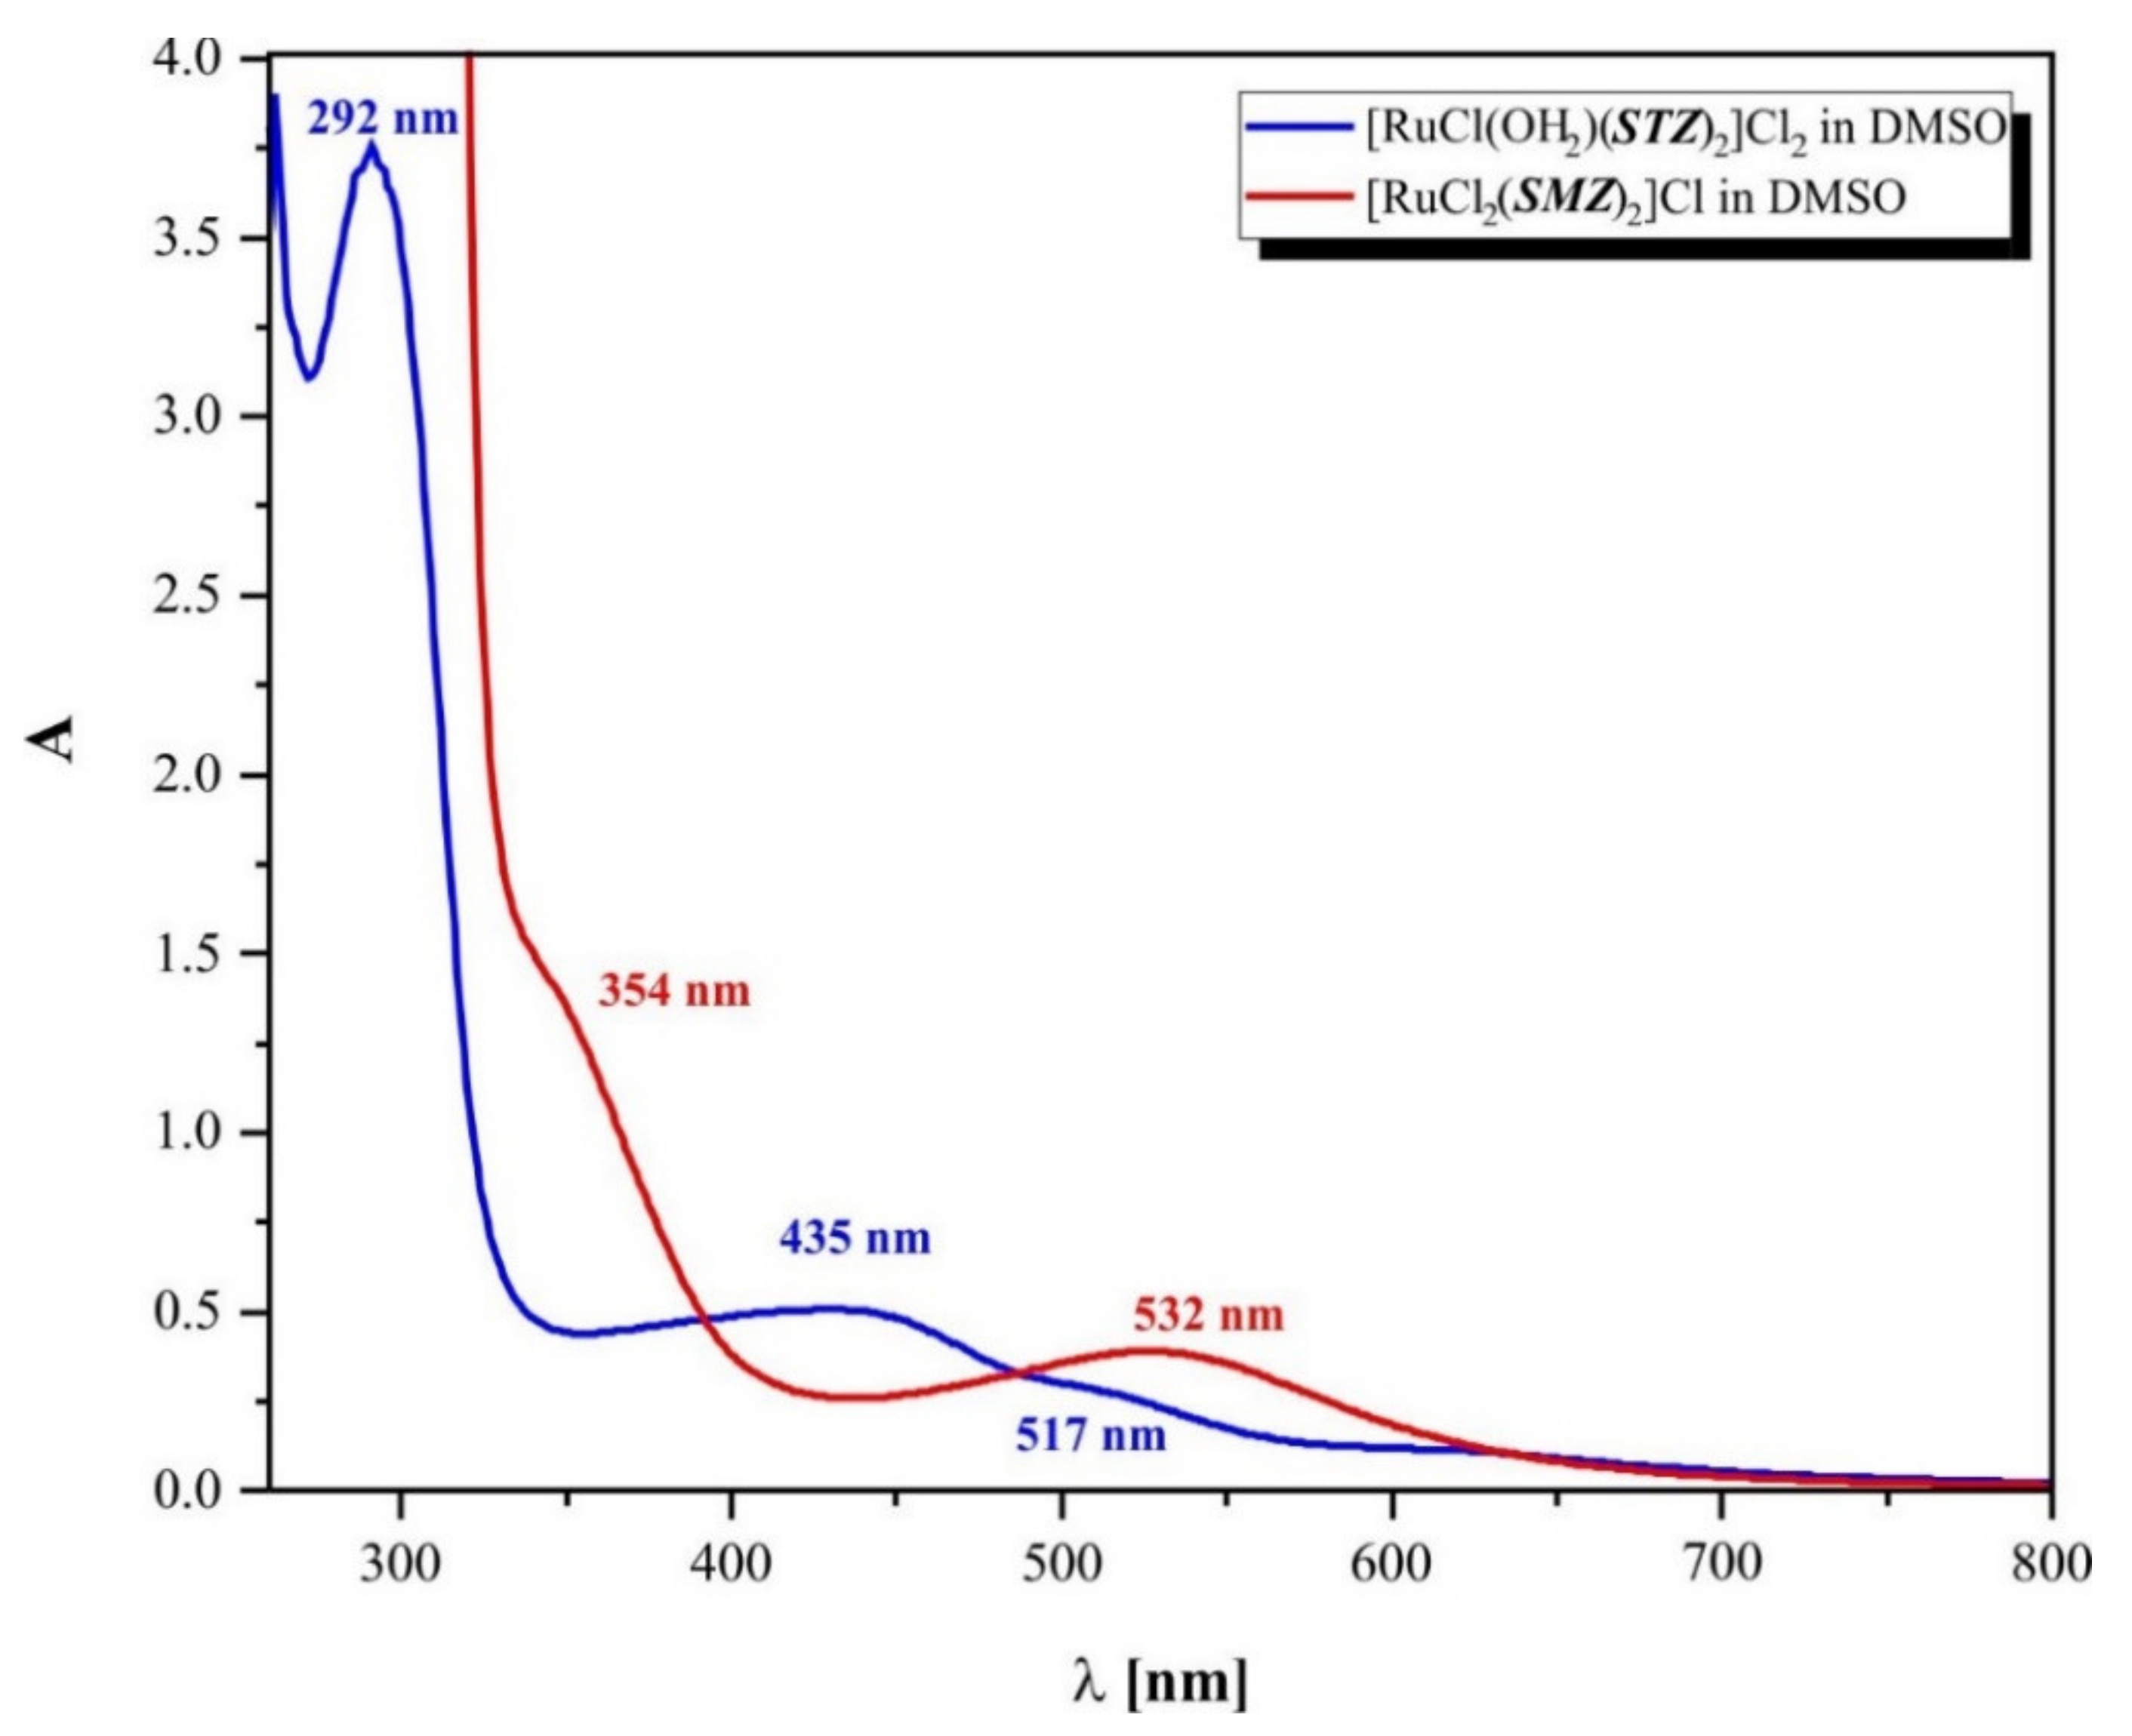
| Compound Formula (Geometry) | Conductivity (μS) | UV-Vis Bands (cm−1) | Assignments |
|---|---|---|---|
| [RuCl(OH2)(STZ)2]Cl2·H2O (1) (bipyramidal tetragonal) | 127.7 | 38,314 | Intraligand charge transfer |
| 34,247 | 2T2g → 2A2g, 2T1g | ||
| 22,988 | 2T2g → 2Eg | ||
| 19,342 | 2T2g → 4T1g | ||
| [RuCl2(SMZ)2]Cl (2) (octahedral distorted) | 12.58 | 41,322 | Intraligand charge transfer |
| 39,215 | 2T2g → 2A2g, 2T1g | ||
| 28,248 | 2T2g → 2Eg | ||
| 18,797 | 2T2g → 4T1g |
| Compound | Amount (mg) | Steps | Temp. Range (°C) | DTG (+) ENDO (−) EGZO | Weight Loss (%) | Decomposed Fragment Assignments | |
|---|---|---|---|---|---|---|---|
| STZ | Calc. | Found | |||||
| 9.712 | 1st | 200–300 | 225 (+) | 18.01 | 18.45 | CO + H2O | |
| 2nd | 300–440 | 335 (+) | 12.53 | 12.52 | C2H2 fragment | ||
| 3rd | 440–1090 | 500 (+) | 42.69 | 42.13 | C3H4SN2 fragment + ½ H2O | ||
| Residue | 26.90 | * NE | |||||
| [RuCl(OH2)(STZ)2]Cl2 ·H2O (1) | Calc. | Found | |||||
| 12.375 | 1st | 19–170 | 98 (+) | 4.77 | 4.22 | H2O (outside) | |
| 2nd | 170–580 | 250 (+) | 36.29 | 35.59 | Water molecule + one ligand STZ decompostion to carbon and nitrogen oxides | ||
| 3rd | 300 (+) | ||||||
| 4th | 375 (+) | ||||||
| 5th | 580–1090 | 750 (+) | 31.00 | 30.09 | Cl2 + second STZ ligand fragment C7H5N3O2 decomposed to carbon, nitrogen oxides, and water | ||
| 6th | 887 (+) | ||||||
| Residual mass | 30.10 | RuS2 and residual carbons | |||||
| SMZ | Calc. | Found | |||||
| 7.653 | 1st | 200–300 | 280 (+) | 51.45 | 51.39 | C3H5NS fragment of 1,3-diazine | |
| 2nd | 300–325 | 310 (+) | 7.18 | 7.47 | NH3 + H2 (reductor) | ||
| 3rd | 325–800 | 350 (+) | 14.75 | 14.92 | CO + ½ H2O | ||
| Residue | 26.22 | * NE | |||||
| [RuCl2(SMZ)2]Cl (2) | Calc. | Found | |||||
| 10.328 | 1st | 190–250 | 225 (+) | 3.66 | 3.57 | -HCl | |
| 2nd | 250–370 | 275 (+) | 48.70 | 47.38 | C11H12N4O2S decomposition of SMZ + C5N2H6 (4-methyl-1,3-diazine) | ||
| 3rd | 370–450 | 380 (+) | 23.37 | 24.04 | C6H8N2SO2 (SMZ defragmentation) | ||
| Residual mass | 25.01 | RuO2 and residual carbons | |||||
| [RuCl2(SMZ)2]Cl | [RuCl(OH2)(STZ)2]Cl2 | |||
|---|---|---|---|---|
| R2 | R2 | |||
| KSV (570) | 75790 ± 690 | 0.999 | 77651 ± 1185 | 0.998 |
| KD (570) | 1.24·10−5 ± 5.89·10−8 | 0.999 | 1.34·10−5 ± 1.60·10−7 | 0.999 |
| log KA (570) | 4.67 ± 0.05 | 0.999 | 5.25 ± 0.06 | 0.999 |
| KA (570) | 46773 | 0.999 | 179420 | 0.999 |
| n (570) | 0.954 ± 0.01 | 0.999 | 1.08 ± 0.01 | 0.999 |
| SMZ | STZ | |||
| R2 | R2 | |||
| KSV (570) | 80583 ± 827 | 0.999 | 66952 ± 267 | 0.999 |
| KD (570) | 1.34·10−5 ± 1.14·10−7 | 0.999 | 1.17·10−5 ± 9.25·10−8 | 0.999 |
| log KA (570) | 5.10 ± 0.02 | 0.999 | 4.48 ± 0.02 | 0.999 |
| KA (570) | 127544 | 0.999 | 30477 | 0.999 |
| n (570) | 1.048 ± 0.00 | 0.999 | 0.93 ± 0.00 | 0.999 |
| Compound | Ec [V] (CV) | Ec [V] (DPV) | Ec [V] (CV, 25 mV·s−1) | Ec [V] (CV, 225 mV·s−1) | D (cm2 ·s−1) |
|---|---|---|---|---|---|
| STZ | −2.377 | −2.325 | −2.401 | −2.477 | 1.157·10−6 |
| [RuCl(OH2)(STZ)2]Cl2·H2O (1) | −2.202 | −1.906 | −2.190 | −2.328 | 3.959·10−7 |
| SMZ | −1.689 | −1.597 | −1.658 | −1.701 | 5.916·10−8 |
| [RuCl2(SMZ)2]Cl (2) | −1.677 | −1.582 | −1.664 | −1.714 | 9.408·10−8 |
| MIC (Minimal Inhibitory Concentrations) (µM) | ||||
|---|---|---|---|---|
| Staphylococcus aureus ATCC 25923 | Enterococcus faecalis ATCC 19433 | Escherichia coli ATCC 25922 | Pseudomonas aeruginosa ATCC 27853 | |
| Gram-Positive | Gram-Negative | |||
| STZ | 501 | 63 | 251 | 1002 |
| [RuCl(OH2)(STZ)2]Cl2 ·H2O (1) | 340 | 42 | 169 | 679 |
| SMZ | >1930 | 121 | 242 | >1930 |
| [RuCl2(SMZ)2]Cl (2) | >696 | 87 | 174 | >696 |
| RuCl3·H2O | >2270 | >2270 | >2270 | >2270 |
| Ciprofloxacin * | 1.500 | 1.500 | <0.181 | 3.000 |
Publisher’s Note: MDPI stays neutral with regard to jurisdictional claims in published maps and institutional affiliations. |
© 2021 by the authors. Licensee MDPI, Basel, Switzerland. This article is an open access article distributed under the terms and conditions of the Creative Commons Attribution (CC BY) license (https://creativecommons.org/licenses/by/4.0/).
Share and Cite
Spisz, P.; Chylewska, A.; Królicka, A.; Ramotowska, S.; Dąbrowska, A.; Makowski, M. Stimulation of Sulfonamides Antibacterial Drugs Activity as a Result of Complexation with Ru(III): Physicochemical and Biological Study. Int. J. Mol. Sci. 2021, 22, 13482. https://doi.org/10.3390/ijms222413482
Spisz P, Chylewska A, Królicka A, Ramotowska S, Dąbrowska A, Makowski M. Stimulation of Sulfonamides Antibacterial Drugs Activity as a Result of Complexation with Ru(III): Physicochemical and Biological Study. International Journal of Molecular Sciences. 2021; 22(24):13482. https://doi.org/10.3390/ijms222413482
Chicago/Turabian StyleSpisz, Paulina, Agnieszka Chylewska, Aleksandra Królicka, Sandra Ramotowska, Aleksandra Dąbrowska, and Mariusz Makowski. 2021. "Stimulation of Sulfonamides Antibacterial Drugs Activity as a Result of Complexation with Ru(III): Physicochemical and Biological Study" International Journal of Molecular Sciences 22, no. 24: 13482. https://doi.org/10.3390/ijms222413482