Abstract
Plasma membrane intrinsic proteins (PIPs) transport water, CO2 and small neutral solutes across the plasma membranes. In this study, we used the clustered regularly interspaced short palindromic repeats (CRISPR) and CRISPR-associated protein 9 system (CRISPR/Cas9) to mutate PIP1;4 and PIP1;5 in a pip1;1,2,3 triple mutant to generate a pip1;1,2,3,4,5 (pip1s−) quintuple mutant. Compared to the wild-type (WT) plant, the pip1s− mutants had smaller sized rosette leaves and flowers, less rosette leaf number, more undeveloped siliques, shorter silique and less seeds. The pollen germination rate of the pip1s− mutant was significantly lower than that of the WT and the outer wall of the pip1s− mutant’s pollen was deformed. The transcriptomic analysis showed significant alterations in the expression of many key genes and transcription factors (TFs) in the pip1s− mutant which involved in the development of leaf, flower and pollen, suggesting that the mutant of PIP1s not only directly affects hydraulics and carbon fixation, but also regulates the expression of related genes to affect plant growth and development.
1. Introduction
Water movement is a key physiological process of vegetative and reproductive growth in plants that must be tightly regulated under different conditions [1,2,3,4,5]. The transport of water is controlled by both symplastic and apoplastic pathways. Aquaporins (AQPs) play a central role in the symplastic pathway which is efficient in transporting water across membranes [6,7,8]. Aquaporins transport water, CO2 and small neutral solutes through the plasma membranes and intracellular membranes of cells in many physiological and developmental processes, including cell elongation, stomatal regulation, seed germination, reproductive growth and stress responses in plants [1,5,7,8].
According to the conserved amino acid sequences and intron positions, AQPs are divided into five groups including plasma membrane intrinsic proteins (PIPs), tonoplast intrinsic proteins (TIPs), nodulin-like plasma membrane intrinsic proteins (NIPs), small intrinsic proteins (SIPs), and X intrinsic proteins (XIPs) [9,10,11,12]. PIPs are located to the plasma membrane and regulate water movement between cells to maintain the water balance [7,13]. Sequences of the PIP1s and PIP2s subgroups are highly conserved, however, the two isoforms are different in many aspects including their transport properties and subcellular localization.
The PIP2s subgroup is an efficient water channel, but the water transport capacity of PIP1s is inconclusive. Although some PIP1 has been proven to be an effective water channel in some species [14,15,16], the water transport efficiency of other PIP1s is relatively low or even none [17,18,19,20]. Subsequent studies have shown that this may be due to singly expressed PIP1s are retained intracellularly and fail to traffic to the plasma membrane [21,22]. Co-expression studies in Xenopus oocytes or maize protoplasts have clearly elucidated that PIP2s physically interact with PIP1s to form a heterotetramer [21,22]. PIP2s promote the traffic of PIP1s from the endoplasmic reticulum (ER) to the plasma membrane and enhance the water transport efficiency of PIP1s [23]. Interestingly, studies in maize showed that the water transport efficiency of ZmPIP1;2 and ZmPIP2;5 heterotetramer was even higher than that of ZMPIP2;5 homotetramer [24]. The role of PIP1s as modulators of membrane water permeability has also been reported in garden strawberry [25].
According to previous studies, the transcriptional expression, biological activity and localization of PIP1s and PIP2s are regulated by abiotic stresses, plant hormones and light [2,3,4,5,26,27]. Overexpression of PIPs in plants may lead to more stress resistant or less, which depend on the sources or isoforms of these genes [28,29,30,31,32,33,34,35,36]. Therefore, specific PIPs, which confer plants more resistance to stresses or better growth and development, are important potential genetic resources in agronomic and crop science [16,19,37,38,39,40,41,42,43,44].
We constructed single mutants, double mutants and triple mutants to study the functions of PIP1s. Our work found that under natural growth conditions, the phenotypes of rosette leaves, flowers and siliques were not significantly altered in these mutants. However, under drought and salt stress conditions, the mutants showed a slight difference in seed germination rates and survival rates compared to the WT plant. The quintuple pip1s− mutant must be generated to further refine the roles of PIP1s in plant growth and development. However, the mutant is difficult by crossing corresponding T-DNA insert mutants. In this study, we generated quintuple pip1s− mutants by mutating PIP1;4 and PIP1;5 in the pip1;1/2/3 triple mutant using the CRISPR/cas9 system. The study aims to determine the role of the PIP1s subgroup in plant growth and development and to provide a theoretical basis of agricultural production to improve crop traits and yield.
2. Results
2.1. Generation of the pip1s− Quintuple Mutants in Arabidopsis Thaliana
To explore the contributions of PIP1s during the vegetative growth and reproductive growth, the CRISPR-cas9 system was used to mutate the PIP1;4 and PIP1;5 in the pip1;1/2/3 triple mutant. PCR showed that full-length of PIP1;1/2/3 was not expressed in the pip1;1/2/3 mutant (Figure 1A). The pVK004-15 plasmids expressing the sgRNA targets for PIP1;4 and PIP1;5 was transformed into the pip1;1/2/3 mutant to generate the pip1s− quintuple mutant (Figure 1B). The homozygous pip1s− quintuple mutant lines among the T2 plants were identified by sequencing. Sequencing results identified a 29-bp deletion in the coding region of PIP1;4 and a 1-bp insertion in the coding region of PIP1;5 in pip1s−-1 (Figure 1C). A 1-bp insertion in the coding region of PIP1;4 and a 5-bp deletion in the coding region of PIP1;5 were detected in pip1s−-2 (Figure 1C). Both mutated PIP1;4 and PIP1;5 sequences in pip1s−-1 and pip1s−-2 were frameshift mutations, resulting in the premature translational termination of PIP1;4 and PIP1;5 (Figure 1D).
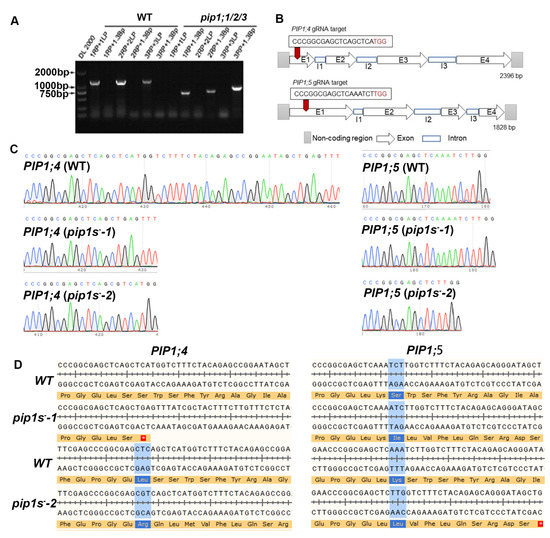
Figure 1.
Generation of the pip1s mutants. (A) Amplification of the T-DNA insertion in mutant pip1;1/2/3. (B) Schematic of the pip1s mutant. (C) Sanger sequencing chromatographs showing the deletion in the pip1s mutant. (D) Amino acid sequence alignment of the pip1s− mutant and the WT plant. The asterisk on the red background represents the termination codon.
2.2. The pip1s− Quintuple Mutants Are Defective in Plant Vegetative Growth
The WT, pip1s−-1, and pip1s−-2 plants were grown on soil under 16/8 h light/dark conditions to investigate the phenotypes of the pip1s−. Compared to the WT plant, the pip1s− mutants had smaller rosette leaves and fewer rosette leaves during the vegetative stage (Figure 2A–D). Early bolting was observed in the pip1s− mutants under normal growth conditions (Figure 2A). The bolting time in the pip1s− mutants was significantly advanced (up to 3 days) compared to the WT plants (Figure 2E).
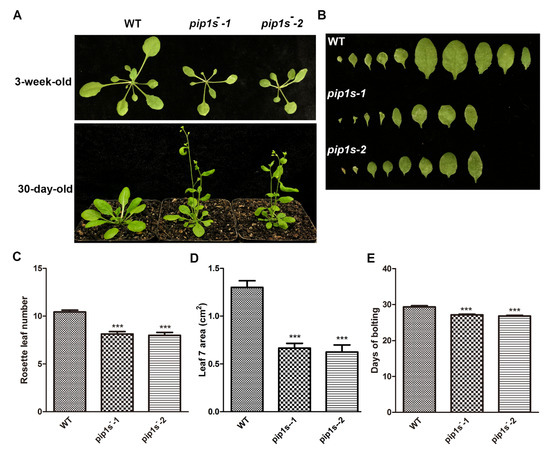
Figure 2.
The pip1s− mutants are defective in vegetative growth in Arabidopsis. (A) The growth phenotypes of the WT, pip1s−-1 and pip1s−-2 plants. The 10-day-old seedlings grown on 1/2 MS plates were transplanted to soil and grown at 22 °C with 16 h/8 h light/dark. Photographs were captured 30 days or 3 weeks after transplantation. (B) Morphological phenotype of the leaves of 3-week-old WT, pip1s−-1 and pip1s−-2 plants. (C) Number of rosette leaves produced per plant of the WT, pip1s−-1 and pip1s−-2 plants after transplanted for 3 weeks. (D) The area of the seventh rosette leaf of the WT, pip1s−-1 and pip1s−-2 plants after transplanted for 3 weeks. The area was determined with ImageJ software. (E) Days to start bolting of the WT, pip1s−-1 and pip1s−-2 plants. Bars represent the means ± SD of three biological replicates. Significant differences were determined by one-way analysis of variance (ANOVA) followed by Duncan’s multiple range test (*** p < 0.0001).
2.3. Mutation of PIP1s Affects Flower Growth and Development
Compared to the WT plants, significantly reduced lengths and widths of mature flowers were observed in pip1s−-1 and pip1s−-2 mutants (Figure 3A,B). Many flower buds of pip1s− mutants began to wither before flowering (Figure 3C). Eventually, the sepals, petals, stamens, and all carpels of the flower withered (Figure 3D).
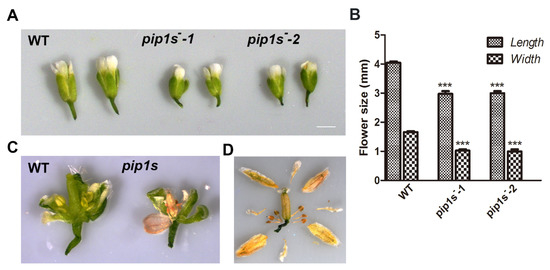
Figure 3.
Analysis of the flower morphology of the WT, pip1s−-1 and pip1s−-2 plants. (A) Photographs of flowers from the 5-week-old plants grown under standard conditions were captured. (B) Statistics analysis of flower length and width of the WT, pip1s−-1, and pip1s−-2 plants. (C) Morphology of dissected flowers from the WT and pip1s−. (D) Morphological phenotype of the dissected dry flower buds of pip1s− plants. Bars represent the means ± SD of three biological replicates. Significant differences were determined by one-way ANOVA followed by Duncan’s multiple range test (*** p < 0.0001).
2.4. Mutation of PIP1s Decreases the Number and Length of Silique
Unfertilized or withered flowers and undeveloped siliques were observed in both WT and pip1s− mutant plants (Figure 4A). Undeveloped siliques turned yellow, wilted, and even moldy during silique development (Figure 4B). The number of siliques per plant was significantly reduced in the pip1s− mutants compared to the WT plants (p < 0.01) (Figure 4C). We divided these siliques into three major categories: well-developed, undeveloped, and unfertilized (Figure 4D). The percentages of undeveloped and unfertilized siliques were substantially increased in the pip1s− mutants.
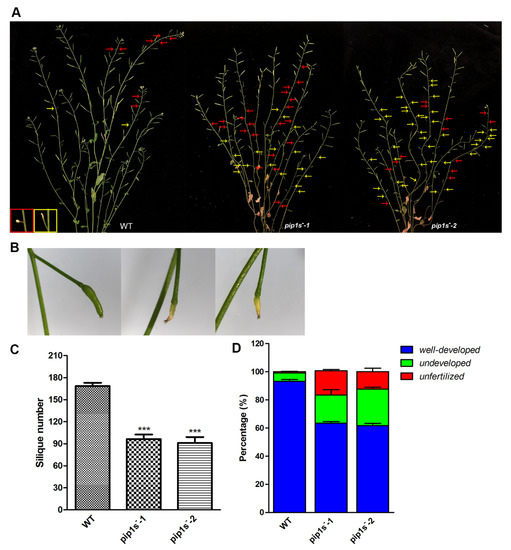
Figure 4.
PIP1s mutations impair plant fertility at the reproductive stage. (A) Phenotypes of the WT, pip1s−-1, and pip1s−-2 plants during the reproductive stage. Photographs of 8-week-old plants were captured. Red arrows indicate unfertilized flowers; yellow arrows indicate undeveloped siliques. (B) Phenotypes of well-developed and undeveloped siliques. (C) Statistical analysis of the number of siliques per plant. (D) Siliques were divided into three categories and the percentage was calculated. Bars represent the means ± SD of three biological replicates. Significant differences were determined by one-way ANOVA followed by Duncan’s multiple range test (*** p < 0.0001).
When comparing the developed siliques of the WT and pip1s− mutant plants, we found that the mutant siliques were nicked (Figure 5A). The pip1s− mutants had shorter silique lengths than the WT plants at 14 days after flowering (DAF) (Figure 5B). The average seed number per silique of the WT was 46.7, which was significantly greater than that of the pip1s−-1 (23.8) and pip1s−-2 (23.1) (p < 0.01) (Figure 5C). We divided the silique length into three categories: >10 mm, 6–10 mm, and <6 mm. The silique lengths of the pip1s−-1 and pip1s−-2 mutants were largely reduced compared to the WT plants (Figure 5D).
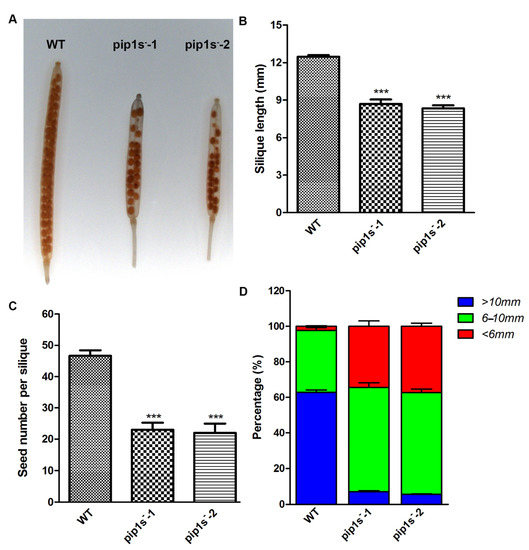
Figure 5.
Analysis of the phenotypes of siliques from the WT, pip1s−-1 and pip1s−-2 plants. (A) Transparent siliques of the WT, pip1s−-1, and pip1s−-2 plants at 14 DAF. Bar = 5 mm. (B) Length of 14 DAF siliques. (C) Statistical analysis of seed number per silique at 14 DAF. (D) Silique length was divided into three categories and the percentage per plant was calculated. Bars represent the means ± SD of three biological replicates. Significant differences were determined by one-way ANOVA followed by Duncan’s multiple range test (*** p < 0.0001).
2.5. Mutation of PIP1s Affects Seed Development
Compared to the WT plants, some aborted and malformed seeds were observed in the pip1s− mutants (Figure 6A,B). The proportions of the aborted seeds in the pip1s−-1 and pip1s−-2 mutants were 31.2% and 31.6%, respectively (Figure 6C).
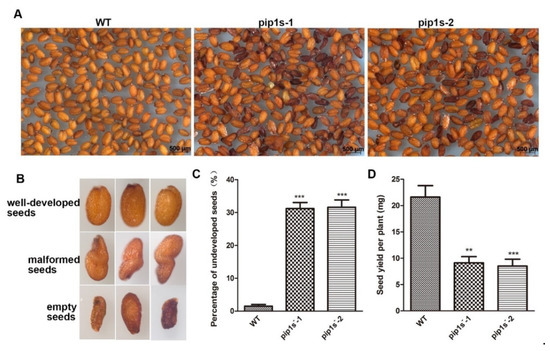
Figure 6.
Phenotypic analysis of seeds from the WT, pip1s−-1 and pip1s−-2 plants. (A) The seeds of WT, pip1s−-1 and pip1s−-2 plants. (B) The phenotype of well-developed seeds, malformed seeds and aborted seeds. (C) Statistical analysis of the percentage of undeveloped seeds. (D) Statistical analysis of the seed yield per plant of the WT, pip1s−-1 and pip1s−-2 plants. Bars represent the means ± SD of three biological replicates. Significant differences were determined by one-way ANOVA followed by Duncan’s multiple range test (** p < 0.0005, *** p < 0.0001).
2.6. Mutation of PIP1s Affects Pollen Morphology and Activity
Scanning electron microscopy indicated that both the WT and pip1s− mutant pollen had regular honeycomb outer wall structures. However, the outer wall of the mutant pollen was deformed and shrunk (Figure 7A). Pollen germination experiments conducted in vitro revealed that the pollen germination rate of the pip1s− mutant was significantly lower than the WT plant (p < 0.01) (Figure 7B,F). The pollen germination experiment conducted in vivo produced similar results, and the pollen-stigma binding ability of the pip1s− mutant was impaired compared to the WT plant (Figure 7D). Alexander staining experiments displayed a lower number of active pollen grains per anther in the pip1s− mutant than in the WT plant (Figure 7C).
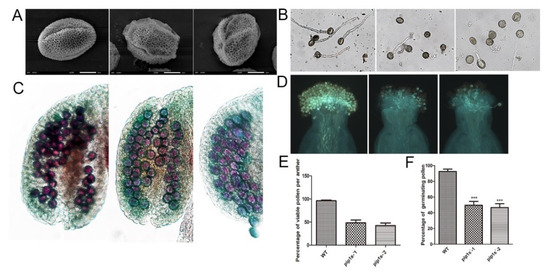
Figure 7.
Pollen morphology and vitality of the WT, pip1s−-1 and pip1s−-2 plants. (A) Scanning electron micrographs of pollen from the WT, pip1s−-1, and pip1s−-2 plants. (B) Pollen germination in liquid culture media in vitro. (C) Alexander-stained anthers of WT, pip1s−-1, and pip1s−-2 plants. (D) Aniline blue stained pollen and pollen tubes of WT, pip1s−-1, and pip1s−-2 plants. (E) Statistical analysis of the percentage of viable pollen grains per anther. (F) Statistical analysis of the percentages of germinating pollen and undeveloped seeds. Bars represent the means ± SD of three biological replicates. Significant differences were determined by one-way ANOVA followed by Duncan’s multiple range test (*** p < 0.0001).
2.7. Analysis of Differentially Expressed Genes (DEGs) in the pip1s− Mutants and the WT Plants
To investigate the effect of PIP1s on the transcriptome profile, 30-day-old rosette leaves and 14 DAF siliques were collected from the WT and pip1s− mutant plants for the RNA-seq analysis. At the transcriptional level, the expression of 3537 genes was significantly changed (|log2| ≥ 1, FDR ≤ 0.05) in the pip1s− mutant rosette leaves compared to the WT (muleaf vs. WTleaf), of which 2137 genes were up-regulated and 1400 genes were down-regulated (Figure 8A,C). The top three up-regulated DEGs were EXL1 (AT1G35140, log2FoldChange = 11.997), TIFY (AT2G34600, log2FoldChange = 9.602), and ERF016 (AT5G21960, log2FoldChange = 9.362). The EXL1 gene is involved in the C-starvation response. The exl1 mutant showed diminished biomass production in a short-day/low light growth regime, impaired survival during extended night, and impaired survival under anoxic stress [45,46]. The top 3 down-regulated DEGs were AT3G16670 (AT1G35140, log2FoldChange = −7.352), WSD1 (AT5G37300, log2FoldChange = −6.296) and CYP71B17 (AT3G26160, log2FoldChange = −6.259). AT3G16670 belongs to the pollen Ole e 1 allergen and extensin family of proteins and is involved in the response to oxidative stress [47,48]. WSD1 encodes a bifunctional enzyme, wax ester synthase (WS), and diacylglycerol acyltransferase (DGAT), which are involved in the triglyceride biosynthetic process and wax biosynthetic processes [49,50,51]. CYP71B17 encodes the Arabidopsis cytochrome P450 71B17 mRNA, which is involved in the oxidative degradation of various compounds and secondary metabolite biosynthetic processes [52,53].
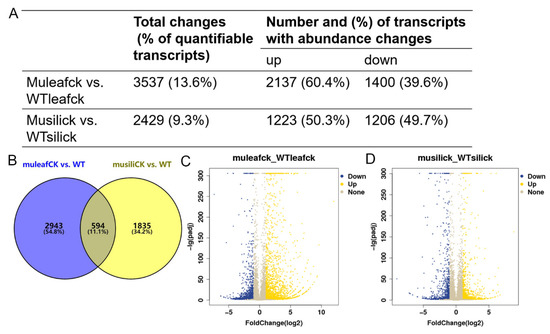
Figure 8.
Transcriptome analysis of the WT and pip1s− mutant plants. (A) The number of DEGs in terms of transcript abundance in rosette leaves and siliques from the WT and pip1s− mutant plants. (B) Venn diagram showing the number of DEGs in the two comparison groups (muleaf vs. WT and musili vs. WT). (C,D) Volcano plots showing up-regulated and down-regulated of DEGs in the comparisons of muleaf with WTleaf (C) and musili with WTsili (D).
The expression of 2429 genes was altered (|log2| ≥ 1, FDR ≤ 0.05) in the pip1s− mutant siliques compared to the WT siliques (musili vs. WTsili), of which 1223 genes were up-regulated and 1206 genes were down-regulated (Figure 8A,D). The Venn diagram showed the overlap of 594 identical differentially expressed genes (DEGs) in the two comparison groups (muleaf vs. WTleaf and musili vs. WTsili) (Figure 8B). The top three up-regulated DEGs were AT3G06955 (AT3G06955, log2FoldChange = 8.777), AT3G04180 (AT3G04180, log2FoldChange = 6.700) and AT5G37690 (AT5G37690, log2FoldChange = 6.437). The top three down-regulated DEGs were AIG1 (AT1G33960, log2FoldChange= −9.014), CYP71B31 (AT3G53300, log2FoldChange= −7.133) and AT2G15020 (AT2G15020, log2FoldChange= −7.055). Further analysis of DEGs found that many were related to photosynthesis, pollen wall formation, pollen development, pollen hydration and pollen tube growth (Table 1).

Table 1.
DEGs analysis related to growth and development of the pip1s− mutant and the WT.
2.8. GO and KEGG Analyses of pip1s− Mutants and WT plants
The gene Ontology (GO) analysis of DEGs in the group muleaf vs. WTleaf revealed 176 GO terms that were significantly altered at FDR < 0.05, including 130 biological processes, 22 cellular components and 24 molecular functions (Figure 5A). While in the group musili vs. WTsili, 162 terms with FDR < 0.05 were identified, including 112 biological processes, seven cellular components, and 43 molecular functions (Figure 5B). The top significantly altered terms were mainly related to metabolic processes, cellular processes, responses to stimulus and biological regulation, suggesting that the five PIP1 genes played an important role in these processes.
In the Kyoto Encyclopedia of Genes and Genomes (KEGG) category, 881 transcripts were assigned to 117 pathways, of which 4 pathways were significantly enriched in group muleaf vs. WTleaf (q ≤ 0.05). Another 616 transcripts were assigned to 109 pathways, of which 7 pathways were significantly enriched in group musili vs. WTsili (Table 2). The KEGG pathway analysis showed that 47 hormone-related genes were significantly differentially expressed (including 26 up-regulated and 21 down-regulated) in the pip1s− mutant rosette leaves compared to the WT rosette leaves. The analysis of secondary metabolism pathways using KEGG showed that the phenylpropanoids and flavonoid biosynthesis pathway were significantly altered in the rosette leaves and silique of the pip1s− mutant compared to the WT plants. Some genes related to starch and sucrose metabolism and cutin, suberin and wax biosynthesis were significantly altered in the pip1s− mutant silique compared to the WT siliques (Figure 9C).
Table 2.
KEGG pathway analysis of pip1s− mutant RNA-sequencing data.
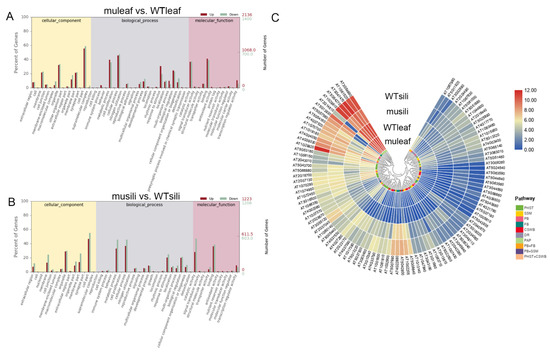
Figure 9.
GO enrichment analysis and KEGG pathway analysis. (A,B) Gene Ontology (GO) analysis of cellular components, biological processes and molecular functions of muleaf vs. WT (A) and musili vs. WT (B). (C) KEGG pathway and cluster analysis of 99 DEGs. Plant hormone signal transduction (PHST); starch and sucrose metabolism (SSM); phenylpropanoid biosynthesis (PB); flavonoid biosynthesis (FB); cutin, suberin and wax biosynthesis (CSWB); DNA replication (DR); and photosynthesis (PAP).
2.9. Transcription Factor Analysis of the DEGs
A total of 150 and 69 transcription factor genes were significantly differentially expressed in the rosette leaves and siliques of the pip1s− mutant compared to the WT plant, respectively. Among the identified TF genes, many were involved in leaf, flower and seed development (Table 3 and Table 4). In rosette leaves, the TF genes related to leaf development covered many TF families, such as TCP, AP2, B3, MYB, NAC and WRKY. The expression of seven AP2 genes (ERF1A, ERF2, ERF6, ERF11, ERF018, ERF104, and ERF 109) were all up-regulated in the pip1s− mutant compared to the WT plants, and the GO analysis indicated that these genes were involved in cell division [54,55]. Four NAC genes, including NAC59, NAC29, NAC42, and NAC84, involved in leaf senescence and cell division and expansion were all promoted in the pip1s− mutant compared to the WT plants [56]. In the silique, the TF genes related to flower and seed development included the B-box domain proteins, zinc finger proteins, MYB, B3 and NAM TF families. The expression of four B-box domain protein genes (MIP1B, BBX32, AT5G54470, and AT4G27310) were all down-regulated in the pip1s− mutant compared to the WT and the GO analysis indicated that these genes were involved in the regulation of flower development. Four zf-Dof genes, including CDF1, CDF2, CDF3, and CDF5, involved in flower development, were all repressed in the pip1s− mutant compared to the WT plants.
Table 3.
Analysis of TFs related to leaf development in the pip1s− mutant and WT plants.
Table 4.
Analysis of TFs related to flower and seed development in the pip1s− mutant and WT plants.
2.10. Verification of Transcriptome Sequencing
Eight genes were selected for quantitative real-time PCR (Q-PCR) to confirm the reliability of the RNA-seq data (Figure 10). LHCA1 and LHCB1.1 encode chlorophyll a/b binding protein, as a light harvesting protein complex in photosystem (PS) I or II, which converts light energy into unstable chemical energy. RAV1 was identified as a negative regulator of leaf development in Arabidopsis. WRKY22 was reported to be related to leaf senescence and response to chitin. CALS7 and CALS8 are callose-synthesizing genes, and their deletion hinders the normal development of pollen outer walls. MYB103 was reported to regulate the expression of CALS7 and CALS8, and subsequently regulate the development of pollen tapetum. PMEI1 was identified as pectin methyl esterase inhibitor, which was located at the top of pollen tube cells and negatively regulated catalysis. LHCA1, LHCB1.1, CALS7, CALS8 and MYB103 were significantly down regulated, whereas RAV1, WRKY22 and PEMI1 were significantly up regulated in pip1s− mutant compared to the WT (Figure 10).
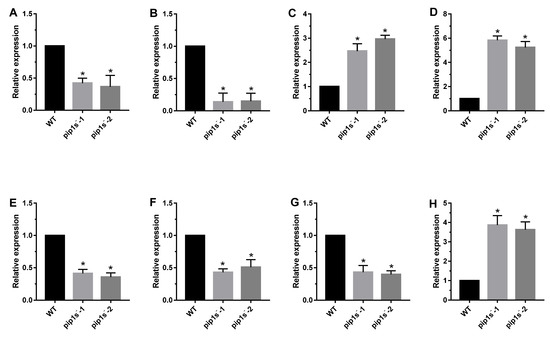
Figure 10.
Q-PCR analysis of phenotype-related genes in the pip1s− mutant and WT plants. Relative expression of LHCA1 (A), LHCB1.1 (B), RAV1 (C), WRKY22 (D), CALS7 (E), CALS8 (F), MYB103 (G) and PMEI1 (H) in pip1s− mutant and WT. Bars represent means ± SD of three biological replicates. Significant differences were determined by one-way ANOVA followed by Duncan’s multiple range test (* p < 0.05).
3. Discussion
3.1. Mutation of PIP1s Influences the Vegetative Growth of Arabidopsis
PIPs are usually located to the plasma membrane, but recent evidence suggests that some isoforms may also be located to the chloroplast envelope in at least minute amounts [57,58,59]. The co-localization of the PIPs and TIPs in chloroplast and thylakoid membranes may reflect their key roles in water supplying and CO2 transport for photosynthesis [60]. Some PIP1s appear to play a dual role in water and CO2 transport of Arabidopsis and tobacco [14,61,62,63]. The CO2 permeability of the chloroplast envelope purified from tobacco leaves is five times lower than that of plasma membrane vesicles. After antisense inhibition of NtAQP1 in transgenic tobacco, its CO2 permeability is reduced by 90% [64]. In addition to NtAQP1, AtPIP1;2 has also been shown to promote CO2 transmembrane transport after heterologous expression in yeast cells [65]. The genetic changes intheir functions in tobacco or Arabidopsis plants, using antisense suppression or overexpression, revealed a positive correlation between their expression and CO2 assimilation rate [65]. To date, the aquaporins that all belong to the subclasses of PIP1 and PIP2 have been shown to promote the membrane diffusion of CO2 in several plant species.
In our study, compared to the WT plants, the pip1s− mutants had smaller rosette leaf size and fewer rosette leaf numbers which exhibited overall defects in vegetative growth. The vegetative growth defect of the mutant may be caused by the mutation of PIP1s which limits the transportation of CO2 in plants, thereby affecting the second stage of photosynthesis in plants (Figure 11). On the other hand, seven down-regulated LHCAs and LHCBs, which encode the chlorophyll a/b binding protein, may affect the first stage of photosynthesis and block the conversion of light energy into unstable chemical energy (Figure 11). In addition, according to our previous studies, single pip1− mutants, double mutants, or even triple mutants had no significant effect on vegetative growth, implying that in addition to AtPIP1;2, other PIP1s genes are also involved in the active transport of CO2. The phenotype of plants with genetically altered aquaporins is usually difficult to decipher, because it integrates far more than the direct effects of aquaporins on tissue hydraulics or carbon fixation, but mutations in PIP1s may also regulate the expression of other AQPs or transcription factors and hormone signal transduction. According to our work, a hypothesis has been proposed that the mutation of PIP1s defect the vegetative growth of mutants by regulating the expression of chlorophyll a/b binding protein genes and the transmembrane transport of CO2 (Figure 11).
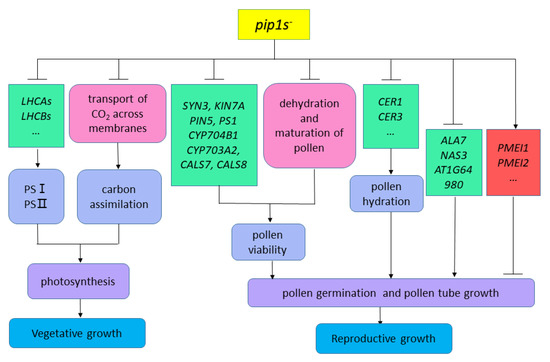
Figure 11.
Hypothesis diagram of pip1s− mutants affecting plant vegetative and reproductive growth.
3.2. Mutation of PIP1s Influences the Reproductive Growth of Arabidopsis
Two desiccated forms of higher plant life, pollen and seeds, play an important role in the plant life cycle. Pollen and seeds express TIP5 and TIP3 specific aquaporin subclasses, respectively [66,67,68]. This specificity may result from the highly specialized growth or germination processes observed in pollen and seeds. In flowers, tissue desiccation involving aquaporins at various stages is required during reproductive growth. For example, dehydration of anthers is necessary for dehiscence and the release of mature pollen and is hindered by reduced expression of PIP2s in tobacco plants [69]. The maturation of pollen grains is accompanied by gradual dehydration, and their germination is induced by the rapid growth of pollen tubes, which also involves water transduction via PIPs. Previous research showed that after mutating two pollen TIPs specific to vegetative and sperm cells, Arabidopsis showed reduced fecundity in the presence of a limited water or nutrient supply [68].
According to our research, the number of viable pollen grains per anther in the pip1s− mutants was significantly less than the WT plants, potentially because the mutation of PIP1s affects the normal dehydration and maturation process of pollen grains. Additionally, the pollen from both the WT and the pip1s− mutants had regular honeycomb outer wall structures. However, pollen outer wall of the mutant was deformed and shrunken, which resulted in the impaired pollen-stigma binding ability of the pip1s− mutant compared to the WT plants. Additionally, the transcriptional sequence analysis showed that some key DEGs, including SYN3, KIN7A, PIN5, PS1, CYP704B1, CYP703A2, CALS7 and CALS8, were involved in exine formation and pollen development (Figure 11).
In addition, the pollen germination rate of the pip1s− mutant was significantly lower than the WT plants in vitro and in vivo. Mutations in PIP1s also regulate the expressions of many genes related to pollen tube growth and may block pollen grains from absorbing water and germinating (Figure 11).
The pip1s− mutants exhibited more undeveloped siliques, shorter siliques and fewer seeds. The lower numbers of siliques and seeds in the pip1s− mutant may be partly attributed to the withering of many flower buds of pip1s−before fertilization. Compared the developed siliques of the WT and pip1s− mutant plants, we found that the mutant siliques were nicked. In addition, compared to the WT plants, some aborted seeds and malformed seeds were observed in the pip1s− mutants. In summary, the change in pollen morphology and the reduced pollen viability may lead to a decrease in pollen adhesion and germination rate, that the siliques of the pip1s− mutants were shorter and nicked, finally leading to a significant decrease in the yield of the mutant.
The KEGG analysis showed that plant hormone signal transduction, phenylpropanoids and flavonoid biosynthesis, pentose and glucuronate interconversions, starch and sucrose metabolism and cutin, suberin and wax biosynthesis were significantly altered in pip1s− mutant siliques compared to WT siliques. The GO analysis of DEGs in the pip1s− mutant compared to the WT plants revealed that they were mainly related to metabolic processes, cellular processes, responses to stimulus and biological regulation, suggesting that PIP1s may be involved in regulating growth and development regulation and the stress response in plants. TF genes accounted for a large proportion of the DEGs identified in the pip1s− and consisted of many TF families, such as TCP, AP2, B3, MYB, NAC, NAM, WRKY, B-box domain proteins and zinc finger proteins. Most of the TF genes were related to cell proliferation, cell division, leaf development, leaf senescence, flower development, pollen development, pollen maturation, pollen sperm cell differentiation, pollen tube guidance, embryo sac development and embryo development ending in seed dormancy, suggesting that these TF genes play various important roles in plant growth and development [54,55,56].
4. Materials and Methods
4.1. Plant Materials and Growth Conditions
Arabidopsis ecotype Columbia (Col-0) was used as the WT control in the present study. The triple T-DNA insertion mutant used in this study was obtained through the hybridization method. Seeds were sterilized with 0.1% (w/v) HgCl2 for 10 min, washed five times with sterile water, sown on Murashige and Skoog (MS) medium [3% (w/v) sucrose, 0.7% (w/v) agar] and vernalized at 4 °C for 3 days in the dark. Then, 10-day-old seedlings were transferred to pots filled with a mixture of soil and sand (3:1) and grown in a chamber set at 22 °C; 110 μmol·m−2·s−1 light intensity; 16-h light/8-h dark cycle; and 70% relative humidity.
4.2. Generation of the pip1s− Mutant
To generate the pip1s−-1 and pip1s−-2 mutant, sgRNA targets in the PIP1;4 and PIP1;5 genes were selected and cloned into the pVK004-15 vector (Viewsolid biotech, Beijing, China), and then were transformed into the triple mutant by floral dip method. The transgenic T1 seeds were collected and screened on 1/2 medium containing 50 mg/L hygromycin. The fragments covering the mutation sites were amplified from the T1 transgenic lines by PCR and sequenced to identify the successfully mutated ones. The homozygous mutants were screened from the T2 generation and the seeds were harvested from individual lines to obtain T3 plants, of which non-hygromycin resistant plants were obtained.
4.3. Identification of the pip1s− T-DNA Mutant
Homozygous T-DNA insertional mutant plants were confirmed by conducting two consecutive PCR assays. The first assay involved the use of two gene-specific primers: LP and RP. The second assay used one gene-specific primer, RP, and one T-DNA-specific primer (LB).
4.4. High-Throughput mRNA Sequencing Analysis
Total RNA was extracted from thirty-day-old rosette leaves and 14 DAF siliques and 3 μg of RNA from each sample were used for library construction and subsequent RNA-deep sequencing on the Illumina HiSeq 2500 platform. RNA-seq data were collected from two independent experiments. The adaptor sequences and low quality sequences were removed. Approximately 4.0 GB of clean reads were generated from each sample. The clean reads were mapped to the Arabidopsis reference genome using TopHat with TAIR10 gene annotation as the transcript index. The minimum and maximum intron lengths were set to 40 and 5000, respectively. Cufflinks was used to assemble the new transcripts. HTSeq was used to calculate the raw read counts for each gene. Gene expression was normalized among samples using DESeq. The differental gene expression data were collected from the comparison with a fold change ≥2 and a false discovery rate of 0.01.
4.5. RNA Extraction and qRT-PCR
Total RNA was extracted from leaves and siliques at different developmental stages using the RNeasy Plant Mini Kit (Qiagen, Amsterdam, The Netherlands). Total RNA (1 μg) from each sample was converted into cDNA by reverse transcription using the RNA PCR Kit (TaKaRa, Dalian, China) according to the manufacturer’s instructions. qRT-PCR was conducted on an ABI 7500 system (Applied Biosystems, New York, NY, USA) using the TransStart™ Green qRT-PCR SuperMix Kit (TransGen, Beijing, China). Actin2 was used as a reference gene to normalize the relative transcriptional abundance and to minimize differences in the copy numbers of cDNA templates. The control sample was conferred a value of 1. All data were calculated and analysed from three independent samples based on the 2-ΔΔCt method.
4.6. Statistical Analysis
The data are presented as means ± SD and were compared using SPSS software with one-way ANOVA followed by Duncan’s multiple range test at a significance level of p < 0.05.
5. Conclusions
The pip1s− quintuple mutant displayed severe growth defects in rosette leaves, flowers, siliques and seeds. Compared to the WT plant, the pip1s− mutants showed smaller and fewer rosette leaves, smaller flowers, shorter silique and fewer seeds under physiological conditions. Further studies on the pollens exhibited that pollen exine shape was abnormal and pollen vitality and germination rate are significantly reduced in the pip1s− mutants. In summary, PIP1s play a very important role in plant vegetative growth and reproductive growth and are important potential genetic resources in agronomic and crop science. Our research also provides a theoretical basis for agricultural production to improve crop traits and yield.
Author Contributions
Conceptualization, X.W., Y.W., Z.L. and G.Z.; data curation, X.W., Y.W. and L.Z.; formal analysis, X.W., Z.L. and T.L.; funding acquisition, G.Z.; methodology, X.W., T.L.; project administration, G.Z.; resources, G.Z.; software, X.W., Y.W., Z.L., T.L. and L.Z.; supervision, G.Z.; writing—original draft, X.W.; writing—review and editing, X.W. and G.Z. All authors have read and agreed to the published version of the manuscript.
Funding
This work was supported by the National Natural Science Foundation of China (31872672 and 31470399) and the Open fund from Beijing Key Laboratory of Gene Resource and Molecular Development.
Data Availability Statement
The data are available upon reasonable request from qualified researchers.
Conflicts of Interest
The authors declare no conflict of interest.
References
- Maurel, C. Plant Aquaporins, Cell Biology; Springer: New York, NY, USA, 2014. [Google Scholar]
- Munns, R. Comparative physiology of salt and water stress. Plant Cell Environ. 2002, 25, 239–250. [Google Scholar] [CrossRef]
- Ueda, M.; Tsutsumi, N.; Fujimoto, M. Salt stress induces internalization of plasma membrane aquaporin into the vacuole in Ara-bidopsis thaliana. Biochem. Biophys. Res. Commun. 2016, 474, 742–746. [Google Scholar] [CrossRef] [PubMed]
- Blum, A. Effective use of water (EUW) and not water-use efficiency (WUE) is the target of crop yield improvement under drought stress. Field Crop. Res. 2009, 112, 119–123. [Google Scholar] [CrossRef]
- Hill, A.E.; Shachar-Hill, B.; Shachar-Hill, Y. What are aquaporins for? J. Membr. Biol. 2004, 197, 1–32. [Google Scholar] [CrossRef]
- Hélène, J.; Christophe, M. The role of aquaporins in root water uptake. Ann. Bot. 2002, 90, 301–313. [Google Scholar]
- Maurel, C.; Verdoucq, L.; Luu, D.-T.; Santoni, V. Plant aquaporins: Membrane channels with multiple integrated functions. Ann. Rev. Plant Biol. 2008, 59, 595–624. [Google Scholar] [CrossRef]
- Borgnia, M.; Nielsen, S.; Engel, A.; Agre, P. Cellular and Molecular Biology of the Aquaporin Water Channels. Annu. Rev. Biochem. 1999, 68, 425–458. [Google Scholar] [CrossRef] [PubMed]
- Boursiac, Y.; Chen, S.; Luu, D.-T.; Sorieul, M.; Dries, N.V.D.; Maurel, C. Early Effects of Salinity on Water Transport in Arabidopsis Roots. Molecular and Cellular Features of Aquaporin Expression. Plant Physiol. 2005, 139, 790–805. [Google Scholar] [CrossRef]
- Manu, V.; Mishtu, M.; Ramasubbu, S. Cooperativity in Plant Plasma Membrane Intrinsic Proteins (PIPs): Mechanism of Increased Water Transport in Maize PIP1 Channels in Hetero-tetramers. Sci. Rep. 2018, 8, 1–17. [Google Scholar]
- Verdoucq, L.; Maurel, C. Plant Aquaporins. Adv. Bot. Res. 2018, 87, 25–56. [Google Scholar] [CrossRef]
- Zhu Zhu, H.-L.Z. Plant aquaporins. Chin. J. Coll Biol. 2005, 27, 539–544. [Google Scholar]
- Tyerman, S.D.; Niemietz, C.M.; Bramley, H.H. Plant aquaporins: Multifunctional water and solute channels with expanding roles. Plant Cell Environ. 2010, 25, 173–194. [Google Scholar] [CrossRef] [PubMed]
- Postaire, O.; Tournaire-Roux, C.; Grondin, A.; Boursiac, Y.; Morillon, R.; Schäffner, A.R.; Maurel, C. A PIP1 Aquaporin Contributes to Hydrostatic Pressure-Induced Water Transport in Both the Root and Rosette of Arabidopsis. Plant Physiol. 2009, 152, 1418–1430. [Google Scholar] [CrossRef]
- Secchi, F.; Zwieniecki, M.A. The physiological response of Populus tremula x alba leaves to the down-regulation of PIP1 aquaporin gene expression under no water stress. Front. Plant Sci. 2013, 4, 507. [Google Scholar] [CrossRef]
- Hu, W.; Yuan, Q.; Wang, Y.; Cai, R.; Deng, X.; Wang, J.; Zhou, S.; Chen, M.; Chen, L.; Huang, C.; et al. Overexpression of a Wheat Aquaporin Gene, TaAQP8, Enhances Salt Stress Tolerance in Transgenic Tobacco. Plant Cell Physiol. 2012, 53, 2127–2141. [Google Scholar] [CrossRef]
- Liu, C.; Fukumoto, T.; Matsumoto, T.; Gena, P.; Frascaria, D.; Kaneko, T.; Katsuhara, M.; Zhong, S.; Sun, X.; Zhu, Y.; et al. Aquaporin OsPIP1:1 promotes rice salt resistance and seed germination. Plant Physiol. Biochem. 2013, 63, 151–158. [Google Scholar] [CrossRef] [PubMed]
- Suga, S.; Maeshima, M. Water Channel Activity of Radish Plasma Membrane Aquaporins Heterologously Expressed in Yeast and Their Modification by Site-Directed Mutagenesis. Plant Cell Physiol. 2004, 45, 823–830. [Google Scholar] [CrossRef] [PubMed]
- Ayadi, M.; Cavez, D.; Miled, N.; Chaumont, F.; Masmoudi, K. Identification and characterization of two plasma membrane aquaporins in durum wheat (Triticum turgidum L. subsp. durum) and their role in abiotic stress tolerance. Plant Physiol. Biochem. 2011, 49, 1029–1039. [Google Scholar] [CrossRef]
- Yaneff, A.; Vitali, V.; Amodeo, G. PIP1 aquaporins: Intrinsic water channels or PIP2 aquaporin modulators? FEBS Lett. 2015, 589, 3508–3515. [Google Scholar] [CrossRef]
- Fournier-Level, A.; Korte, A.; Cooper, M.D.; Nordborg, M.; Schmitt, J.; Wilczek, A.M. A map of local adaptation in Arabidopsis tha-liana. Science 2011, 334, 86–89. [Google Scholar] [CrossRef] [PubMed]
- Zelazny, E.; Borst, J.W.; Muylaert, M.; Batoko, H.; Hemminga, M.A.; Chaumont, F. FRET imaging in living maize cells reveals that plasma membrane aquaporins interact to regulate their subcellular localization. Proc. Natl. Acad. Sci. USA 2007, 104, 12359–12364. [Google Scholar] [CrossRef]
- Otto, B.; Uehlein, N.; Sdorra, S.; Fischer, M.; Ayaz, M.; Belastegui-Macadam, X.; Heckwolf, M.; Lachnit, M.; Pede, N.; Priem, N.; et al. Aquaporin Tetramer Composition Modifies the Function of Tobacco Aquaporins. J. Biol. Chem. 2010, 285, 31253–31260. [Google Scholar] [CrossRef] [PubMed]
- Jozefkowicz, C.; Sigaut, L.; Scochera, F.; Soto, G.; Ayub, N.; Pietrasanta, L.I.; Amodeo, G.; Flecha, F.L.G.; Alleva, K. PIP Water Transport and Its pH Dependence Are Regulated by Tetramer Stoichiometry. Biophys. J. 2016, 110, 1312–1321. [Google Scholar] [CrossRef]
- Yaneff, A.; Sigaut, L.; Marquez, M.; Alleva, K.; Pietrasanta, L.I.; Amodeo, G. Heteromerization of PIP aquaporins affects their intrinsic permeability. Proc. Natl. Acad. Sci. USA 2013, 111, 231–236. [Google Scholar] [CrossRef] [PubMed]
- Maurel, C. Plant aquaporins: Novel functions and regulation properties. FEBS Lett. 2007, 581, 2227–2236. [Google Scholar] [CrossRef]
- Gomes, D.; Agasse, A.; Thiébaud, P.; Delrot, S.; Gerós, H.; Chaumont, F. Aquaporins are multifunctional water and solute transporters highly divergent in living organisms. Biochim. Biophys. Acta Biomembr. 2009, 1788, 1213–1228. [Google Scholar] [CrossRef] [PubMed]
- Lian, H.-L.; Yu, X.; Ye, Q.; Ding, X.-S.; Kitagawa, Y.; Kwak, S.-S.; Su, W.-A.; Tang, Z.-C. The Role of Aquaporin RWC3 in Drought Avoidance in Rice. Plant Cell Physiol. 2004, 45, 481–489. [Google Scholar] [CrossRef] [PubMed]
- Vera-Estrella, R.; Barkla, B.J.; Bohnert, H.J.; Pantoja, O. Novel Regulation of Aquaporins during Osmotic Stress. Plant Physiol. 2004, 135, 2318–2329. [Google Scholar] [CrossRef]
- Ji, Y.J.; Dong, G.K.; Kim, Y.O.; Jin, S.K.; Kang, H. An expression analysis of a gene family encoding plasma membrane aqua-porins in response to abiotic stresses in Arabidopsis thaliana. Plant Mol. Biol. 2004, 54, 713–725. [Google Scholar]
- Fricke, W.; Akhiyarova, G.; Wei, W.; Alexandersson, E.; Miller, A.; Kjellbom, P.O.; Richardson, A.; Wojciechowski, T.; Schreiber, L.; Veselov, D.; et al. The short-term growth response to salt of the developing barley leaf. J. Exp. Bot. 2006, 57, 1079–1095. [Google Scholar] [CrossRef]
- Horie, T.; Kaneko, T.; Sugimoto, G.; Sasano, S.; Panda, S.K.; Shibasaka, M.; Katsuhara, M. Mechanisms of Water Transport Mediated by PIP Aquaporins and Their Regulation Via Phosphorylation Events Under Salinity Stress in Barley Roots. Plant Cell Physiol. 2011, 52, 663–675. [Google Scholar] [CrossRef] [PubMed]
- Chaumont, F.; Moshelion, M.; Daniels, M.J. Regulation of plant aquaporin activity. Biol. Cell 2005, 97, 749–764. [Google Scholar] [CrossRef]
- Bienert, G.P.; Schjoerring, J.K.; Jahn, T.P. Membrane transport of hydrogen peroxide. Biochim. Biophys. Acta 2006, 1758, 994–1003. [Google Scholar] [CrossRef]
- Alexandersson, E.; Fraysse, L.; Sjövall-Larsen, S.; Gustavsson, S.; Fellert, M.; Karlsson, M.; Johanson, U.; Kjellbom, P. Whole Gene Family Expression and Drought Stress Regulation of Aquaporins. Plant Mol. Biol. 2005, 59, 469–484. [Google Scholar] [CrossRef]
- Mahdieh, M.; Mostajeran, A.; Horie, T.; Katsuhara, M. Drought stress alters water relations and expression of PIP-type aq-uaporin genes in Nicotiana tabacum plants. Plant Cell Physiol. 2008, 49, 801–813. [Google Scholar] [CrossRef]
- Cui, X.-H.; Hao, F.-S.; Chen, H.; Chen, J.; Wang, X.-C. Expression of the Vicia faba VfPIP1 gene in Arabidopsis thaliana plants improves their drought resistance. J. Plant Res. 2008, 121, 207–214. [Google Scholar] [CrossRef]
- Zhou, L.; Wang, C.; Liu, R.; Han, Q.; Vandeleur, R.K.; Du, J.; Tyerman, S.; Shou, H. Constitutive overexpression of soybean plasma membrane intrinsic protein GmPIP1;6 confers salt tolerance. BMC Plant Biol. 2014, 14, 181. [Google Scholar] [CrossRef] [PubMed]
- Guo, L.; Wang, Z.Y.; Lin, H.; Cui, W.E.; Chen, J.; Liu, M.; Chen, Z.L.; Qu, L.J.; Gu, H. Expression and functional analysis of the rice plasma-membrane intrinsic protein gene family. Cell Res. 2006, 16, 277–286. [Google Scholar] [CrossRef]
- Peng, Y.H.; Arora, R.; Li, G.W.; Wang, X.; Fessehaie, A. Rhododendron catawbiense plasma membrane intrinsic proteins are aquaporins, and their overexpression compromises constitutive freezing tolerance and cold acclimation ability of transgenic Arabidopsis plants. Plant Cell Environ. 2008, 31, 1275–1289. [Google Scholar] [CrossRef]
- Zhou, S.; Hu, W.; Deng, X.; Ma, Z.; Chen, L.; Huang, C.; Wang, C.; Wang, J.; He, Y.; Yang, G.; et al. Overexpression of the Wheat Aquaporin Gene, TaAQP7, Enhances Drought Tolerance in Transgenic Tobacco. PLoS ONE 2012, 7, e52439. [Google Scholar] [CrossRef] [PubMed]
- Hanba, Y.T.; Shibasaka, M.; Hayashi, Y.; Hayakawa, T.; Kasamo, K.; Terashima, I.; Katsuhara, M. Overexpression of the Barley Aquaporin HvPIP2;1 Increases Internal CO2 Conductance and CO2 Assimilation in the Leaves of Transgenic Rice Plants. Plant Cell Physiol. 2004, 45, 521–529. [Google Scholar] [CrossRef] [PubMed]
- Geng, H.; Shi, L.; Li, W.; Zhang, B.; Chu, C.; Li, H.; Zhang, G. Gene expression of jojoba (Simmondsia chinensis) leaves exposed to drying. Environ. Exp. Bot. 2008, 63, 137–146. [Google Scholar] [CrossRef]
- Zhang, L.; Xiao, S.; Li, W.; Feng, W.; Li, J.; Wu, Z.; Gao, X.; Liu, F.; Shao, M. Overexpression of a Harpin-encoding gene hrf1 in rice enhances drought tolerance. J. Exp. Bot. 2011, 62, 4229–4238. [Google Scholar] [CrossRef]
- Schröder, F.; Lisso, J.; Müssig, C. Expression pattern and putative function of EXL1 and homologous genes in Ara-bidopsis. Plant Signal. Behav. 2012, 7, 22–27. [Google Scholar] [CrossRef] [PubMed]
- Schröder, F.; Lisso, J.; Müssig, C. EXORDIUM-LIKE1 Promotes Growth during Low Carbon Availability in Arabidopsis. Plant Physiol. 2011, 156, 1620–1630. [Google Scholar] [CrossRef] [PubMed]
- Renault, H.; Amrani, A.E.; Berger, A.; Mouille, G.; Soubigou-Taconnat, L.; Boucherau, A.; Deleu, C. γ-Aminobutyric acid transaminase deficiency impairs central carbon metabolism and leads to cell wall defects during salt stress in Arabidopsis roots. Plant Cell Environ. 2013, 36, 1009–1018. [Google Scholar] [CrossRef] [PubMed]
- Hu, B.; Liu, B.; Liu, L.; Liu, C.; Xu, L.; Ruan, Y. Epigenetic control of Pollen Ole e 1 allergen and extensin family gene expression in Arabidopsis thaliana. Acta Physiol. Plant. 2014, 36, 2203–2209. [Google Scholar] [CrossRef]
- Li, F.; Wu, X.; Lam, P.; Bird, D.; Zheng, H.; Samuels, L.; Jetter, R.; Kunst, L. Identification of the wax ester synthase/acyl-coenzyme A: Diacylglycerol acyltransferase WSD1 required for stem wax ester biosynthesis in Arabidopsis. Plant Physiol. 2008, 148, 97–107. [Google Scholar] [CrossRef]
- Patwari, P.; Salewski, V.; Gutbrod, K.; Kreszies, T.; Dressen-Scholz, B.; Peisker, H.; Steiner, U.; Meyer, A.J.; Schreiber, L.; Dörmann, P. Surface wax esters contribute to drought tolerance in Arabidopsis. Plant J. 2019, 98, 727–744. [Google Scholar] [CrossRef] [PubMed]
- Park, C.S.; Go, Y.S.; Suh, M.C. Cuticular wax biosynthesis is positively regulated by WRINKLED4, an AP2/ERF-type transcription factor, in Arabidopsis stems. Plant J. 2016, 88, 257–270. [Google Scholar] [CrossRef] [PubMed]
- Duan, H.; Huang, M.-Y.; Palacio, K.; Schuler, M.A. Variations in CYP74B2 (Hydroperoxide Lyase) Gene Expression Differentially Affect Hexenal Signaling in the Columbia and Landsberg erecta Ecotypes of Arabidopsis1[w]. Plant Physiol. 2005, 139, 1529–1544. [Google Scholar] [CrossRef]
- Kushiro, T.; Okamoto, M.; Nakabayashi, K.; Yamagishi, K.; Kitamura, S.; Asami, T.; Hirai, N.; Koshiba, T.; Kamiya, J.; Nambara, E. The Arabidopsis cytochrome P450 CYP707A encodes ABA 8′-hydroxylases: Key enzymes in ABA catabolism. EMBO J. 2014, 23, 1647–1656. [Google Scholar] [CrossRef]
- Nakashima, K.; Yamaguchi-Shinozaki, K. Promoters and Transcription Factors in Abiotic Stress-Responsive Gene Expression. In Abiotic Stress Adaptation in Plants; Springer: Dordrecht, Germany, 2009; pp. 199–216. [Google Scholar]
- Pareek, A.; Sopory, S.K.; Bohnert, H.J. Abiotic Stress Adaptation in Plants. Photosynthetica. 2010, 48, 474. [Google Scholar]
- Jensen, M.K.; Kjaersgaard, T.; Petersen, K.; Skriver, K. NAC genes: Time-specific regulators of hormonal signaling in Arabidopsis. Plant Signal. Behav. 2010, 5, 907–910. [Google Scholar] [CrossRef]
- Ferro, M.; Brugière, S.; Salvi, D.; Seigneurin-Berny, D.; Court, M.; Moyet, L.; Ramus, C.; Miras, S.; Mellal, M.; Le Gall, S.; et al. AT_CHLORO, a Comprehensive Chloroplast Proteome Database with Subplastidial Localization and Curated Information on Envelope Proteins. Mol. Cell. Proteom. 2010, 9, 1063–1084. [Google Scholar] [CrossRef]
- Simm, S.; Papasotiriou, D.G.; Ibrahim, M.; Leisegang, M.S.; Müller, B.; Schorge, T.; Karas, M.; Mirus, O.; Sommer, M.S.; Schleiff, E. Defining the Core Proteome of the Chloroplast Envelope Membranes. Front. Plant Sci. 2013, 4, 11. [Google Scholar] [CrossRef]
- Zybailov, B.; Rutschow, H.; Friso, G.; Rudella, A.; Emanuelsson, O.; Sun, Q.; van Wijk, K.J. Sorting signals, N-terminal modifications and abundance of the chloroplast proteome. PLoS ONE 2008, 3, e1994. [Google Scholar] [CrossRef] [PubMed]
- Beebo, A.; Mathai, J.C.; Schoefs, B.; Spetea, C. Assessment of the requirement for aquaporins in the thylakoid membrane of plant chloroplasts to sustain photosynthetic water oxidation. FEBS Lett. 2013, 587, 2083–2089. [Google Scholar] [CrossRef] [PubMed]
- Flexas, J.; Ribas-Carbó, M.; Hanson, D.T.; Bota, J.; Otto, B.; Cifre, J.; McDowell, N.G.; Medrano, H.; Kaldenhoff, R. Tobacco aquaporin NtAQP1 is involved in mesophyll conductance to CO2in vivo. Plant J. 2006, 48, 427–439. [Google Scholar] [CrossRef] [PubMed]
- Shatil-Cohen, A.; Attia, Z.; Moshelion, M. Bundle-sheath cell regulation of xylem-mesophyll water transport via aquaporins under drought stress: A target of xylem-borne ABA? Plant J. 2011, 67, 72–80. [Google Scholar] [CrossRef]
- Siefritz, F.; Tyree, M.T.; Lovisolo, C.; Schubert, A.; Kaldenhoff, R. PIP1 plasma membrane aquaporins in tobacco: From cellular effects to function in plants. Plant Cell 2002, 14, 869–876. [Google Scholar] [CrossRef] [PubMed]
- Uehlein, N.; Otto, B.; Hanson, D.T.; Fischer, M.; McDowell, N.; Kaldenhoff, R. Function of Nicotiana tabacum aquaporins as chlo-roplast gas pores challenges the concept of membrane CO2 permeability. Plant Cell 2008, 20, 648–657. [Google Scholar] [CrossRef]
- Heckwolf, M.; Pater, D.; Hanson, D.T.; Kaldenhoff, R. The Arabidopsis thaliana aquaporin AtPIP1;2 is a physio-logically relevant CO2 transport facilitator. Plant J. 2011, 67, 795–804. [Google Scholar] [CrossRef] [PubMed]
- Soto, G.; Alleva, K.; Mazzella, M.A.; Amodeo, G.; Muschietti, J.P. AtTIP1:3 and AtTIP5:1, the only highly expressed Arabidopsis pollen-specific aquaporins, transport water and urea. FEBS Lett. 2008, 582, 4077–4082. [Google Scholar] [CrossRef]
- Vander Willigen, C.; Postaire, O.; Tournaire-Roux, C.; Boursiac, Y.; Maurel, C. Expression and inhibition of aquaporins in germi-nating Arabidopsis seeds. Plant Cell Physiol. 2006, 47, 1241–1250. [Google Scholar] [CrossRef] [PubMed]
- Wudick, M.M.; Luu, D.T.; Tournaire-Roux, C.; Sakamoto, W.; Maurel, C. Vegetative and Sperm Cell-Specific Aquaporins of Arabidopsis Highlight the Vacuolar Equipment of Pollen and Contribute to Plant Reproduction1[W]. Plant Physiol. 2014, 164, 1697–1706. [Google Scholar] [CrossRef] [PubMed]
- Bots, M.; Vergeldt, F.; Wolters-Arts, M.; Weterings, K.; Van As, H.; Mariani, C. Aquaporins of the PIP2 Class Are Required for Efficient Anther Dehiscence in Tobacco. Plant Physiol. 2005, 137, 1049–1056. [Google Scholar] [CrossRef] [PubMed]


Publisher’s Note: MDPI stays neutral with regard to jurisdictional claims in published maps and institutional affiliations. |
© 2021 by the authors. Licensee MDPI, Basel, Switzerland. This article is an open access article distributed under the terms and conditions of the Creative Commons Attribution (CC BY) license (http://creativecommons.org/licenses/by/4.0/).