Article

The Landscape of the Genomic Distribution and the Expression of the F-Box Genes Unveil Genome Plasticity in Hexaploid Wheat during Grain Development and in Response to Heat and Drought Stress

UMR 1095 Génétique, Diversité et Ecophysiologie des Céréales, Université Clermont Auvergne, INRAE, 63000 Clermont-Ferrand, France
*
Author to whom correspondence should be addressed.
Int. J. Mol. Sci. 2021, 22(6), 3111; https://doi.org/10.3390/ijms22063111
Submission received: 5 February 2021 / Revised: 1 March 2021 / Accepted: 15 March 2021 / Published: 18 March 2021
(This article belongs to the Section Molecular Biology)

Abstract

:
FBX proteins are subunits of the SCF complex (Skp1–cullin–FBX) belonging to the E3 ligase family, which is involved in the ubiquitin–proteasome 26S (UPS) pathway responsible for the post-translational protein turnover. By targeting, in a selective manner, key regulatory proteins for ubiquitination and 26S proteasome degradation, FBX proteins play a major role in plant responses to diverse developmental and stress conditions. Although studies on the genomic organization of the FBX gene family in various species have been reported, knowledge related to bread wheat (Triticum aestivum) is scarce and needs to be broadened. Using the latest assembly of the wheat genome, we identified 3670 TaFBX genes distributed non-homogeneously within the three subgenomes (A, B and D) and between the 21 chromosomes, establishing it as one of the richest gene families among plant species. Based on the presence of the five different chromosomal regions previously identified, the present study focused on the genomic distribution of the TaFBX family and the identification of differentially expressed genes during the embryogenesis stages and in response to heat and drought stress. Most of the time, when comparing the expected number of genes (taking into account the formal gene distribution on the entire wheat genome), the TaFBX family harbors a different pattern at the various stratum of observation (subgenome, chromosome, chromosomal regions). We report here that the local gene expansion of the TaFBX family must be the consequence of multiple and complex events, including tandem and small-scale duplications. Regarding the differentially expressed TaFBX genes, while the majority of the genes are localized in the distal chromosomal regions (R1 and R3), differentially expressed genes are more present in the interstitial regions (R2a and R2b) than expected, which could be an indication of the preservation of major genes in those specific chromosomal regions.

1. Introduction

During their growth, and in response to external stimuli, plants continuously adapt through fundamental cellular activities. In these molecular mechanisms, cellular protein degradation and recycling processes often occur and are regulated by different conserved mechanisms in all eukaryotes [1]. One of these mechanisms is the Ubiquitin–proteasome system (UPS), an ATP-dependent highly regulated system that ensures the degradation of short-lived transcription factors, damaged or misfolded proteins and other regulatory proteins [2,3,4].
The UPS acts through a two-step-process involving the poly-ubiquitination of the targeted protein and the 26S proteasome-mediated degradation. Target protein ubiquitination is mediated by the sequential action of three enzymes, E1 (ubiquitin-activating enzyme), E2 (ubiquitin-conjugating enzyme), and E3 (ubiquitin ligases). Only a few E1 and E2 enzymes have been identified in plants (2 and 6 E1, and 47 and 49 E2, in Arabidopsis and rice, respectively), whereas 1305 and 1332 E3 ligases have been identified in these same species [5]. Among the E3 ligases, some are multimeric complexes, such as the SCF complex, which is composed of four major subunits: Skp1, Cul/Cdc53, Roc1/Rbx1/Hrt1 and an F-box protein (FBX). The FBX protein provides specificity through recognition of the substrate to be ubiquitinated [4]. The high number of FBX subunits in plants may reflect their involvement in numerous, diverse and core molecular processes related to cell cycle development, hormonal or environmental stress responses [6,7,8,9,10,11,12,13,14,15,16,17,18,19,20,21,22,23].
FBX proteins are defined by an F-box domain signature located in the N-terminal region and dedicated to the binding of the protein to an SKP protein [24,25,26]. The FBX also carries a more variable and multi-domain C-terminal region related to its role in recognition of different substrates [27]. The C-terminal motifs have been used to classify FBX proteins into different subfamilies. For example, Jin et al. (2004) identified 69 human FBX classified into three groups, according to their domains (LRRs, WD40 repeats and other domains) [28].
The FBX family has been recorded in a large number of animal and plant species [5]; for example, 9 in humans, 74 in mice, 20 in yeast and 27 FBX in Drosophila [28,29]. In plants, the FBX family is much larger, with 897 predicted genes in Arabidopsis, 971 in rice, 417 in corn, 228 in Physcomitrella patens moss, 285 in chickpea, 592 in cotton and 425 genes in poplar [25,30,31,32]. In contrast to other E3 ligases families, the FBX family has, therefore, undergone a significant expansion in the plant kingdom in comparison with other eukaryotes [33,34]. The emergence and expansion of gene families and subsequent functional divergence among family members have been hypothesized to be the principal driving forces in the adaptation of organisms to different environments [35,36]. In wheat, other gene families, such as transcription factors (for example, MAD-box containing 201 genes [37] or TaNAC family containing 488 genes [38]), have been submitted to gene expansion phenomena through tandem duplication retrotransposition or large-scale duplications of the inter and intra-chromosomal regions. Plants appear to have exploited multiple gene families to adapt to numerous developmental and physiological processes. These families arose, expanded and diversified through whole-genome duplications (polyploidy), which are common in many plant lineages, more restricted segmental duplications, highly specific tandem duplications and transposon-mediated events and even exon shuffling among individual genes [39,40,41,42]. Until very recently, a complete inventory of the FBX genes was missing in bread wheat, one of the most important cereal crop species. In 2020, 1796 TaFBX genes were identified and classified into subfamilies [43]. Meanwhile, using the latest version of the wheat genome, we investigated the same TaFBX gene inventory. Our results lead to a larger number of TaFBX genes (3670), suggesting a plethora of duplication events that could have occurred through the evolutionary history of wheat and that are discussed in this article. In addition, using publicly available RNAseq data [44], the expression profile of the 3670 genes was monitored in two different physiological situations (embryogenesis/grain development and in response to three abiotic stress (heat, drought and a combination of both)); and the differentially expressed genes (DEGs) were localized in five chromosomal regions of the 21 wheat chromosomes. In this paper, our results also show that both the chromosomal distribution of the F-box coding genes and their expression are not evenly distributed, suggesting that the interstitial regions of the chromosomes are more involved than the distal regions.

2. Results

2.1. Structure, Organization and Genomic Distribution of the TaFBX Family in Bread Wheat

2.1.1. Identification of Wheat TaFBX Gene Family

The hidden Markov models (HMM) profile of the Pfam F-box domain and FBX-like domains (PF00646, PF12937 and PF13013, PF15966) were used as queries to identify TaFBX genes in the RefSeq v1.1 version of the annotated wheat genome released by the International Wheat Genome Sequencing Consortium (IWGSC) [45]. This first query led to the identification of 4303 putative TaFBX genes. InterProScan analysis and manual curation of domain organization consistency eliminated 633 sequences and left 3670 full-length, high-confidence (HC) sequences containing an F-box or an F-box-like domain (Table S1). Among them, 3536 (96.3%) TaFBX genes were mapped onto the 21 bread wheat chromosomes; the 134 (3.7%) remaining sequences did not have chromosomal location information. One-third of the TaFBX genomic sequences (1338) are intronless. One-quarter of the TaFBX (967 sequences) possesses one intron. The remaining sequences contained two or more introns, with one sequence (TraesCS5A02G409300) containing up to 21 introns.

2.1.2. Genomic Distribution of TaFBX among Subgenomes, Chromosomes and Chromosomal Regions

The subgenomic distribution of the 105,200 HC genes has already been mapped onto the bread wheat pseudomolecule by the IWGSC [45] and shows that 33.60% are located on the A subgenome (35345 genes), 33.88% are on the B subgenome (35643 genes) and 32.52% on the D subgenome (34212 genes). Based on this global distribution of the wheat genes among A, B and D subgenomes, we calculated the theoretical numbers of FBX genes and investigated the presence of potential bias in the distribution of the 3536 TaFBX genes between these subgenomes. The deficit or enrichment of each subgenome was estimated (observed TaFBX number—theoretical TaFBX number). The A subgenome contained only 1031 TaFBX genes compared with the expected number of 1188, which represents a 4.44% deficit. The B subgenome presents a 3.39% enrichment (1318 observed vs. 1198 expected). The D subgenome appears to contain as many TaFBX genes as expected from the global distribution of the genes in wheat genomes (1187 observed vs. 1150 expected). This result indicates that the TaFBX gene distribution between A, B and D subgenomes in wheat is different from the rest of the genes (chi-squared test, p-value = 1.651 × 10⁻⁴), probably as a consequence of multiple local dynamics of the TaFBX genes.
We then investigated whether the distribution of the TaFBX genes is consistent with the global wheat gene distribution between the 21 chromosomes. The observed distribution of the 3536 anchored TaFBX genes on the 21 wheat chromosomes was compared with the expected one. Some chromosomes presented a deficit, while others showed a higher number of TaFBX genes than expected (Figure 1, Table S2). For example, while the chromosome 2A presented a deficit of 83 TaFBX genes, an excess of 114 genes was observed on the chromosome 6B. Regarding the D subgenome, although the total TaFBX gene number was found to be close to the theoretical expectations, its distribution among chromosomes is not homogeneous. For instance, the chromosome 4D presented a deficit of 48 TaFBX genes.
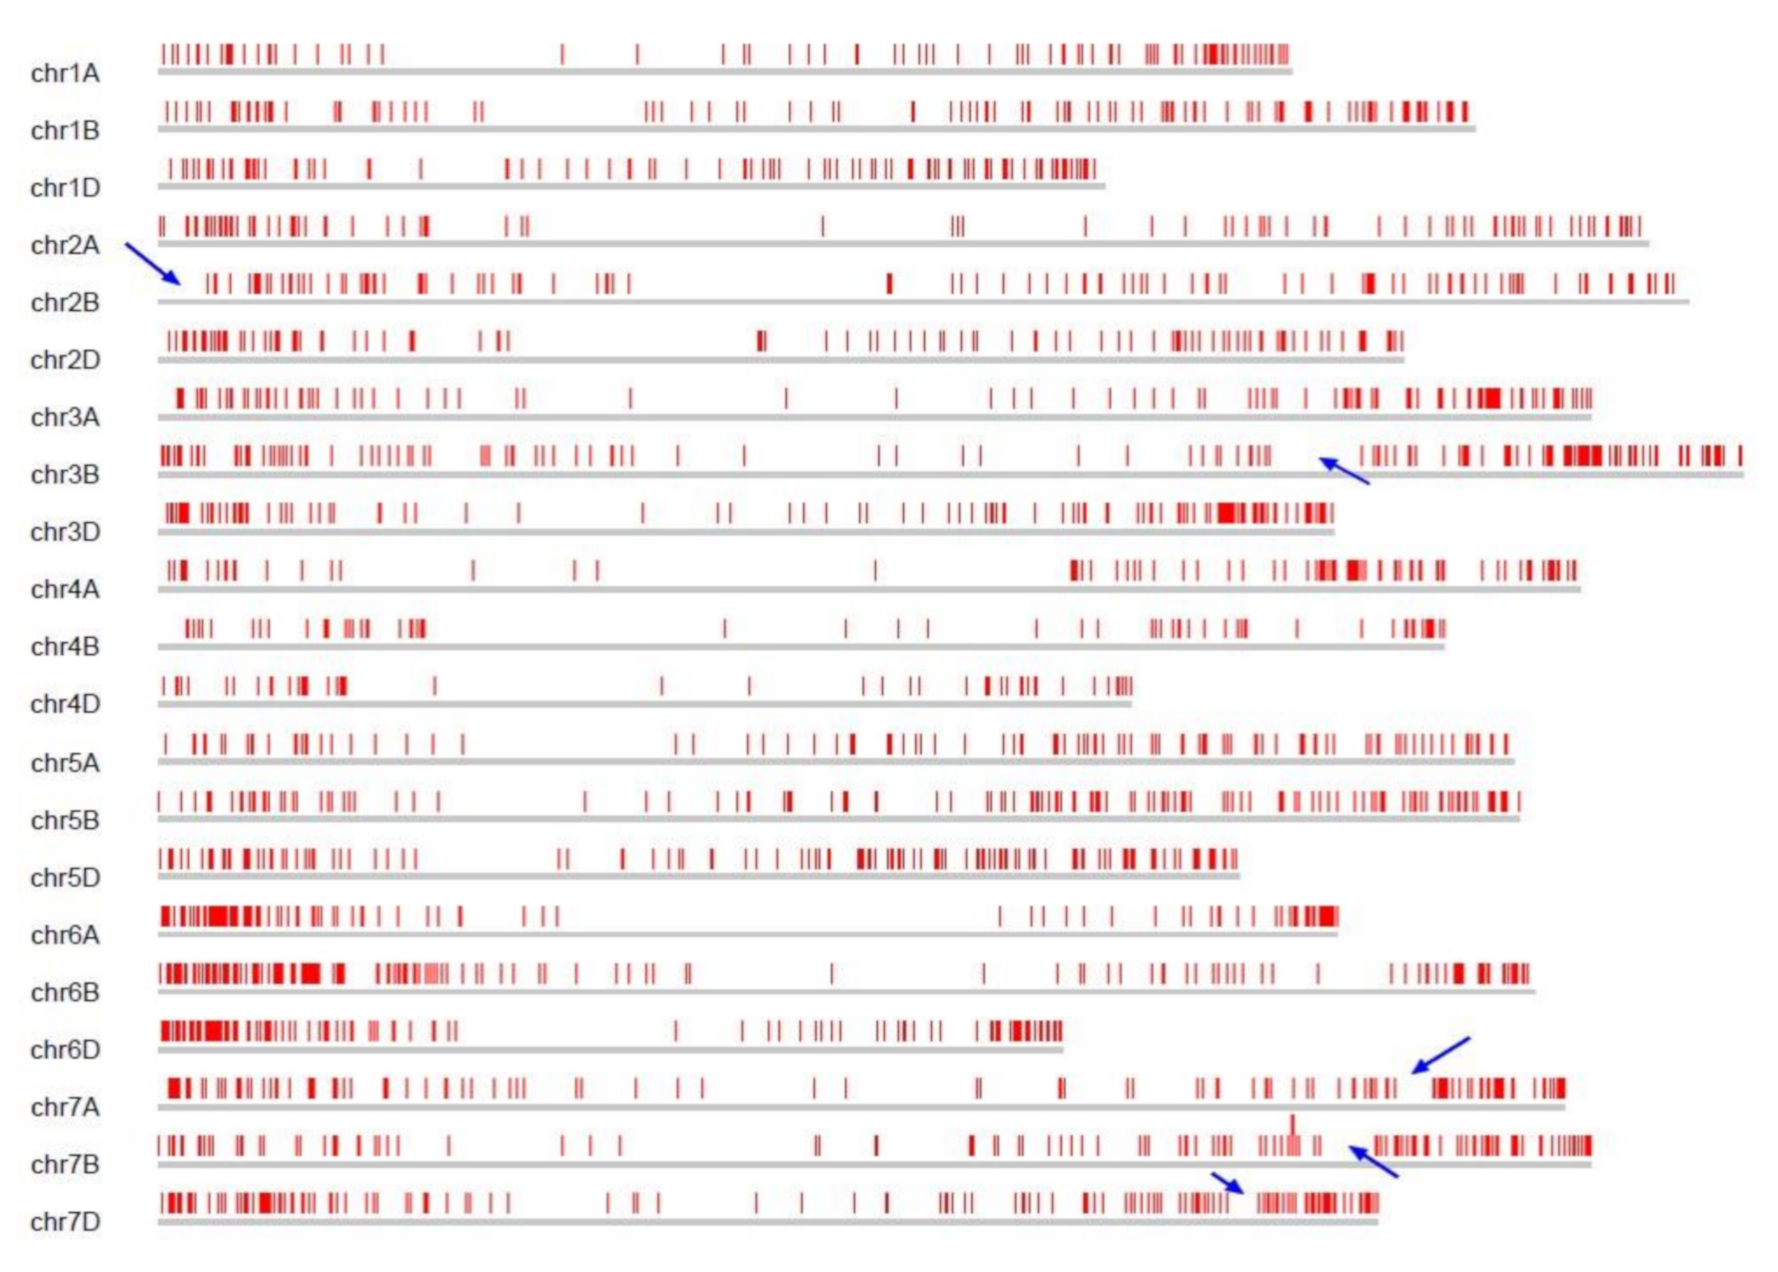
To further investigate the TaFBX distribution on each chromosome, a scaled map was drawn using chromosomal coordinates of TaFBX genes (Figure 2). Their density is clearly uneven along the chromosomes. The central regions are poorly enriched in TaFBX genes, while the peripheral regions present a higher TaFBX density. Moreover, in the peripheral regions, gene clusters could be observed in some chromosomal portions, while other portions seem to be lacking in TaFBX genes. For example, a low TaFBX density is observed on the left terminal part of chromosomes 2B and 3B. Similarly, the right part of the chromosomes 7A, 7B and 7D presented a poorly TaFBX-containing zone, surrounded by two regions enriched in TaFBX genes.
To gain further insight into the unbalanced TaFBX gene distribution, a region-by-region analysis was performed for each chromosome, with a focus on five specific chromosomal regions originally identified by the IWGSC (2018) [45], based on their coding sequence density, transposable element content, recombination frequencies and epigenetics marks. These five regions were labeled “R1”, “R2a”, “C”, “R2b” and “R3”. A comparison of the theoretical number of TaFBX genes and the observed ones was performed for each of these regions for the three wheat subgenomes (Figure S1). The deficit or enrichment of each region was estimated. On the whole-genome scale, an enrichment of TaFBX genes appeared to be localized mainly in the R3 region, followed by the R1 region. On the contrary, the C and R2b regions showed a deficit whatever the subgenome. The results are contrasted for the R2a region; it was found enriched in TaFBX genes for the B subgenome but in deficit for the A and D subgenomes (Figure 3).

2.1.3. Structuration of the TaFBX Genes into Subfamilies

Different subclassifications of the FBX family were proposed by Xu et al. (2009) (on Arabidopsis, rice and poplar [46]) and Jain et al. (2007) (on rice [41]) based on the large panel of supplemental domains carried by FBX genes. Using the same approach, a total of 17 subfamilies was established in the bread wheat TaFBX family, gathering gene encoding proteins with the same or similar domain organization (Table 1).
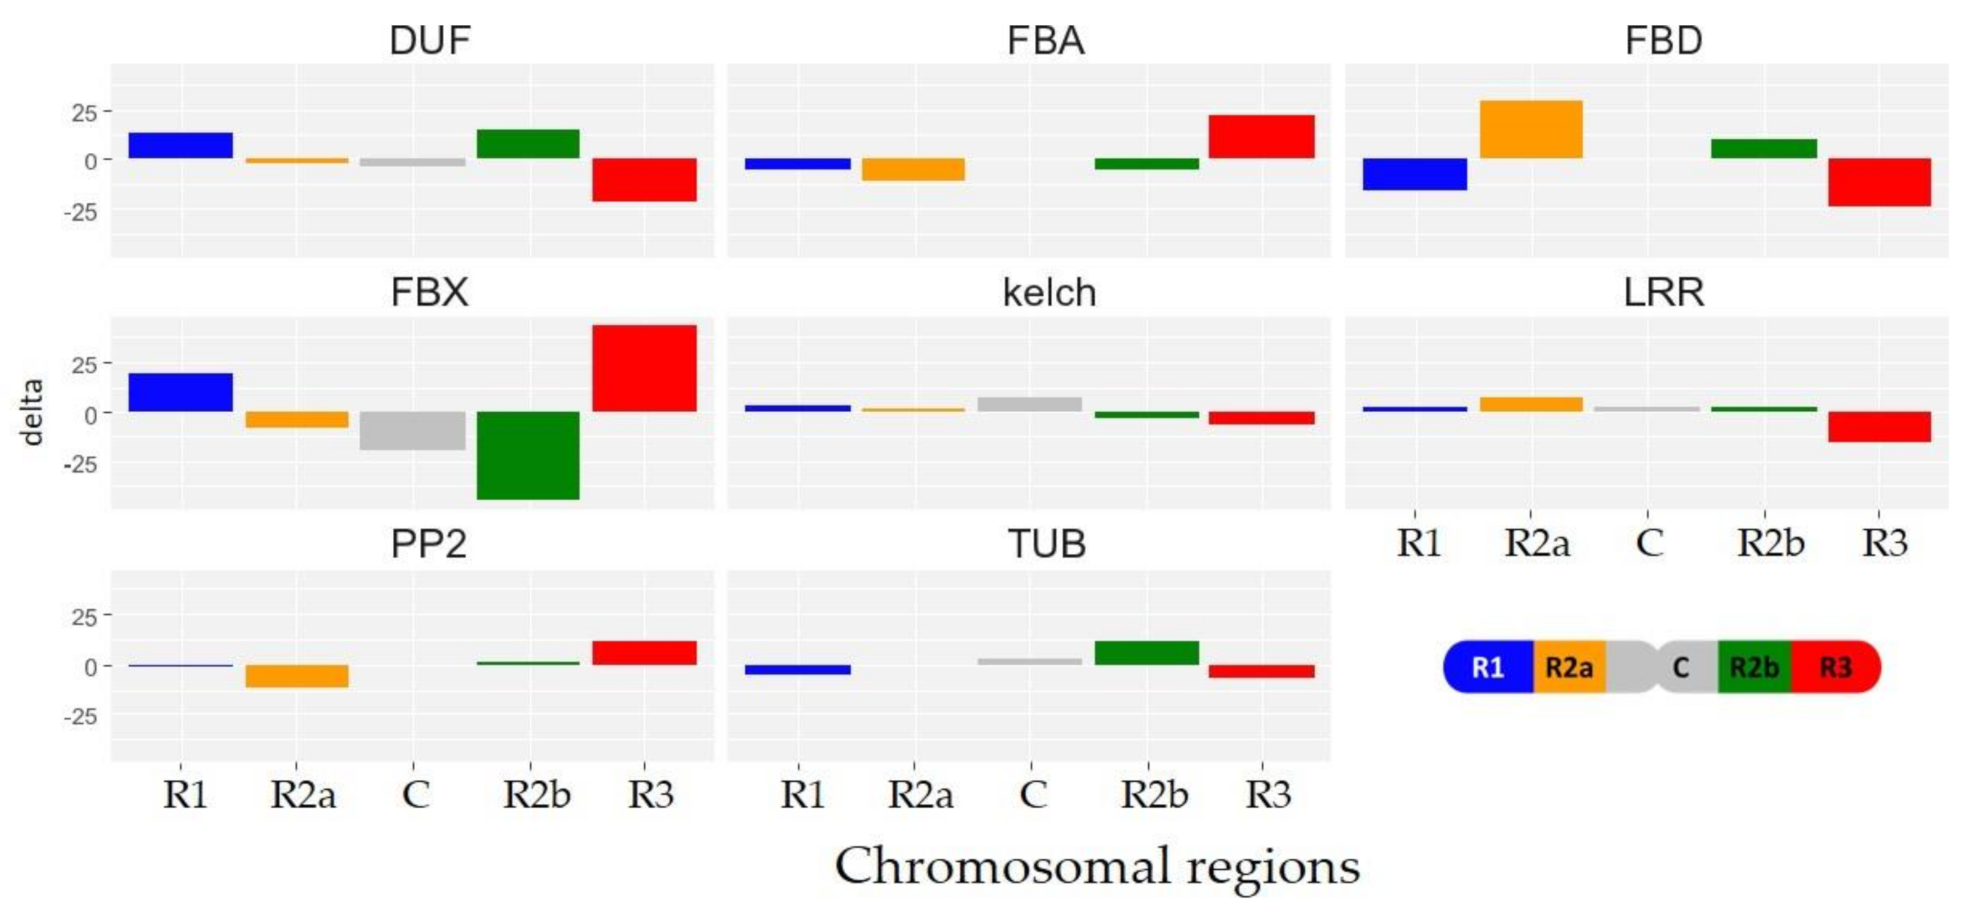
Among the five chromosomal regions, the repartition of TaFBX genes within the eight larger subfamilies (FBX: 2475 members, FBD: 359, FBA: 143, DUF: 234, Kelch: 203, PP2: 67, LRR: 53, and TUB: 31; regrouping 3565 TaFBX genes) was investigated. For each subfamily, the gene excess or deficit was evaluated in the five chromosomal regions (Figure 4 and Table S1). A selective enrichment in TaFBX subfamilies was observed depending on the region. The R1 region is enriched in the DUF subfamily, whereas the R2a region contains an excess of genes belonging to the FBD and LRR subfamilies. The C region presents an enrichment in the TUB and Kelch subfamilies, whereas the R2b region is enriched in the TUB, DUF and LRR subfamilies, and the R3 region in the FBX, FBA and PP2 subfamilies. Collectively, these observations suggest that TaFBX genes may have propagated locally, giving rise to clusters of genes belonging to the same subfamily.

2.1.4. Lineage-Specific Expansion of Wheat TaFBX Genes

Because the absolute number of TaFBX genes in wheat appeared significantly higher than in other plant species, we aimed at understanding the orthological relationships between wheat and other plant species. To avoid bias when searching for orthologs, we used OrthoFinder and the proteomes of 18 sequenced plant species, including monocots (as rice or Brachypodium distachyon), eudicots (as Arabidopsis or sunflower), and “basal” plants (as Physcomitrella patens or Marchantia porphyria). After filtration, 40,304 orthogroups were identified, among which 557 contained at least one wheat TaFBX gene (Table S3). Among the 3670 TaFBX genes, 2492 presented an ortholog in at least one other plant species, representing 313 orthogroups. The remaining 1178 TaFBX were found in 245 wheat-specific orthogroups. These TaFBX-with-no-ortholog genes probably constitute the hallmark of the large expansion of this family in wheat, and their chromosomal distribution is unequal (Figure 5). Whatever the wheat subgenome (A, B, or D), the distal regions R3 and R1 contained a large number of TaFBX-with-no-ortholog genes, whereas the C and R2b regions contained the least. The R2a region presented a low number of TaFBX-with-no-ortholog genes except for chromosome 6, which carried 45 genes. Considering the general TaFBX density across the wheat genome, the R1 and R3 regions are the strongest contributors to the set of TaFBX-with-no-ortholog genes. This result may suggest that novelty within this family may occur more often in the distal regions of wheat chromosomes than in their central and pericentromeric regions.

2.1.5. Genomic Structuration and Duplication Fates of TaFBX Genes

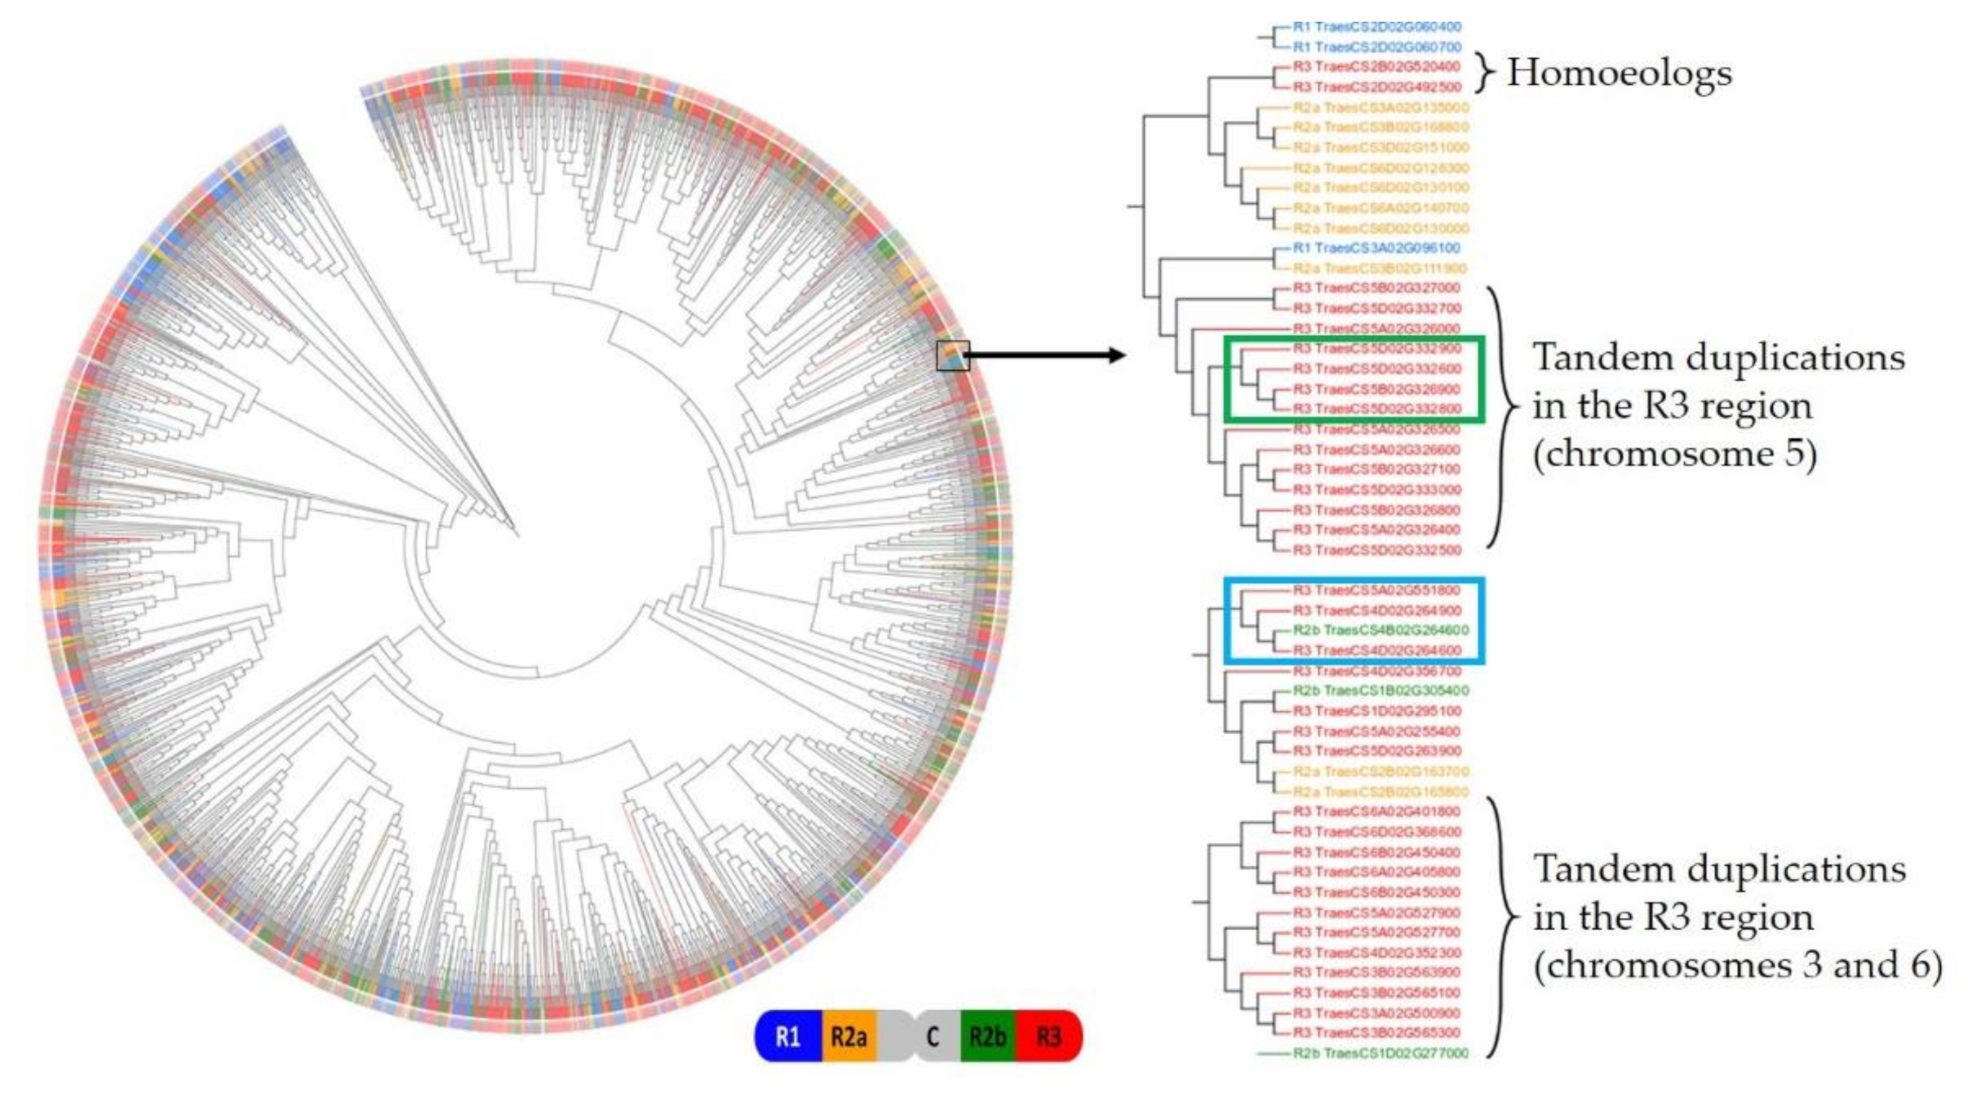
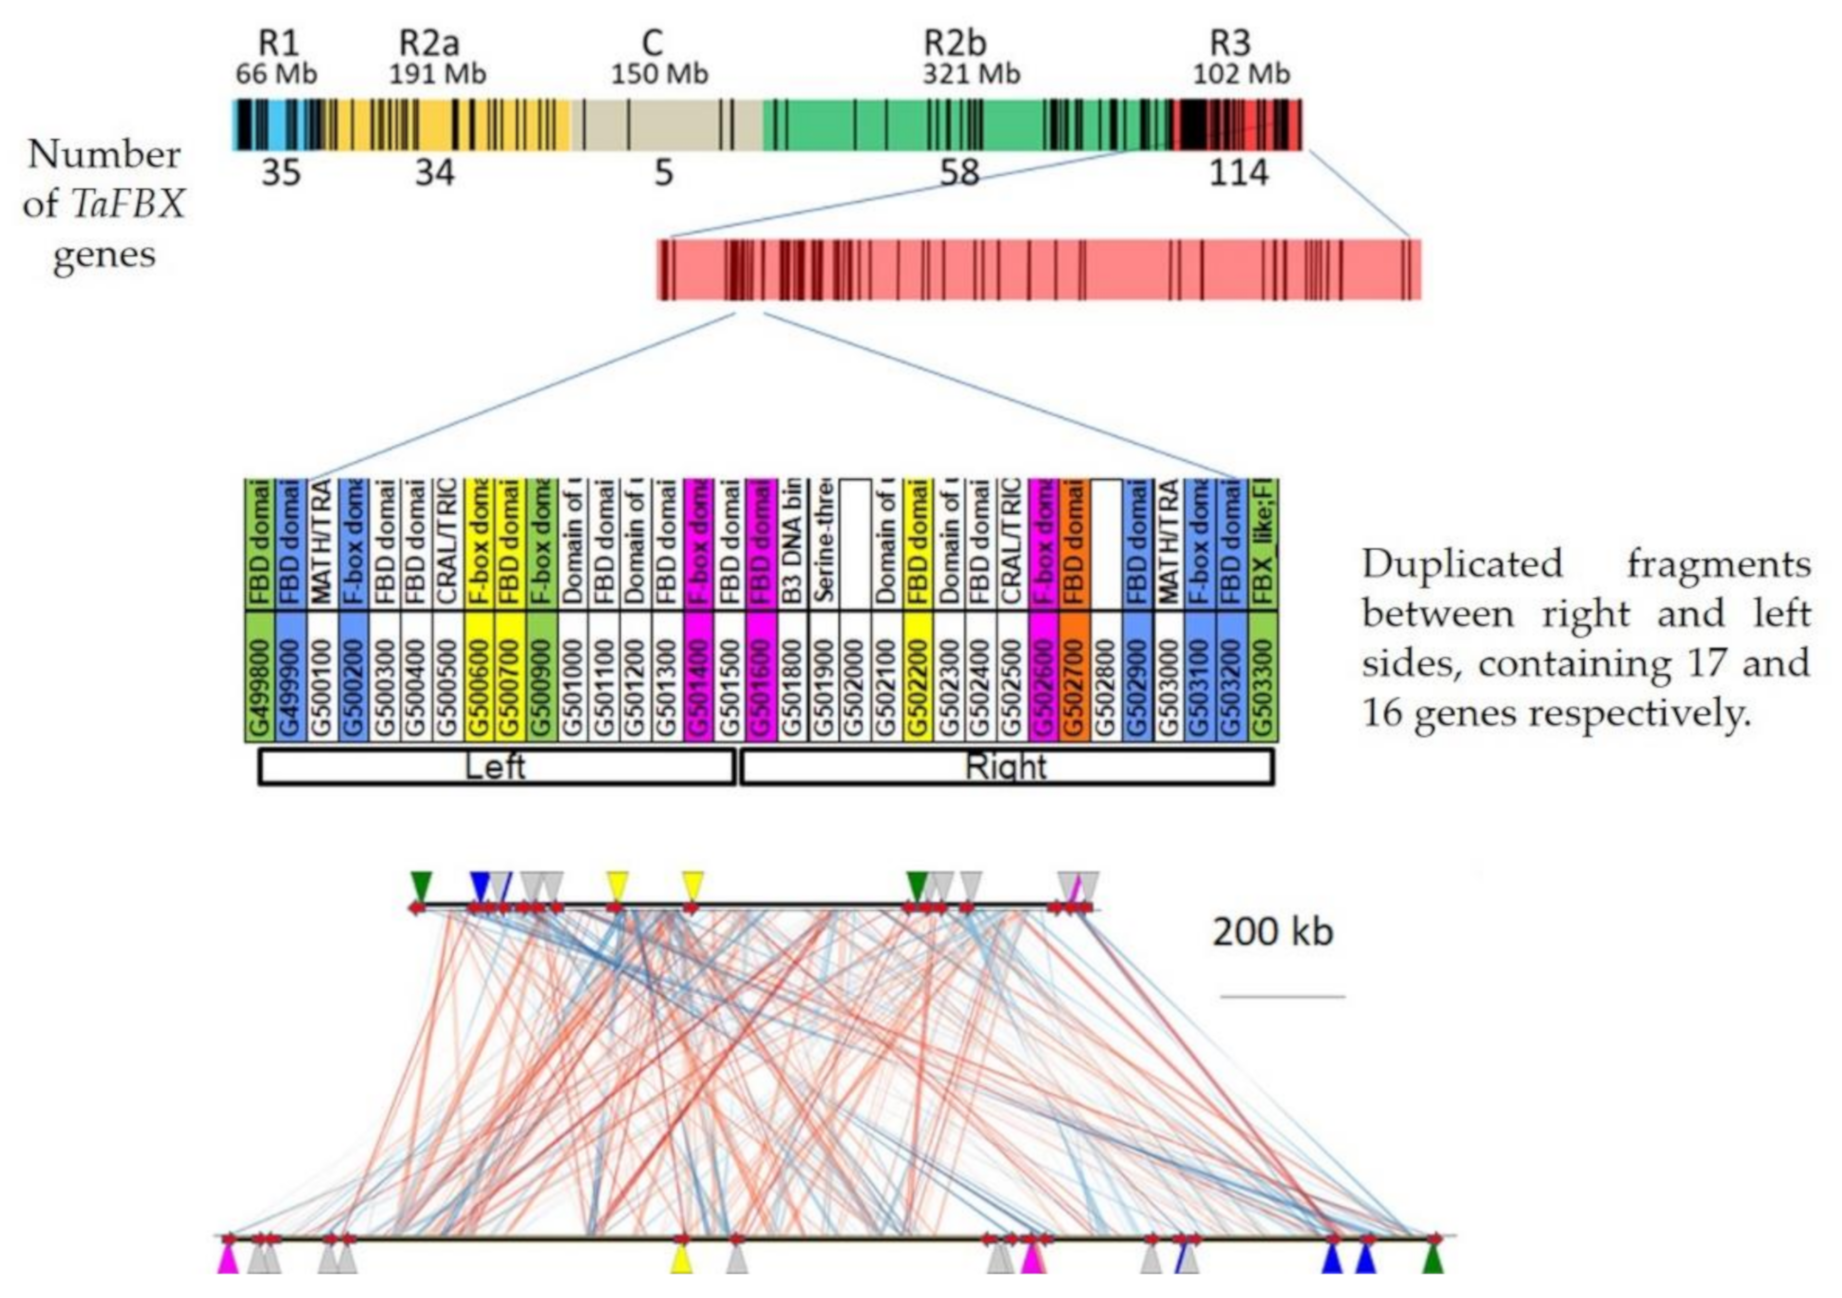
To decipher the TaFBX gene family expansion events, we studied the relationship between TaFBX sequences. First, a phylogenetic tree was generated based on the alignment performed with all the mapped TaFBX proteins (3536 sequences) (Figure 6). Numerous clades are mainly composed of sequences coming from the same homoeologous group and from the same chromosomal region, as shown on the right of Figure 6. However, more complex situations were encountered. Indeed, to estimate the complex implication of different mechanisms in the local expansion of the TaFBX gene family, a chromosomal region rich in TaFBX was selected, corresponding to the R3 region of chromosome 3B that contained one of the highest excesses in TaFBX genes (114 TaFBX genes, whereas only 54 were theoretically expected). Along this region, we focused our analysis on a 3.06 Mb subregion containing 33 genes, including 15 TaFBX, which were found to be structured in different ortholog groups using OrthoFinder. Theoretically, in a hexaploid genome, such as in wheat, if no gene loss or gain events occur, a cardinality of 1:1:1 (one homoeolog per genome) should be observed. Using the list of homoeologous genes published by the IWGSC [45], we sought to find out whether the 33 genes anchored in this region all have a homoeolog on the A and D genomes. We found only 3 genes in homoeologous groups with a 1:1:1 cardinality, whereas 7 genes were found in groups with a cardinality of 0:1:0. Interestingly, 13 genes out of the 33 anchored in this region belonged to homoeologous groups with a cardinality of N:02:N (N = 0 or 1), which strongly suggests that there are 2 copies of each of these genes on the B genome. Collectively, it suggests that this region has undergone specific events, notably duplications, which would not have affected their ortholog counterparts on the A and D genomes. By studying the localization and orientation of the TaFBX genes on the pseudomolecule, this subregion was split into two parts (left and right sides, containing seven and eight TaFBX genes, respectively) (Figure 7). We hypothesized that they came from a local duplication event, probably, including direct and reverse duplications. To assess this hypothesis, the chromosomal sequences from both the left and the right sides were collected and compared using the YASS (blast-like) algorithm. Each fragment presenting an identity of more than 80% on at least 2 Kb was collected, totaling 386 duplicated fragments. The longest fragment reached 21.1 Kb (92% identity). Among the 386 fragments, 209 are duplicated in direct orientation and 117 in reverse orientation. Cumulatively, they represent 876 Kb of direct-duplicated fragments and 805 Kb of reverse-duplicated fragments.
To further investigations, the whole set of 33 genes (TaFBX and non-TaFBX) located on the 3 Mb subregion were also studied. As expected, 14 genes were found to contain the F-box domain (IPR001810) in the N-terminal and the FBD domain (IPR006566) in the C-terminal of their protein sequences. Six other proteins contained only the FBD domain, and one protein contained only the F-box domain. The 12 remaining proteins contained various domains, like MATH/TRAF domain (IPR002083) for two of them or Domain of Unknown Function DUF1618 (IPR011676) for four of them.
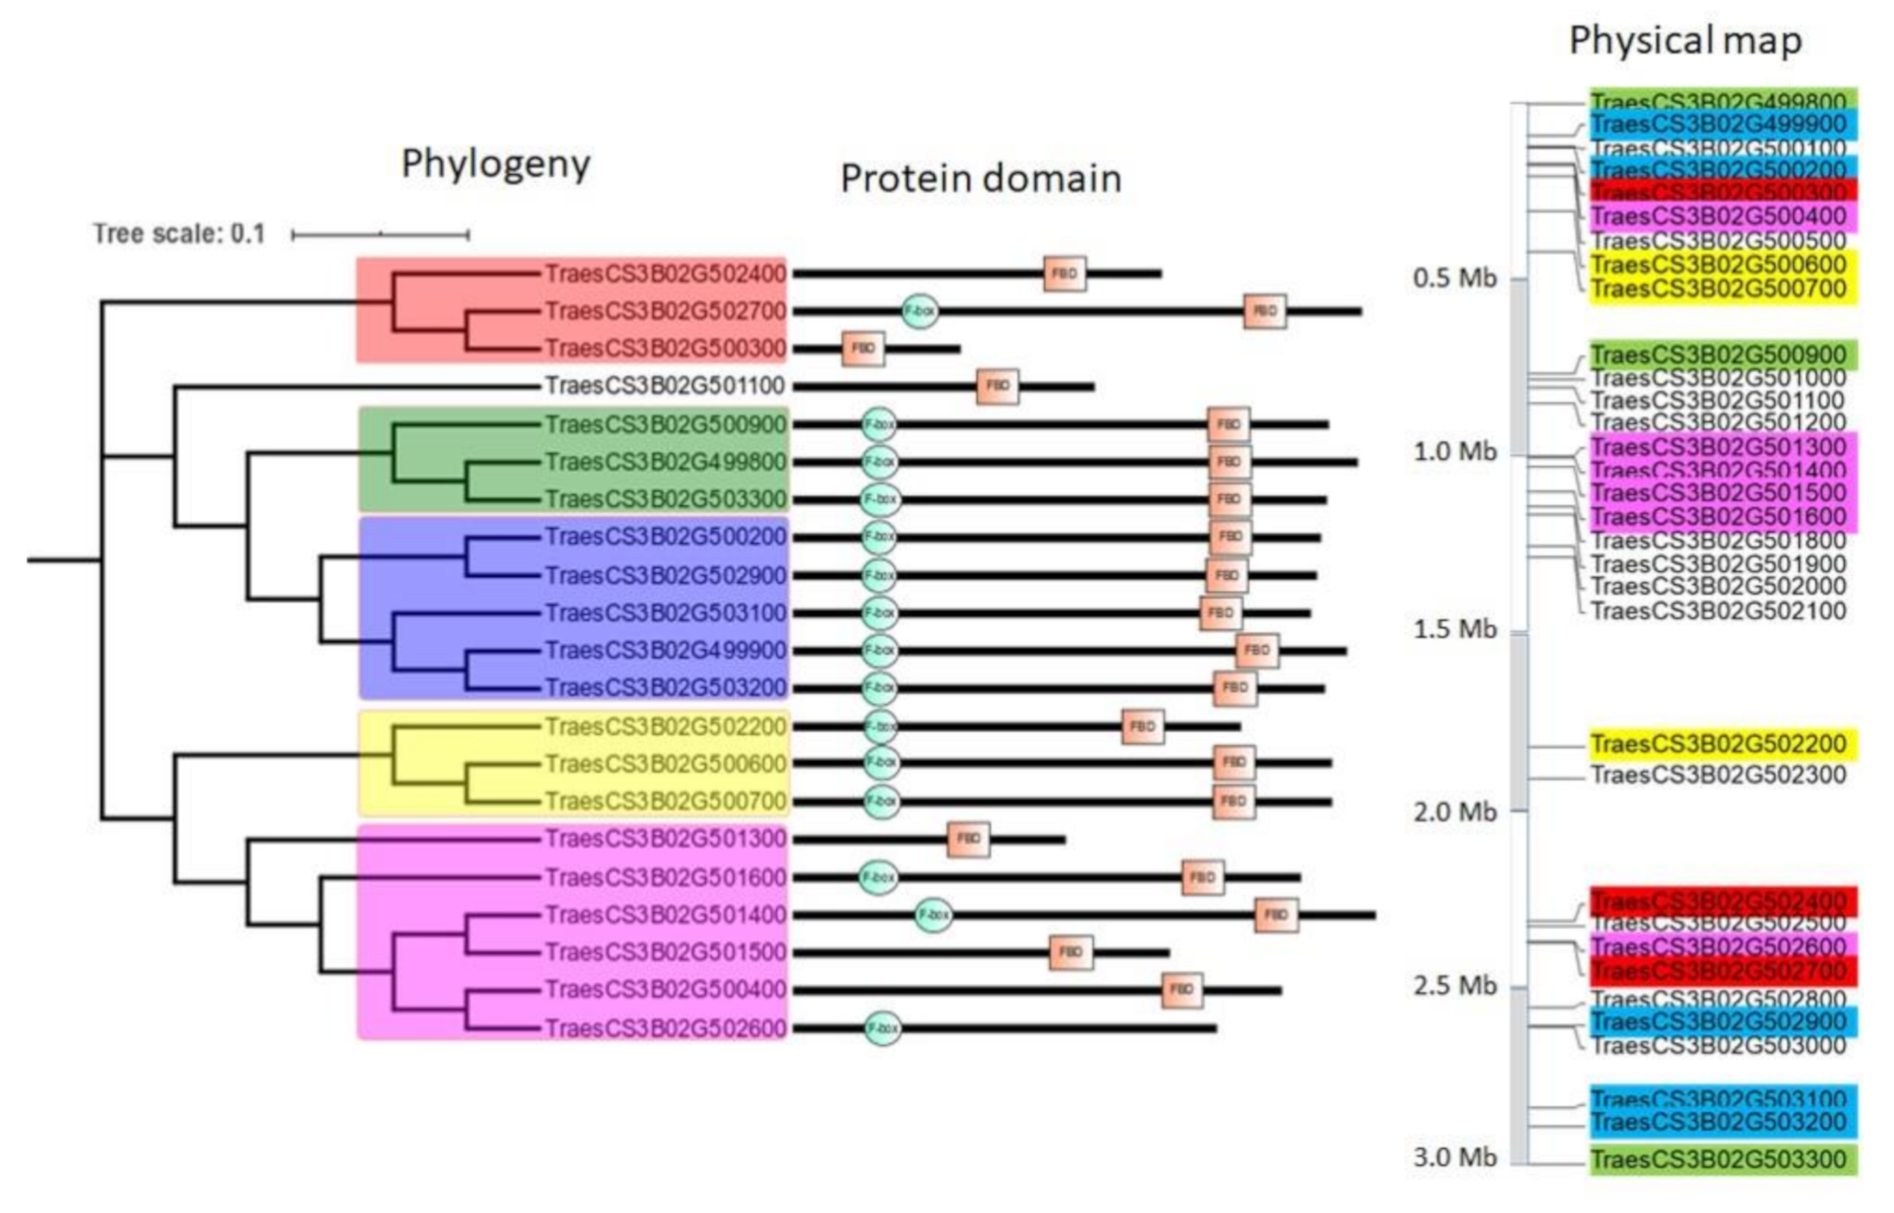
Because the FBD domain is often associated with the F-box domain in proteins, we focused on the 21 proteins containing either the FBD domain alone, the F-box domain alone, or both (Figure 8). Among the five clades, we identified three clades (blue, green and yellow) composed of genes coding for F-box and FBD domain-containing proteins. The two last clades are a patchwork between genes coding for proteins containing one or both of the F-box and the FBD domains. Collectively, these findings indicate that this region may have experienced multiple loss or gain of domains, probably through unequal crossing-over and local duplications. However, whether these truncated proteins are still capable of interacting with other proteins (in particular, the SKP1 subunit of the target protein) must be experimentally verified.

2.2. TaFBX Family Expression Pattern

FBX genes are known to be involved in various biological processes in plants, such as growth and stress response. We investigated the expression pattern of this large family in bread wheat, during embryogenesis/grain development and in response to heat and drought stress. For this purpose, we collected transcriptomic data from public repositories and extracted the ones corresponding to the TaFBX genes for specific analysis.

2.2.1. TaFBX Expression during Wheat Embryogenesis and Grain Development

An exhaustive analysis of the transcriptome dynamic during embryogenesis and endosperm development was recently published [47]. In this study, the authors identified 39,173 DEGs at different developmental stages. Among those DEGs, we retrieved 1206 TaFBX genes and collected their chromosomal coordinates in order to classify them according to their chromosomal region (Table S4). The observed TaFBX number of each of these regions was compared with the theoretical ones (Table 2). Clearly, the TaFBX distribution is not equal between observed and theoretical estimations across the whole of the TaFBX family. Indeed, the interstitial regions are overrepresented (particularly the R2b region), whereas the R1 and R3 distal regions are underrepresented. These results emphasize the fact that, although the distal regions contained an absolute high number of TaFBX DEGs during wheat grain development, their relative contribution is less important than the interstitial regions (R2a, C and R2b).

2.2.2. TaFBX Gene Expression in Response to Heat and Drought Stress

To study the involvement of TaFBX genes in the wheat response to heat and drought stress, RNAseq data generated by Liu et al. (2015) [48] were used (accession number SRP045409). In their experiment, 7-day wheat seedlings were submitted to thermal stress, drought or a combination of both for 1 h or 6 h for each treatment. As done previously, only the HC genes were retrieved, and the counts of all of the isoforms were cumulated for each gene, leading to a 107,891 gene set. After filtration, 55,801 genes were found expressed, containing 1298 TaFBX sequences. By comparing stressed and control samples, a total of 28,989 DEGs were identified, among which 525 were TaFBX coding sequences (Table S5).
Observed and theoretical distribution of TaFBX genes responding to abiotic stress were analyzed by considering their location in the chromosomal regions (Table 3). Similar to the results observed during wheat embryogenesis, the chromosomal regions did not contribute equally to the set of differentially expressed TaFBX. A higher number of TaFBX DEGs were noted in the R2b, R2a and C interstitial regions compared with the R1 and R3 distal regions. The R2b region is the largest contributor of TaFBX DEGs, with 160 observed TaFBX genes compared with 95 theoretically expected (representing an excess of 65 genes).
The distribution of TaFBX DEGs, both during embryogenesis/grain development and in response to abiotic stress, indicated that, while the distal R3 region displayed an absolute high number of DEGs, its relative contribution is modest considering its total TaFBX content.

3. Discussion

3.1. FBX Family Size Is Larger in Wheat Than in Other Known Plant Species

The FBX family is one of the largest gene families in plants, but only a few members have been fully characterized. A wide and complete identification of the FBX gene family is a mandatory step before the characterization of their biological functions. Hence, far, several genomes were explored to identify the FBX gene family. Among eukaryotes, this family is usually composed of less than 100 members (human, mouse, Saccharomyces or Drosophila [28,29]) with a maximal number of 326 FBX in C. elegans [24]. In the plant kingdom, however, an FBX family with an order of magnitude from a hundred to a thousand gene members is often observed (rice, Arabidopsis, maize, moss, or poplar [25,30]). Through their essential role in targeting specific proteins, they are involved in a wide range of physiological processes, including developmental and adaptive ones, in response to environmental stress [14,41,49,50,51,52,53,54,55,56,57,58,59,60,61,62,63,64,65,66,67].
While this manuscript was in its final stage, Hong et al. (2020) reported that the bread wheat genome contains 1796 TaFBX genes [43]. Using the same RefSeq v1.1 version of the annotated wheat genome released by the IWGSC [45], we identified 3670 TaFBX genes, which are twice larger. This discrepancy between the two results could be explained by the validation and manual curation process of the putative sequences identified. Indeed, while both Hong et al. (2020) and we identified roughly the same initial number of TaFBX putative genes using HMMR programs (around 4000 unique genes), they may have used more restrictive filters and only the Pfam database to identify their final set of TaFBX genes. In addition, those authors indicated that they removed identical sequences. In our paper, we used InterProScan and interrogated the InterPro database that integrates signatures from 13 different databases [68]; this may have led to retrieving more sequences. Furthermore, the annotation of the whole proteome of wheat by the IWGSC identified 3749 unique proteins containing the F-box domain (IPR001810). Finally, in the set identified in our paper, we retrieved sequences coding for essentials proteins, such as putative receptors for hormones that were not retrieved by Hong et al. (2020) [43], for instance Auxin-signaling (8 TaFBX, TraesCS7D02G177500, TraesCS7B02G081200, TraesCS1D02G099900,TraesCS1A02G091300,TraesCS1B02G119100, TraesCS5B02G280100, TraesCS5A02G281100, TraesCS5D02G288000), jasmonate perception and signaling (TraesCS3D02G360400, TraesCS3B02G399200, TraesCS1A02G279100, TraesCS1B02G288100, TraesCS1D02G278400, TraesCS3A02G367500) or abscisic acid signaling (TraesCS3A02G331200,TraesCS3B02G361400,TraesCS1B02G244300,TraesCS1A02G229800,TraesCS1D02G232200). Collectively, these arguments suggest that the number of TaFBX genes (i.e., 1796) reported by Hong et al. (2020) [43] is likely an underestimation of the actual number of TaFBX in the wheat genome and, while the number of 3670 genes reported here could vary somewhat, it is likely more representative of the actual size of this family.

3.2. FBX Gene Family Has Experienced Local Expansion through Retrotransposition, Tandem and Interchromosomal Duplications

Various mechanisms have been proposed to explain the expansion of gene families in plants. They included, for instance, retrotransposition, unequal crossing-over, duplicated DNA transposition, and polyploidization [69,70,71,72]. Once duplicated, the gene could retain its original function, acquire a new function (neofunctionalization) or even lose any identifiable function (pseudogenization) [73].
Among the TaFBX family identified here, 1338 (36.5%) are intronless and probably correspond to processed genes that have been duplicated through the retrotransposition phenomenon [74]. This percentage is close to those observed for FBX in other species (chickpea, 34% [31] and rice 41% [41]) and could partially explain the global family expansion observed in wheat in comparison with other species.
Moreover, the phylogenetic tree (Figure 6) suggests that other mechanisms would be responsible for the TaFBX family expansion. First, numerous clades are mainly composed of genes physically close to each other on the pseudomolecule. This result supports the hypothesis of tandem duplications as one of the main mechanisms of the TaFBX family expansion. Some of these duplications include three members from one homoeologous group, which supports the hypothesis of an ancestral duplication acquired by the common ancestor of the three subgenomes. In some other cases, only one homoeolog appears to have been duplicated once or more, leading to the generation of extra copies of this gene. One example is given in the green box of Figure 6, showing one TaFBX gene (TraesCS5D02G332800) that may have been duplicated to give two inparalogs (TraesCS5D02G332900 and TraesCS5D02G332600). More complex situations can be encountered (blue box of Figure 6). In this case, if the percentage of sequence identity is the criterion to identify homoeologous genes, TraesCS4B02G264600 would be the homoeolog of TraesCS4D02G264600. Alternatively, the B copy and the two D copies could come from duplication between non-homoeologous loci after a double-strand break, as has been observed for other genes [75]. This hypothesis could be supported by the presence of another copy in the same clade, carried by chromosome 5 of the A subgenome (Tres5A02G551800). Glover et al. (2015) [75] suggested that interchromosomal duplications do happen in the wheat genome after double-stranded DNA break repairs and contribute significantly to the duplication of genes in non-syntenic regions (anchored on different chromosomes). It also has been suggested that these small-scale duplications may explain the expansion of the NAC transcription factors family in wheat [38,76].
To go deeper into the understanding of the duplication pattern that could have occurred during the TaFBX gene evolution and expansion, we studied a particular subregion of the R3 region of the chromosome 3B. Indeed, a phylogenetic tree regrouping TaFBX anchored in this subregion was constructed (Figure 8). Two clades were found to contain either FBD domain, F-box domain or both. This could be explained by sequence shuffling that occurred after nucleotidyl insertions/deletions phenomena. These events generated proteins of various lengths and, in some cases, without the F-box motif (i.e., TraesCS3B02G502400) or without the FBD motif (i.e., TraesCS3B02G502600). On chromosome 3B, two TaFBX genes, localized side by side and within the same clade (TraesCS3B02G500600 and TraesCS3B02G500700), present almost 100% identity in their protein sequences (except for 14 amino acids in their C-terminal regions), suggesting duplication of one copy, followed by limited sequence variation. A third gene (TraesCS3B02G502200), physically distant from the two others, is present in the same clade. The extra-copy probably originated from a duplication of one of the other genes, followed by insertion of four nucleotides and deletion of 276 nucleotides in its C-terminal region. As a result, the three copies share the F-box domain, which is necessary for interaction with the SKP1 sub-unit; however, they diverged in the C-terminal region, which is involved in the interaction with putative substrates. In a general manner, the whole subregion seems to be organized as a mirror image, with the alignment of its left reflecting that of its right, highlighting evolutive resemblances. Interestingly, when considering the alignment of the left side with the right one, we noted that the direct and reverse duplications do not occur in a single contiguous block but with a “direct-reverse” alternation pattern, suggesting multiple and complex small-scale duplication events (Figure S3).
Collectively, these observations indicate that multiple rounds of duplications through retrotransposition, tandem and small-scale duplications, combined to sequence diversification through insertions and deletions, are responsible for the large and diversified repertoire of TaFBX genes in wheat.

3.3. The TaFBX Family Structured into Subfamilies Is Unequally Expanded in Wheat

It is known that the FBX characterized genes do carry other domains than the F-box domain that are localized in their C-terminal regions [41]. However, here, we found that 67% of the TaFBX genes do not have any additional known domains. This result is in accordance with the protein structure that has been observed in cotton and in wheat with, respectively, 54% and 76% of the FBX containing only the F-box domain [32,43]. A similar percentage was observed by Jain et al. (2007) [41] in the rice FBX family. In contrast, only 14% and 30% of the FBX genes were identified without other known domains in Arabidopsis and chickpea, respectively [31,77]. The second most abundant subfamily was found to be the FBD subfamily in our study, such as in Hong et al. (2020) [43], while this is the Kelch domain in cotton [32].
Analysis of the remaining TaFBX genes showed the presence of supplemental domains, such as FBD, DUF, Kelch, FBA, etc., localized in the C-terminal region of their sequence and used for their subclassification into 17 subfamilies. Among those wheat TaFBX subfamilies, we identified 67 genes carrying the phloem protein 2-like domain (or PP2, IPR025886). The latest examination of the Arabidopsis, poplar and rice genomes [41,46], as well as other plant species [30], did not reveal any FBX protein with this domain. More recently, eight FBX genes carrying the PP2 domain have been identified in chickpea [31]. It has been suggested that, through evolution, some PP2 proteins (typically associated with phloem functions) have acquired the FBX domain and gained the capability to interact with glycoproteins, playing a role in protein degradation [31,78].

3.4. The FBX Gene Distribution Is Not Homogeneous in the Wheat Genome

Globally, the TaFBX gene distribution was revealed at different genomic scales (subgenomic, chromosomal and chromosomal region scales). The potential deficit/enrichment was estimated by calculating the theoretical (expected) number of TaFBX genes, considering the global gene distribution at each studied scale. A few members of the TaFBX family (3.7%) are unanchored on the bread wheat chromosomes. This finding is in agreement with the results observed for other gene families in wheat, such as the TaNAC family, in which 2% of the genes have been found to have no chromosomal location [38]. What is more, the anchored TaFBX genes are not regularly dispatched among the three subgenomes, on the seven chromosomes of each subgenome, nor in the five chromosomal regions of each chromosome. By comparing the observed subgenomic distribution to the expected one, we showed that the A subgenome displays a deficit in TaFBX; the B presents an enrichment, whereas the D is rather balanced. However, this balanced distribution is not homogenous among the seven chromosomes. For example, the chromosome 4D contains fewer genes than expected.

3.5. FBX Gene Distribution Is Not Homogeneous among the Five Chromosomal Regions of the Bread Wheat Genome

The wheat genome seems to present a preferential anchorage of the TaFBX genes in certain regions of the chromosomes. The resulting unequal distribution suggests a key role of proximal and tandem duplications in the local expansion of the TaFBX subfamilies. This hypothesis is supported by the observation that the R1 and R3 regions are enriched in TaFBX-with-no-ortholog genes in comparison with the R2a, R2b and C regions. These genes can be named “lineage-specific”. Considering the lack of orthology as a reflection of divergence in terms of coding sequences between plant species, the R1 and R3 regions would be the preferential regions for innovation in their coding sequences, with a strong and active divergence. The large accumulation of TaFBX-with-no-ortholog genes in the R1 and R3 regions is consistent with the fact that these regions contain the highest number of repeated sequences and recombination frequency compared with the other chromosomal regions [45]. Furthermore, the five regions of each of the seven chromosomes do not present the same TaFBX distribution. For example, chromosome 1 is particularly enriched in TaFBX genes in the R3 region, whereas chromosome 6 presents a TaFBX enrichment in its R1 region. This result suggests that different events (such as duplication, insertion, deletion, mutation, etc.) must have affected the seven chromosomes independently.
Moreover, a similar profile can be shared between two or three homoeologous chromosomes, suggesting that this profile can be considered as the (likely) ancestral profile present before the wheat hexaploidization. For example, the same TaFBX excess/deficit profile can be observed in the C, R2b and R3 regions of the chromosomes 1A, 1B and 1D, but the profile differs in the R1 and R2a regions of the chromosome 1A versus chromosomes 1B and 1D. This observation suggests that the ancestral state was conserved in the chromosomes 1B and 1D, but the chromosome 1A must have experienced a different fate leading to a TaFBX gain in its R1 region and TaFBX loss in its R2a region (Figure S2).

3.6. Differentially Expressed TaFBX Are Concentrated in the R2b Region

Classically, transcriptome analyses are useful resources for global gene expression analysis. This kind of upstream work is often used to predict putative functions and then identify key genes in plant physiology. Here, we wanted to find out whether each chromosomal region contributed equally in terms of gene expression. For this purpose, we identified and localized TaFBX DEGs in the chromosomal regions. We chose two main physiological processes as examples: embryogenesis and response to heat and drought stress, based on already published RNAseq data.
First, using the transcriptome analysis realized during seven stages of embryogenesis and endosperm development [47], we identified 1206 TaFBX genes with a differential expression in the embryo, endosperm, and/or pericarp (Table S4). Secondly, in response to abiotic stress, 525 TaFBX DEGs were identified from the data of Liu et al. (2015) [48] (Table S5). A focus on their chromosomal anchorage revealed that their distribution pattern along the wheat genome did not match with the expected one from the whole TaFBX gene distribution. For both datasets, we found that, although the distal chromosomal regions (R1 and R3) were richer in genes than the central (C) and interstitial regions (R2a and R2b), the latter being richer in TaFBX DEGs than expected during embryogenesis and in response to abiotic stress. Cumulatively, the R2a, R2b and C regions contributed 16.3% more TaFBX DEGs than expected during embryogenesis and 50.9% more in response to abiotic stress. The most significant gap between theoretical and observed TaFBX gene differential expression was noticed in the R2b region in response to abiotic stress, with 68% more DEGs than expected. To explain these observations, one hypothesis puts forward that the interstitial regions (R2a, C and R2b), which contain more conserved genes (IWGSC, 2018), may contribute significantly to basic and essential biological processes, such as embryogenesis and in response to environmental stress, two processes, which require stability during evolution. In contrast, the distal chromosomal regions (R1 and R3), which are more prone to duplication and recombination events [79], may contribute by providing innovative functions to adapt to particular conditions. This hypothesis was already suggested by the members of the IWGSC (2018) [45], Ramírez-González et al. (2018) [80] and Schilling et al. (2020) [37]. They observed that the MADS-box MIKC-type transcription factors, which are involved in highly conserved developmental functions, are preferentially located in the central chromosomal segments and that they belong to smaller subclades. In contrast, larger subclades contain genes mostly located in the distal regions. Those genes are mostly involved in the adaptation to environmental cues, such as the FLC-like gene, which is involved in flowering time [37]. Thus, we hypothesize that the set of TaFBX originating from the central regions (R2a, C and R2b), and differentially expressed, constitute the core of the conserved and general wheat FBX genes involved in embryogenesis and in response to abiotic stress, while those originating from the R1 and R3 regions may provide a subtle, but nevertheless essential, contribution to the wheat’s ability to adapt to its environment.

4. Materials and Methods

4.1. Survey of TaFBX in the Wheat Sequence

The FBX proteins were retrieved from the protein database of the IWGSC (IWGS RefSeq v1.1, cv Chinese Spring) [45] by using the HMMER2 program implemented in Unipro UGENE 1.25 [81]. The FBX and FBX-like motifs (PF00646, PF12937, PF13013, and PF15966), downloaded from Pfam, were used as queries. The initial set of genes identified by HMMER2 were subjected to InterProScan analysis and manual curation.

4.2. Phylogenetic Analysis of the FBX Family

As our aim was to analyze the relationships between sequence relatedness and the chromosomal localization of the TaFBX genes, we only retained the TaFBX sequences that were mapped onto the wheat genome (i.e., 3536 sequences). The complete amino acid sequences were aligned using MAFFT algorithms (https://mafft.cbrc.jp/alignment/server/ date of access: 6 May 2020 [82]). The alignment was then used without further manual correction to construct an approximately maximum-likelihood phylogenetic using FastTree algorithms (FastTree 2.1.11 [83]) with default parameters. The tree obtained was then rendered using iTOL (https://itol.embl.de/, date of access: 6 May 2020 [84]).

4.3. Chromosomal Distribution of TaFBX Coding Genes

The genomic coordinates of each TaFBX gene (start and end positions) were extracted from the GFF file provided by the IWGSC [45]. These coordinates were then used to draw the chromosomal distribution of the TaFBX genes among the 21 wheat chromosomes using KaryoploteR [85]. These same coordinates were also used to distribute the genes between the R1, R2a, C, R2b and R3 regions as defined by the IWGSC [45]. Finally, since each of these regions contains a known total number of genes, we used this information to estimate the expected number of TaFBX genes per region, assuming that the chromosomal distribution of TaFBX followed the same distribution as the rest of the wheat genes [45]. The goodness of fit of the observed number of TaFBX per region to that expected was tested using the chi-squared test.

4.4. Evolutionary Study of the R3 Region of the Chromosome 3B

To gain insight into the mechanisms leading to the local expansion of TaFBX genes, the R3 region of chromosome 3B was selected for its high-density in TaFBX genes. A focus was made more specifically on the subregion spanning from 759562499 to 762622854 (i.e., about 3.06 Mb). The genomic sequence of this region was downloaded and analyzed using YASS, a blast-like algorithm [86]. Any two non-overlapping sequences, presenting a minimum of 80% identity covering a minimum of 2 Kb, were considered duplicated. Overall, this approach identified two duplicated blocks whose coordinates were from 759562499 to 760651332 for the first one (approximately 1.09 Mb) and from 760655083 to 762622854 for the second one (approximately 1.96 Mb).

4.5. Expression of TaFBX Genes

4.5.1. TaFBX Gene Expression during Embryogenesis and Grain Development

To identify the TaFBX whose expression varied during development, we extracted the list of differentially expressed F-box coding genes from Xiang et al. (2019) [47]. In this study, the authors used seven stages of embryogenesis (from the two-cell stage to the mature stage), two endosperm stages, and the pericarp, comparing their transcriptome programming using RNAseq. In total, they identified 39,173 DEGs.

4.5.2. TaFBX Gene Expression in Response to Heat and Drought Stress

Raw data corresponding to the experiments described in Liu et al. (2015) [48] was downloaded from the www.wheat-expression.com (date of access: 6 May 2020) platform and analyzed using the LIMMA package [87]. Weakly expressed genes were first removed by filtration of raw expression data corresponding to the entire wheat genome (genes were retained if they were expressed at a counts-per-million > 0.5 in at least two samples). TMM and Voom methods were then used to normalize the expression of retained genes. Their expressions were compared between samples, and genes that displayed an absolute log fold-change >1 along with an adjusted p-value < 0.05 were deemed DEGs. A total of 28,989 genes were identified as DEGs, among which 525 corresponded to F-Box coding genes.
Finally, we focused on detecting any potential bias in the chromosomal distribution of the TaFBX differentially expressed either during embryogenesis or in response to heat and drought stress; the number of TaFBX DEGs observed per region was compared with that expected using a chi-squared test (see above, chromosomal distribution section).

5. Conclusions

Using the latest assembly of the wheat genome, we retrieved 3670 TaFBX genes. The FBX in wheat appears to be a particularly large multigenic family in comparison with most plant species, suggesting an expansion through retrotransposition (processed genes), tandem and small-scale duplications. We showed that their distribution is not homogeneous between A, B and D wheat subgenomes, nor between the chromosomes and the five different chromosomal regions of each chromosome (R1, R2a, R2b, C and R3). Moreover, in a chromosome particularly enriched in TaFBX, this enrichment is concentrated in its distal regions. However, despite being the richest regions in TaFBX genes, the distal regions are not the most significant reservoir of TaFBX DEGs during wheat embryogenesis (1206 TaFBX genes) or in response to heat and drought stress (525) compared with the expected numbers that could have been obtained when considering the gene distribution in the whole-genome. This observation may suggest that the central regions of wheat chromosomes contain fewer genes but that they may contribute more significantly to essential biological processes. On the other hand, the distal regions contain more genes but seem to contribute less than expected when considering their gene densities alone.

Supplementary Materials

Supplementary Materials can be found at https://www.mdpi.com/1422-0067/22/6/3111/s1.

Author Contributions

Methodology, software, validation, formal analysis, writing—original draft preparation: S.M.; conceptualization, data curation, visualization: S.M., J.R. and C.G.; writing—review and editing, project administration: J.R. and C.G.; supervision, J.R. All authors have read and agreed to the published version of the manuscript.

Funding

This research received no external funding.

Data Availability Statement

The data that support the findings of this study are available from the corresponding author upon reasonable request.

Conflicts of Interest

The authors declare no conflict of interest. The funders had no role in the design of the study, in the collection, analyses, or interpretation of data, in the writing of the manuscript, or in the decision to publish the results.

Abbreviations

DEGDifferentially Expressed Gene
FBXF-box proteins
TaTriticum aestivum, bread wheat
HCHigh Confidence

References

  1. Parzych, K.R.; Klionsky, D.J. An Overview of Autophagy: Morphology, Mechanism, and Regulation. Antioxid. Redox Signal. 2014, 20, 460–473. [Google Scholar] [CrossRef] [Green Version]
  2. Cundiff, M.D.; Hurley, C.M.; Wong, J.D.; Boscia, J.A.; Bashyal, A.; Rosenberg, J.; Reichard, E.L.; Nassif, N.D.; Brodbelt, J.S.; Kraut, D.A. Ubiquitin Receptors Are Required for Substrate-Mediated Activation of the Proteasome’s Unfolding Ability. Sci. Rep. 2019, 9, 14506. [Google Scholar] [CrossRef]
  3. Groll, M.; Huber, R. Substrate Access and Processing by the 20S Proteasome Core Particle. Int. J. Biochem. Cell Biol. 2003, 35, 606–616. [Google Scholar] [CrossRef]
  4. Vierstra, R.D. The Ubiquitin–26S Proteasome System at the Nexus of Plant Biology. Nat. Rev. Mol. Cell. Biol. 2009, 10, 385–397. [Google Scholar] [CrossRef] [PubMed]
  5. Du, Z.; Zhou, X.; Li, L.; Su, Z. PlantsUPS: A Database of Plants’ Ubiquitin Proteasome System. BMC Genom. 2009, 10, 227. [Google Scholar] [CrossRef] [PubMed] [Green Version]
  6. He, Y.; Wang, C.; Higgins, J.D.; Yu, J.; Zong, J.; Lu, P.; Zhang, D.; Liang, W. MEIOTIC F-BOX Is Essential for Male Meiotic DNA Double-Strand Break Repair in Rice[OPEN]. Plant Cell 2016, 28, 1879–1893. [Google Scholar] [CrossRef] [Green Version]
  7. Woo, H.R.; Chung, K.M.; Park, J.-H.; Oh, S.A.; Ahn, T.; Hong, S.H.; Jang, S.K.; Nam, H.G. ORE9, an F-Box Protein That Regulates Leaf Senescence in Arabidopsis. Plant Cell 2001, 13, 1779–1790. [Google Scholar] [CrossRef] [PubMed] [Green Version]
  8. Shen, H.; Luong, P.; Huq, E. The F-Box Protein MAX2 Functions as a Positive Regulator of Photomorphogenesis in Arabidopsis. Plant Physiol. 2007, 145, 1471–1483. [Google Scholar] [CrossRef] [Green Version]
  9. Stirnberg, P.; van de Sande, K.; Leyser, H.M.O. MAX1 and MAX2 Control Shoot Lateral Branching in Arabidopsis. Development 2002, 129, 1131–1141. [Google Scholar]
  10. Dieterle, M.; Zhou, Y.-C.; Schäfer, E.; Funk, M.; Kretsch, T. EID1, an F-Box Protein Involved in Phytochrome A-Specific Light Signaling. Genes Dev. 2001, 15, 939–944. [Google Scholar] [CrossRef] [Green Version]
  11. Somers, D.E.; Schultz, T.F.; Milnamow, M.; Kay, S.A. ZEITLUPE Encodes a Novel Clock-Associated PAS Protein from Arabidopsis. Cell 2000, 101, 319–329. [Google Scholar] [CrossRef] [Green Version]
  12. Samach, A.; Klenz, J.E.; Kohalmi, S.E.; Risseeuw, E.; Haughn, G.W.; Crosby, W.L. The UNUSUAL FLORAL ORGANS Gene of Arabidopsis Thaliana Is an F-Box Protein Required for Normal Patterning and Growth in the Floral Meristem. Plant J. 1999, 20, 433–445. [Google Scholar] [CrossRef] [PubMed]
  13. Chae, E.; Tan, Q.K.-G.; Hill, T.A.; Irish, V.F. An Arabidopsis F-Box Protein Acts as a Transcriptional Co-Factor to Regulate Floral Development. Development 2008, 135, 1235–1245. [Google Scholar] [CrossRef] [PubMed] [Green Version]
  14. Binder, B.M.; Walker, J.M.; Gagne, J.M.; Emborg, T.J.; Hemmann, G.; Bleecker, A.B.; Vierstra, R.D. The Arabidopsis EIN3 Binding F-Box Proteins EBF1 and EBF2 Have Distinct but Overlapping Roles in Ethylene Signaling. Plant Cell 2007, 19, 509–523. [Google Scholar] [CrossRef] [Green Version]
  15. Gonzalez, L.E.; Keller, K.; Chan, K.X.; Gessel, M.M.; Thines, B.C. Transcriptome Analysis Uncovers Arabidopsis F-BOX STRESS INDUCED 1 as a Regulator of Jasmonic Acid and Abscisic Acid Stress Gene Expression. BMC Genom. 2017, 18, 533. [Google Scholar] [CrossRef]
  16. Xu, L.; Liu, F.; Lechner, E.; Genschik, P.; Crosby, W.L.; Ma, H.; Peng, W.; Huang, D.; Xie, D. The SCFCOI1 Ubiquitin-Ligase Complexes Are Required for Jasmonate Response in Arabidopsis. Plant Cell 2002, 14, 1919–1935. [Google Scholar] [CrossRef] [PubMed] [Green Version]
  17. Sheard, L.B.; Tan, X.; Mao, H.; Withers, J.; Ben-Nissan, G.; Hinds, T.R.; Kobayashi, Y.; Hsu, F.-F.; Sharon, M.; Browse, J.; et al. Jasmonate Perception by Inositol-Phosphate-Potentiated COI1–JAZ Co-Receptor. Nature 2010, 468, 400–405. [Google Scholar] [CrossRef]
  18. Xie, D.-X.; Feys, B.F.; James, S.; Nieto-Rostro, M.; Turner, J.G. COI1: An Arabidopsis Gene Required for Jasmonate-Regulated Defense and Fertility. Science 1998, 280, 1091–1094. [Google Scholar] [CrossRef] [PubMed]
  19. Tan, X.; Calderon-Villalobos, L.I.A.; Sharon, M.; Zheng, C.; Robinson, C.V.; Estelle, M.; Zheng, N. Mechanism of Auxin Perception by the TIR1 Ubiquitin Ligase. Nature 2007, 446, 640–645. [Google Scholar] [CrossRef]
  20. Li, Y.; Liu, Z.; Wang, J.; Li, X.; Yang, Y. The Arabidopsis Kelch Repeat F-Box E3 Ligase ARKP1 Plays a Positive Role for the Regulation of Abscisic Acid Signaling. Plant Mol. Biol. Rep. 2016, 34, 582–591. [Google Scholar] [CrossRef]
  21. Xu, G.; Cui, Y.; Wang, M.; Li, M.; Yin, X.; Xia, X. OsMsr9, a Novel Putative Rice F-Box Containing Protein, Confers Enhanced Salt Tolerance in Transgenic Rice and Arabidopsis. Mol. Breed. 2014, 34, 1055–1064. [Google Scholar] [CrossRef]
  22. Yan, Y.-S.; Chen, X.-Y.; Yang, K.; Sun, Z.-X.; Fu, Y.-P.; Zhang, Y.-M.; Fang, R.-X. Overexpression of an F-Box Protein Gene Reduces Abiotic Stress Tolerance and Promotes Root Growth in Rice. Mol. Plant 2011, 4, 190–197. [Google Scholar] [CrossRef] [Green Version]
  23. Iantcheva, A.; Boycheva, I.; Vassileva, V.; Revalska, M.; Zechirov, G. Cyclin-like F-Box Protein Plays a Role in Growth and of the Three Model Species Medicago Truncatula, Lotus Japonicus, and Arabidopsis Thaliana. Res. Rep. Biol. 2015, 6, 117–130. [Google Scholar] [CrossRef] [Green Version]
  24. Kipreos, E.T.; Pagano, M. The F-Box Protein Family. Genome Biol. 2000, 1, reviews3002.1. [Google Scholar] [CrossRef] [PubMed] [Green Version]
  25. Elzanati, O.; Roche, J.; Boulaflous-Stevens, A.; Mouzeyar, S.; Bouzidi, M.F. Genome-Wide Analysis, Classification, Expression and Interaction of Physcomitrella Patens SKP1-like (PpSKP) and F-Box (FBX) Genes. Plant Gene 2017, 12, 13–22. [Google Scholar] [CrossRef]
  26. HajSalah El Beji, I.; Mouzeyar, S.; Bouzidi, M.-F.; Roche, J. Expansion and Functional Diversification of SKP1-Like Genes in Wheat (Triticum Aestivum L.). Int. J. Mol. Sci. 2019, 20, 3295. [Google Scholar] [CrossRef] [Green Version]
  27. Skowyra, D.; Craig, K.L.; Tyers, M.; Elledge, S.J.; Harper, J.W. F-Box Proteins Are Receptors That Recruit Phosphorylated Substrates to the SCF Ubiquitin-Ligase Complex. Cell 1997, 91, 209–219. [Google Scholar] [CrossRef] [Green Version]
  28. Jin, J.; Cardozo, T.; Lovering, R.C.; Elledge, S.J.; Pagano, M.; Harper, J.W. Systematic Analysis and Nomenclature of Mammalian F-Box Proteins. Genes Dev. 2004, 18, 2573–2580. [Google Scholar] [CrossRef] [Green Version]
  29. Skaar, J.R.; Pagan, J.K.; Pagano, M. SnapShot: F Box Proteins I. Cell 2009, 137, 1160–1160.e1. [Google Scholar] [CrossRef] [Green Version]
  30. Hua, Z.; Zou, C.; Shiu, S.-H.; Vierstra, R.D. Phylogenetic Comparison of F-Box (FBX) Gene Superfamily within the Plant Kingdom Reveals Divergent Evolutionary Histories Indicative of Genomic Drift. PLoS ONE 2011, 6, e16219. [Google Scholar] [CrossRef] [PubMed] [Green Version]
  31. Gupta, S.; Garg, V.; Kant, C.; Bhatia, S. Genome-Wide Survey and Expression Analysis of F-Box Genes in Chickpea. BMC Genom. 2015, 16, 67. [Google Scholar] [CrossRef] [PubMed] [Green Version]
  32. Zhang, S.; Tian, Z.; Li, H.; Guo, Y.; Zhang, Y.; Roberts, J.A.; Zhang, X.; Miao, Y. Genome-Wide Analysis and Characterization of F-Box Gene Family in Gossypium Hirsutum L. BMC Genom. 2019, 20, 993. [Google Scholar] [CrossRef] [PubMed]
  33. Semple, C.A.M. The Comparative Proteomics of Ubiquitination in Mouse. Genome Res. 2003, 13, 1389–1394. [Google Scholar] [CrossRef] [PubMed] [Green Version]
  34. Stone, S.L.; Hauksdóttir, H.; Troy, A.; Herschleb, J.; Kraft, E.; Callis, J. Functional Analysis of the RING-Type Ubiquitin Ligase Family of Arabidopsis. Plant Physiol. 2005, 137, 13–30. [Google Scholar] [CrossRef] [PubMed] [Green Version]
  35. Li, W.H. Evolution of Duplicate Genes and Pseudogenes. In Evolution of Genes and Proteins; Sinauer Associates: Sunderland, MA, USA, 1983; pp. 14–37. [Google Scholar]
  36. Thomas, J.H. Adaptive Evolution in Two Large Families of Ubiquitin-Ligase Adapters in Nematodes and Plants. Genome Res 2006, 16, 1017–1030. [Google Scholar] [CrossRef] [PubMed] [Green Version]
  37. Schilling, S.; Kennedy, A.; Pan, S.; Jermiin, L.S.; Melzer, R. Genome-wide Analysis of MIKC-type MADS -box Genes in Wheat: Pervasive Duplications, Functional Conservation and Putative Neofunctionalization. New Phytol. 2020, 225, 511–529. [Google Scholar] [CrossRef] [Green Version]
  38. Guérin, C.; Roche, J.; Allard, V.; Ravel, C.; Mouzeyar, S.; Bouzidi, M.F. Genome-Wide Analysis, Expansion and Expression of the NAC Family under Drought and Heat Stresses in Bread Wheat (T. Aestivum L.). PLoS ONE 2019, 14, e0213390. [Google Scholar] [CrossRef] [Green Version]
  39. Bowers, J.E.; Chapman, B.A.; Rong, J.; Paterson, A.H. Unravelling Angiosperm Genome Evolution by Phylogenetic Analysis of Chromosomal Duplication Events. Nature 2003, 422, 433–438. [Google Scholar] [CrossRef]
  40. Simillion, C.; Vandepoele, K.; Montagu, M.C.E.V.; Zabeau, M.; de Peer, Y.V. The Hidden Duplication Past of Arabidopsis Thaliana. Proc. Natl. Acad. Sci. USA 2002, 99, 13627–13632. [Google Scholar] [CrossRef] [Green Version]
  41. Jain, M.; Nijhawan, A.; Arora, R.; Agarwal, P.; Ray, S.; Sharma, P.; Kapoor, S.; Tyagi, A.K.; Khurana, J.P. F-Box Proteins in Rice. Genome-Wide Analysis, Classification, Temporal and Spatial Gene Expression during Panicle and Seed Development, and Regulation by Light and Abiotic Stress. Plant Physiol. 2007, 143, 1467–1483. [Google Scholar] [CrossRef] [Green Version]
  42. Hanada, K.; Zou, C.; Lehti-Shiu, M.D.; Shinozaki, K.; Shiu, S.-H. Importance of Lineage-Specific Expansion of Plant Tandem Duplicates in the Adaptive Response to Environmental Stimuli. Plant Physiol. 2008, 148, 993–1003. [Google Scholar] [CrossRef] [Green Version]
  43. Hong, M.J.; Kim, J.-B.; Seo, Y.W.; Kim, D.Y. F-Box Genes in the Wheat Genome and Expression Profiling in Wheat at Different Developmental Stages. Genes 2020, 11, 1154. [Google Scholar] [CrossRef]
  44. Borrill, P.; Ramirez-Gonzalez, R.; Uauy, C. ExpVIP: A Customizable RNA-Seq Data Analysis and Visualization Platform. Plant Physiol. 2016, 170, 2172–2186. [Google Scholar] [CrossRef] [PubMed] [Green Version]
  45. International Wheat Genome Sequencing Consortium(IWGSC); Appels, R.; Eversole, K.; Feuillet, C.; Keller, B.; Rogers, J.; Stein, N.; Feuillet, C.; Keller, B.; Rogers, J.; et al. Shifting the Limits in Wheat Research and Breeding Using a Fully Annotated Reference Genome. Science 2018, 361, eaar7191. [Google Scholar]
  46. Xu, G.; Ma, H.; Nei, M.; Kong, H. Evolution of F-Box Genes in Plants: Different Modes of Sequence Divergence and Their Relationships with Functional Diversification. Proc. Natl. Acad. Sci. USA 2009, 106, 835–840. [Google Scholar] [CrossRef] [PubMed] [Green Version]
  47. Xiang, D.; Quilichini, T.D.; Liu, Z.; Gao, P.; Pan, Y.; Li, Q.; Nilsen, K.T.; Venglat, P.; Esteban, E.; Pasha, A.; et al. The Transcriptional Landscape of Polyploid Wheats and Their Diploid Ancestors during Embryogenesis and Grain Development. Plant Cell 2019, 31, 2888–2911. [Google Scholar] [CrossRef] [Green Version]
  48. Liu, Z.; Xin, M.; Qin, J.; Peng, H.; Ni, Z.; Yao, Y.; Sun, Q. Temporal Transcriptome Profiling Reveals Expression Partitioning of Homeologous Genes Contributing to Heat and Drought Acclimation in Wheat (Triticum Aestivum L.). BMC Plant Biol. 2015, 15, 1–20. [Google Scholar] [CrossRef] [Green Version]
  49. Majee, M.; Kumar, S.; Kathare, P.K.; Wu, S.; Gingerich, D.; Nayak, N.R.; Salaita, L.; Dinkins, R.; Martin, K.; Goodin, M.; et al. KELCH F-BOX Protein Positively Influences Arabidopsis Seed Germination by Targeting PHYTOCHROME-INTERACTING FACTOR1. Proc. Natl. Acad. Sci. USA 2018, 115, E4120–E4129. [Google Scholar] [CrossRef] [PubMed]
  50. Zhang, X.; Jayaweera, D.; Peters, J.L.; Szecsi, J.; Bendahmane, M.; Roberts, J.A.; González-Carranza, Z.H. The Arabidopsis Thaliana F-Box Gene HAWAIIAN SKIRT Is a New Player in the MicroRNA Pathway. PLoS ONE 2017, 12, e0189788. [Google Scholar] [CrossRef] [PubMed] [Green Version]
  51. McSteen, P.; Zhao, Y. Plant Hormones and Signaling: Common Themes and New Developments. Dev. Cell 2008, 14, 467–473. [Google Scholar] [CrossRef] [PubMed] [Green Version]
  52. Kepinski, S.; Leyser, O. The Arabidopsis F-Box Protein TIR1 Is an Auxin Receptor. Nature 2005, 435, 446–451. [Google Scholar] [CrossRef] [PubMed]
  53. Thines, B.; Katsir, L.; Melotto, M.; Niu, Y.; Mandaokar, A.; Liu, G.; Nomura, K.; He, S.Y.; Howe, G.A.; Browse, J. JAZ Repressor Proteins Are Targets of the SCF(COI1) Complex during Jasmonate Signalling. Nature 2007, 448, 661–665. [Google Scholar] [CrossRef] [PubMed]
  54. Nelson, D.C.; Scaffidi, A.; Dun, E.A.; Waters, M.T.; Flematti, G.R.; Dixon, K.W.; Beveridge, C.A.; Ghisalberti, E.L.; Smith, S.M. F-Box Protein MAX2 Has Dual Roles in Karrikin and Strigolactone Signaling in Arabidopsis Thaliana. Proc. Natl. Acad. Sci. USA 2011, 108, 8897–8902. [Google Scholar] [CrossRef] [PubMed] [Green Version]
  55. Gusti, A.; Baumberger, N.; Nowack, M.; Pusch, S.; Eisler, H.; Potuschak, T.; De Veylder, L.; Schnittger, A.; Genschik, P. The Arabidopsis Thaliana F-Box Protein FBL17 Is Essential for Progression through the Second Mitosis during Pollen Development. PLoS ONE 2009, 4, e4780. [Google Scholar] [CrossRef] [Green Version]
  56. Song, Y.H.; Smith, R.W.; To, B.J.; Millar, A.J.; Imaizumi, T. FKF1 Conveys Crucial Timing Information for CONSTANS Stabilization in the Photoperiodic Flowering. Science 2012, 336, 1045–1049. [Google Scholar] [CrossRef] [Green Version]
  57. Zhang, X.; Gou, M.; Guo, C.; Yang, H.; Liu, C.-J. Down-Regulation of Kelch Domain-Containing F-Box Protein in Arabidopsis Enhances the Production of (Poly)Phenols and Tolerance to Ultraviolet Radiation. Plant Physiol. 2015, 167, 337–350. [Google Scholar] [CrossRef] [Green Version]
  58. Zhang, X.; Abrahan, C.; Colquhoun, T.A.; Liu, C.-J. A Proteolytic Regulator Controlling Chalcone Synthase Stability and Flavonoid Biosynthesis in Arabidopsis. Plant Cell 2017, 29, 1157–1174. [Google Scholar] [CrossRef] [PubMed] [Green Version]
  59. Kim, Y.Y.; Jung, K.W.; Jeung, J.U.; Shin, J.S. A Novel F-Box Protein Represses Endothecial Secondary Wall Thickening for Anther Dehiscence in Arabidopsis Thaliana. J. Plant Physiol. 2012, 169, 212–216. [Google Scholar] [CrossRef]
  60. Bao, Y.; Song, W.-M.; Jin, Y.-L.; Jiang, C.-M.; Yang, Y.; Li, B.; Huang, W.-J.; Liu, H.; Zhang, H.-X. Characterization of Arabidopsis Tubby-like Proteins and Redundant Function of AtTLP3 and AtTLP9 in Plant Response to ABA and Osmotic Stress. Plant Mol. Biol. 2014, 86, 471–483. [Google Scholar] [CrossRef]
  61. Zhou, S.; Sun, X.; Yin, S.; Kong, X.; Zhou, S.; Xu, Y.; Luo, Y.; Wang, W. The Role of the F-Box Gene TaFBA1 from Wheat (Triticum Aestivum L.) in Drought Tolerance. Plant Physiol. Biochem. 2014, 84, 213–223. [Google Scholar] [CrossRef]
  62. Stefanowicz, K.; Lannoo, N.; Zhao, Y.; Eggermont, L.; Van Hove, J.; Al Atalah, B.; Van Damme, E.J.M. Glycan-Binding F-Box Protein from Arabidopsis Thaliana Protects Plants from Pseudomonas Syringae Infection. BMC Plant Biol. 2016, 16, 213. [Google Scholar] [CrossRef] [Green Version]
  63. Zhou, S.-M.; Kong, X.-Z.; Kang, H.-H.; Sun, X.-D.; Wang, W. The Involvement of Wheat F-Box Protein Gene TaFBA1 in the Oxidative Stress Tolerance of Plants. PLoS ONE 2015, 10, e0122117. [Google Scholar] [CrossRef] [Green Version]
  64. Zhao, Z.; Zhang, G.; Zhou, S.; Ren, Y.; Wang, W. The Improvement of Salt Tolerance in Transgenic Tobacco by Overexpression of Wheat F-Box Gene TaFBA1. Plant Sci. 2017, 259, 71–85. [Google Scholar] [CrossRef] [PubMed]
  65. Song, J.B.; Wang, Y.X.; Li, H.B.; Li, B.W.; Zhou, Z.S.; Gao, S.; Yang, Z.M. The F-Box Family Genes as Key Elements in Response to Salt, Heavy Mental, and Drought Stresses in Medicago Truncatula. Funct. Integr. Genom. 2015, 15, 495–507. [Google Scholar] [CrossRef] [PubMed]
  66. Calderón-Villalobos, L.I.A.; Nill, C.; Marrocco, K.; Kretsch, T.; Schwechheimer, C. The Evolutionarily Conserved Arabidopsis Thaliana F-Box Protein AtFBP7 Is Required for Efficient Translation during Temperature Stress. Gene 2007, 392, 106–116. [Google Scholar] [CrossRef]
  67. Chen, Y.; Xu, Y.; Luo, W.; Li, W.; Chen, N.; Zhang, D.; Chong, K. The F-Box Protein OsFBK12 Targets OsSAMS1 for Degradation and Affects Pleiotropic Phenotypes, Including Leaf Senescence, in Rice1[W][OPEN]. Plant Physiol. 2013, 163, 1673–1685. [Google Scholar] [CrossRef] [Green Version]
  68. Blum, M.; Chang, H.-Y.; Chuguransky, S.; Grego, T.; Kandasaamy, S.; Mitchell, A.; Nuka, G.; Paysan-Lafosse, T.; Qureshi, M.; Raj, S.; et al. The InterPro Protein Families and Domains Database: 20 Years On. Nucleic Acids Res. 2021, 49, D344–D354. [Google Scholar] [CrossRef]
  69. Huo, N.; Zhang, S.; Zhu, T.; Dong, L.; Wang, Y.; Mohr, T.; Hu, T.; Liu, Z.; Dvorak, J.; Luo, M.-C.; et al. Gene Duplication and Evolution Dynamics in the Homeologous Regions Harboring Multiple Prolamin and Resistance Gene Families in Hexaploid Wheat. Front. Plant Sci. 2018, 9, 673. [Google Scholar] [CrossRef] [PubMed] [Green Version]
  70. Ning, P.; Liu, C.; Kang, J.; Lv, J. Genome-Wide Analysis of WRKY Transcription Factors in Wheat (Triticum Aestivum L.) and Differential Expression under Water Deficit Condition. PeerJ 2017, 5, e3232. [Google Scholar] [CrossRef] [PubMed] [Green Version]
  71. Salse, J.; Bolot, S.; Throude, M.; Jouffe, V.; Piegu, B.; Quraishi, U.M.; Calcagno, T.; Cooke, R.; Delseny, M.; Feuillet, C. Identification and Characterization of Shared Duplications between Rice and Wheat Provide New Insight into Grass Genome Evolution. Plant Cell Online 2008, 20, 11–24. [Google Scholar] [CrossRef] [PubMed] [Green Version]
  72. Cannon, S.B.; Mitra, A.; Baumgarten, A.; Young, N.D.; May, G. The Roles of Segmental and Tandem Gene Duplication in the Evolution of Large Gene Families in Arabidopsis Thaliana. BMC Plant Biol 2004, 4, 10. [Google Scholar] [CrossRef] [Green Version]
  73. Magadum, S.; Banerjee, U.; Murugan, P.; Gangapur, D.; Ravikesavan, R. Gene Duplication as a Major Force in Evolution. J. Genet. 2013, 92, 155–161. [Google Scholar] [CrossRef] [PubMed]
  74. Brosius, J. Retroposons—Seeds of Evolution. Science 1991, 251, 753. [Google Scholar] [CrossRef]
  75. Glover, N.M.; Daron, J.; Pingault, L.; Vandepoele, K.; Paux, E.; Feuillet, C.; Choulet, F. Small-Scale Gene Duplications Played a Major Role in the Recent Evolution of Wheat Chromosome 3B. Genome Biol. 2015, 16, 188. [Google Scholar] [CrossRef] [Green Version]
  76. Wicker, T.; Buchmann, J.P.; Keller, B. Patching Gaps in Plant Genomes Results in Gene Movement and Erosion of Colinearity. Genome Res. 2010, 20, 1229–1237. [Google Scholar] [CrossRef] [PubMed] [Green Version]
  77. Gagne, J.M.; Downes, B.P.; Shiu, S.-H.; Durski, A.M.; Vierstra, R.D. The F-Box Subunit of the SCF E3 Complex Is Encoded by a Diverse Superfamily of Genes in Arabidopsis. Proc. Natl. Acad. Sci. USA 2002, 99, 11519–11524. [Google Scholar] [CrossRef] [Green Version]
  78. Dinant, S.; Clark, A.M.; Zhu, Y.; Vilaine, F.; Palauqui, J.-C.; Kusiak, C.; Thompson, G.A. Diversity of the Superfamily of Phloem Lectins (Phloem Protein 2) in Angiosperms. Plant Physiol. 2003, 131, 114–128. [Google Scholar] [CrossRef] [PubMed] [Green Version]
  79. Akhunov, E.D.; Goodyear, A.W.; Geng, S.; Qi, L.-L.; Echalier, B.; Gill, B.S.; Miftahudin; Gustafson, J.P.; Lazo, G.; Chao, S.; et al. The Organization and Rate of Evolution of Wheat Genomes Are Correlated With Recombination Rates Along Chromosome Arms. Genome Res. 2003, 13, 753–763. [Google Scholar] [CrossRef] [Green Version]
  80. Ramírez-González, R.H.; Borrill, P.; Lang, D.; Harrington, S.A.; Brinton, J.; Venturini, L.; Davey, M.; Jacobs, J.; van Ex, F.; Pasha, A.; et al. The Transcriptional Landscape of Polyploid Wheat. Science 2018, 361, eaar6089. [Google Scholar] [CrossRef] [Green Version]
  81. Okonechnikov, K.; Golosova, O.; Fursov, M.; UGENE team. Unipro UGENE: A Unified Bioinformatics Toolkit. Bioinformatics 2012, 28, 1166–1167. [Google Scholar] [CrossRef] [Green Version]
  82. Katoh, K.; Rozewicki, J.; Yamada, K.D. MAFFT Online Service: Multiple Sequence Alignment, Interactive Sequence Choice and Visualization. Brief Bioinform. 2019, 20, 1160–1166. [Google Scholar] [CrossRef] [PubMed] [Green Version]
  83. Price, M.N.; Dehal, P.S.; Arkin, A.P. FastTree 2—Approximately Maximum-Likelihood Trees for Large Alignments. PLoS ONE 2010, 5, e9490. [Google Scholar] [CrossRef]
  84. Letunic, I.; Bork, P. Interactive Tree Of Life (ITOL) v4: Recent Updates and New Developments. Nucleic Acids Res. 2019, 47, W256–W259. [Google Scholar] [CrossRef] [Green Version]
  85. Gel, B.; Serra, E. KaryoploteR: An R/Bioconductor Package to Plot Customizable Genomes Displaying Arbitrary Data. Bioinformatics 2017, 33, 3088–3090. [Google Scholar] [CrossRef]
  86. Noé, L.; Kucherov, G. YASS: Enhancing the Sensitivity of DNA Similarity Search. Nucleic Acids Res. 2005, 33, W540–W543. [Google Scholar] [CrossRef] [PubMed] [Green Version]
  87. Ritchie, M.E.; Phipson, B.; Wu, D.; Hu, Y.; Law, C.W.; Shi, W.; Smyth, G.K. Limma Powers Differential Expression Analyses for RNA-Sequencing and Microarray Studies. Nucleic Acids Res. 2015, 43, e47. [Google Scholar] [CrossRef]
Figure 1. TaFBX gene excess and deficit among the 21 wheat chromosomes. The gene excess or deficit was calculated as a subtraction of the observed TaFBX number from the expected one.
Ijms 22 03111 g001
Figure 2. Chromosomal distribution of the TaFBX gene family on the bread wheat genome. Each red dash represents a TaFBX gene. Blue arrows highlight five chromosomal portions in the peripheral regions without any TaFBX genes, bordered by two regions rich in TaFBX genes.
Ijms 22 03111 g002
Figure 3. TaFBX gene enrichment or deficit among the five chromosomal regions of the three bread wheat subgenomes. The excess or deficit was calculated for each chromosomal region by the subtraction of the observed TaFBX number from the theoretical one.
Ijms 22 03111 g003
Figure 4. Excess and deficit of the eight major TaFBX gene subfamilies among the five chromosomal regions. The excess or deficit was calculated as a subtraction of the observed TaFBX number Figure 1. orange for R2a, grey for C, green for R2b and red for R3).
Ijms 22 03111 g004
Figure 5. Chromosomal density of TaFBX genes with no orthologs identified in 18 plant species. The TaFBX density is presented along chromosomal regions (blue for R1, orange for R2a, grey for C, green for R2b and red for R3) for each chromosome of the A, B and D subgenomes.
Ijms 22 03111 g005
Figure 6. Phylogenetic tree of the 3565 TaFBX mapped on the wheat pseudomolecule. The tree was built using alignment of protein sequences. Using iTOL, each branch of this tree was annotated and colored according to the chromosomal region the gene originated from (blue for R1, orange for R2a, grey for C, green for R2b and red for R3). The branch length was not proportional to the parental degree. The right panel presents a zoom on a particular clade of the phylogenetic tree, where two specific clades are framed by a green or a blue box.
Ijms 22 03111 g006
Figure 7. Evolutive study of a subregion of the chromosome 3B-R3 region (in red, on the top). We focused on a 3 Mb subregion, containing 33 genes including 15 TaFBX. The right region covers 1.09 Mb and carries 16 genes including seven TaFBX genes; whereas 17 genes (including eight TaFBX) are carried by the 1.96 Mb left region. Using the ortholog groups defined by OrthoFinder, the TaFBX genes belonging to the same group were colored with the same color. Their protein sequences were analyzed using Pfam and their domains were specified along with their truncated names (i.e., “G499800” means “TraesCS3B02G499800”). The red lines on the bottom part represent direct duplications and the blue ones represent reverse duplications.
Ijms 22 03111 g007
Figure 8. Phylogenetic tree of the 21 genes containing a FBD domain (red box) and/or a F-box domain (green circle), and their physical distribution on a 3 Mb part of the chromosome 3B-R3 region. The different clades are delimited by various colors, reported onto the physical map to identify their spatial organization.
Ijms 22 03111 g008
Table 1. Distribution of the TaFBX genes among 17 subfamilies, in view of the presence of the F-box domain and other FBX-specific domains. The FBX-only subfamily carries only the F-box domain. The “Other” subfamily contains TaFBX genes with rarely observed domains.
Subfamily (Subdomain Contained by their TaFBX Members)Number of TaFBX Genes
ACTIN (Plant actin-related protein 8, IPR030071)3
ARM (Armadillo, IPR000225)10
DUF (Domain unknown function DUF295)234
FBA (F-box associated domain, IPR007397)143
FBD (FBD domain, IPR006566)359
FBX-only (F-box domain, IPR001810)2475
Jmjc (Jmjc domain, IPR003347)9
Kelch (Galactose oxidase/kelch, beta-propeller, IPR011043 or Kelch-type beta propeller, IPR015915)203
LRR (Leucine-rich repeat, IPR001611)53
LysM (LysM domain, IPR018392)3
Other (various domains described in Table S1)41
PP2 (Phloem protein 2-like, IPR025886)67
QAD (Quinoprotein amine dehydrogenase, beta chain-like, IPR011044)17
SEL1 (Sell-like repeat, IPR006597)3
TUB (Tubby, C-terminal, IPR000007)31
WD40 (WD40 repeat, IPR001680)14
zf_MYND (Zinc finger, MYND-type, IPR002893)5
Total3670
Table 2. Distribution of TaFBX DEGs during embryogenesis and endosperm development, according to their anchorage on chromosomal regions (X-squared test = 20.938, df = 5, p-value = 0.0008322).
Chromosomal RegionNumber of Genes in the Whole TaFBX FamilyTheroretical TaFBX DEGsObserved TaFBX DEGs
Number%Number%
R1643211.3017.517614.6
R2a637209.3217.423619.6
C7624.972.1342.8
R2b662217.541825521.2
R31518498.8341.448640.4
Unanchored13444.033.7171.4
Total36701206100%1206100%
Table 3. Comparison of the observed and theoretical distributions of the TaFBX genes responding to abiotic stress according to their anchorage in the chromosomal regions (X-squared test = 46.212, df = 5, p-value = 8.222 × 10⁻⁹).
Chromosomal RegionTheroretical TaFBX DEGsObserved TaFBX DEGs
Number%Number%
R19217.5458.6
R2a91.117.411521.9
C10.92.1224.2
R2b94.71816030.5
R3217.241.416932.2
U19.23.7142.7
Total525100%525100%
Publisher’s Note: MDPI stays neutral with regard to jurisdictional claims in published maps and institutional affiliations.