
Effect of MgCl2 and GdCl3 on ORAI1 Expression and Store-Operated Ca2+ Entry in Megakaryocytes

 , ,
, ,
Abstract
:1. Introduction
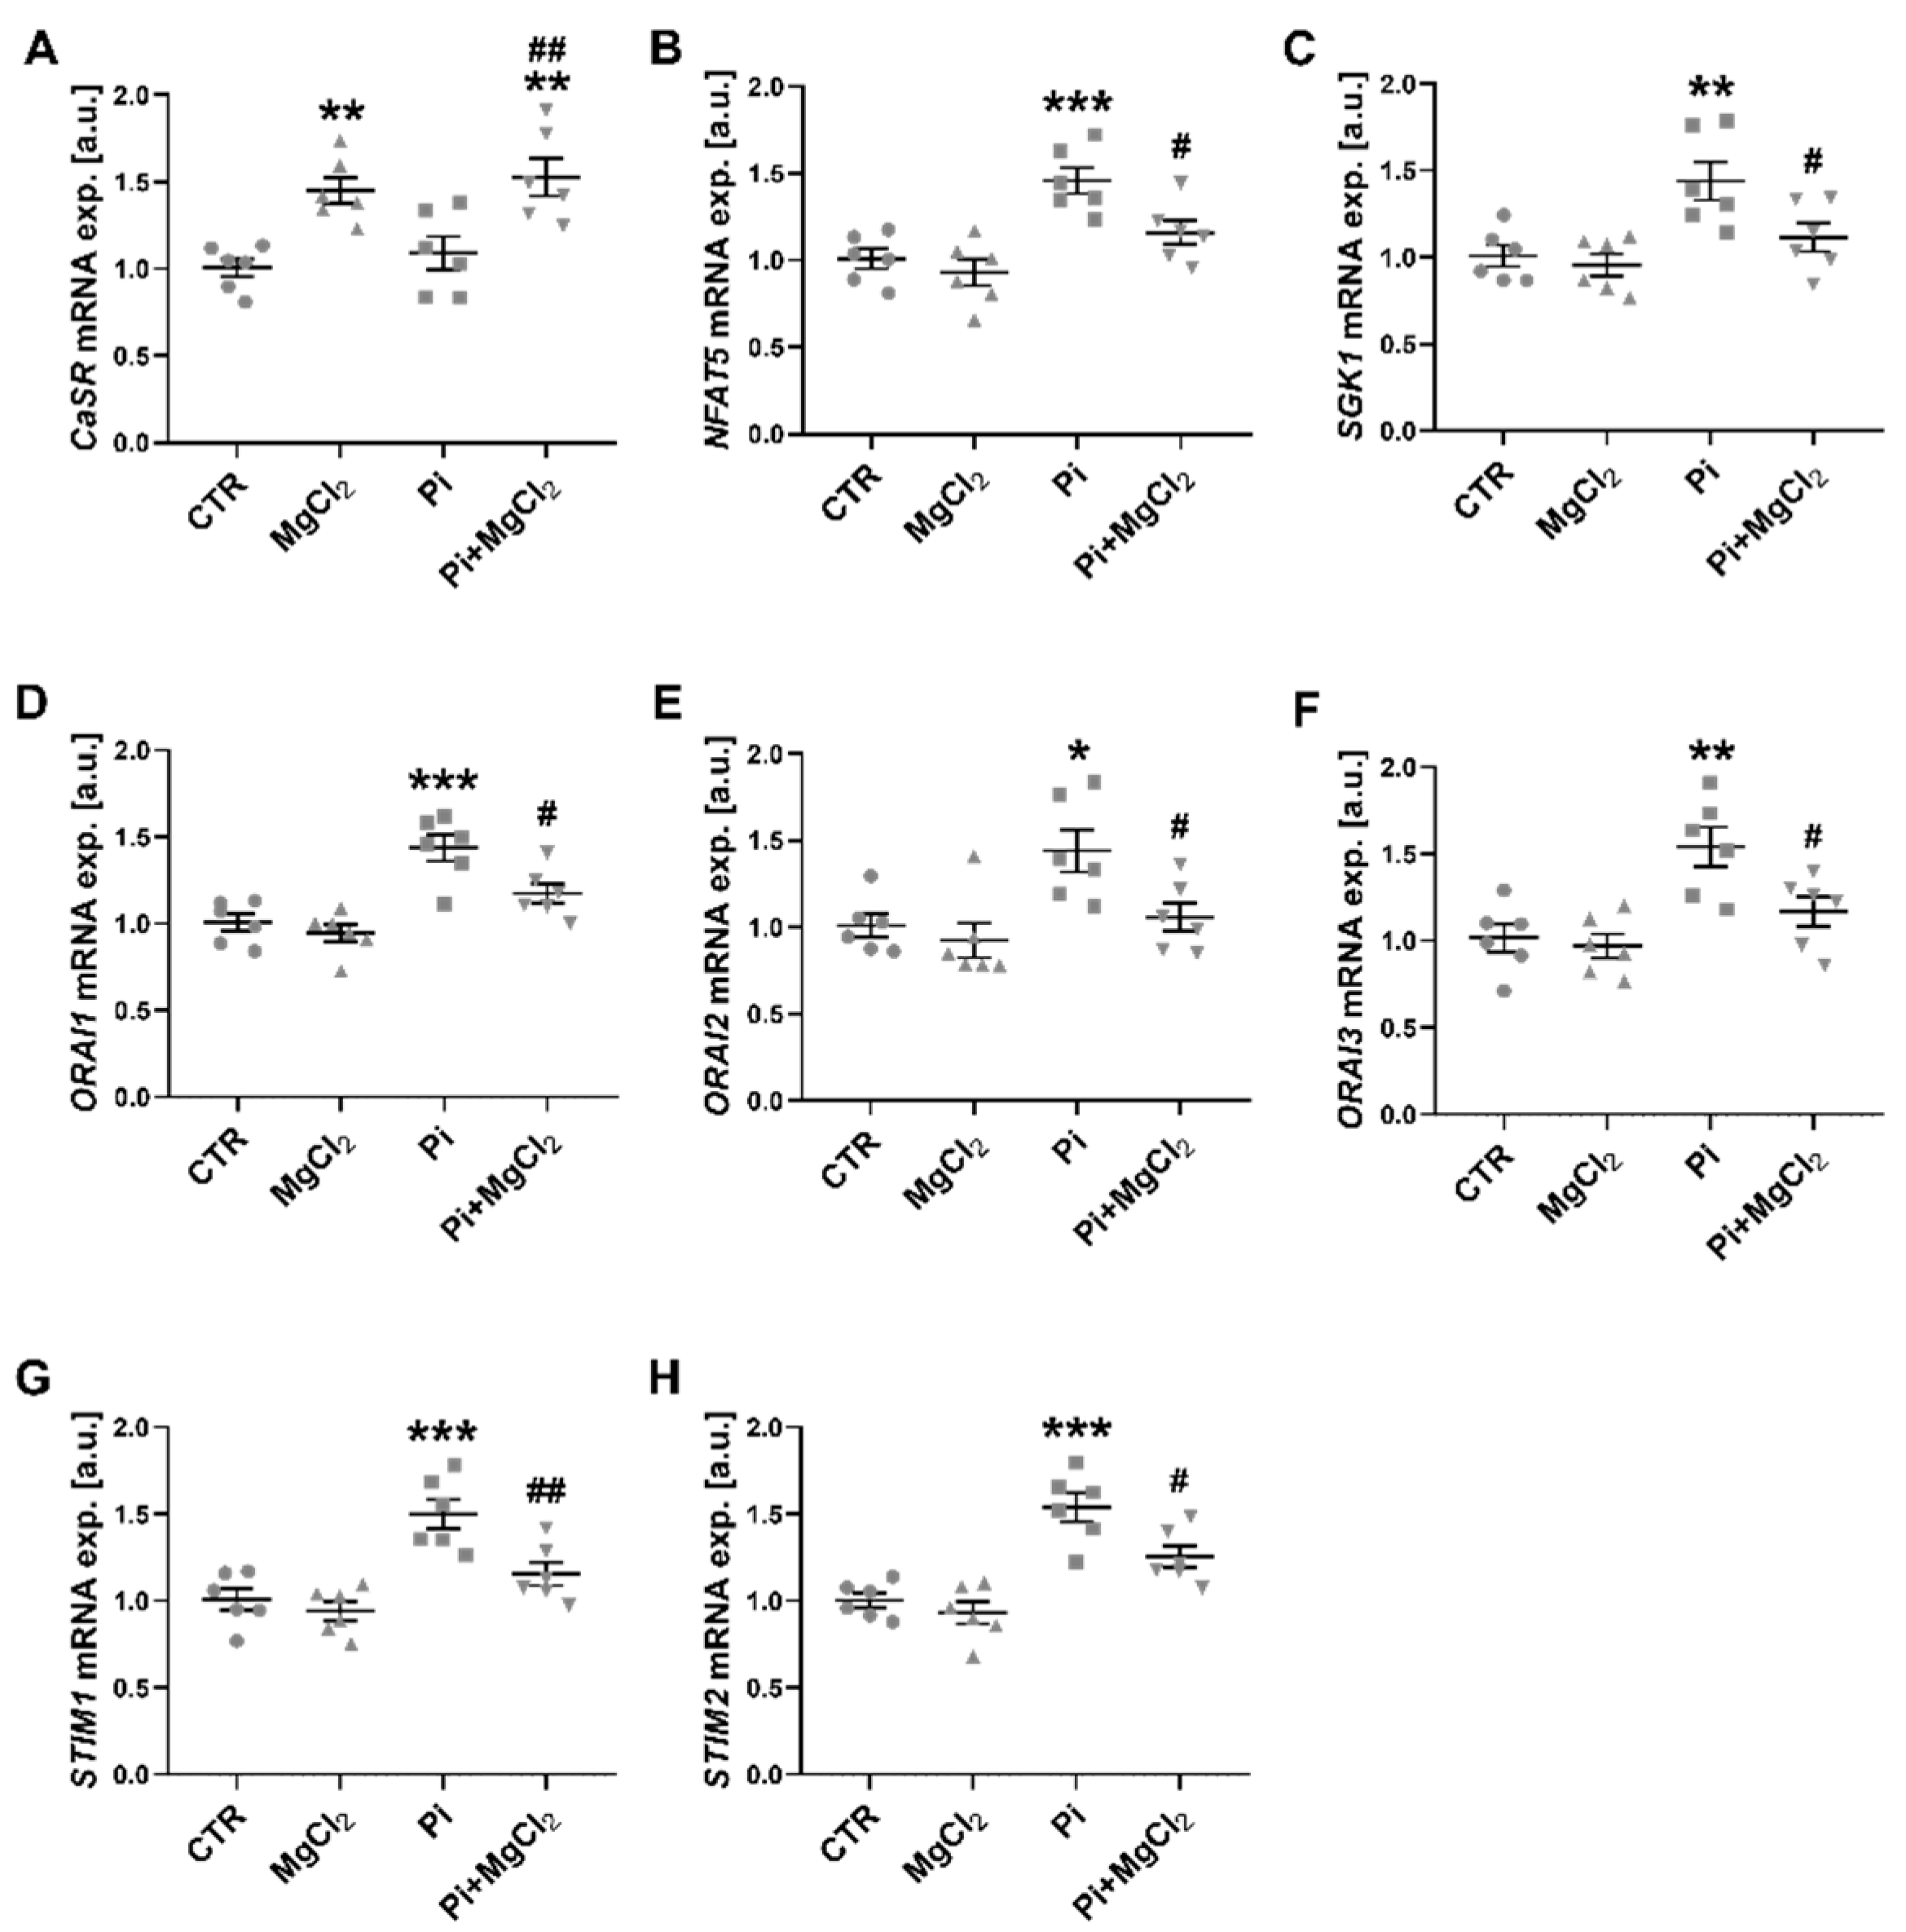
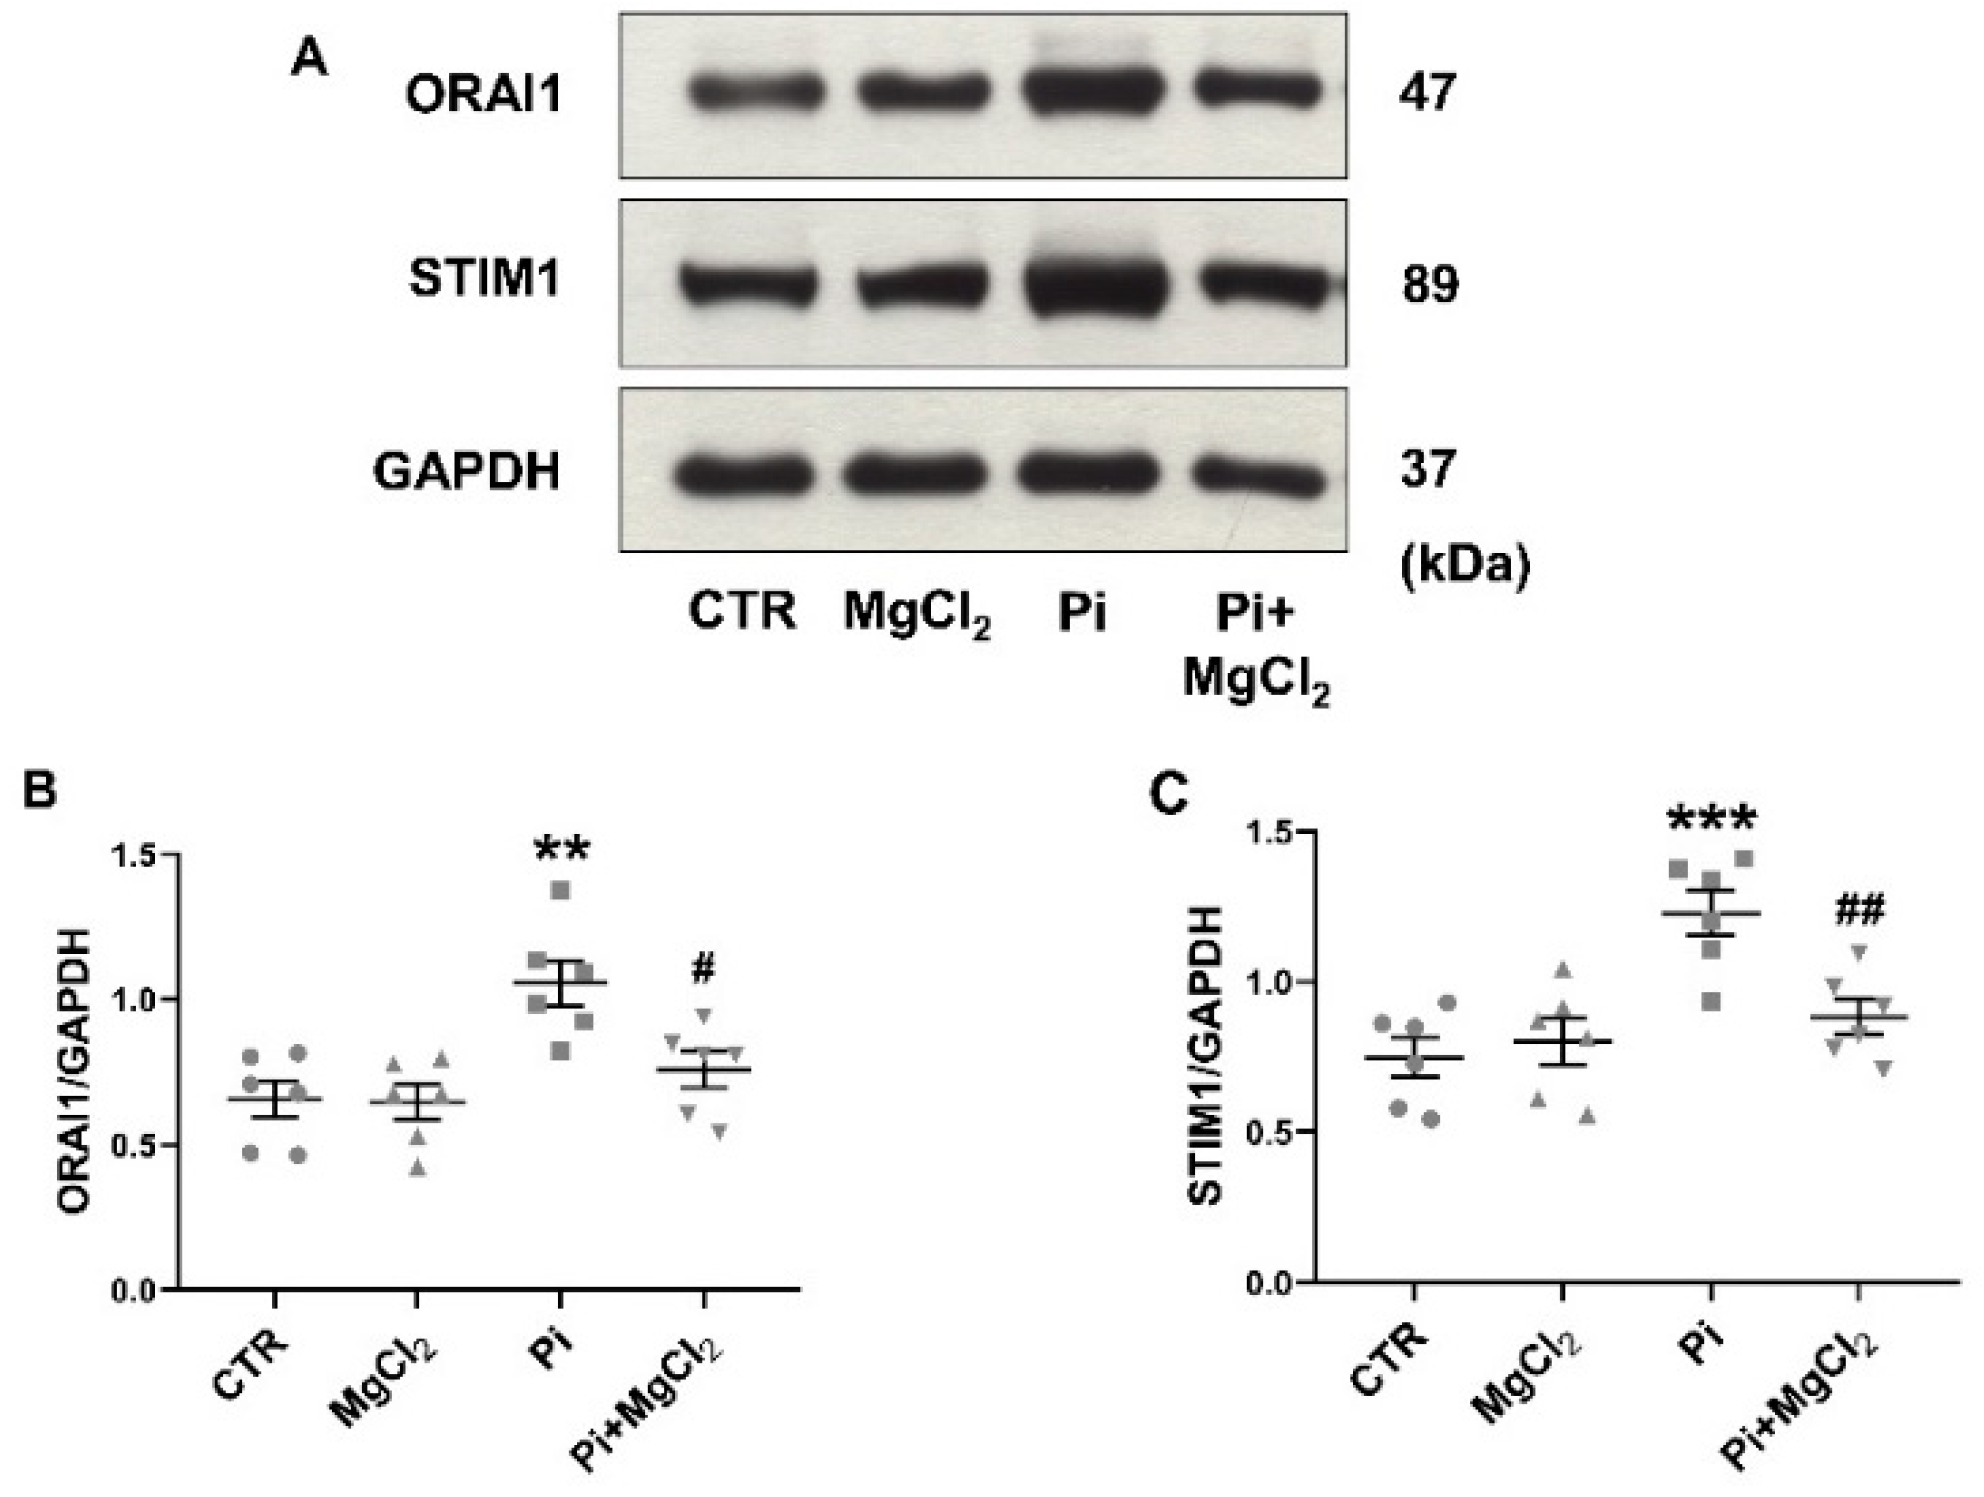
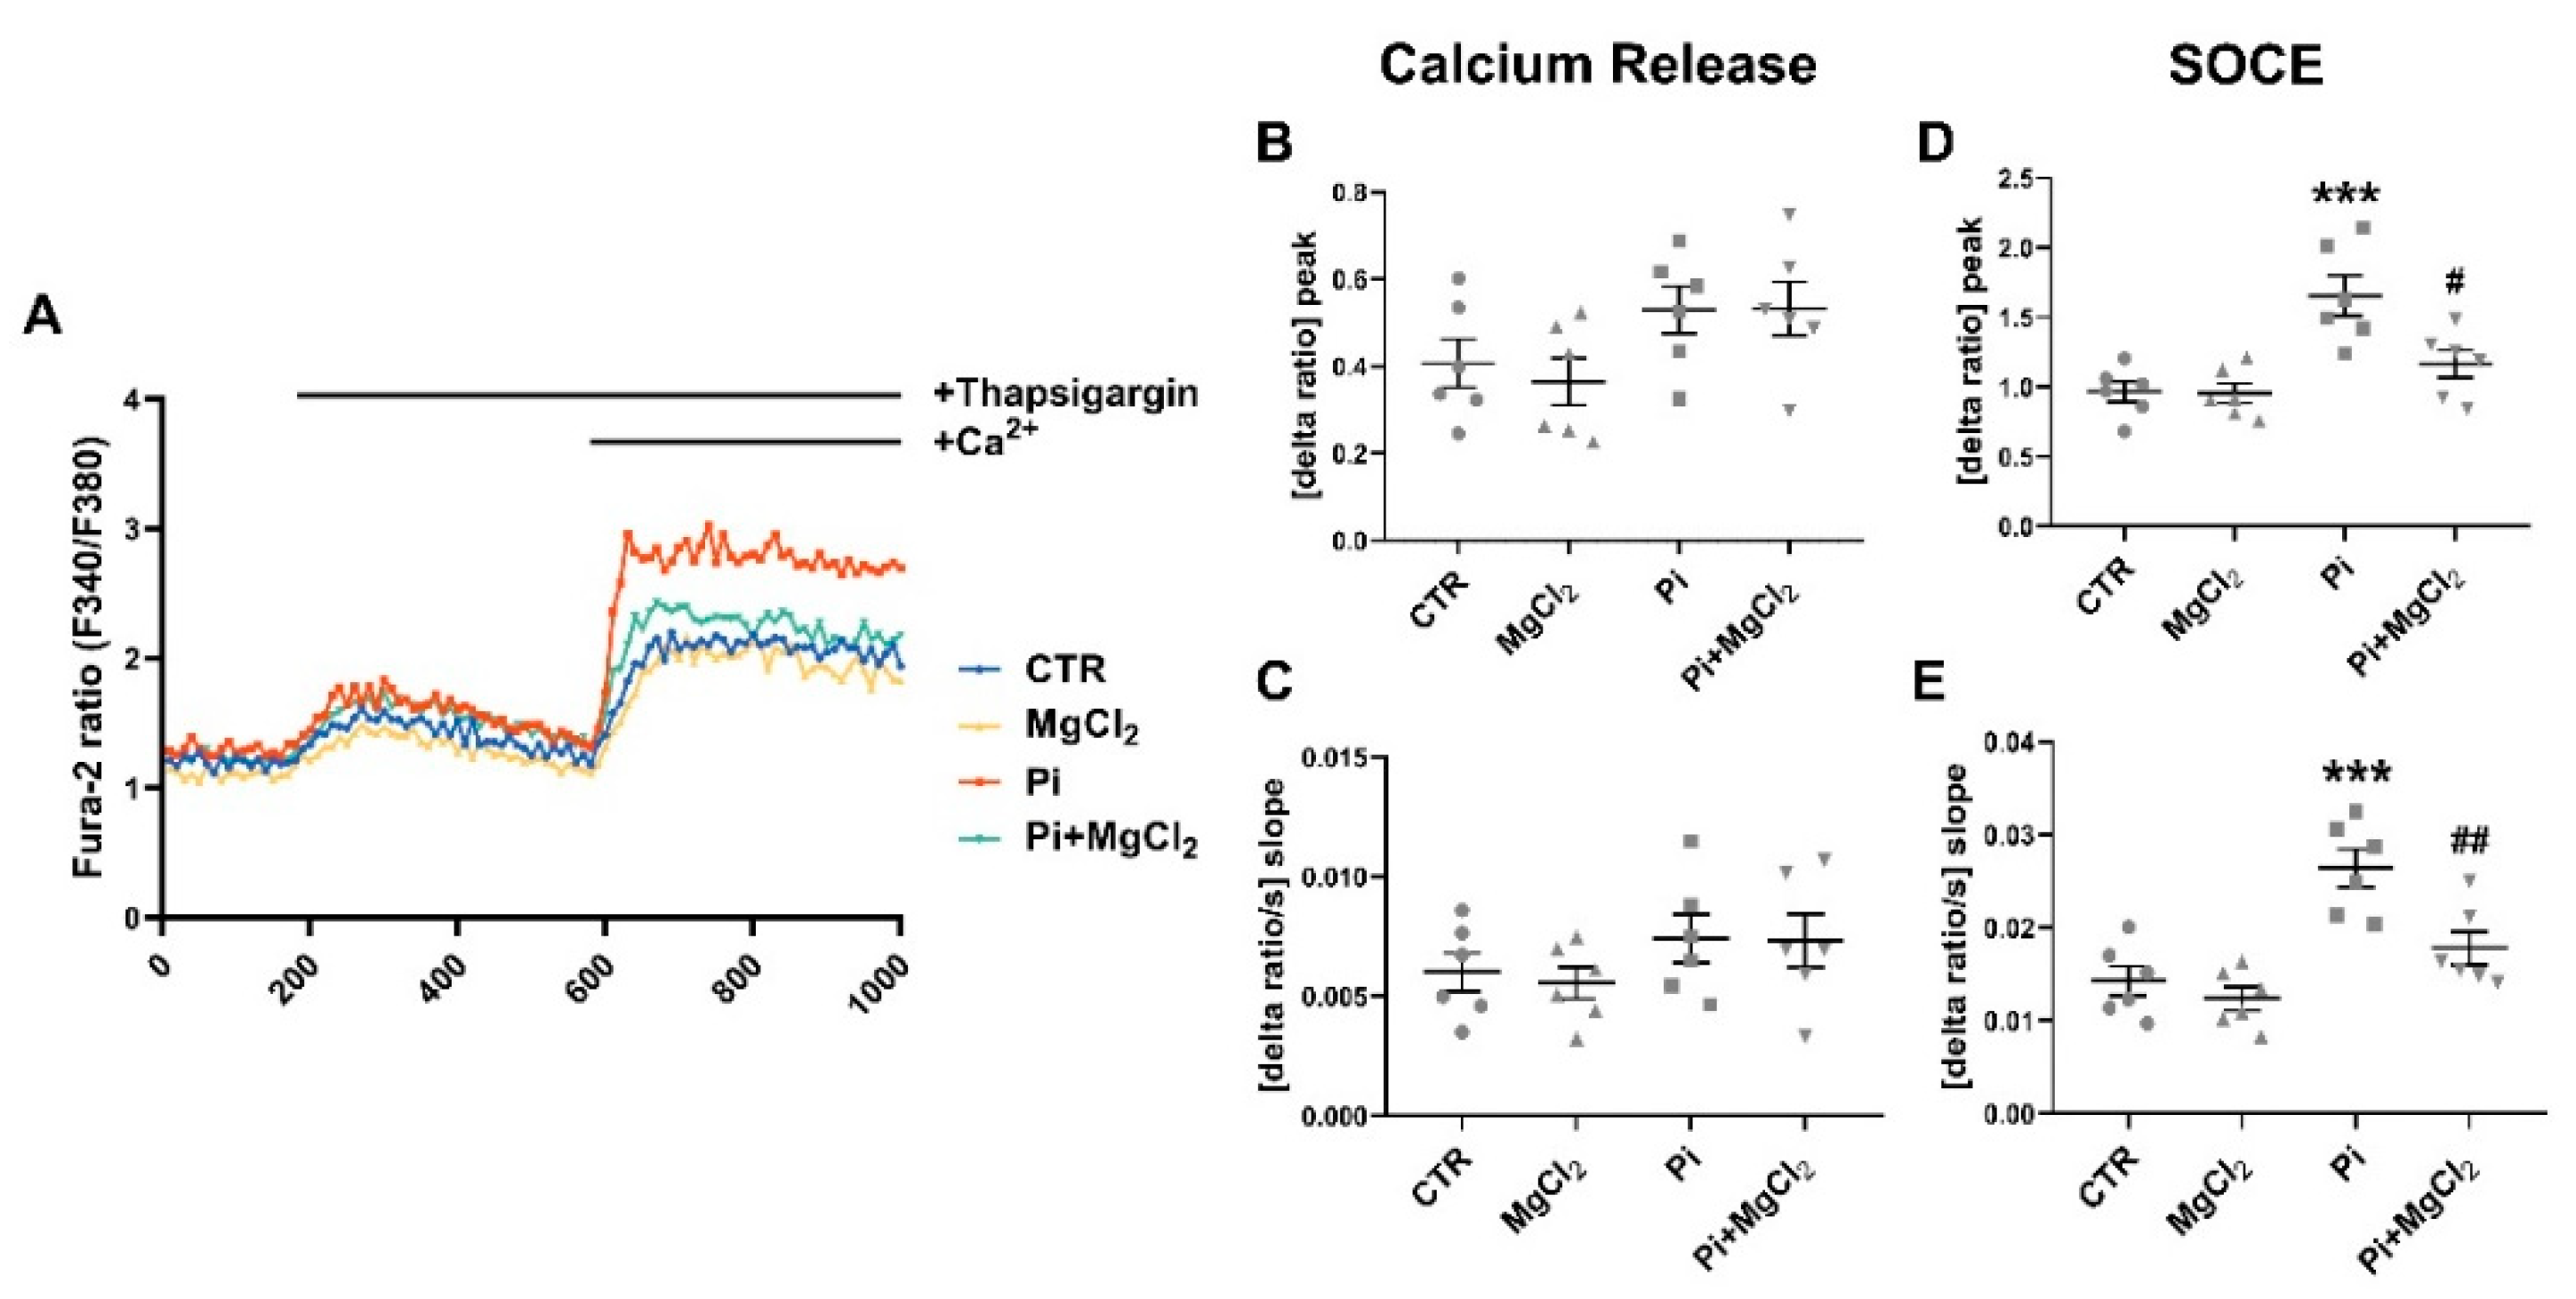
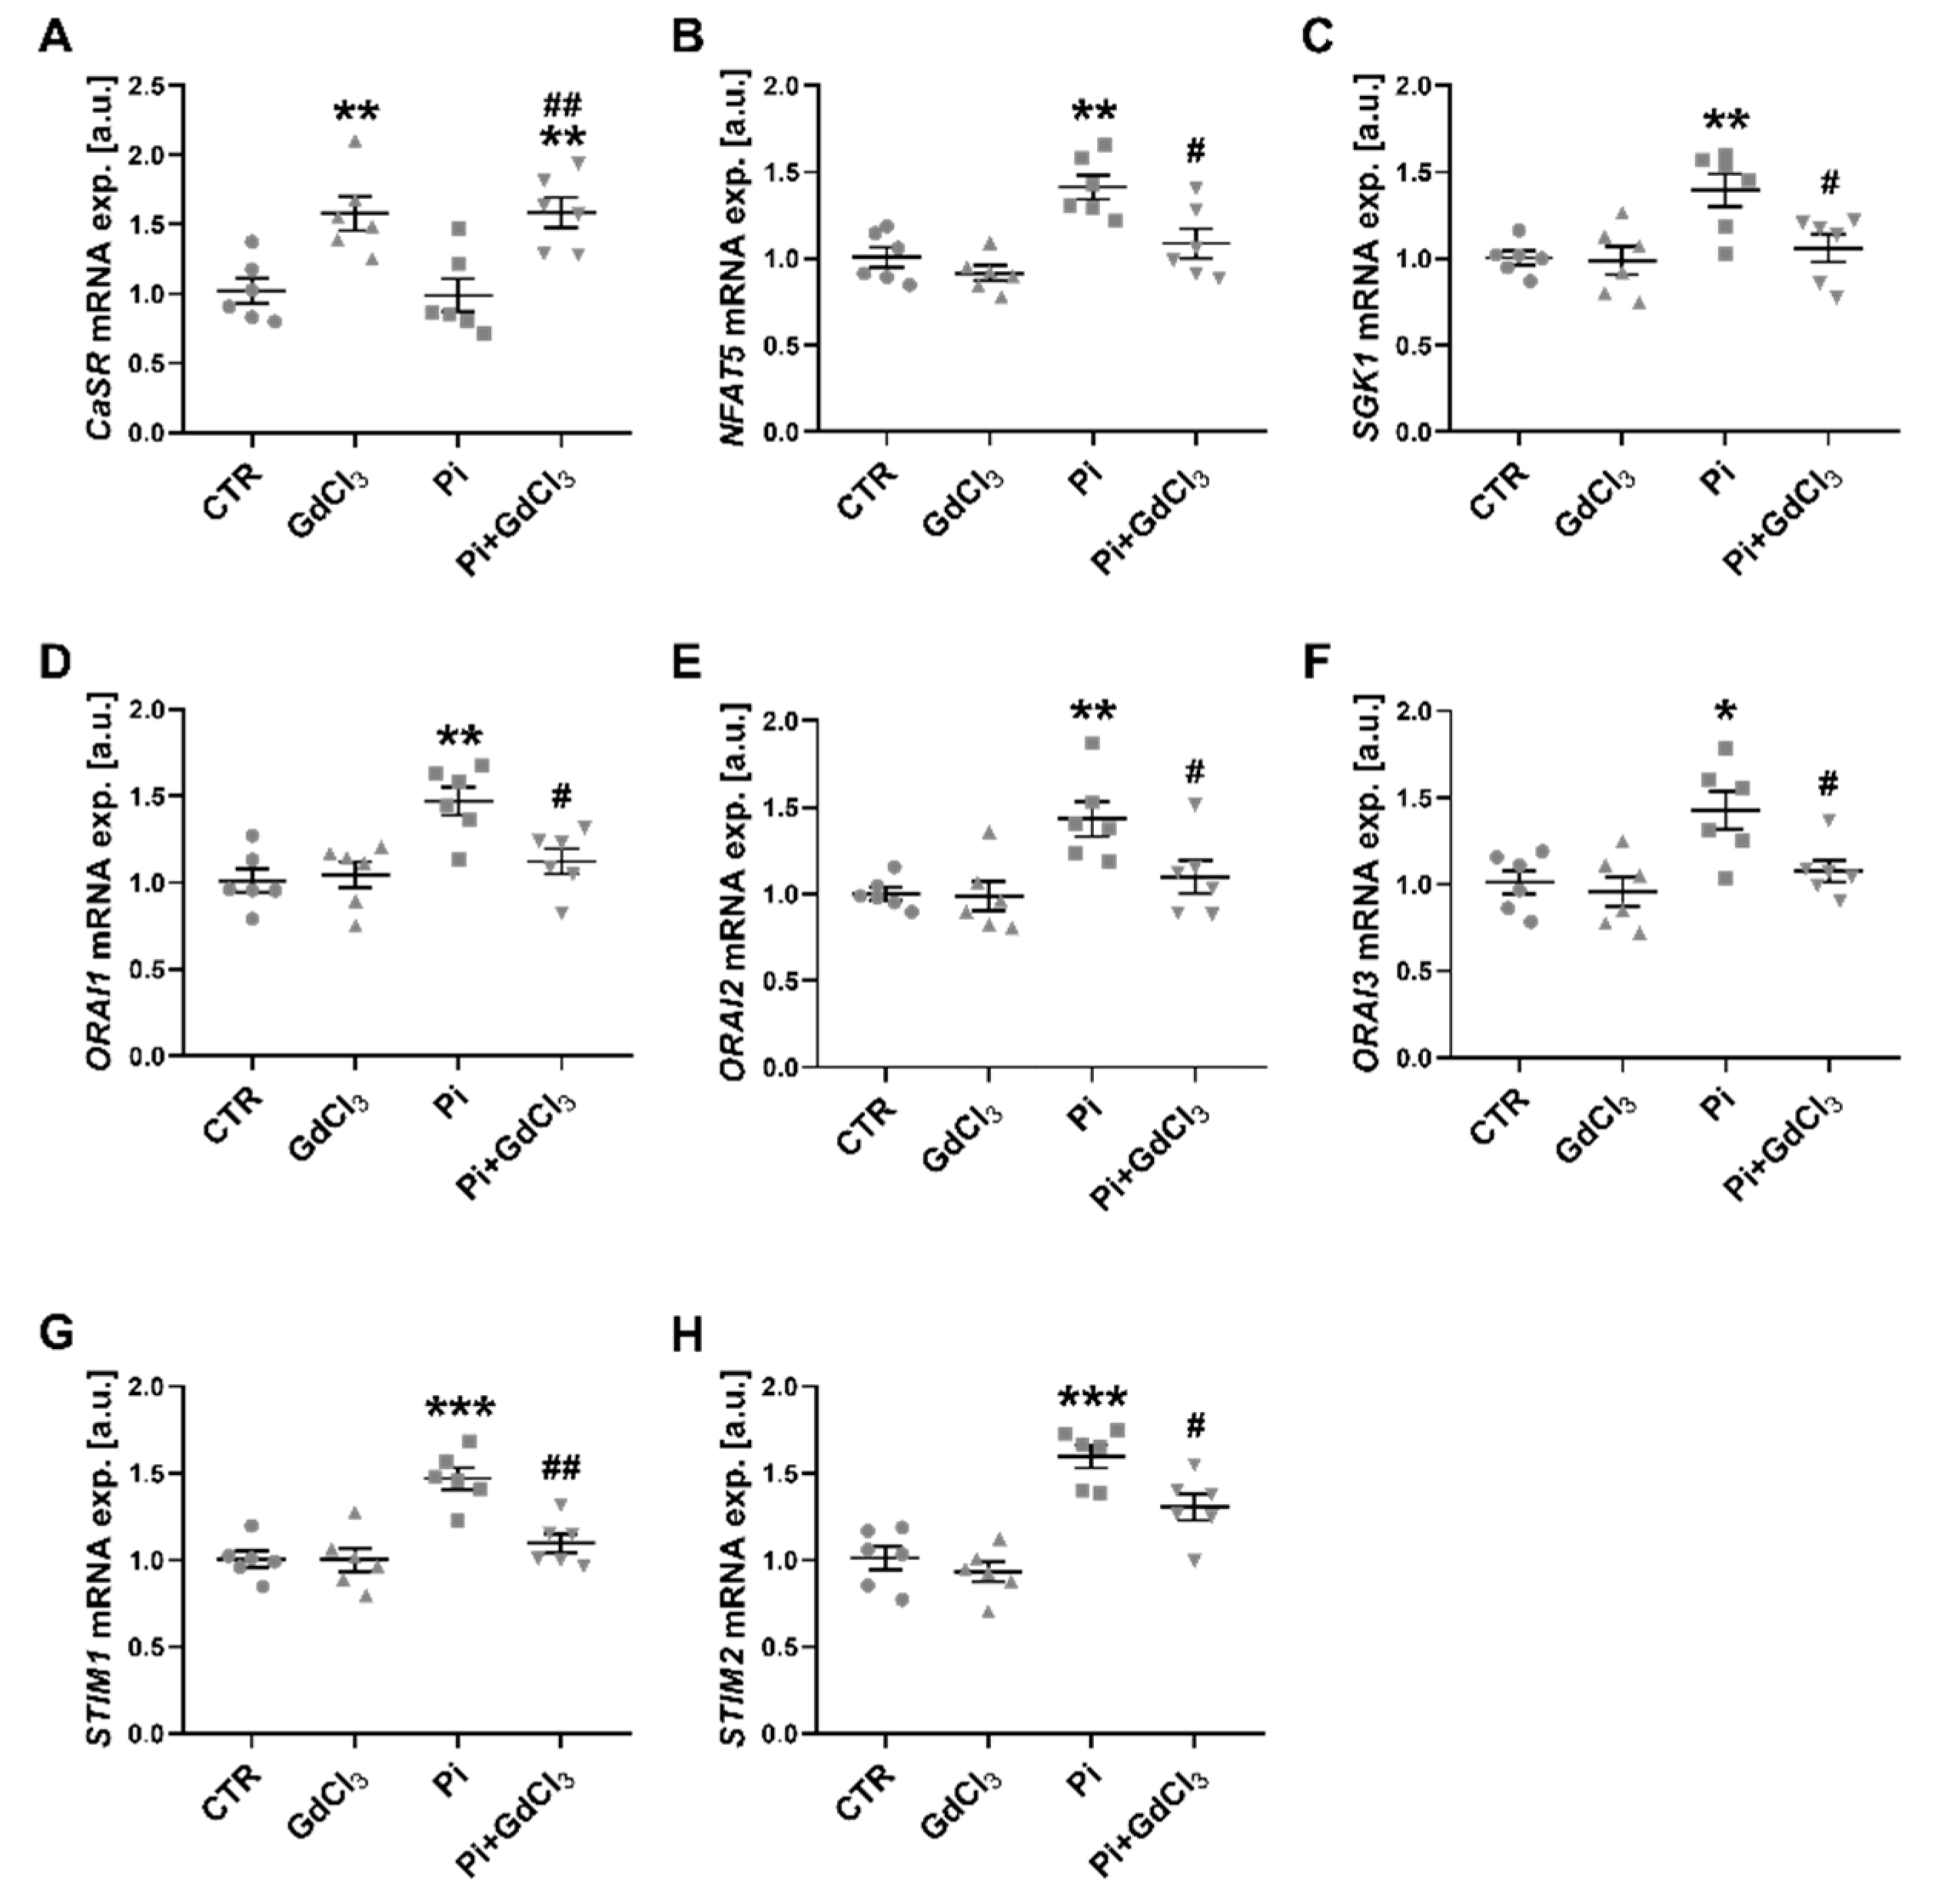
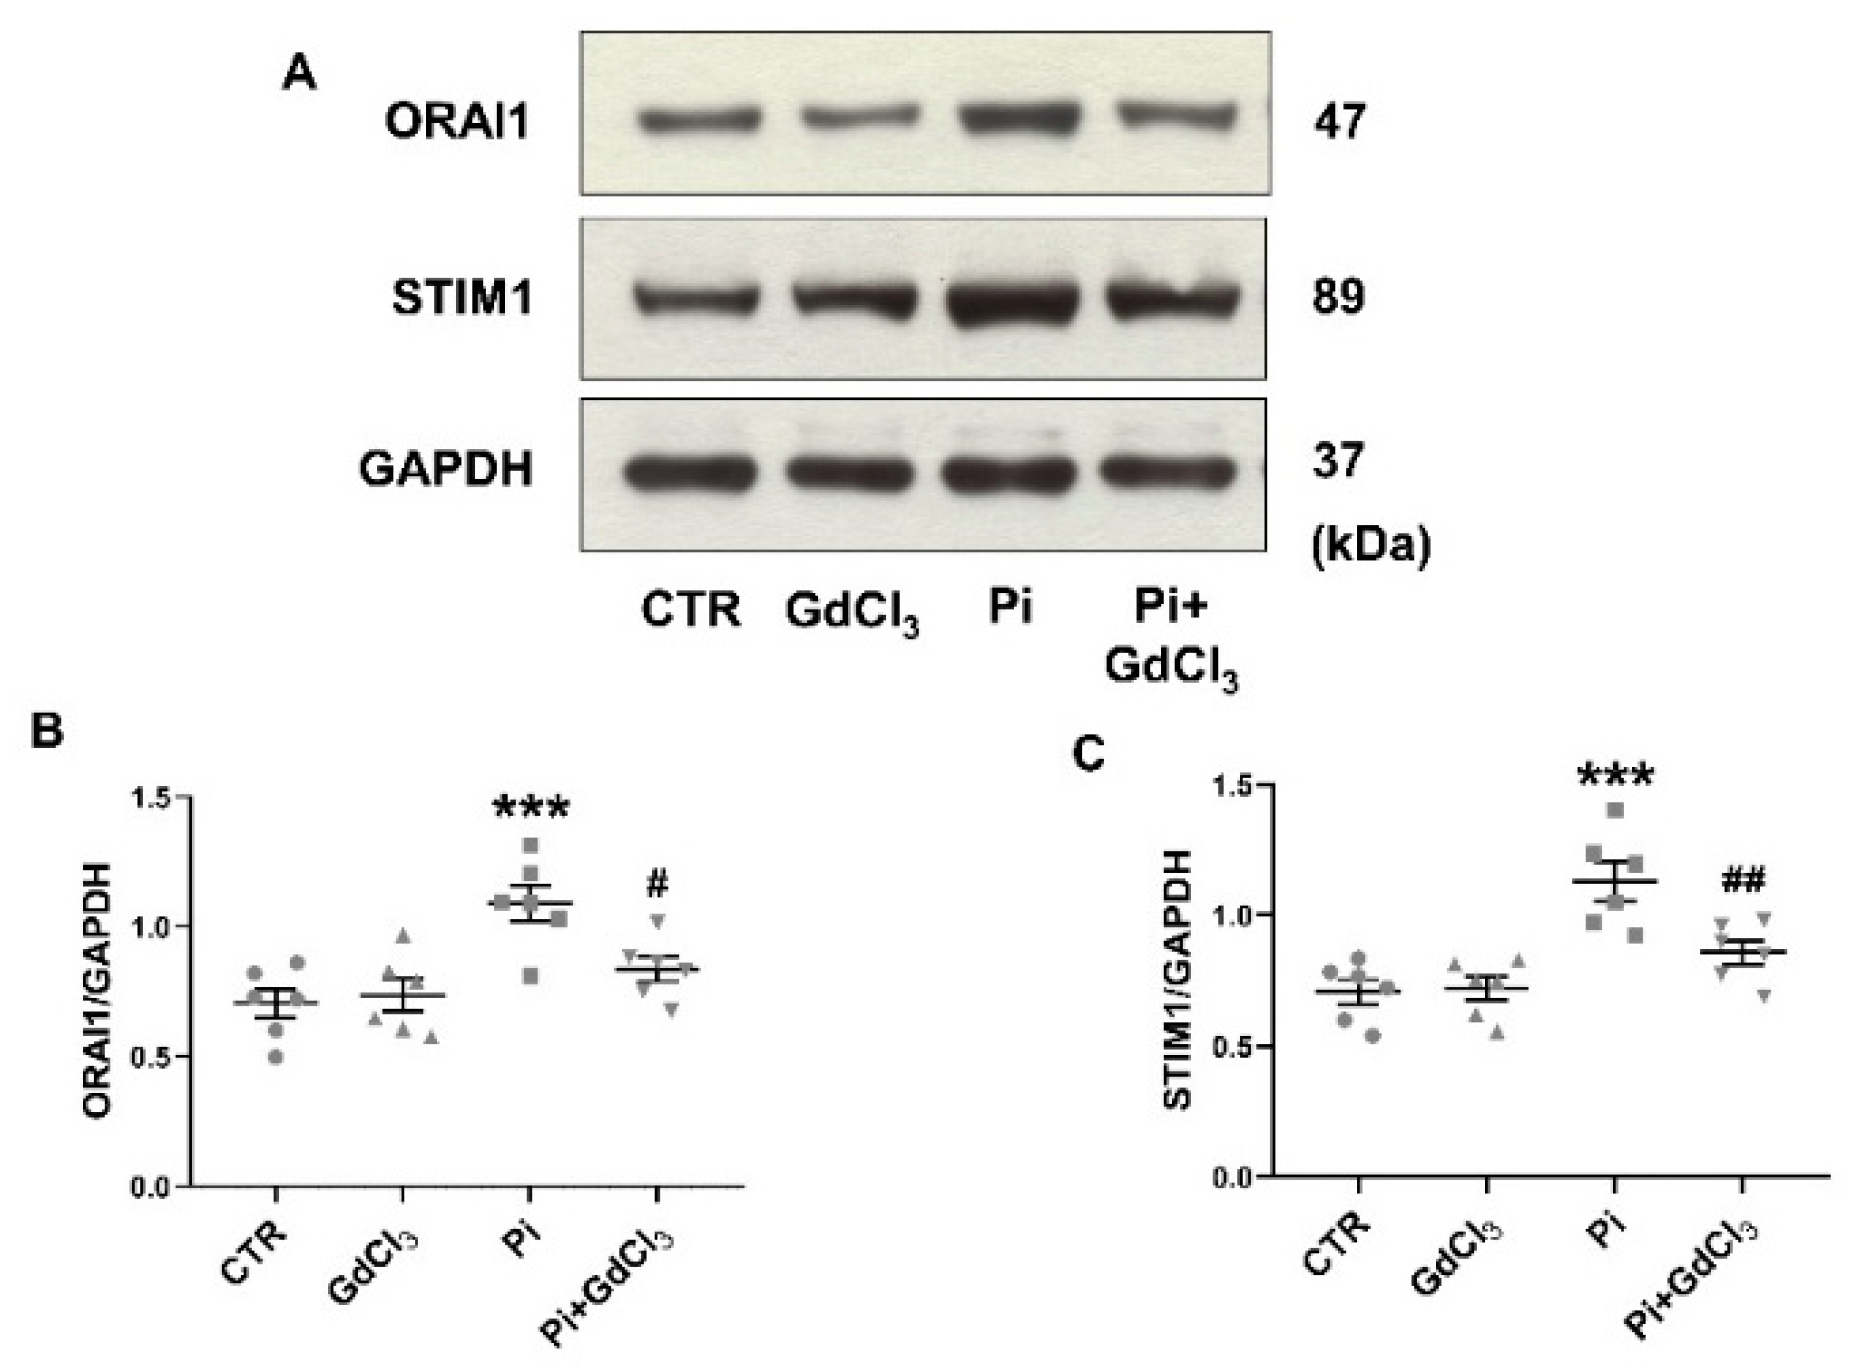
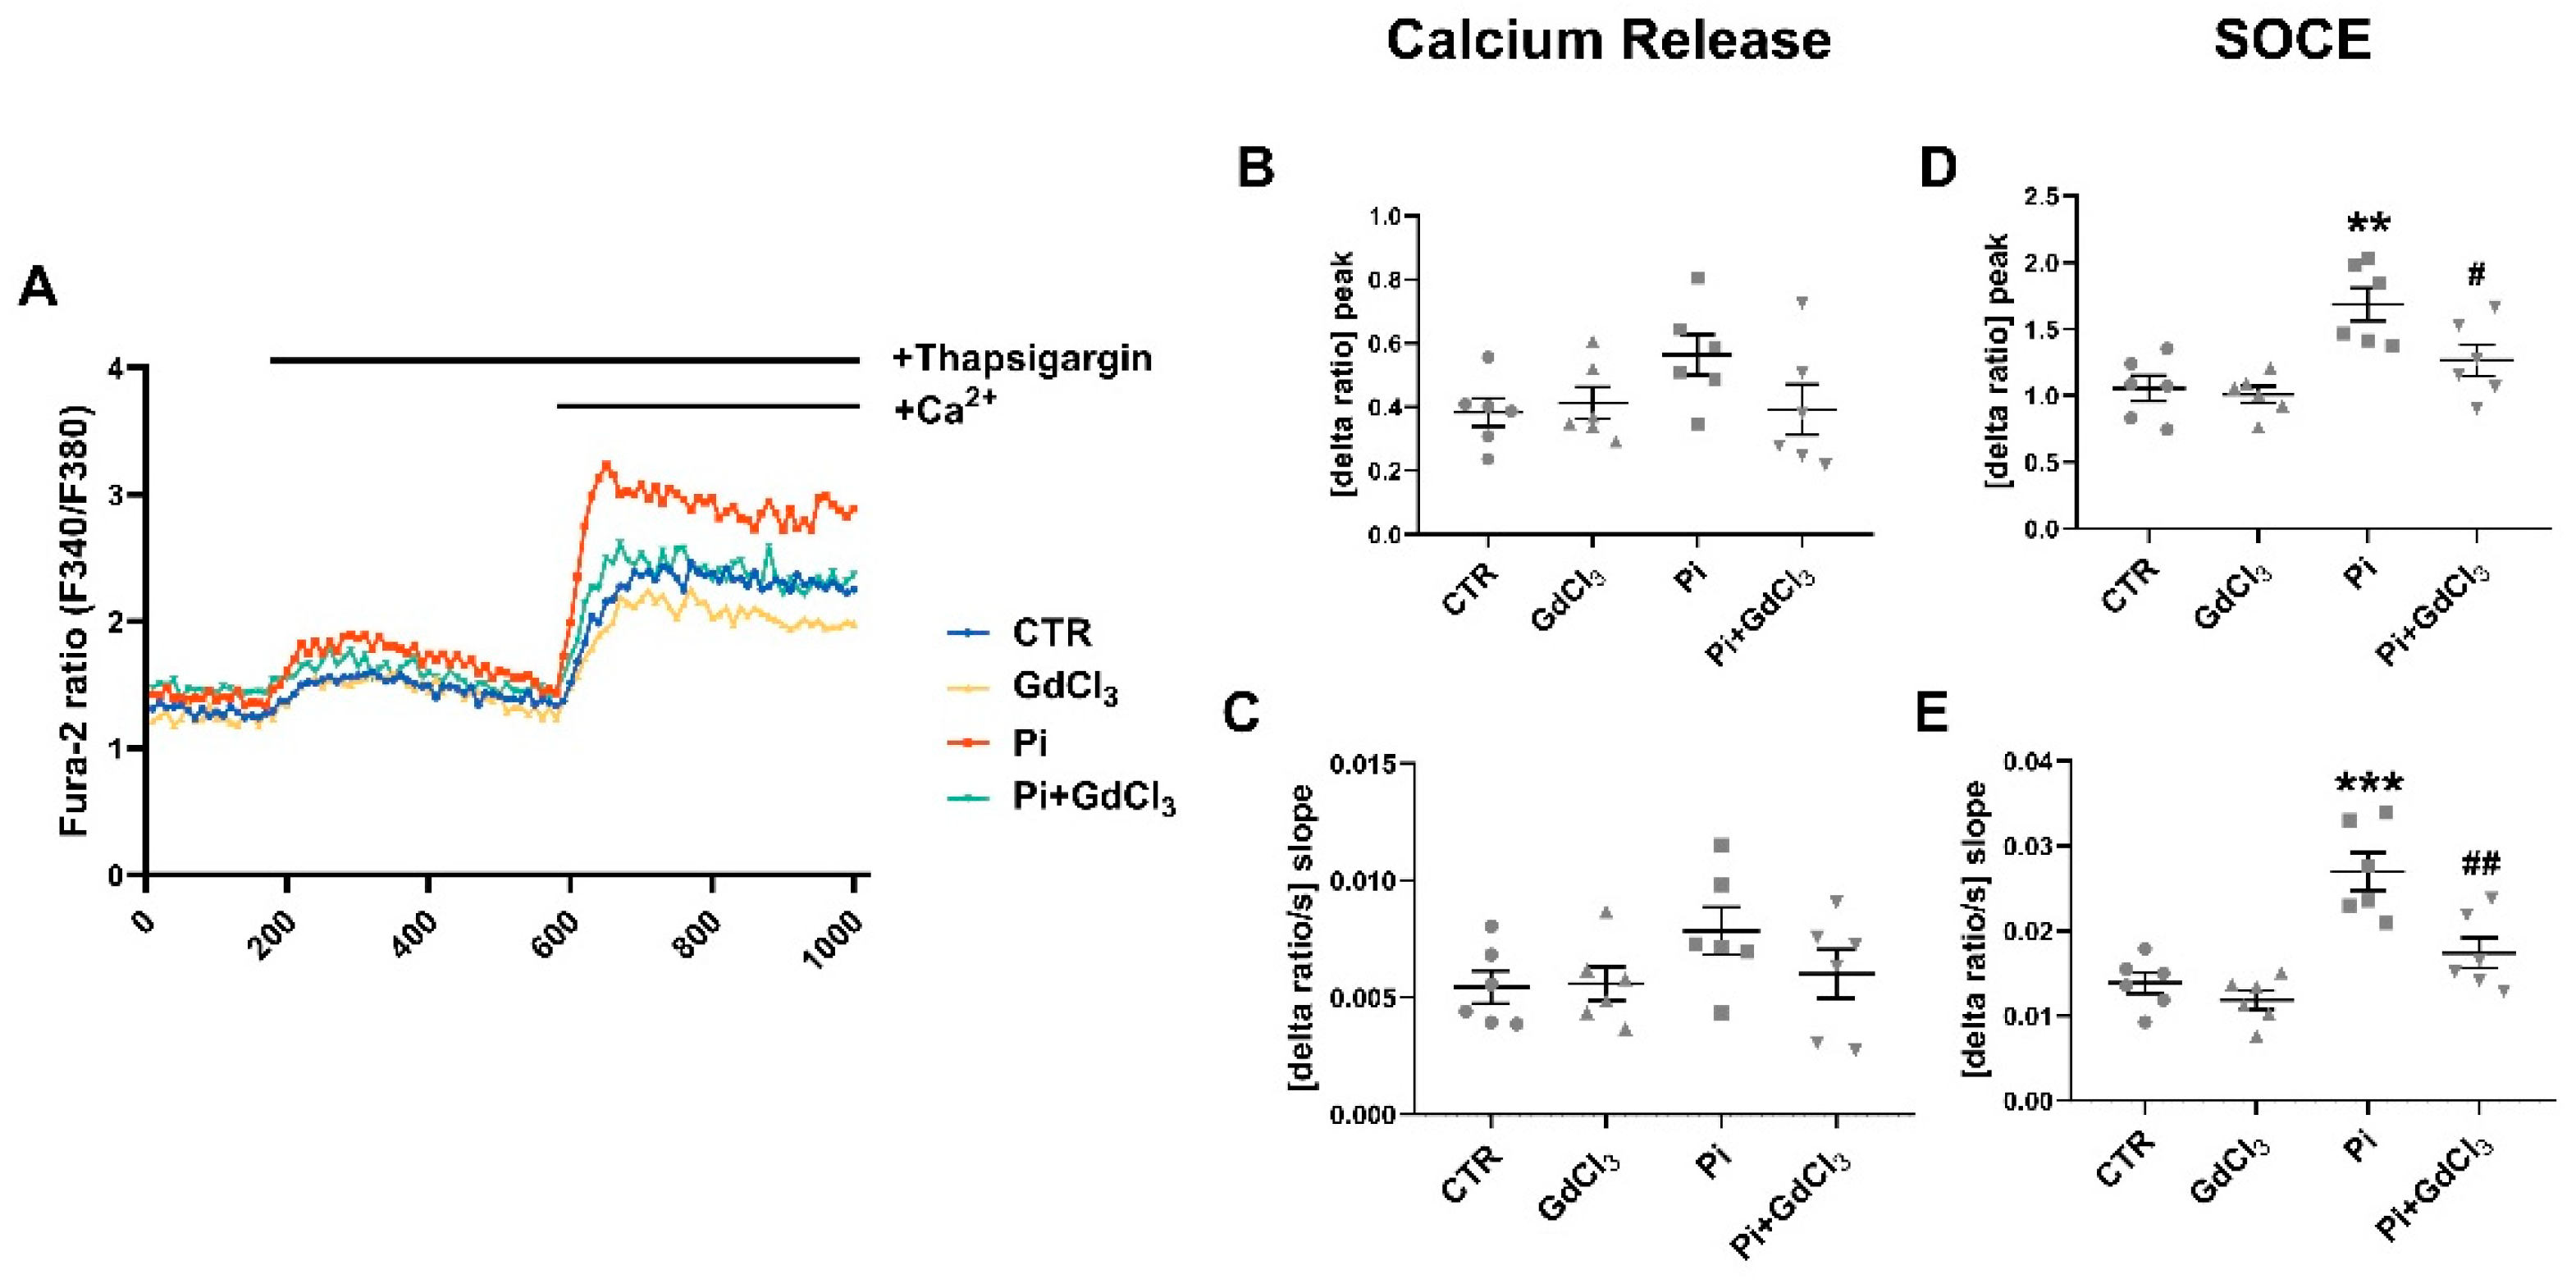
2. Results
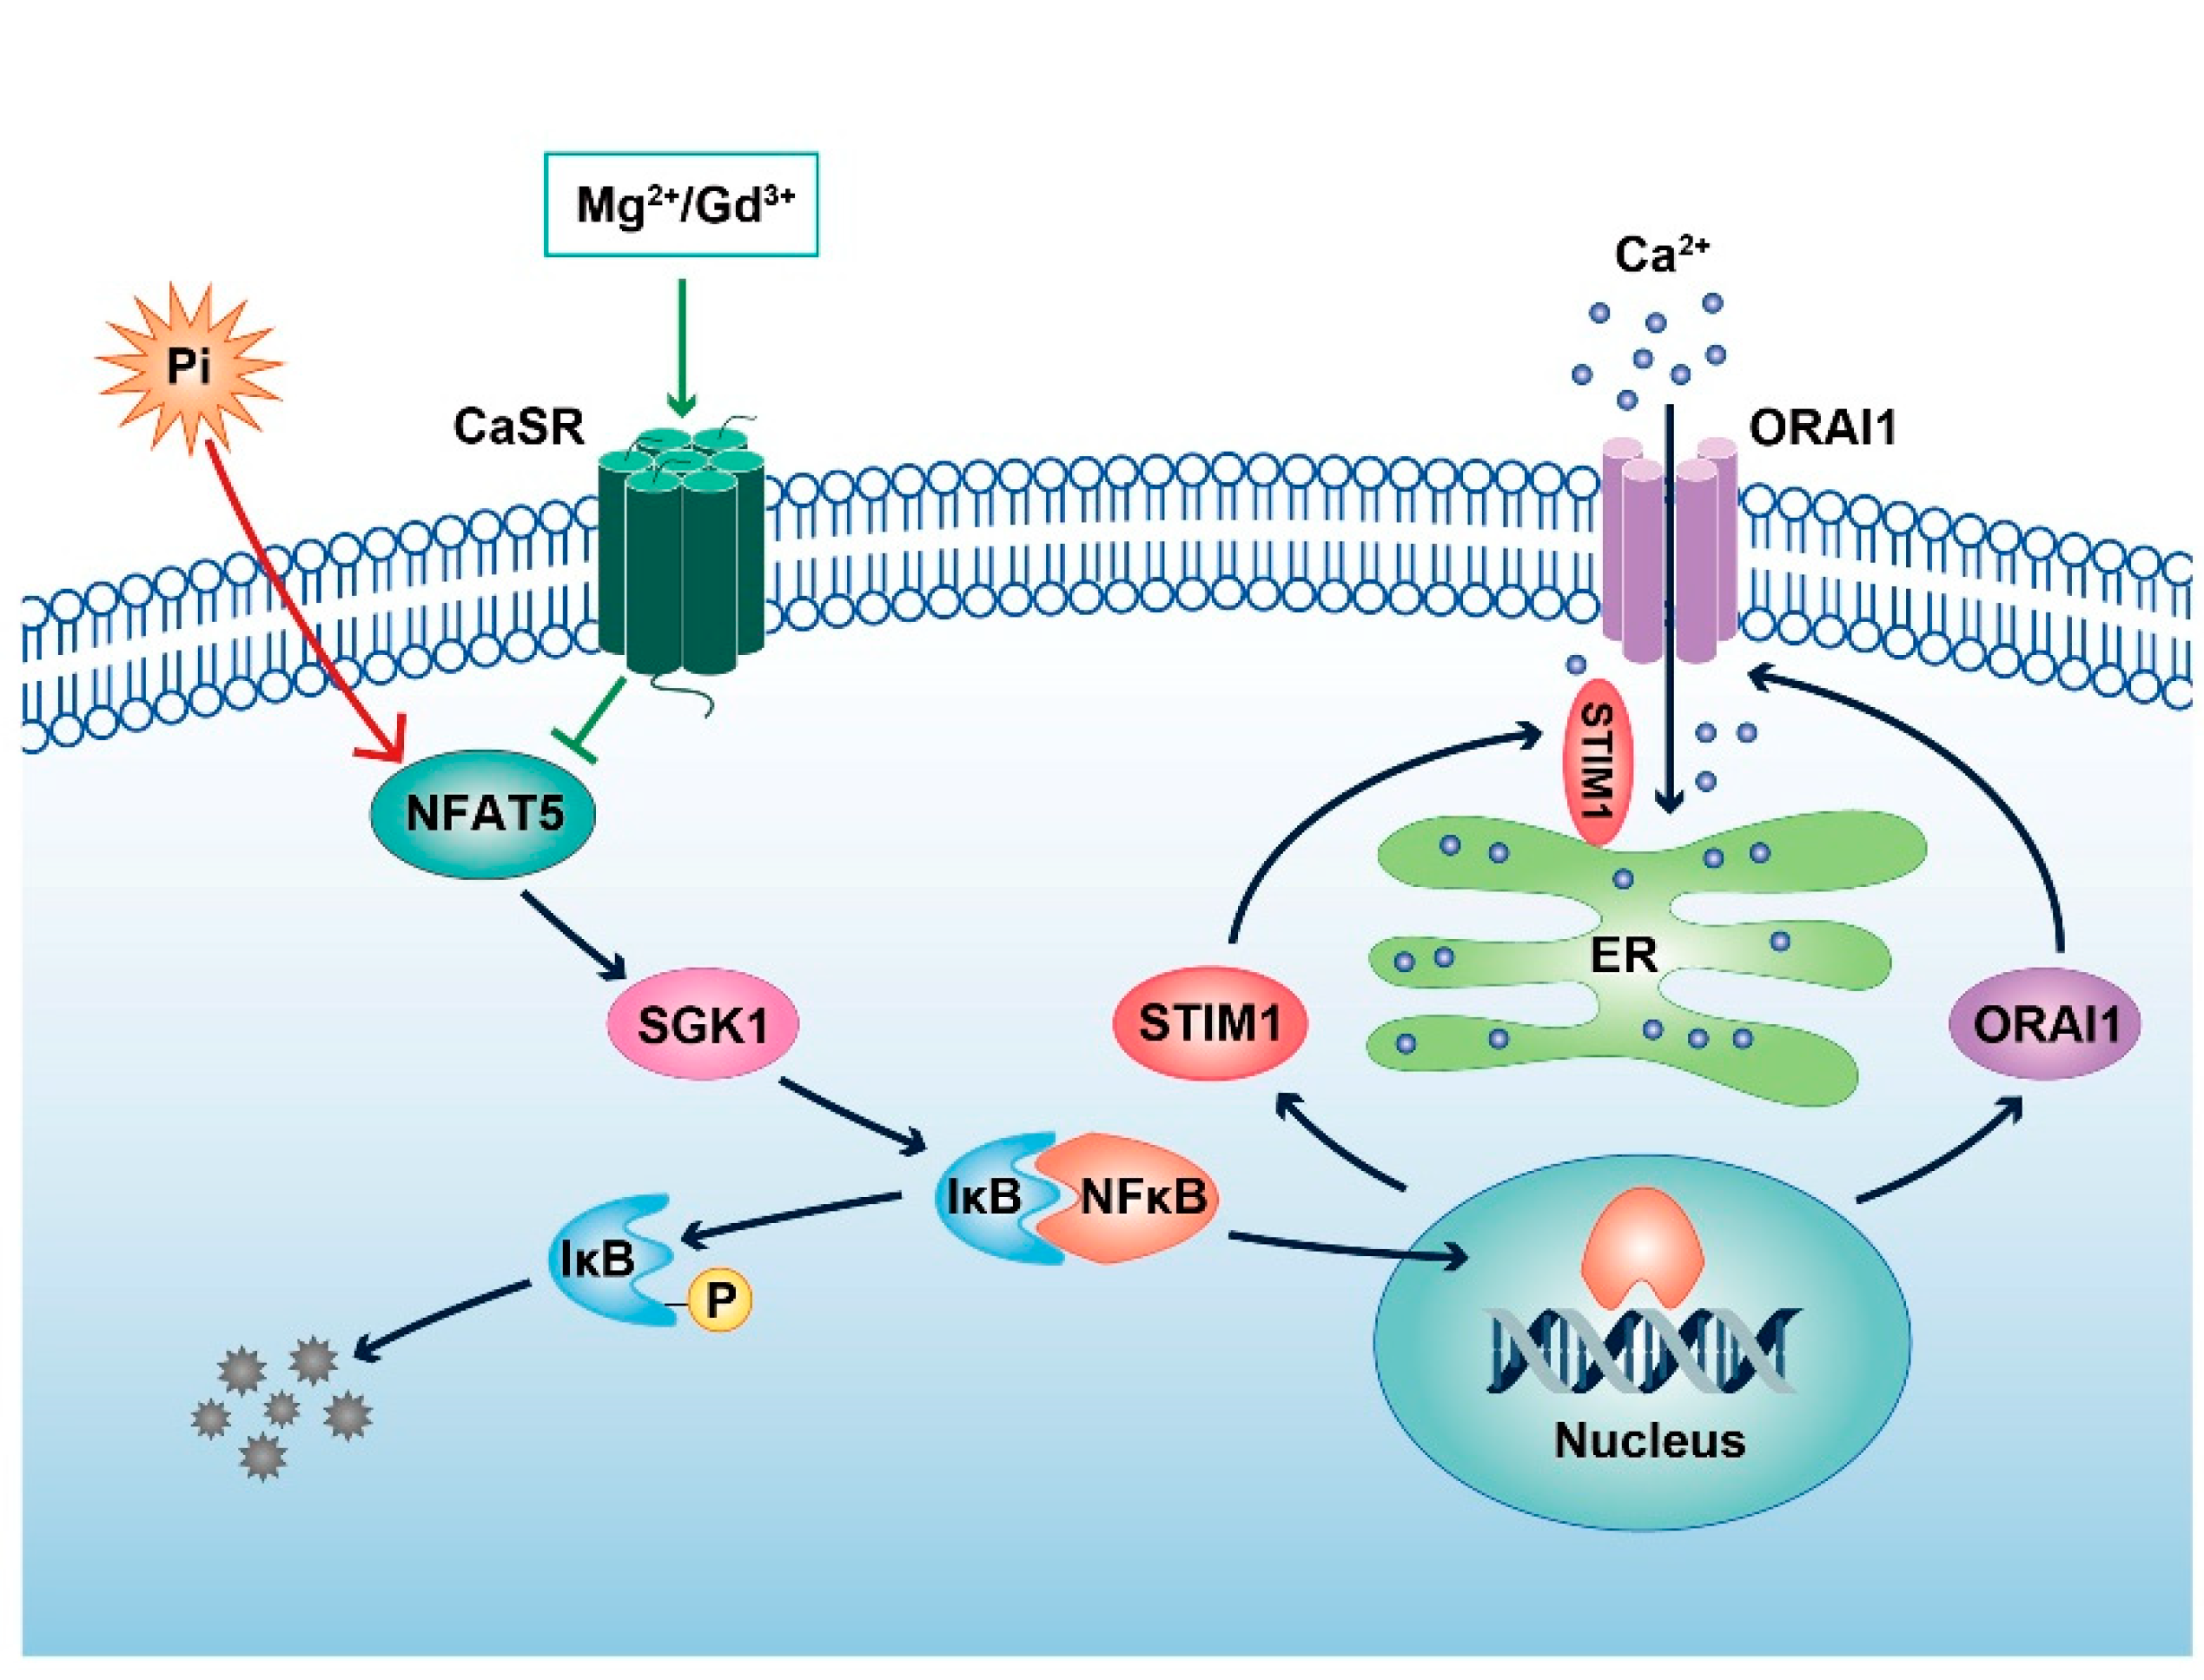
3. Discussion
4. Materials and Methods
4.1. Cell Culture
4.2. Quantitative PCR
4.3. Western Blotting
4.4. Cytosolic Calcium Measurements
4.5. Statistical Analysis
Supplementary Materials
Author Contributions
Funding
Data Availability Statement
Acknowledgments
Conflicts of Interest
References
- Kapustin, A.N.; Chatrou, M.L.; Drozdov, I.; Zheng, Y.; Davidson, S.M.; Soong, D.; Furmanik, M.; Sanchis, P.; De Rosales, R.T.; Alvarez-Hernandez, D.; et al. Vascular smooth muscle cell calcification is mediated by regulated exosome secretion. Circ. Res. 2015, 116, 1312–1323. [Google Scholar] [CrossRef]
- Lang, F.; Ritz, E.; Alesutan, I.; Voelkl, J. Impact of aldosterone on osteoinductive signaling and vascular calcification. Nephron. Physiol. 2014, 128, 40–45. [Google Scholar] [CrossRef]
- Lang, F.; Ritz, E.; Voelkl, J.; Alesutan, I. Vascular calcification--is aldosterone a culprit? Nephrol. Dial. Transpl. 2013, 28, 1080–1084. [Google Scholar] [CrossRef]
- Steitz, S.A.; Speer, M.Y.; Curinga, G.; Yang, H.Y.; Haynes, P.; Aebersold, R.; Schinke, T.; Karsenty, G.; Giachelli, C.M. Smooth muscle cell phenotypic transition associated with calcification: Upregulation of Cbfa1 and downregulation of smooth muscle lineage markers. Circ Res. 2001, 89, 1147–1154. [Google Scholar] [CrossRef] [PubMed]
- Blacher, J.; Guerin, A.P.; Pannier, B.; Marchais, S.J.; London, G.M. Arterial calcifications, arterial stiffness, and cardiovascular risk in end-stage renal disease. Hypertension 2001, 38, 938–942. [Google Scholar] [CrossRef]
- London, G.M.; Guerin, A.P.; Marchais, S.J.; Metivier, F.; Pannier, B.; Adda, H. Arterial media calcification in end-stage renal disease: Impact on all-cause and cardiovascular mortality. Nephrol. Dial. Transpl. 2003, 18, 1731–1740. [Google Scholar] [CrossRef] [PubMed]
- Mizobuchi, M.; Towler, D.; Slatopolsky, E. Vascular calcification: The killer of patients with chronic kidney disease. J. Am. Soc. Nephrol. 2009, 20, 1453–1464. [Google Scholar] [CrossRef] [PubMed]
- Foley, R.N.; Parfrey, P.S.; Sarnak, M.J. Epidemiology of cardiovascular disease in chronic renal disease. J. Am. Soc. Nephrol. 1998, 9, S16–S23. [Google Scholar] [CrossRef]
- Alesutan, I.; Musculus, K.; Castor, T.; Alzoubi, K.; Voelkl, J.; Lang, F. Inhibition of Phosphate-Induced Vascular Smooth Muscle Cell Osteo-/Chondrogenic Signaling and Calcification by Bafilomycin A1 and Methylamine. Kidney Blood Press Res. 2015, 40, 490–499. [Google Scholar] [CrossRef]
- Feger, M.; Alesutan, I.; Castor, T.; Mia, S.; Musculus, K.; Voelkl, J.; Lang, F. Inhibitory effect of NH4Cl treatment on renal Tgfss1 signaling following unilateral ureteral obstruction. Cell Physiol. Biochem. 2015, 37, 955–964. [Google Scholar] [CrossRef] [PubMed]
- Lang, F.; Guelinckx, I.; Lemetais, G.; Melander, O. Two Liters a Day Keep the Doctor Away? Considerations on the Pathophysiology of Suboptimal Fluid Intake in the Common Population. Kidney Blood Press Res. 2017, 42, 483–494. [Google Scholar] [CrossRef]
- Leibrock, C.B.; Alesutan, I.; Voelkl, J.; Pakladok, T.; Michael, D.; Schleicher, E.; Kamyabi-Moghaddam, Z.; Quintanilla-Martinez, L.; Kuro-o, M.; Lang, F. NH4Cl Treatment Prevents Tissue Calcification in Klotho Deficiency. J. Am. Soc. Nephrol. 2015, 26, 2423–2433. [Google Scholar] [CrossRef]
- Chen, S.; Grigsby, C.L.; Law, C.S.; Ni, X.; Nekrep, N.; Olsen, K.; Humphreys, M.H.; Gardner, D.G. Tonicity-dependent induction of Sgk1 expression has a potential role in dehydration-induced natriuresis in rodents. J. Clin. Investig. 2009, 119, 1647–1658. [Google Scholar] [CrossRef] [PubMed]
- Lang, F.; Stournaras, C.; Zacharopoulou, N.; Voelkl, J.; Alesutan, I. Serum- and glucocorticoid-inducible kinase 1 and the response to cell stress. Cell Stress 2018, 3, 1–8. [Google Scholar] [CrossRef]
- Lang, F.; Shumilina, E. Regulation of ion channels by the serum- and glucocorticoid-inducible kinase SGK1. FASEB J. 2013, 27, 3–12. [Google Scholar] [CrossRef] [PubMed]
- Ma, K.; Liu, P.; Al-Maghout, T.; Sukkar, B.; Cao, H.; Voelkl, J.; Alesutan, I.; Pieske, B.; Lang, F. Phosphate-induced ORAI1 expression and store-operated Ca(2+) entry in aortic smooth muscle cells. J. Mol. Med. 2019, 97, 1465–1475. [Google Scholar] [CrossRef]
- Zhu, X.; Ma, K.; Zhou, K.; Voelkl, J.; Alesutan, I.; Leibrock, C.; Nurnberg, B.; Lang, F. Reversal of phosphate-induced ORAI1 expression, store-operated Ca(2+) entry and osteogenic signaling by MgCl2 in human aortic smooth muscle cells. Biochem. Biophys. Res. Commun. 2020, 523, 18–24. [Google Scholar] [CrossRef]
- Ma, K.; Sukkar, B.; Zhu, X.; Zhou, K.; Cao, H.; Voelkl, J.; Alesutan, I.; Nurnberg, B.; Lang, F. Stimulation of ORAI1 expression, store-operated Ca(2+) entry, and osteogenic signaling by high glucose exposure of human aortic smooth muscle cells. Pflug. Arch. Eur. J. Physiol. 2020, 472, 1093–1102. [Google Scholar] [CrossRef] [PubMed]
- Lee, S.H.; Park, Y.; Song, M.; Srikanth, S.; Kim, S.; Kang, M.K.; Gwack, Y.; Park, N.H.; Kim, R.H.; Shin, K.H. Orai1 mediates osteogenic differentiation via BMP signaling pathway in bone marrow mesenchymal stem cells. Biochem. Biophys. Res. Commun. 2016, 473, 1309–1314. [Google Scholar] [CrossRef]
- Eckstein, M.; Vaeth, M.; Aulestia, F.J.; Costiniti, V.; Kassam, S.N.; Bromage, T.G.; Pedersen, P.; Issekutz, T.; Idaghdour, Y.; Moursi, A.M.; et al. Differential regulation of Ca(2+) influx by ORAI channels mediates enamel mineralization. Sci. Signal. 2019, 12. [Google Scholar] [CrossRef]
- McCarl, C.A.; Picard, C.; Khalil, S.; Kawasaki, T.; Rother, J.; Papolos, A.; Kutok, J.; Hivroz, C.; Ledeist, F.; Plogmann, K.; et al. ORAI1 deficiency and lack of store-operated Ca2+ entry cause immunodeficiency, myopathy, and ectodermal dysplasia. J. Allergy Clin. Immunol. 2009, 124, 1311–1318.e1317. [Google Scholar] [CrossRef]
- Braun, A.; Varga-Szabo, D.; Kleinschnitz, C.; Pleines, I.; Bender, M.; Austinat, M.; Bosl, M.; Stoll, G.; Nieswandt, B. Orai1 (CRACM1) is the platelet SOC channel and essential for pathological thrombus formation. Blood 2009, 113, 2056–2063. [Google Scholar] [CrossRef] [PubMed]
- Lang, F.; Munzer, P.; Gawaz, M.; Borst, O. Regulation of STIM1/Orai1-dependent Ca2+ signalling in platelets. Thromb. Haemost. 2013, 110, 925–930. [Google Scholar] [CrossRef]
- Eylenstein, A.; Gehring, E.M.; Heise, N.; Shumilina, E.; Schmidt, S.; Szteyn, K.; Munzer, P.; Nurbaeva, M.K.; Eichenmuller, M.; Tyan, L.; et al. Stimulation of Ca2+-channel Orai1/STIM1 by serum- and glucocorticoid-inducible kinase 1 (SGK1). FASEB J. 2011, 25, 2012–2021. [Google Scholar] [CrossRef] [PubMed]
- Borst, O.; Schmidt, E.M.; Munzer, P.; Schonberger, T.; Towhid, S.T.; Elvers, M.; Leibrock, C.; Schmid, E.; Eylenstein, A.; Kuhl, D.; et al. The serum- and glucocorticoid-inducible kinase 1 (SGK1) influences platelet calcium signaling and function by regulation of Orai1 expression in megakaryocytes. Blood 2012, 119, 251–261. [Google Scholar] [CrossRef]
- Lang, F.; Gawaz, M.; Borst, O. The serum- & glucocorticoid-inducible kinase in the regulation of platelet function. Acta Physiol. 2015, 213, 181–190. [Google Scholar] [CrossRef]
- Sahu, I.; Pelzl, L.; Sukkar, B.; Fakhri, H.; Al-Maghout, T.; Cao, H.; Hauser, S.; Gutti, R.; Gawaz, M.; Lang, F. NFAT5-sensitive Orai1 expression and store-operated Ca(2+) entry in megakaryocytes. FASEB J. 2017, 31, 3439–3448. [Google Scholar] [CrossRef]
- Balduini, A.; Badalucco, S.; Pugliano, M.T.; Baev, D.; De Silvestri, A.; Cattaneo, M.; Rosti, V.; Barosi, G. In vitro megakaryocyte differentiation and proplatelet formation in Ph-negative classical myeloproliferative neoplasms: Distinct patterns in the different clinical phenotypes. PLoS ONE 2011, 6, e21015. [Google Scholar] [CrossRef]
- Golfier, S.; Kondo, S.; Schulze, T.; Takeuchi, T.; Vassileva, G.; Achtman, A.H.; Graler, M.H.; Abbondanzo, S.J.; Wiekowski, M.; Kremmer, E.; et al. Shaping of terminal megakaryocyte differentiation and proplatelet development by sphingosine-1-phosphate receptor S1P4. FASEB J. 2010, 24, 4701–4710. [Google Scholar] [CrossRef]
- Pelzl, L.; Sahu, I.; Ma, K.; Heinzmann, D.; Bhuyan, A.A.M.; Al-Maghout, T.; Sukkar, B.; Sharma, Y.; Marini, I.; Rigoni, F.; et al. Beta-Glycerophosphate-Induced ORAI1 Expression and Store Operated Ca(2+) Entry in Megakaryocytes. Sci. Rep. 2020, 10, 1728. [Google Scholar] [CrossRef]
- Di Buduo, C.A.; Moccia, F.; Battiston, M.; De Marco, L.; Mazzucato, M.; Moratti, R.; Tanzi, F.; Balduini, A. The importance of calcium in the regulation of megakaryocyte function. Haematologica 2014, 99, 769–778. [Google Scholar] [CrossRef] [PubMed]
- Somasundaram, B.; Mahaut-Smith, M.P. Three cation influx currents activated by purinergic receptor stimulation in rat megakaryocytes. J. Physiol. 1994, 480, 225–231. [Google Scholar] [CrossRef]
- Somasundaram, B.; Mason, M.J.; Mahaut-Smith, M.P. Thrombin-dependent calcium signalling in single human erythroleukaemia cells. J. Physiol. 1997, 501, 485–495. [Google Scholar] [CrossRef] [PubMed]
- Tolhurst, G.; Carter, R.N.; Amisten, S.; Holdich, J.P.; Erlinge, D.; Mahaut-Smith, M.P. Expression profiling and electrophysiological studies suggest a major role for Orai1 in the store-operated Ca2+ influx pathway of platelets and megakaryocytes. Platelets 2008, 19, 308–313. [Google Scholar] [CrossRef]
- Alesutan, I.; Tuffaha, R.; Auer, T.; Feger, M.; Pieske, B.; Lang, F.; Voelkl, J. Inhibition of osteo/chondrogenic transformation of vascular smooth muscle cells by MgCl2 via calcium-sensing receptor. J. Hypertens. 2017, 35, 523–532. [Google Scholar] [CrossRef] [PubMed]
- House, M.G.; Kohlmeier, L.; Chattopadhyay, N.; Kifor, O.; Yamaguchi, T.; Leboff, M.S.; Glowacki, J.; Brown, E.M. Expression of an extracellular calcium-sensing receptor in human and mouse bone marrow cells. J. Bone Miner. Res. Off. J. Am. Soc. Bone Miner. Res. 1997, 12, 1959–1970. [Google Scholar] [CrossRef] [PubMed]
- Wang, Y.; Zhao, Z.; Shi, S.; Gao, F.; Wu, J.; Dong, S.; Zhang, W.; Liu, Y.; Zhong, X. Calcium sensing receptor initiating cystathionine-gamma-lyase/hydrogen sulfide pathway to inhibit platelet activation in hyperhomocysteinemia rat. Exp. Cell Res. 2017, 358, 171–181. [Google Scholar] [CrossRef]
- Zhang, W.; Sun, R.; Zhong, H.; Tang, N.; Liu, Y.; Zhao, Y.; Zhang, T.; He, F. CaSR participates in the regulation of vascular tension in the mesentery of hypertensive rats via the PLCIP3/ACV/cAMP/RAS pathway. Mol. Med. Rep. 2019, 20, 4433–4448. [Google Scholar] [CrossRef]
- Guo, S.; Yan, T.; Shi, L.; Liu, A.; Zhang, T.; Xu, Y.; Jiang, W.; Yang, Q.; Yang, L.; Liu, L.; et al. Matrine, as a CaSR agonist promotes intestinal GLP-1 secretion and improves insulin resistance in diabetes mellitus. Phytomedicine 2021, 84, 153507. [Google Scholar] [CrossRef]
- Maltsev, A.V. Agmatine modulates calcium handling in cardiomyocytes of hibernating ground squirrels through calcium-sensing receptor signaling. Cell Signal. 2018, 51, 1–12. [Google Scholar] [CrossRef]
- Ortiz-Capisano, M.C.; Reddy, M.; Mendez, M.; Garvin, J.L.; Beierwaltes, W.H. Juxtaglomerular cell CaSR stimulation decreases renin release via activation of the PLC/IP(3) pathway and the ryanodine receptor. Am. J. Physiol. Ren. Physiol. 2013, 304, F248–F256. [Google Scholar] [CrossRef]
- Kwak, J.O.; Kwak, J.; Kim, H.W.; Oh, K.J.; Kim, Y.T.; Jung, S.M.; Cha, S.H. The extracellular calcium sensing receptor is expressed in mouse mesangial cells and modulates cell proliferation. Exp. Mol. Med. 2005, 37, 457–465. [Google Scholar] [CrossRef]
- Hattori, T.; Ara, T.; Fujinami, Y. Pharmacological evidences for the stimulation of calcium-sensing receptors by nifedipine in gingival fibroblasts. J. Pharm. Pharm. 2011, 2, 30–35. [Google Scholar] [CrossRef]
- Berna-Erro, A.; Jardin, I.; Smani, T.; Rosado, J.A. Regulation of Platelet Function by Orai, STIM and TRP. Adv. Exp. Med. Biol. 2016, 898, 157–181. [Google Scholar] [CrossRef]
- Renga, B.; Scavizzi, F. Platelets and cardiovascular risk. Acta Cardiol 2017, 72, 2–8. [Google Scholar] [CrossRef]
- Moody, W.E.; Edwards, N.C.; Chue, C.D.; Ferro, C.J.; Townend, J.N. Arterial disease in chronic kidney disease. Heart 2013, 99, 365–372. [Google Scholar] [CrossRef]
- Webster, A.C.; Nagler, E.V.; Morton, R.L.; Masson, P. Chronic Kidney Disease. Lancet 2017, 389, 1238–1252. [Google Scholar] [CrossRef]
- Giachelli, C.M.; Jono, S.; Shioi, A.; Nishizawa, Y.; Mori, K.; Morii, H. Vascular calcification and inorganic phosphate. Am. J. Kidney Dis. 2001, 38, S34–S37. [Google Scholar] [CrossRef]
- Shioi, A.; Nishizawa, Y.; Jono, S.; Koyama, H.; Hosoi, M.; Morii, H. Beta-glycerophosphate accelerates calcification in cultured bovine vascular smooth muscle cells. Arter. Thromb. Vasc. Biol. 1995, 15, 2003–2009. [Google Scholar] [CrossRef]
- Moe, S.M.; Chen, N.X. Pathophysiology of vascular calcification in chronic kidney disease. Circ. Res. 2004, 95, 560–567. [Google Scholar] [CrossRef]
- Abdelazeem, K.N.M.; Droppova, B.; Sukkar, B.; Al-Maghout, T.; Pelzl, L.; Zacharopoulou, N.; Ali Hassan, N.H.; Abdel-Fattah, K.I.; Stournaras, C.; Lang, F. Upregulation of Orai1 and STIM1 expression as well as store-operated Ca(2+) entry in ovary carcinoma cells by placental growth factor. Biochem. Biophys. Res. Commun. 2019, 512, 467–472. [Google Scholar] [CrossRef]
- Zhang, S.; al-Maghout, T.; Bissinger, R.; Zeng, N.; Pelzl, L.; Salker, M.S.; Cheng, A.; Singh, Y.; Lang, F. Epigallocatechin-3-gallate (EGCG) up-regulates miR-15b expression thus attenuating store operated calcium entry (SOCE) into murine CD4+ T cells and human leukaemic T cell lymphoblasts. Oncotarget 2017, 8, 89500. [Google Scholar] [CrossRef] [PubMed]
- Pelzl, L.; Hauser, S.; Elsir, B.; Sukkar, B.; Sahu, I.; Singh, Y.; Hoflinger, P.; Bissinger, R.; Jemaa, M.; Stournaras, C.; et al. Lithium Sensitive ORAI1 Expression, Store Operated Ca(2+) Entry and Suicidal Death of Neurons in Chorea-Acanthocytosis. Sci. Rep. 2017, 7, 6457. [Google Scholar] [CrossRef]
- Sukkar, B.; Hauser, S.; Pelzl, L.; Hosseinzadeh, Z.; Sahu, I.; Al-Maghout, T.; Bhuyan, A.A.M.; Zacharopoulou, N.; Stournaras, C.; Schols, L.; et al. Inhibition of Lithium Sensitive Orai1/STIM1 Expression and Store Operated Ca2+ Entry in Chorea-Acanthocytosis Neurons by NF-kappaB Inhibitor Wogonin. Cell Physiol. Biochem. 2018, 51, 278–289. [Google Scholar] [CrossRef]
- Schmid, E.; Bhandaru, M.; Nurbaeva, M.K.; Yang, W.; Szteyn, K.; Russo, A.; Leibrock, C.; Tyan, L.; Pearce, D.; Shumilina, E.; et al. SGK3 regulates Ca(2+) entry and migration of dendritic cells. Cell Physiol. Biochem. 2012, 30, 1423–1435. [Google Scholar] [CrossRef]

| Name | Orientation | Sequence |
|---|---|---|
| GAPDH | Forward | 5′-TCAAGGCTGAGAACGGGAAG-3′ |
| Reverse | 5’-TGGACTCCACGACGTACTCA-3′ | |
| CaSR | Forward | 5’-ATGCCAAGAAGGGAGAAAGACTCTT-3′ |
| Reverse | 5′-TCAGGACACTCCACACACTCAAAG-3′ | |
| NFAT5 | Forward | 5′-GGGTCAAACGACGAGATTGTG-3′ |
| Reverse | 5′-GTCCGTGGTAAGCTGAGAAAG-3′ | |
| SGK1 | Forward | 5′-AGGAGGATGGGTCTGAACGA-3′ |
| Reverse | 5′-GGGCCAAGGTTGATTTGCTG-3′ | |
| ORAI1 | Forward | 5′-CACCTGTTTGCGCTCATGAT-3′ |
| Reverse | 5′-GGGACTCCTTGACCGAGTTG-3′ | |
| ORAI2 | Forward | 5′-CAGCTCCGGGAAGGAACGTC-3′ |
| Reverse | 5′-CTCCATCCCATCTCCTTGCG-3′ | |
| ORAI3 | Forward | 5′-CTTCCAATCTCCCACGGTCC-3′ |
| Reverse | 5′-GTTCCTGCTTGTAGCGGTCT-3′ | |
| STIM1 | Forward | 5′-AAGAAGGCATTACTGGCGCT-3′ |
| Reverse | 5′-GATGGTGTGTCTGGGTCTGG-3′ | |
| STIM2 | Forward | 5′-AGGGGATTCGCCTGTAACTG-3′ |
| Reverse | 5′-GGTTTACTGTCGTTGCCAGC-3′ |
Publisher’s Note: MDPI stays neutral with regard to jurisdictional claims in published maps and institutional affiliations. |
© 2021 by the authors. Licensee MDPI, Basel, Switzerland. This article is an open access article distributed under the terms and conditions of the Creative Commons Attribution (CC BY) license (http://creativecommons.org/licenses/by/4.0/).
Share and Cite
Zhou, K.; Zhu, X.; Ma, K.; Liu, J.; Nürnberg, B.; Gawaz, M.; Lang, F. Effect of MgCl2 and GdCl3 on ORAI1 Expression and Store-Operated Ca2+ Entry in Megakaryocytes. Int. J. Mol. Sci. 2021, 22, 3292. https://doi.org/10.3390/ijms22073292
Zhou K, Zhu X, Ma K, Liu J, Nürnberg B, Gawaz M, Lang F. Effect of MgCl2 and GdCl3 on ORAI1 Expression and Store-Operated Ca2+ Entry in Megakaryocytes. International Journal of Molecular Sciences. 2021; 22(7):3292. https://doi.org/10.3390/ijms22073292
Chicago/Turabian StyleZhou, Kuo, Xuexue Zhu, Ke Ma, Jibin Liu, Bernd Nürnberg, Meinrad Gawaz, and Florian Lang. 2021. "Effect of MgCl2 and GdCl3 on ORAI1 Expression and Store-Operated Ca2+ Entry in Megakaryocytes" International Journal of Molecular Sciences 22, no. 7: 3292. https://doi.org/10.3390/ijms22073292