2.1. Method Optimization
The aim of the present work was to develop a simple, sensitive and reproducible method to allow the accurate quantification of both lactate/pyruvate and β-hydroxybutyrate/acetoacetate ratios in plasma and tissue which may be useful in the evaluation of in vivo redox states. Here, we present a GC-MS method that allows both metabolic ratios to be measured in the same aliquot of plasma or tissue sample. Liquid-liquid extraction was conducted for its simplicity and a high signal and cleanliness were obtained using ethyl acetate. The initial tests revealed the need for previous acidification of samples to achieve appropriate sensitivity. In addition, metabolites should be derivatized to improve detectability and the efficiency of the GC. Derivatization with a mixture of bis(trimethylsilyl)trifluoroacetamide (BSTFA) with 1% trimethylchlorosilane (TMCS) after acidic ethyl acetate extraction was initially tested for its readiness. Lactate, β-hydroxybutyrate and acetoacetate were successfully detected. Conversely, pyruvate proved to be difficult to detect. Sylilation with N-trimethylsilylimidazole with or without the addition of methoxyamine hydrochloride also did not achieve pyruvate derivatization. Finally, the obtaining of quinoxalinol-trimethylsilyl (TMS) derivative was tested. Excellent sensitivity and chromatographic detection of pyruvate were offered by obtaining quinoxalinol derivative using o-phenylenediamine (in 4 M HCl) at a 1:2 volume ratio with the sample before extraction and silylation with BSTFA with 1% TMCS.
Quinoxalinol-TMS derivatization has been previously used for 2-ketoacids detection using GC [
24], GC-MS [
21] and HPLC-fluorescence [
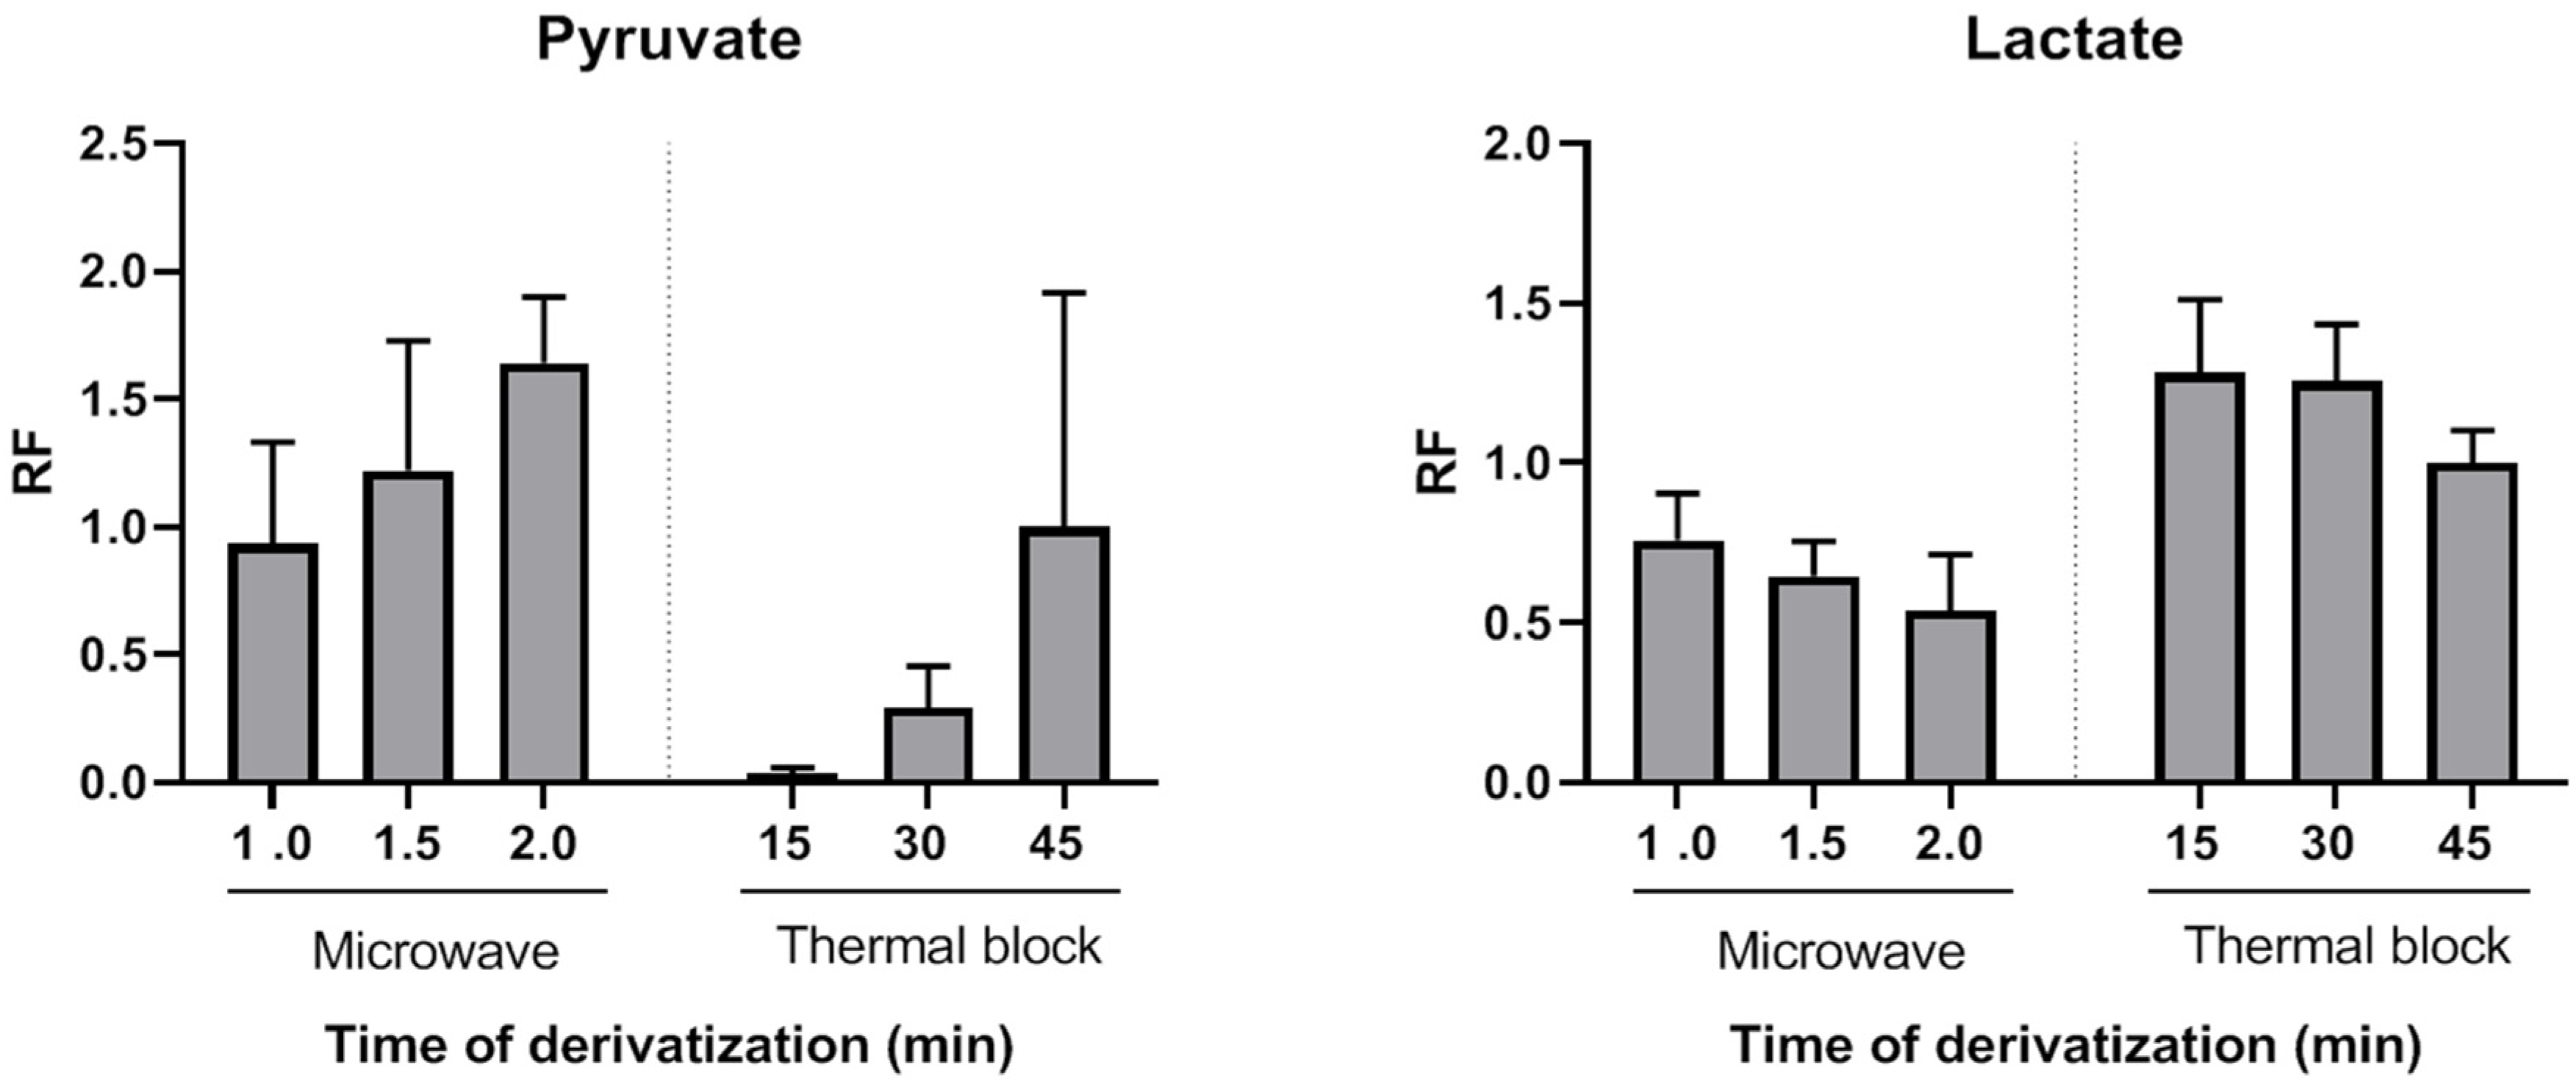
25] with derivatization times ranging from 20 min to 90 min. Here, we evaluated the usefulness of a MAD approach to obtain fast and stable pyruvate quinoxalinol derivatives. Microwave-assisted derivatization (MAD) of pyruvate was initially tested with aqueous solutions of pyruvate standard (0.1 µmol). A successful derivatization was achieved after 1 min of microwave irradiation of the standard mixed with o-phenylenediamine. Peak areas after 1.5 or 2 min of microwave irradiation were higher than those obtained after incubation at 90 °C for 45 min. To further investigate the applicability of MAD of pyruvate in plasma samples, this alternative heating approach was compared with the classical block heating method also in plasma samples (
n = 3). Aliquots of the same samples were analyzed using both methods and derivatization yields for pyruvate were compared.
Figure 1 shows the average relative response factors (RRFs) values of MAD normalized to classical derivatization (45 min, 90 °C). The MAD derivatization method produced similar or higher absolute yields. RRFs ranged from 0.94 (1 min MAD) to 1.64 (2 min MAD). Thus, by using the described MAD procedure, the quinoxalinol derivatization step can be reduced to only a very few minutes of microwave irradiation. To the best of our knowledge, this is the first report of MAD quinoxalinol derivatization of pyruvate. Although only pyruvate derivatization yields were evaluated, results suggest that this MAD procedure may be useful for the analysis of other 2-ketoacids or methods aiming at comprehensive acids organics profiling.
The effect of pyruvate quinoxalinol derivatization on the yields of lactate, β-hydroxybutyrate and acetoacetate TMS derivatives was also evaluated. As shown in
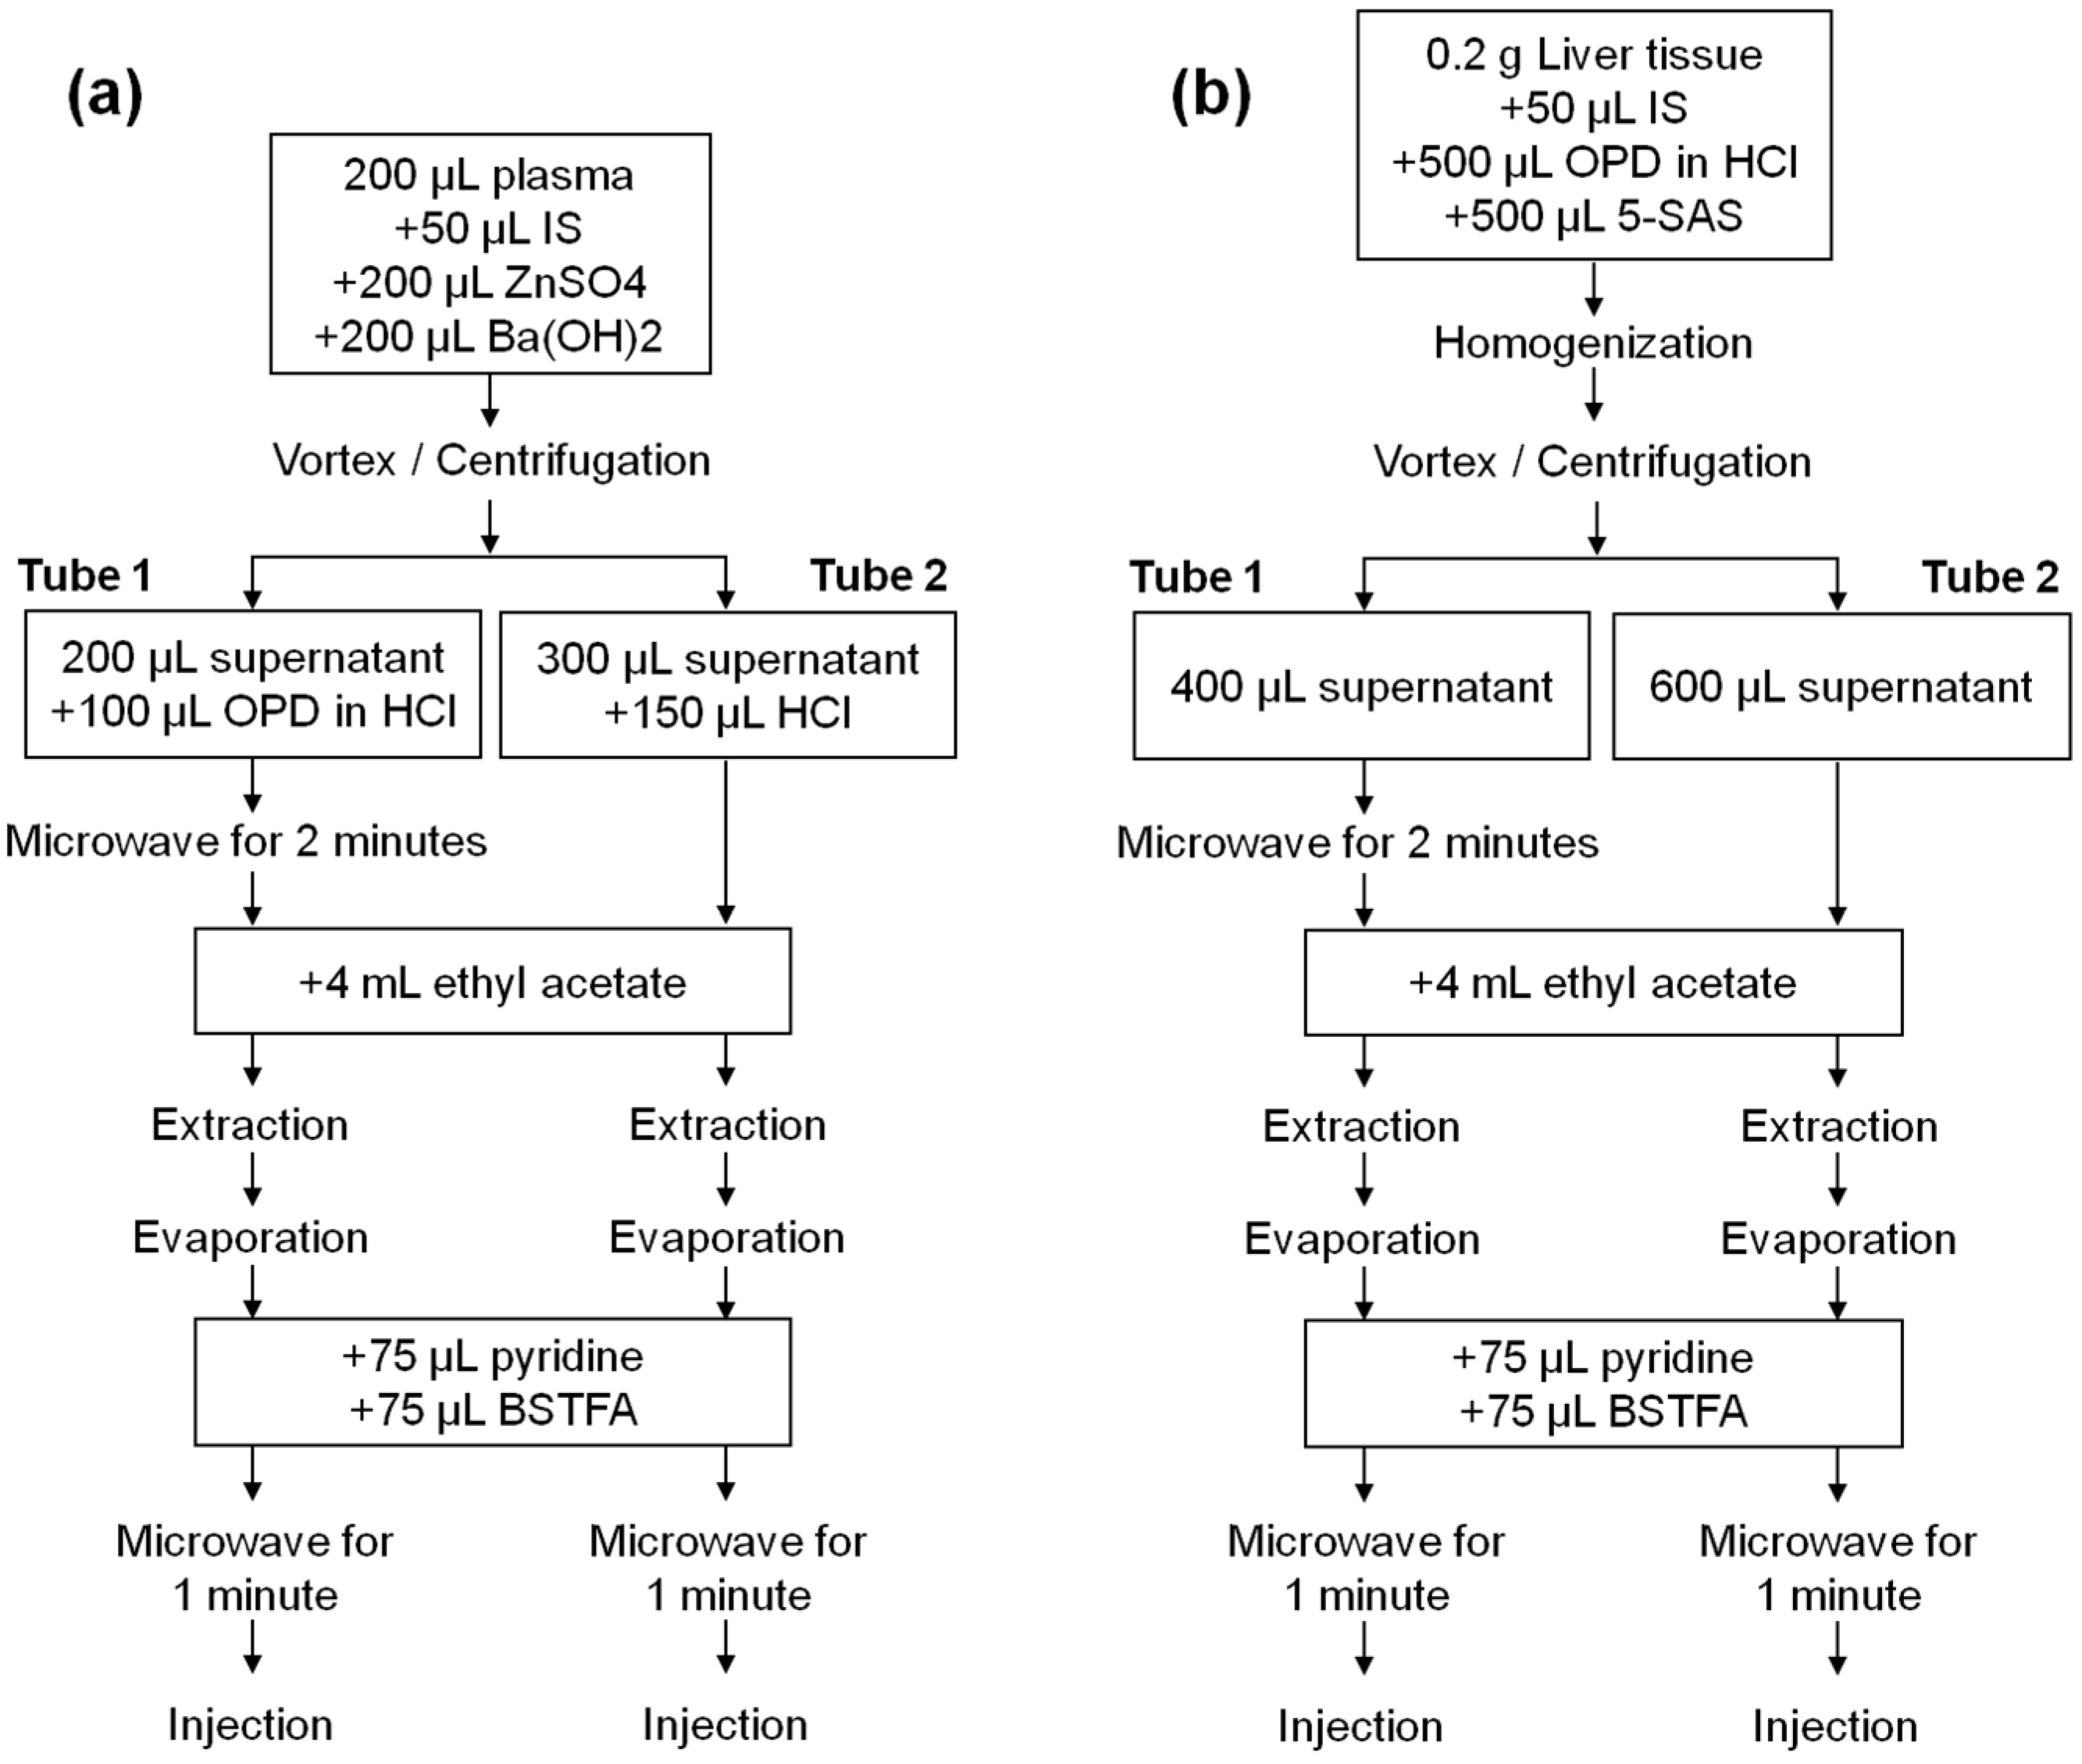
Figure 1, both thermal and MAD derivatization reactions of pyruvate with o-phenylenediamine resulted in time-dependent lower yields of lactate. This decrease was probably due to a temperature effect, as it was more pronounced in the case of microwave irradiation. However, a synergic effect of temperature and o-phenylenediamine cannot be excluded. The average RRFs values of MAD normalized to classical derivatization (45 min, 90 °C) were lower and ranged from 0.76 (1 min MAD) to 0.54 (2 min MAD). However, as it will be shown, this did not preclude achieving high sensitivity, precision and accuracy for lactate measurements. β-hydroxybutyrate decrease of RRFs after incubation with o-phenylenediame via thermal block or MAD were similar to those observed for lactate, but acetoacetate was not detected after the thermal or MAD quinoxalinol derivatization step. Therefore, this step was only applied to the measurement of the first ratio (lactate/pyruvate) and avoided for the measurement of the second ratio (β-hydroxybutyrate/acetoacetate) by splitting the sample into two extracts (tube 1 and tube 2) and handling them in parallel in the remaining part of the assay procedure. It is noteworthy that lactate and β-hydroxybutyrate were correctly detected in both tubes 1 and 2. However, the metabolites were analyzed in pairs in order to keep the procedure as homogeneous as possible between the metabolites that constitute each ratio.
Extraction with ethyl acetate required acidic conditions, which were provided by adding a solution of o-phenylenediamine prepared in 4 M hydrochloric acid (HCl) or by directly adding a 4 M HCl solution. Without acidification, none of the metabolites were detected, except for lactate, the peak area of which was reduced by 99.3%. We did not find differences between the yields of the metabolites using HCl concentrations of 4 M, 5 M, 7.5 M or 10 M, whereby 4 M HCl was chosen. After extraction with ethyl acetate in acidic conditions, metabolites were silylated with BSTFA with 1% TMCS using MAD (1 min irradiation) as previously described [
26,
27]. In this way, TMS derivatives of lactate, β-hydroxybutyrate and acetoacetate were obtained, and the approach also proved to be successful for the derivatization of quinoxalinol pyruvate.
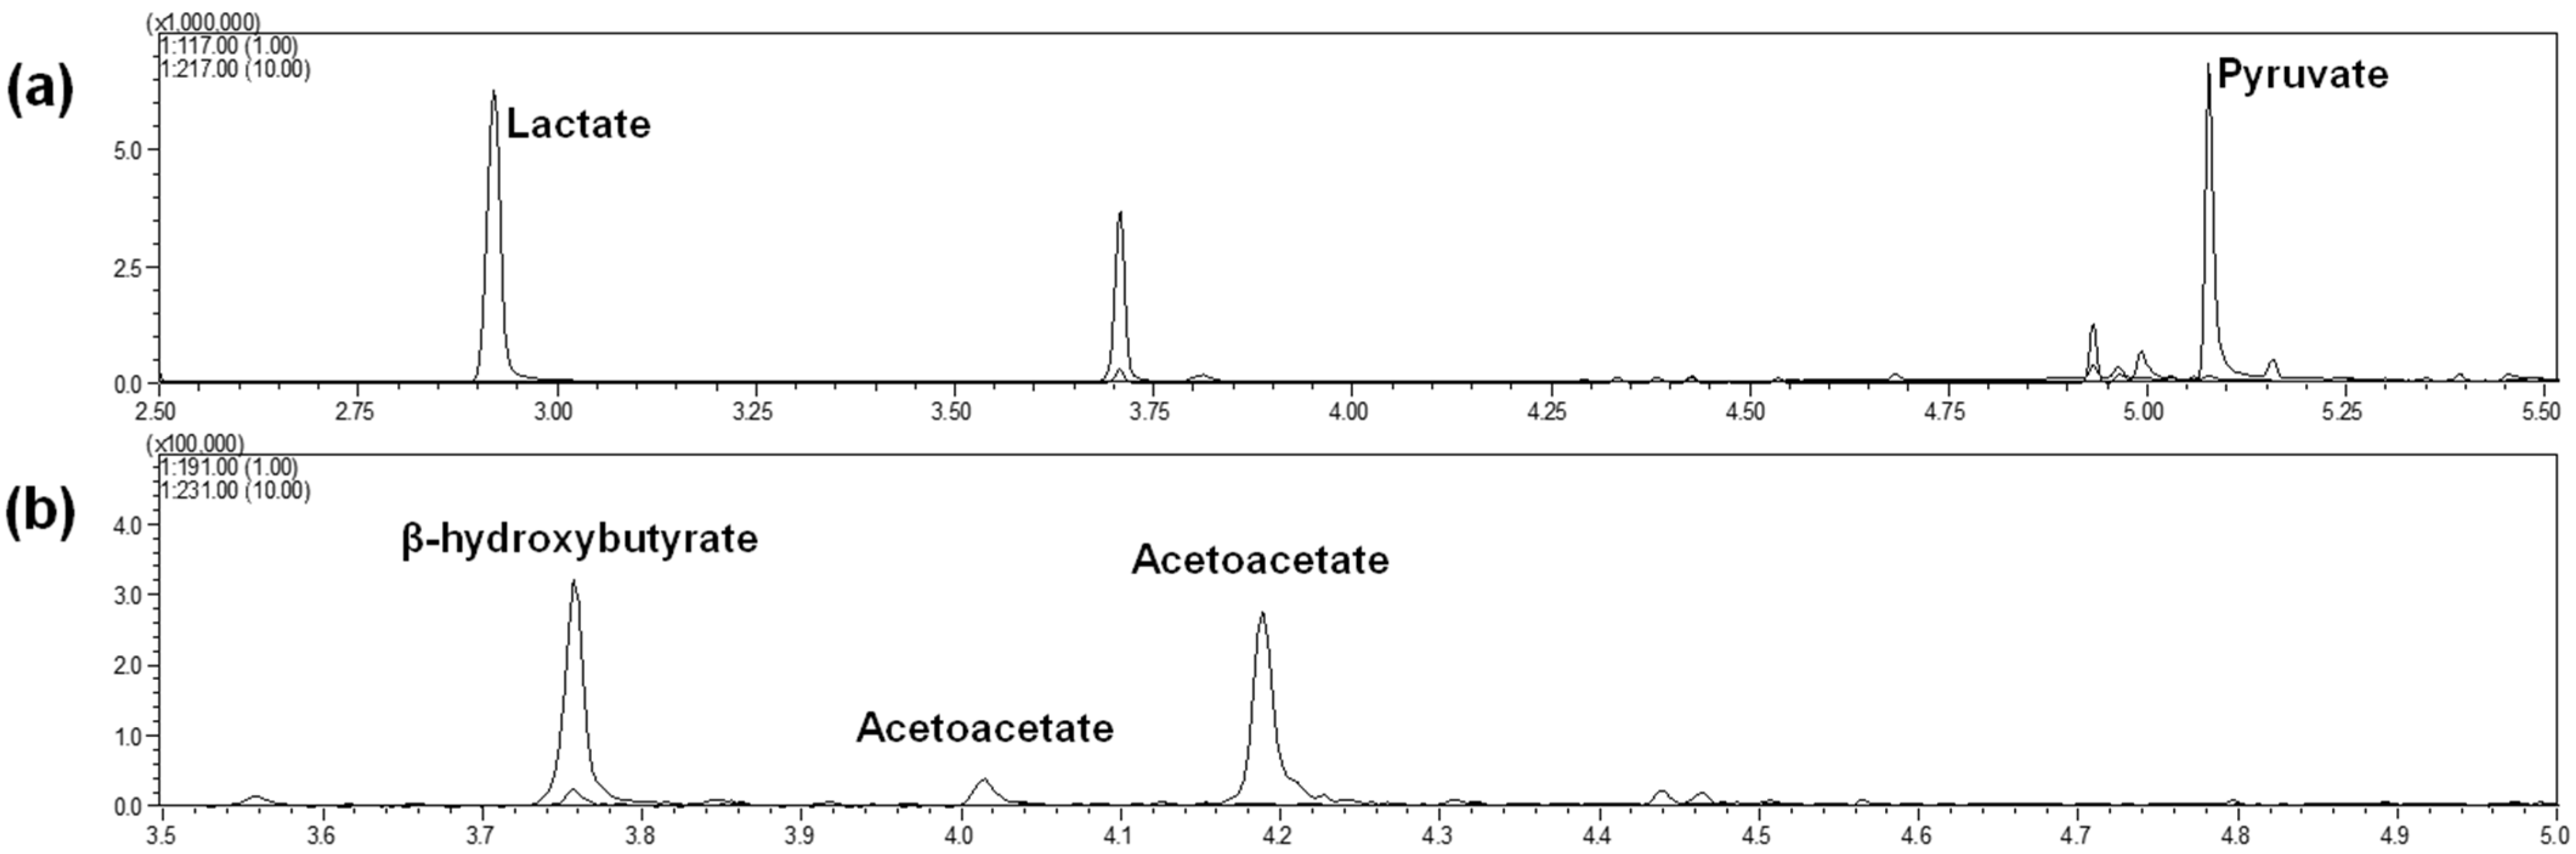
Two separate injections were finally performed for each initial sample: one for lactate and pyruvate (with the MAD quinoxalinol derivatization step) and one for β-hydroxybutyrate and acetoacetate (without the MAD quinoxalinol derivatization step). Chromatographic conditions led to the profiles shown in
Figure 2a for lactate and pyruvate (injection of tube 1) and
Figure 2b for β-hydroxybutyrate and acetoacetate (injection of tube 2). Metabolites were completely separated via GC. Lactate and pyruvate were eluted after 2.9 min and 5.1 min, respectively, whereas β-hydroxybutyrate, acetoacetate (peak 1) and acetoacetate (peak 2) were eluted after 3.7, 4.0 and 4.2 min, respectively. Note that an additional peak can be observed in
Figure 2a at 3.7 min, derived from the elution of β-hydroxybutyrate, which was stable against the MAD quinoxalinol derivatization step. The appearance of two peaks for acetoacetate, with identical mass spectra, has been previously noted [
19,
28] and is probably related to the formation of tautomeric isomers. Only the peak with the greater abundance, eluted at 4.2 min, was selected for the method validation since the minor peak at 4.0 min was often too small for appropriate peak integration and no improvement in the validation results was observed when using both peaks. Finally, synchronous SIM/scan acquisition was used to achieve low detection limits while maximizing specificity. The selected ion values and retention times of metabolite derivatives are given in
Table 1, and the mass spectra are shown in
Figure S1.
To the best of our knowledge, only one previous study validated a method for the simultaneous measurement of the four metabolites using mass spectrometry [
18]. In this study [
18] the same amount of plasma (200 µL) was used, and ethyl acetate was also used for extraction. However, methanol was used for protein precipitation, and a derivatization with N-methyl-N-(trimethylsilyl)trifluoroacetamide (MSTBFA) was performed before GC-MS analysis. Furthermore, in contrast with our study, tissue samples were not included in the validation. In a previous study, Beylot et al. [
19] used a GC-MS method to measure the isotopic enrichment of acetoacetate and β-hydroxybutyrate. In contrast to our method, 2 mL of whole blood were used, and protein precipitation was performed with perchloric acid. However, samples were similarly acidified with HCl, extracted with ethyl acetate and derivatizatied with BSTFA with 1% TMCS, although lactate and pyruvate measurements were not performed. Finally, the derivatization of pyruvate along with other 2-ketoacids using o-phenyldiamine was previously described by Rocchiccioli et al. [
21]. The method was applied to measure pyruvate in blood, plasma and urine. After reaction with o-phenyldiamine (1 h, 90 °C) samples were extracted twice with ethyl acetate and derivatized with BSTFA-TMCS (30 min, 90 °C). In our method, the use of MAD for the same reactions resulted in considerably shorter derivatization times.
2.2. Method Validation
Calibration curves were prepared in water to avoid the potential bias resulting from endogenous metabolites at different concentrations in plasma and tissue. The method was linear for lactate concentrations ranging from 0.01 to 5 mM, for pyruvate and acetoacetate concentrations ranging from 0.001 to 1 mM and for β-hydroxybutyrate ranging from 0.001 to 5 mM, obtaining r
2 values of 0.999 ± 0.001, 0.998 ± 0.001, 0.998 ± 0.003 and 0.998 ± 0.001, respectively. The concentrations of the calibration curves were established taking into account the expected variation of the metabolite concentrations in different types of samples. These concentrations were also estimated via initial injection of plasma and liver samples. Therefore, a wide range of standard concentrations was selected since metabolite concentrations may change widely in different pathological and experimental conditions. In spite of this, calibration samples showed an accuracy above 85% and a precision below 15% (
Table 2), as specified in the current guidelines for analysis [
29]. The low calibrator of 0.001 mM (pyruvate, β-hydroxybutyrate and acetoacetate) or 0.01 mM (lactate) was chosen for the low limit of quantification (LloQ). The inter-day accuracy and precision of the LloQ were within 100 ± 20% and below 20%, respectively, except for acetoacetate LloQ precision, which was 22% (
Table 2).
Although isotopic internal standards were used to compensate for any variations during sample processing, additional validation procedures were necessary to evaluate the appropriateness of preparation of calibrations in water. Experiments were performed to evaluate the differences in recoveries between plasma or liver and water.
Table S1 shows the slope coefficients of 3-point QC metabolite-spiked curves in plasma, liver or water. Acceptable recoveries of added metabolites were obtained when analyzing spiked plasmas and livers (
Table 3) supporting the parsimonious approach of not compensating for the different matrices.
Table 4 summarizes the values of intra-day and inter-day precision and accuracies obtained for the three QC levels, which were <15%. In addition, intra-day and inter-day precision for human plasma and rat liver samples were evaluated and shown to be <15% with the exception of an inter-day precision value of 22% for acetoacetate in the liver (
Table 5). The calculated lactate/pyruvate and β-hydroxybutyrate/acetoacetate ratios in these samples were in the range of 10.5–12.4 and 5.7–5.8 in plasma and 6.9–18.4 and 16.0–19.3 in the liver, respectively.
No interfering signals were observed in any metabolite when analyzing 10 different human plasma samples and 3 different rat livers. In addition, there were no carry-over effects after injecting blank samples (1 µL of cyclohexane) following an injection of a standard with UloQ concentration. Finally, extracts in the autosampler at ambient temperature were highly stable for at least 96 h (
Table 6). This result further supports the efficacy of MAD quinoxalinol derivatization of pyruvate.
2.3. Applicability of the Method
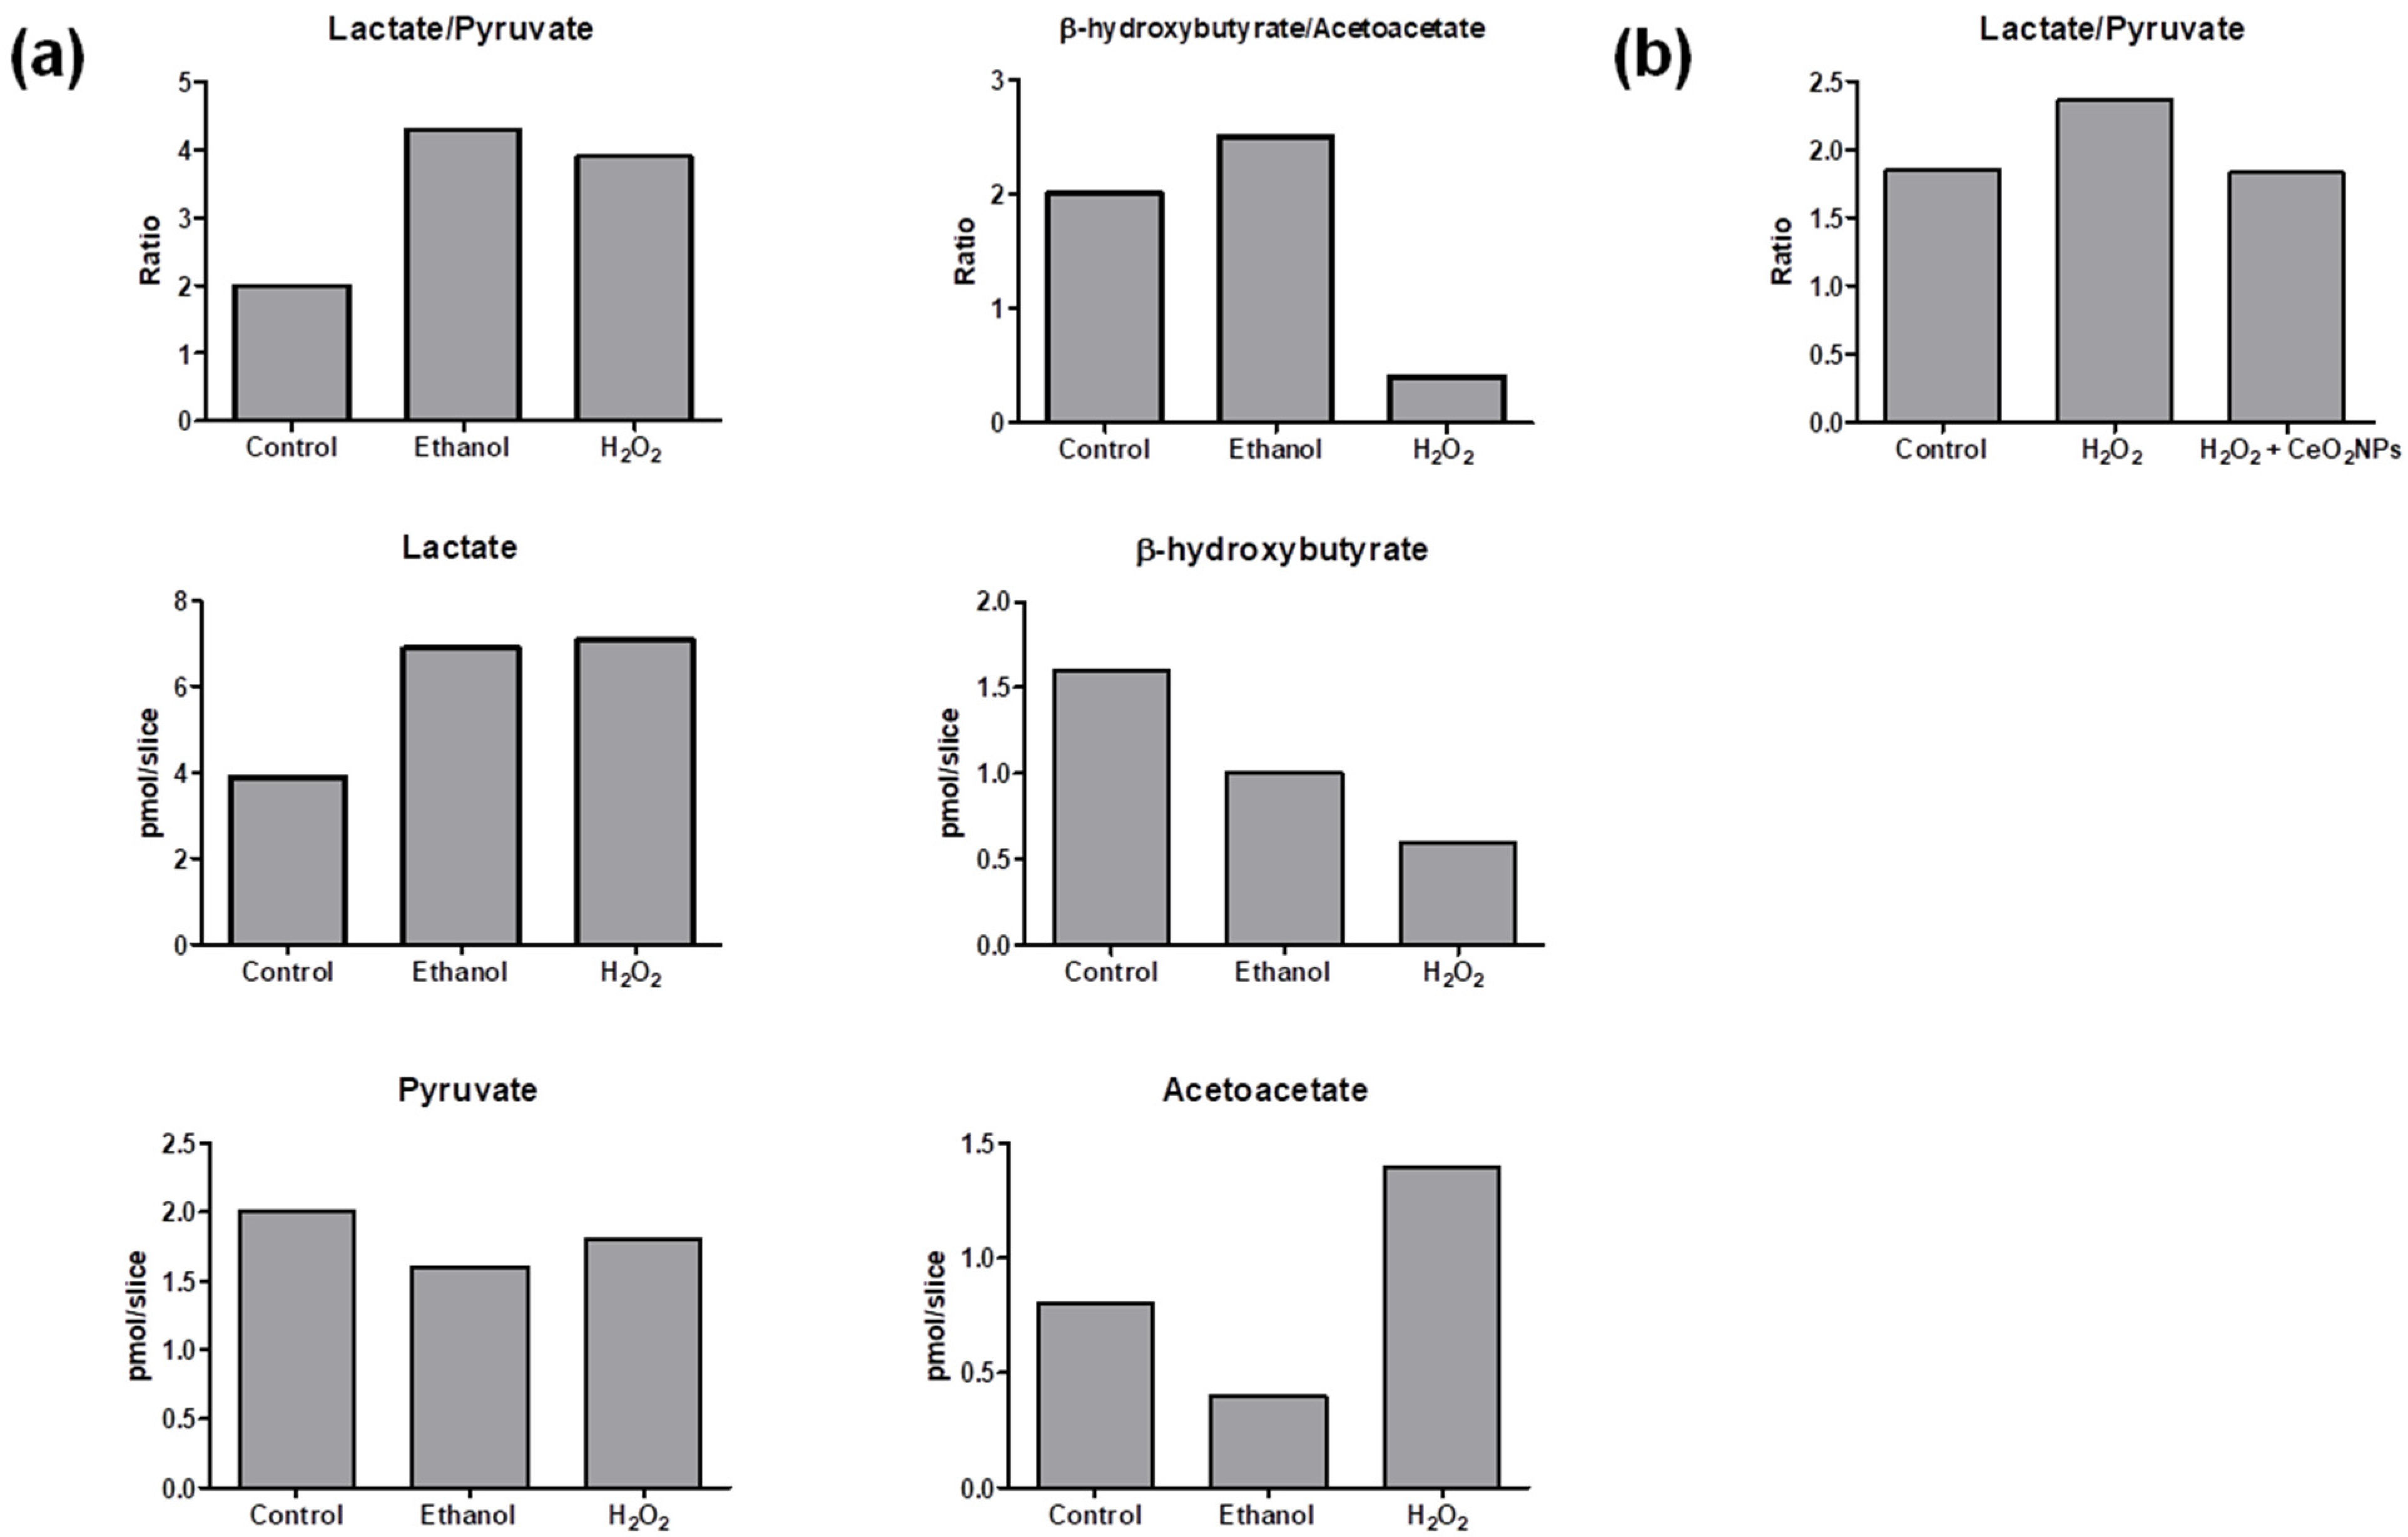
The method was applied to measure lactate/pyruvate ratio (as an indication of the cytosolic redox state) and β-hydroxybutyrate/acetoacetate ratio (as mitochondrial surrogate redox marker) in liver slices. Results are shown in
Figure 3a. The presence of ethanol in the medium of incubated precision-cut liver rat slices resulted in an augmented lactate/pyruvate ratio in comparison to non-exposed control slices. This has been previously observed and attributed to the generation of cytosolic NADH through oxidation of ethanol via alcohol dehydrogenase [
30]. A similar increase of lactate/pyruvate ratio was observed in precision-cut liver slices incubated with H
2O
2. Liver slices slightly augmented the β-hydroxybutyrate/acetoacetate ratio in response to ethanol, whereas H
2O
2 exposure strongly decreased the β-hydroxybutyrate/acetoacetate ratio suggesting a more marked effect of H
2O
2 in the mitochondrial redox state.
The method was also applied to evaluate cytosolic redox changes in human hepatic cells HepG2 cultured under three different experimental conditions. Although β-hydroxybutyrate and acetoacetate levels were below the limit of quantification, lactate and pyruvate quantification was achieved in these cells. The obtained lactate/pyruvate ratios are shown in
Figure 3b. In agreement with results observed in precision-cut liver slices from rats, an increase of the lactate/pyruvate ratio was also observed in cells treated with H
2O
2 compared with the control group (cells incubated only with Dulbecco’s Modified Eagle Medium (DMEM)). In addition, cells incubated with H
2O
2 and exposed to CeO
2NPs presented a reduction of lactate/pyruvate ratio in comparison with cells incubated with H
2O
2 alone, which is consistent with the well-known property of this nanomaterial to participate in redox reactions [
31].
Although the described method in this study had an intended use of evaluating the cellular redox state by measuring the lactate/pyruvate ratio and β-hydroxybutyrate/acetoacetate ratios, the proposed method may also be suitable for other clinical or experimental situations, such as the evaluation of metabolic acidosis [
8] or inherited metabolic diseases [
9], where the quantification of one or more of these metabolites can be useful for the detection, diagnosis and treatment follow-up of specific conditions. Finally, and in contrast to other methods, the current method enables the simultaneous determination of the four metabolites and has been specifically validated both in plasma and in liver tissue in order to concomitantly assess the free NAD
+/NADH state in cytosol and mitochondria.


 ,
, 


