Abstract
Classical inflammation in response to bacterial, parasitic, or viral infections such as HIV includes local recruitment of neutrophils and macrophages and the production of proinflammatory cytokines and chemokines. Proposed biomarkers of organ integrity in Alcohol Use Disorders (AUD) include elevations in peripheral plasma levels of proinflammatory proteins. In testing this proposal, previous work included a group of human immunodeficiency virus (HIV)-infected individuals as positive controls and identified elevations in the soluble proteins TNFα and IP10; these cytokines were only elevated in AUD individuals seropositive for hepatitis C infection (HCV). The current observational, cross-sectional study evaluated whether higher levels of these proinflammatory cytokines would be associated with compromised brain integrity. Soluble protein levels were quantified in 86 healthy controls, 132 individuals with AUD, 54 individuals seropositive for HIV, and 49 individuals with AUD and HIV. Among the patient groups, HCV was present in 24 of the individuals with AUD, 13 individuals with HIV, and 20 of the individuals in the comorbid AUD and HIV group. Soluble protein levels were correlated to regional brain volumes as quantified with structural magnetic resonance imaging (MRI). In addition to higher levels of TNFα and IP10 in the 2 HIV groups and the HCV-seropositive AUD group, this study identified lower levels of IL1β in the 3 patient groups relative to the control group. Only TNFα, however, showed a relationship with brain integrity: in HCV or HIV infection, higher peripheral levels of TNFα correlated with smaller subcortical white matter volume. These preliminary results highlight the privileged status of TNFα on brain integrity in the context of infection.
1. Introduction
In seeking neural substrates of cognitive impairments observed in Alcohol Use Disorders (AUD) [1], medical conditions such as alcohol-related liver damage [2] or nutritional deficiencies (e.g., for thiamine which can result in Wernicke Korsakoff Syndrome) [3] must be considered [4] as they are independently related to cognitive dysfunction [5,6]. In both liver damage and thiamine deficiency, proposed biomarkers of disease include proinflammatory cytokines and chemokines. There is substantial support for the presence of peripheral inflammation—including proinflammatory protein production—in the transition from healthy liver to steatosis, hepatitis, and cirrhosis in alcohol-associated liver disease [7,8,9,10,11,12,13,14,15,16]. There is also experimental support for elevated peripheral levels of proinflammatory mediators in animal models of thiamine deficiency [17,18,19] and in non-alcohol-associated Wernicke’s encephalopathy [20], including tumor necrosis factor α (TNFα), interleukin (IL)1β, and IL6 [20,21,22].
Individuals with AUD have also been found to have increased representation of immune- and inflammation- related genes in the brain [23,24,25] and elevated protein levels of the chemokine monocyte chemoattractant protein-1 (MCP-1) in several brain regions [26]. In vivo, withdrawal from alcohol is associated with higher cerebrospinal fluid (CSF) levels of MCP-1 [27]. Peripheral (plasma/serum) elevations in MCP-1, TNFα, IL6, and interferon γ-induced protein 10 (IP10) [28,29,30] have been associated with AUD severity [31] or alcohol craving at early abstinence [32].
Our previous work reported higher than control IP10 and TNFα plasma levels in abstinent AUD individuals seropositive for hepatitis C virus (HCV) infection and in individuals infected with the human immunodeficiency virus (HIV) [33]. Specificity of IP10 and TNFα elevations to HCV infection status in AUD and HIV was provided by correlations between IP10 and TNFα levels, HCV viral load, and indices of liver integrity including the albumin/globulin ratio (AGR), fibrosis score (FIB4), and aspartate aminotransferase/platelet count ratio (APRI) [33].
The current study was conducted to confirm these findings in a larger sample of HCV seropositive individuals and to extend previous results by testing the hypothesis that elevated plasma IP10 and TNFα levels would be associated with compromised brain volume. Relatively few neuroimaging studies have evaluated the effects of HCV per se on the brain. Structural Magnetic Resonance Imaging (MRI) studies in HCV (absent hepatic encephalopathy or cirrhosis) relative to healthy controls report deficits in frontal and occipital cortical thickness [34], insular and thalamic volumes [35], or no effects of HCV on regional gray matter volumes [36]. Individuals with HCV exhibit altered metabolism in basal ganglia and white matter regions on MR Spectroscopy [37,38,39,40,41], while Diffusion Tensor Imaging (DTI) has shown increased diffusivity in white matter tracts including inferior longitudinal fasciculus and inferior fronto-occipital fasciculus [42]. In the context of HIV infection, HCV comorbidity further compromises white matter (e.g., greater volume deficits [43]; increased diffusivity [44,45], but see [46]) or shows greater anterior cingulate volume deficits [47] relative to HIV alone; in AUD, HCV comorbidity shows greater effects on frontal volume loss relative to AUD alone [48,49]. The few relevant neuroimaging studies in psychiatric disease have shown associations between elevated peripheral cytokines and smaller regional brain volumes: TNFα with smaller frontal gray volume in bipolar disorder/major depressive disorder [50] and with smaller hippocampus in major depressive disorder [51]; and elevated plasma IP10 with smaller volumes of basal ganglia structures [52].
Given the extant literature, the current study tested the hypotheses that elevated plasma TNFα would be associated smaller frontal gray and white matter volume, and elevated plasma IP10 would be associated with smaller caudate, putamen, and pallidum volumes.
2. Results
2.1. Study-Participant Demographics
Table 1 presents demographic data for each of the 4 groups. The control and AUD groups were younger than the HIV and AUD+HIVgroups (p = 0.007). The 3 patient groups relative to the control group were less educated, had lower socio-economic status (SES) [53] and global functioning (i.e., GAF) [54], scored lower on the Wechsler Test of Adult Reading (WTAR) [55], and endorsed more depressive symptoms (as determined by the BDI-II) (all p ≤ 0.0001). The Veterans Aging Cohort Study (VACS) index, which predicts all-cause mortality, cause-specific mortality, and other outcomes in those living with HIV infection [56], was higher in the 2 HIV groups (HIV and AUD+HIV) than the control or AUD groups.

Table 1.
Demographic characteristics of the 4 study groups: mean ± SD/frequency count.
2.2. Demographic Differences in Soluble Protein Levels
Initial analysis considered the effects of age, sex, race, and BMI on soluble protein levels across the 4 diagnostic groups. Soluble proteins showing age effects across all participants irrespective of diagnosis (N = 321) included IFNγ (r = −0.15, p = 0.006), IP10 (r = 0.23, p < 0.0001), MCP-1 (r = 0.17, p = 0.002), RANTES (r = 0.22, p < 0.0001), and TNFα (r = 0.16, p = 0.004). Only MDC showed sex effects (lower in men, t = −3.8, p = 0.0002). Race was differentially associated with the levels of GRO (F321 = 7.0, p = 0.001) and MDC (F321 = 7.9, p = 0.0005): higher in black people than white or other races; IP10 (F321 = 8.5, p = 0.0003) and MCP-1 (F321 = 9.8, p < 0.0001): higher in black people than white; IFNγ (F321 = 9.2, p = 0.0001) and IL12P70 (F321 = 5.1, p = 0.006): lower in black people than white or other races; and IL12P40 (F321 = 5.2, p = 0.006): lower in black people than white. None of the soluble proteins showed relationships with BMI. Soluble proteins showing age, sex, or race effects were statistically adjusted to produce Z-scores with the mean value of each soluble protein added back in (i.e., RANTES and TNFα for age; GRO, IL12P40, and IL12P70 for race; MDC for sex and race; IFNγ, IP10, and MCP-1 for age and race).
2.3. Patient Group Differences in Soluble Protein Levels
Results of separate 4-group ANOVAs for each soluble protein are presented in Table 2. Only 3 analytes showed significant 4-group effects surviving Bonferroni correction: IL1β was lower in all 3 patient groups relative to the control group (F320 = 7.04, p = 0.0001); IP10 (F320 = 14.76, p < 0.0001) and TNFα (F320 = 14.23, p < 0.0001) were higher in the 2 HIV groups relative to the control group (Figure 1). Evaluation of these 3 soluble proteins as a function of comorbidity with HCV in the AUD group demonstrated there was no interaction between IL1β and HCV status, whereas IP10 and TNFα levels were high only in AUD individuals seropositive for HCV (Figure 2). Among those with HIV, IP10 and TNFα levels were higher than controls regardless of HCV status. Two-group differences (t-tests) in soluble protein levels by initial diagnoses (i.e., AUD, HIV, or AUD+HIV) are presented in Supplementary Table S1 and by HCV status collapsed across the 3 patient groups in Supplementary Table S2.
Table 2.
Soluble protein levels * in the 4 study groups: mean ± SD and ANOVA results.
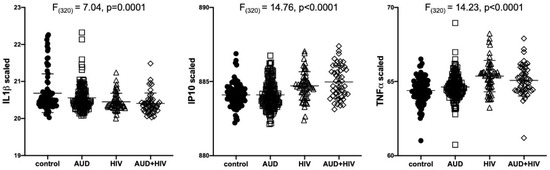
Figure 1.
Levels of soluble proteins by initial diagnoses. Relative to the control group, IL1β levels were low in the AUD (p = 0.02), HIV (p = 0.0004), and AUD+HIV (p = 0.0001) groups. Relative to the control group, IP10 and TNFα levels were high in the HIV and AUD+HIV groups (both p < 0.0001). IL1β: Interleukin (IL)1β; IP10: Interferon γ-induced Protein 10 (IP10); TNFα: Tumor Necrosis Factor α; black circles: healthy controls; open squares: Alcohol Use Disorder (AUD); open triangles: Human Immunodeficiency Virus (HIV); open diamonds: AUD+HIV.
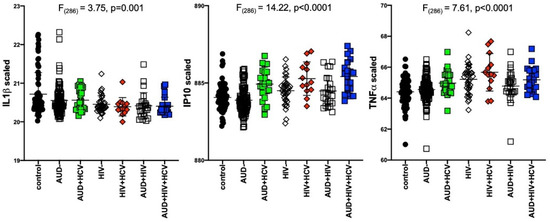
Figure 2.
Levels of soluble proteins by hepatitis C virus (HCV) serostatus among patient groups. IL1β: relative to controls, lower in AUD (p = 0.008), HIV (p = 0.001), HIV+HCV (p = 0.007), AUD+HIV (p = 0.001), AUD+HIV+HCV (p = 0.002). IP10: relative to controls, higher in AUD+HCV (p < 0.0001), HIV (p = 0.02), HIV+HCV (p < 0.0001), AUD+HIV (p = 0.5), AUD+HIV+HCV (p < 0.0001). Higher in AUD+HCV vs. AUD (p < 0.0001), HIV+HCV vs. HIV (p = 0.009), AUD+HIV+HCV vs. AUD+HIV (p = 0.0008). black circles: healthy controls; open squares: AUD; filled squares: AUD+HCV; open triangles: HIV; filled triangles: HIV+HCV; open diamonds: AUD+HIV; filled diamonds: AUD+HIV+HCV.
2.4. Soluble-Protein Correlations
Evaluation of IL1β correlations included the total AUD group and the 2 HIV groups (n = 235); IP10 and TNFα correlations included only HCV positive individuals in the AUD group and the 2 HIV groups (n = 127). Levels of IL1β, IP10, and TNFα were first evaluated for their relations with the volumes of 5 brain regions (frontal cortex, subcortical white matter, caudate, putamen, and pallidum). The only soluble protein showing a relation with brain volumes was TNFα: smaller subcortical white matter volumes were related to higher levels of TNFα (ρ = −0.24, p = 0.0095, Figure 3a). This relationship was also evident in HCV only (i.e., collapsed across the 3 initial groups, n = 57) subgroup (ρ = −0.36, p = 0.006, Figure 3b).
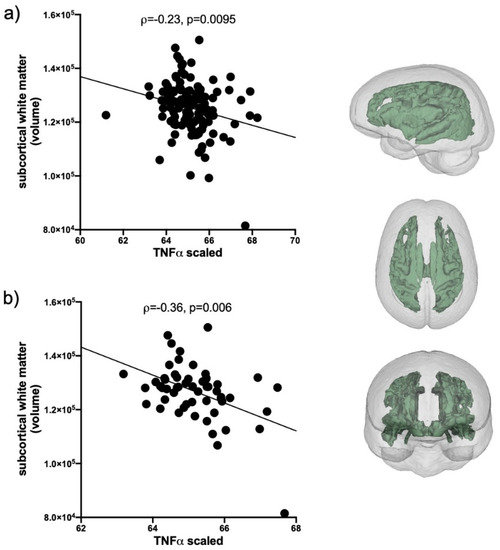
Figure 3.
TNFα correlations with subcortical white matter volume. (a) In HCV seropositive AUD individuals and the 2 HIV groups (black circles, n = 127). (b) In the subset of HCV seropositive individuals collapsed across the 3 patient groups (black circles, n = 57). Inset: subcortical white matter volume.
Further analysis considered relationships between ILβ, IP10, and TNFα levels and AUD-related variables (i.e., 1. AUD onset age, 2. AUD duration, 3. AUD DSM5 severity, 4. lifetime alcohol consumption, 5. days since last drink, 6. emergency-room detoxifications, 7. withdrawal-induced seizures, 8. AUD Identification Test (AUDIT) scores, 9. nicotine diagnosis, 10. history of smoking; requiring a Bonferroni-corrected p-value of 0.005 = 0.05/10 variables); HIV-related variables (i.e., 1. HIV onset age, 2. HIV duration, 3. CD4 cell count, 4. CD4 cell count nadir, 5. HIV viral load, 6. AIDS-defining events, 7. total number of HIV conditions, 8. ART medication status (on/off), 9. Karnofsky score, 10. VACS index; requiring a Bonferroni-corrected p-value of 0.005 = 0.05/10 variables); HCV-related variables (i.e., 1. HCV viral load, 2. FIB4 index, 3. APRI score, 4. AGR, 5. injection drug use, 6. AST, 7. ALT, 8. alkaline phosphatase (ALP), 9. γ-glutamyl transferase (GGT), 10. bilirubin; requiring a Bonferroni-corrected p-value of 0.005 = 0.05/10 variables); and laboratory blood markers (i.e., complete blood count: 1. hematocrit, 2. hemoglobin, 3. mean corpuscular volume, 4. red blood cells, 5. white blood cells; metabolic panel: 6. creatinine, 7. estimated glomerular filtration rate (eGFR), 8. glucose; nutrition panel: 9. folate, 10. prealbumin, requiring a Bonferroni-corrected p-value of 0.005 = 0.05/10 variables). Results of correlations are presented in Table 3. To summarize, there were no correlations between the levels of the 3 soluble proteins and AUD-related variables; ILβ levels were related to HIV-variables; IP10 levels were related to HCV-related variables and prealbumin; TNFα levels were related to both HIV and HCV related variables and several laboratory measures.
Table 3.
Nonparametric Spearman’s ρ correlates of soluble protein levels.
2.5. Principal Component Analysis
The 15 variables showing relationships with the 3 soluble proteins (from Table 3) were entered into a PCA (diagonals = 1, varimax rotation, limited to 3 factors) for data reduction for further analysis. Factor 1 (6 variables) included HCV viral load, FIB4, APRI, AST, ALT, and GGT. Factor 2 (5 variables) included injection drug use, VACS index, creatinine, eGFR, and prealbumin. Factor 3 (3 variables) included HIV viral load, total HIV conditions, and AGR. The principal components were saved with imputation for each subject.
2.6. Path Analysis
A path analysis including the 3 factors, the 3 soluble proteins, and subcortical white matter volume is presented in Figure 4. Factor 1 explained a large portion of variance (46%) in IP10 levels; factor 2 explained a similar proportion of the variance in TNFα levels. ILβ levels were also associated with factor 2. Among the soluble proteins, TNFα (20%) explained a larger portion of the variance in subcortical white matter volume than IP10 (8%) or ILβ (12%). In separate analysis for each soluble protein (Supplementary Figure S1), similar relationships were observed: factor 2 best predicted ILβ and TNFα levels; factor 1 predicted IP10 levels. Again, TNFα (23%) relative to IP10 (15%) or ILβ (13%) explained a larger portion of the variance in subcortical white matter volume. Finally, relative to the 3 factors, TNFα explained the largest portion of the variance in subcortical white matter volume (Supplementary Figure S2).
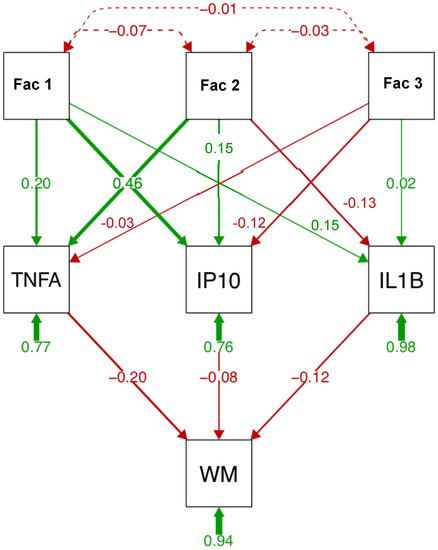
Figure 4.
Path analysis describing relationships between relevant variables, soluble protein levels, and subcortical white matter volume (WM). Path analysis includes 3 factors (reduced from 15 variables entered into principal component analysis (PCA)), 3 soluble proteins, and subcortical white matter in the HCV and HIV groups (n = 127). Factor 1 (6 variables) includes HCV viral load, fibrosis score (FIB4), aspartate aminotransferase/platelet count ratio (APRI), aspartate aminotransferase (AST), alanine aminotransferase (ALT), and γ-glutamyl transferase (GGT). Factor 2 (5 variables) includes injection drug use (IDU), VACS index, creatinine, estimated glomerular filtration rate (eGFR), and prealbumin. Factor 3 (3 variables) includes HIV viral load, total HIV conditions, and the albumin-to-globulin ratio (AGR).
3. Discussion
Analysis of 3 patient (AUD, HIV, AUD+HIV) groups relative to healthy controls identified 3 soluble proteins as related to diagnoses: IL1β was low in the 3 patient groups regardless of HCV status; IP10 and TNFα levels were higher than controls in patients with HCV or HIV. The most novel finding herein is the correlation between higher peripheral TNFα levels and smaller subcortical white matter volume in patients with HCV or HIV. Relationships between peripheral proinflammatory cytokine levels and infarct size following cerebral ischemia have been reported in the literature for some time [57,58] with hints that TNFα may have a privileged status with respect to influencing brain integrity [59]. Indeed, a role for TNFα in subcortical white matter damage in HIV-associated dementia has been proposed since 1993 based on TNFα quantification in postmortem brain tissue [60,61,62,63,64]. A large study of 1926 healthy individuals found a relationship between higher circulating TNFα levels and smaller total brain volume [65,66,67]. Additionally, in healthy individuals (n = 303), carriers of a TNFα polymorphic variant had smaller hippocampal volumes than non-carriers [68,69,70]. In older depressed adults, higher TNFα levels are associated with a greater volume of white matter hyperintensities [71,72]. Further, in bipolar disorder, a panel of proinflammatory cytokines including TNFα was associated with loss of frontal white matter integrity [73]. Whether TNFα specifically affects brain white matter integrity in a causative manner requires longitudinal investigation in larger samples.
Additional correlates are consistent with the interpretation that changes in the levels of IL1β, IP10, and TNFα are essentially explained by HIV or HCV infection. For example, IP10 and TNFα correlated with the albumin/globulin ratio (i.e., AGR) and a low AGR can be indicative of infection, liver disease, or malnutrition [74,75,76,77,78]. Indeed, the majority of IL1β, IP10, and TNFα correlates described herein comport with a large body of literature indicating the mediating roles of proinflammatory cytokines in the pathogenesis of viral infections. Elevations in plasma IP10 [79,80,81,82] and TNFα [83,84,85] are frequently reported in the HIV literature and correlate with HIV viral load. The current study demonstrating a predilection for higher IP10 in HCV-related hepatic inflammation and fibrosis (i.e., correlations with HCV viral load, FIB4, APRI, and other measures of liver dysfunction such as elevated AST, ALT, and GGT) replicates previous experiments [86,87], confirms reports that IP10 may be a useful biomarker of HCV and liver integrity [88,89,90], and suggests that HIV+HCV may result in significantly higher levels of IP10 than in either infection alone [91]. To our knowledge, the relationship between higher IP10 and lower prealbumin levels has not previously reported in the literature, but prealbumin levels are low in liver disease [92,93,94,95,96].
Non-liver and non-infection-related correlates of TNFα identified in this study also feature in the extant literature. For example, HIV infection features a strong negative correlation between TNFα and hemoglobin levels [97]. As TNFα inhibits erythropoiesis, elevated TNFα may contribute to anemia in HIV [98,99,100,101]. TNFα is also elevated in kidney disease [102] and correlates with high creatinine and low eGFR [100,101,103].
Low IL1β associated with HIV viremia and HIV-related complications (e.g., bacteremia, leukoplakia, neuropathy) is an exception in the literature as IL1β is considered proinflammatory and levels are typically [104,105,106] but not always [107] elevated in HIV. IL1β levels are also typically elevated in liver disease [108,109,110].
The original hypothesis was based on an emerging body of literature and expected that proinflammatory cytokines would be elevated in AUD regardless of HCV status. The current results, however, suggest that levels of these cytokines correlate with active infection unrelated to AUD or HIV diagnosis per se; rather, levels of soluble proteins were related to variables associated with untreated HCV rather than treated HIV infection or uninfected AUD. A limitation of this study, therefore, is that it did not include a patient population with active HCV infection without comorbidity to test the hypothesis that elevated TNFα and IP10 levels would correlate with diminished brain integrity.
In conclusion, this study aimed to determine whether elevated levels of TNFα and IP10 in HIV or HCV infection were related to brain integrity measures. Contrary to our initial hypotheses but consistent with the available literature, only TNFα showed relations with brain selective to subcortical white matter volume.
4. Materials and Methods
4.1. Study Participants
This cross-sectional, observational study was conducted in accordance with protocols approved by the Institutional Review Boards of Stanford University and SRI International. Written informed consent was obtained from all participants in accordance with the Declaration of Helsinki by the signing of consent documents in the presence of staff after staff ensured that each participant understood the information provided and appreciated the reasonably foreseeable consequences of a participating in the study. Study participants were healthy controls (39 women/47 men, 54.5 ± 11.8 years), individuals with AUD (41 women/91 men, 53.0 ± 9.8 years; currently sober as demonstrated by a negative Breathalyzer test given immediately following consent), those infected with HIV (18 women/37 men, 57.7 ± 7.9 years), and those comorbid for HIV and AUD (18 women/30 men, 57.2 ± 6.8 years), for a total of 321 participants.
All participants were screened using the Structured Clinical Interview for Diagnostic Statistical Manual (SCID/DSM)-IV or DSM5 [111], structured health questionnaires, and a semi-structured timeline follow-back interview to quantify lifetime alcohol consumption [112]. AUD participants were recruited from local outpatient substance abuse treatment programs and met DSM-IV-TR criteria for alcohol dependence or DSM-5 criteria for AUD. HIV patients were referred from local outpatient or treatment centers or recruited during presentations by project staff and by distribution of flyers at community events. Comparison participants were recruited from the local community by referrals and flyers. Upon initial assessment, subjects were excluded if they had fewer than 8 years of education, or a significant history of medical (e.g., epilepsy, stroke, multiple sclerosis, uncontrolled diabetes, or loss of consciousness >30 min), psychiatric (i.e., schizophrenia or bipolar I disorder), or neurological (e.g., neurodegenerative disease) disorders other than alcohol abuse or dependence (DSM-IV) or AUDs (DSM5) in the alcoholic (i.e., AUD) group. Other exclusionary criteria were recent (i.e., past 3 months) substance dependence other than alcohol in the AUD group or any DSM-IV/DSM5 Axis I disorder in the control group. Severity of depressive symptoms was assessed with the Beck Depression Inventory-II (BDI-II) [113] in all groups.
4.2. Blood Sample Collection and Processing
Whole blood samples (~4 mL) were collected in lavender EDTA tubes between March 2013 and June 2019. Samples were centrifuged (500 relative centrifugal force (rcf) at room temperature for 10 min). Plasma was transferred to 1.5 mL conical tubes, centrifuged at 13,000 rcf at room temperature for another 10 min, and the resulting supernatant was transferred to 1.5 mL conical tubes for storage at −80 °C until analysis by the Stanford Human Immune Monitoring Center (HIMC). Additional blood samples (~40 mL) were collected and immediately analyzed by Quest Diagnostics (Secaucus, NJ, USA) for complete blood count with differential, comprehensive metabolic panel, HIV and HCV screening, and RNA quantification when relevant (i.e., for HIV or HCV seropositive individuals). Laboratory testing was not available for 16 control, 6 AUD, 5 HIV, and 4 AUD+HIV participants.
Laboratory results were used to calculate 2 non-invasive indices of liver injury: the Fibrosis index (FIB4: based on age, aspartate aminotransferase (AST), alanine aminotransferase (ALT), and platelet count) [114] and the AST/platelet count ratio (APRI) score, which have high predictive accuracy for diagnoses of liver fibrosis [115,116]. FIB4 and APRI formulas are available in our previous publication [33]. Further, the simple ratio of albumin to globulin (AGR) has been used to predict mortality risk related to HCV infection [117,118].
4.3. Immunological Assays
The HIMC (http://iti.stanford.edu/himc/ (accessed on 5 May 2021)) which continually benchmarks processes to minimize technical variability (Maecker et al., 2005), performed immunological assays. Human 41-plex kits (HCYTOMAG-60K, 11 kits) were purchased from EMD Millipore (Burlington, MA, USA) and used according to the manufacturer’s recommendations with modifications. Briefly, samples were mixed with antibody-linked magnetic beads on a 96-well plate and incubated overnight incubation at 4 °C with shaking. Cold and room temperature incubation steps were performed on an orbital shaker at 500–600 rpm. Plates were washed twice with wash buffer in a BioTek ELx405 washer (BioTek Instruments, Winooski, VT, USA). Following one hour incubation at room temperature with biotinylated detection antibody, streptavidin fluorochrome (i.e., streptavidin-PE) was added for 30 min with shaking. Plates were washed as described and phosphate-buffered saline (PBS) added to wells for reading in the Luminex 200 Instrument (Merck KGaA, Darmstadt, Germany) with a lower bound of 50–100 beads per sample per soluble protein. Each sample was measured in duplicate. Custom assay control beads by Radix Biosolutions (Georgetown, TX, USA) were added to all wells.
The 41 soluble proteins quantified belong to 4 families: hematopoietin (interleukin (IL)-IL1α, IL1β, IL-1RA, IL2, IL3, IL4, IL5, IL6, IL7, IL9, IL10, IL12-p40, IL12-p70, IL13, IL15, IL17, soluble CD40 ligand (CD40L), Fms-related tyrosine kinase 3 ligand (Flt3 ligand), granulocyte colony-stimulating factor (GCSF), granulocyte macrophage CSF (GMCSF)); chemokines (epidermal growth factor (EGF), eotaxin (CCL11), fibroblast growth factor (FGF)-2, fractalkine, RANTES (regulated on activation, normal T cell expressed and secreted/CCL5), growth regulated oncogene (GRO/CXCl1), IL8, Interferon-γ-induced protein 10 (IP10/CXCL10), monocyte chemoattractant protein 1 (MCP-1/CCL2), MCP-3 (CCL7), macrophage-derived chemokine (MDC/CCL22), macrophage inflammatory protein (MIP)-1α, MIP-1β, transforming growth factor (TGF)α, vascular endothelial growth factor (VEGF)); growth factors (platelet-derived growth factor (PDGF)AA, PDGFBB, Tumor Necrosis Factor α (TNFα), TNFβ); and interferons (IFNα2, IFNγ).
4.4. Brain Volumes
Brain imaging cases matched to date of plasma collection for each individual were extracted from a laboratory release of 1602 instances of analyzed structural MRI data. Brain volumes used in the current analyses were age and supratentorial volume (svol)-corrected based on a subset of 238 vetted healthy controls. The 238 controls used for age- and svol-correction comprised 121 men and 117 women; 158 white, 25 black, and 53 other races; aged 46.5 ± 17.1 years (age range 19.5 to 86.1 years); predominately right-handed (206 right-handed, 8 left-handed, and 9 ambidextrous); with an average BMI of 25.4 ± 4.1; average education of 16.3 ± 2.2 years; and an average SES of 24.3 ± 11.2.
4.5. Image Acquisition and Processing
MR data were collected and processed using an in-house pipeline as described [49]. Briefly, structural images of the brain were collected on a 3-Tesla GE whole-body MR system (General Electric (GE) Healthcare, Waukesha, WI, USA) using an 8-channel phased-array head coil. The axial T1-weighted Inversion-Recovery Prepared SPoiled Gradient Recalled (SPGR) sequences acquired in the 6-year interval (i.e., March 2013–June 2019) used similar (e.g., inversion time (TI) = 300 ms, matrix = 256 × 256, thickness = 1.25 mm, skip = 0 mm, 124 slices, field of view (FOV) = 24 cm) or negligibly different (e.g., repetition time (TR) = 6.55 or 5.92 ms, echo time (TE) = 1.56 or 1.93 ms) parameters.
Preprocessing of T1-weighted SPGR data involved noise removal [119] and brain mask segmentation using FSL BET [120], AFNI 3dSkullStrip [121], and Robust Brain Extraction (ROBEX) [122] generating 3 brain masks. In parallel, noise-corrected, T1-weighted images were corrected for field inhomogeneity via N4ITK [123] and brain masks were segmented using the 3 methods listed above plus FreeSurfer mri_gcut [124]. The resulting 7 segmented brain masks were reduced to one using majority voting [125].
Brain tissue segmentation (gray matter, white matter, and cerebrospinal fluid) of the skull-stripped T1-weighted images was generated via Atropos [123]. Parcellated maps of gray matter regions used the parc116 atlas to define cortical and subcortical regions summed for bilateral hemispheres. Five regions including the frontal cortex, subcortical white matter, caudate, putamen, and pallidum were evaluated to determine potential associations with soluble protein levels.
4.6. Statistical Analysis
Duplicate raw values of Mean Fluorescence Intensity (MFI) for each analyte were run through an R utility released by HIMC (http://iti.stanford.edu/himc/new-statistical-consultation-service.html (accessed on 12 February 2021)), which corrects for plate (i.e., batch/lot) and nonspecific binding artifacts [126]. Following corrections, the group mean MFI value for each soluble protein was added back to the detrended values. Additional statistics were performed using JMP Pro 14.1.0 (SAS Institute Inc., North Carolina, USA). Four-group diagnoses effects were evaluated using analysis of variance (ANOVA); two-group comparisons used t-tests. Diagnostic effects on soluble proteins were only considered significant for Bonferroni-corrected probability values of p ≤ 0.001 (i.e., 0.05/41 soluble proteins). Correlations were evaluated using nonparametric χ2 or Spearman’s ρ. Correlations with brain volumes were considered significant for Bonferroni-corrected probability values of p ≤ 0.01 (i.e., 0.05/5 brain regions). Other correlations required Bonferroni-corrected values as described in relevant Results section. A data-driven approach including variables associated with soluble proteins were entered into a JMP-based principal component analysis (PCA). The soluble proteins showing diagnoses effects, results of the PCA limited to 3 factors, and relevant brain regions were entered in a path analysis in R (version 3.2.4) [127].
Supplementary Materials
The following are available online at https://www.mdpi.com/article/10.3390/ijms22094953/s1. Supplementary Figure S1: Separate path analysis for each soluble protein. These path analyses consider relationships between 3-factors and subcortical white matter for each soluble protein separately. Supplementary Figure S2: (a) Path analysis considering 3 factor contributions to subcortical white matter independently of soluble protein levels. (b) Path analysis considering 3 factor contributions to subcortical white matter relative to TNFα. Supplementary Table S1: Soluble protein levels by diagnostic pairs. Supplementary Table S2: Soluble protein levels by HCV status.
Author Contributions
Conceptualization: N.M.Z., A.P.; methodology: N.M.Z., K.M.P., E.V.S., A.P.; formal analysis: N.M.Z., K.M.P., A.P.; investigation: N.M.Z.; resources: N.M.Z., E.V.S., A.P.; data curation: N.M.Z.; writing—original draft preparation: N.M.Z., A.J.K.; writing—review and editing: A.J.K., E.V.S.; project administration: N.M.Z.; funding acquisition: N.M.Z., E.V.S., A.P. All authors have read and agreed to the published version of the manuscript.
Funding
This study was supported with grant funding from the National Institute of Alcohol Abuse and Alcoholism (NIAAA) including U01 AA017347, U01 AA013521, R01 AA005965, R37 AA010723 and R01 MH113406.
Institutional Review Board Statement
The study was conducted according to the guidelines of the Declaration of Helsinki and approved by the Institutional Review Board (or Ethics Committee) of SRI International Protocol ID SRI- 40008 2/3/2020, Protocol ID SRI-40045 6/30/20, and Stanford University Protocol ID IRB-26710 1/31/2021, Protocol ID IRB-22487 11/30/2020.
Informed Consent Statement
Informed consent was obtained from all subjects involved in the study.
Data Availability Statement
The data that support the findings of this study will be openly available (12 October 2021) at https://data.mendeley.com/ in Zahr cytokine brain.
Acknowledgments
The authors wish to acknowledge Priya Asok for collecting and organizing blood samples, Yael Rosenberg-Hasson for coordinating analysis at the HIMC, and Qingyu Zhou for providing the subcortical white matter image (subset Figure 3).
Conflicts of Interest
The authors declare no conflict of interest.
References
- Sullivan, E.V.; Pfefferbaum, A. Brain-behavior relations and effects of aging and common comorbidities in alcohol use disorder: A review. Neuropsychology 2019, 33, 760–780. [Google Scholar] [CrossRef]
- Shen, N.T.; Salajegheh, A.; Brown, R.S., Jr. A Call to Standardize Definitions, Data Collection, and Outcome Assessment to Improve Care in Alcohol-Related Liver Disease. Hepatology 2019, 70, 1038–1044. [Google Scholar] [CrossRef]
- Harper, C.; Fornes, P.; Duyckaerts, C.; Lecomte, D.; Hauw, J.J. An international perspective on the prevalence of the Wernicke-Korsakoff syndrome. Metab. Brain Dis. 1995, 10, 17–24. [Google Scholar] [CrossRef] [PubMed]
- Harper, C.; Dixon, G.; Sheedy, D.; Garrick, T. Neuropathological alterations in alcoholic brains. Studies arising from the New South Wales Tissue Resource Centre. Prog. Neuropsychopharmacol. Biol. Psychiatry 2003, 27, 951–961. [Google Scholar] [CrossRef]
- Tapper, E.B.; Kanwal, F.; Asrani, S.K.; Ho, C.; Ovchinsky, N.; Poterucha, J.; Flores, A.; Smith, J.E.; Ankoma-Sey, V.; Luxon, B.; et al. Patient-reported outcomes in cirrhosis: A scoping review of the literature. Hepatology 2018, 67, 2375–2383. [Google Scholar] [CrossRef]
- Svanberg, J.; Evans, J.J. Neuropsychological rehabilitation in alcohol-related brain damage: A systematic review. Alcohol Alcohol. 2013, 48, 704–711. [Google Scholar] [CrossRef]
- McMullen, M.R.; Pritchard, M.T.; Wang, Q.; Millward, C.A.; Croniger, C.M.; Nagy, L.E. Early growth response-1 transcription factor is essential for ethanol-induced fatty liver injury in mice. Gastroenterology 2005, 128, 2066–2076. [Google Scholar] [CrossRef] [PubMed]
- Bode, C.; Bode, J.C. Activation of the innate immune system and alcoholic liver disease: Effects of ethanol per se or enhanced intestinal translocation of bacterial toxins induced by ethanol? Alcohol. Clin. Exp. Res. 2005, 29 (Suppl. 11), 166S–171S. [Google Scholar] [CrossRef]
- Valles, S.L.; Blanco, A.M.; Azorin, I.; Guasch, R.; Pascual, M.; Gomez-Lechon, M.J.; Renau-Piqueras, J.; Guerri, C. Chronic ethanol consumption enhances interleukin-1-mediated signal transduction in rat liver and in cultured hepatocytes. Alcohol. Clin. Exp. Res. 2003, 27, 1979–1986. [Google Scholar] [CrossRef] [PubMed]
- Hill, D.B.; Marsano, L.S.; McClain, C.J. Increased plasma interleukin-8 concentrations in alcoholic hepatitis. Hepatology 1993, 18, 576–580. [Google Scholar] [CrossRef]
- McClain, C.J.; Song, Z.; Barve, S.S.; Hill, D.B.; Deaciuc, I. Recent advances in alcoholic liver disease. IV. Dysregulated cytokine metabolism in alcoholic liver disease. Am. J. Physiol. 2004, 287, G497–G502. [Google Scholar] [CrossRef] [PubMed]
- McClain, C.J.; Cohen, D.A. Increased tumor necrosis factor production by monocytes in alcoholic hepatitis. Hepatology 1989, 9, 349–351. [Google Scholar] [CrossRef] [PubMed]
- Bird, G.L.; Sheron, N.; Goka, A.K.; Alexander, G.J.; Williams, R.S. Increased plasma tumor necrosis factor in severe alcoholic hepatitis. Ann. Intern. Med. 1990, 112, 917–920. [Google Scholar] [CrossRef] [PubMed]
- Tilg, H.; Jalan, R.; Kaser, A.; Davies, N.A.; Offner, F.A.; Hodges, S.J.; Ludwiczek, O.; Shawcross, D.; Zoller, H.; Alisa, A.; et al. Anti-tumor necrosis factor-alpha monoclonal antibody therapy in severe alcoholic hepatitis. J. Hepatol. 2003, 38, 419–425. [Google Scholar] [CrossRef]
- Barbier, L.; Ferhat, M.; Salamé, E.; Robin, A.; Herbelin, A.; Gombert, J.M.; Silvain, C.; Barbarin, A. Interleukin-1 Family Cytokines: Keystones in Liver Inflammatory Diseases. Front. Immunol. 2019, 10, 2014. [Google Scholar] [CrossRef]
- Hosseini, N.; Shor, J.; Szabo, G. Alcoholic Hepatitis: A Review. Alcohol Alcohol. 2019, 54, 408–416. [Google Scholar] [CrossRef]
- Todd, K.G.; Butterworth, R.F. Early microglial response in experimental thiamine deficiency: An immunohistochemical analysis. Glia 1999, 25, 190–198. [Google Scholar] [CrossRef]
- Vemuganti, R.; Kalluri, H.; Yi, J.H.; Bowen, K.K.; Hazell, A.S. Gene expression changes in thalamus and inferior colliculus associated with inflammation, cellular stress, metabolism and structural damage in thiamine deficiency. Eur. J. Neurosci. 2006, 23, 1172–1188. [Google Scholar] [CrossRef]
- Karuppagounder, S.S.; Shi, Q.; Xu, H.; Gibson, G.E. Changes in inflammatory processes associated with selective vulnerability following mild impairment of oxidative metabolism. Neurobiol. Dis. 2007, 26, 353–362. [Google Scholar] [CrossRef][Green Version]
- Neri, M.; Cantatore, S.; Pomara, C.; Riezzo, I.; Bello, S.; Turillazzi, E.; Fineschi, V. Immunohistochemical expression of proinflammatory cytokines IL-1β, IL-6, TNF-α and involvement of COX-2, quantitatively confirmed by Western blot analysis, in Wernicke’s encephalopathy. Pathol. Res. Pract. 2011, 207, 652–658. [Google Scholar] [CrossRef] [PubMed]
- Sureka, B.; Bansal, K.; Patidar, Y.; Rajesh, S.; Mukund, A.; Arora, A. Neurologic Manifestations of Chronic Liver Disease and Liver Cirrhosis. Curr. Probl. Diagn. Radiol. 2015, 44, 449–461. [Google Scholar] [CrossRef] [PubMed]
- Srivastava, A.; Yadav, S.K.; Borkar, V.V.; Yadav, A.; Yachha, S.K.; Thomas, M.A.; Rathore, R.K.; Pandey, C.M.; Gupta, R.K. Serial evaluation of children with ALF with advanced MRI, serum proinflammatory cytokines, thiamine, and cognition assessment. J. Pediatr. Gastroenterol. Nutr. 2012, 55, 580–586. [Google Scholar] [CrossRef] [PubMed]
- Liu, J.; Lewohl, J.M.; Dodd, P.R.; Randall, P.K.; Harris, R.A.; Mayfield, R.D. Gene expression profiling of individual cases reveals consistent transcriptional changes in alcoholic human brain. J. Neurochem. 2004, 90, 1050–1058. [Google Scholar] [CrossRef]
- Liu, J.; Lewohl, J.M.; Harris, R.A.; Iyer, V.R.; Dodd, P.R.; Randall, P.K.; Mayfield, R.D. Patterns of gene expression in the frontal cortex discriminate alcoholic from nonalcoholic individuals. Neuropsychopharmacology 2006, 31, 1574–1582. [Google Scholar] [CrossRef]
- Flatscher-Bader, T.; van der Brug, M.; Hwang, J.W.; Gochee, P.A.; Matsumoto, I.; Niwa, S.; Wilce, P.A. Alcohol-responsive genes in the frontal cortex and nucleus accumbens of human alcoholics. J. Neurochem. 2005, 93, 359–370. [Google Scholar] [CrossRef] [PubMed]
- He, J.; Crews, F.T. Increased MCP-1 and microglia in various regions of the human alcoholic brain. Exp. Neurol. 2008, 210, 349–358. [Google Scholar] [CrossRef] [PubMed]
- Umhau, J.C.; Schwandt, M.; Solomon, M.G.; Yuan, P.; Nugent, A.; Zarate, C.A.; Drevets, W.C.; Hall, S.D.; George, D.T.; Heilig, M. Cerebrospinal fluid monocyte chemoattractant protein-1 in alcoholics: Support for a neuroinflammatory model of chronic alcoholism. Alcohol. Clin. Exp. Res. 2014, 38, 1301–1306. [Google Scholar] [CrossRef]
- Manzardo, A.M.; Poje, A.B.; Penick, E.C.; Butler, M.G. Multiplex Immunoassay of Plasma Cytokine Levels in Men with Alcoholism and the Relationship to Psychiatric Assessments. Int. J. Mol. Sci. 2016, 17, 472. [Google Scholar] [CrossRef]
- Gonzalez-Reimers, E.; Fernandez-Rodriguez, C.M.; Santolaria-Fernandez, F.; de la Vega-Prieto, M.J.; Martin-Gonzalez, C.; Gomez-Rodriguez, M.A.; Aleman-Valls, M.R.; Rodriguez-Gaspar, M. Interleukin-15 and other myokines in chronic alcoholics. Alcohol Alcohol. 2011, 46, 529–533. [Google Scholar] [CrossRef][Green Version]
- Irwin, M.; Rinetti, G.; Redwine, L.; Motivala, S.; Dang, J.; Ehlers, C. Nocturnal proinflammatory cytokine-associated sleep disturbances in abstinent African American alcoholics. Brain Behav. Immun. 2004, 18, 349–360. [Google Scholar] [CrossRef]
- Neupane, S.P.; Lien, L.; Ueland, T.; Mollnes, T.E.; Aukrust, P.; Bramness, J.G. Serum brain-derived neurotrophic factor levels in relation to comorbid depression and cytokine levels in Nepalese men with alcohol-use disorders. Alcohol 2015, 49, 471–478. [Google Scholar] [CrossRef]
- Leclercq, S.; Cani, P.D.; Neyrinck, A.M.; Starkel, P.; Jamar, F.; Mikolajczak, M.; Delzenne, N.M.; de Timary, P. Role of intestinal permeability and inflammation in the biological and behavioral control of alcohol-dependent subjects. Brain Behav. Immun. 2012, 26, 911–918. [Google Scholar] [CrossRef]
- Zahr, N.M. Peripheral TNFalpha elevations in abstinent alcoholics are associated with hepatitis C infection. PLoS ONE 2018, 13, e0191586. [Google Scholar] [CrossRef]
- Hjerrild, S.; Renvillard, S.G.; Leutscher, P.; Sorensen, L.H.; Ostergaard, L.; Eskildsen, S.F.; Videbech, P. Reduced cerebral cortical thickness in Non-cirrhotic patients with hepatitis C. Metab. Brain Dis. 2016, 31, 311–319. [Google Scholar] [CrossRef]
- Prell, T.; Dirks, M.; Arvanitis, D.; Braun, D.; Peschel, T.; Worthmann, H.; Schuppner, R.; Raab, P.; Grosskreutz, J.; Weissenborn, K. Cerebral patterns of neuropsychological disturbances in hepatitis C patients. J. Neurovirol. 2019, 25, 229–238. [Google Scholar] [CrossRef] [PubMed]
- Kharabian Masouleh, S.; Herzig, S.; Klose, L.; Roggenhofer, E.; Tenckhoff, H.; Kaiser, T.; Thöne-Otto, A.; Wiese, M.; Berg, T.; Schroeter, M.L.; et al. Functional connectivity alterations in patients with chronic hepatitis C virus infection: A multimodal MRI study. J. Viral. Hepat. 2017, 24, 216–225. [Google Scholar] [CrossRef]
- Forton, D.M.; Allsop, J.M.; Main, J.; Foster, G.R.; Thomas, H.C.; Taylor-Robinson, S.D. Evidence for a cerebral effect of the hepatitis C virus. Lancet 2001, 358, 38–39. [Google Scholar] [CrossRef]
- Forton, D.M.; Thomas, H.C.; Murphy, C.A.; Allsop, J.M.; Foster, G.R.; Main, J.; Wesnes, K.A.; Taylor-Robinson, S.D. Hepatitis C and cognitive impairment in a cohort of patients with mild liver disease. Hepatology 2002, 35, 433–439. [Google Scholar] [CrossRef] [PubMed]
- McAndrews, M.P.; Farcnik, K.; Carlen, P.; Damyanovich, A.; Mrkonjic, M.; Jones, S.; Heathcote, E.J. Prevalence and significance of neurocognitive dysfunction in hepatitis C in the absence of correlated risk factors. Hepatology 2005, 41, 801–808. [Google Scholar] [CrossRef] [PubMed]
- Forton, D.M.; Hamilton, G.; Allsop, J.M.; Grover, V.P.; Wesnes, K.; O’Sullivan, C.; Thomas, H.C.; Taylor-Robinson, S.D. Cerebral immune activation in chronic hepatitis C infection: A magnetic resonance spectroscopy study. J. Hepatol. 2008, 49, 316–322. [Google Scholar] [CrossRef]
- Bokemeyer, M.; Ding, X.Q.; Goldbecker, A.; Raab, P.; Heeren, M.; Arvanitis, D.; Tillmann, H.L.; Lanfermann, H.; Weissenborn, K. Evidence for neuroinflammation and neuroprotection in HCV infection-associated encephalopathy. Gut 2011, 60, 370–377. [Google Scholar] [CrossRef] [PubMed]
- Bladowska, J.; Zimny, A.; Knysz, B.; Malyszczak, K.; Koltowska, A.; Szewczyk, P.; Gasiorowski, J.; Furdal, M.; Sasiadek, M.J. Evaluation of early cerebral metabolic, perfusion and microstructural changes in HCV-positive patients: A pilot study. J. Hepatol. 2013, 59, 651–657. [Google Scholar] [CrossRef] [PubMed]
- Jernigan, T.L.; Archibald, S.L.; Fennema-Notestine, C.; Taylor, M.J.; Theilmann, R.J.; Julaton, M.D.; Notestine, R.J.; Wolfson, T.; Letendre, S.L.; Ellis, R.J.; et al. Clinical factors related to brain structure in HIV: The CHARTER study. J. Neurovirol. 2011, 17, 248–257. [Google Scholar] [CrossRef] [PubMed]
- Stebbins, G.T.; Smith, C.A.; Bartt, R.E.; Kessler, H.A.; Adeyemi, O.M.; Martin, E.; Cox, J.L.; Bammer, R.; Moseley, M.E. HIV-associated alterations in normal-appearing white matter: A voxel-wise diffusion tensor imaging study. J. Acquir. Immune. Defic. Syndr. 2007, 46, 564–573. [Google Scholar] [CrossRef] [PubMed]
- Gongvatana, A.; Cohen, R.A.; Correia, S.; Devlin, K.N.; Miles, J.; Kang, H.; Ombao, H.; Navia, B.; Laidlaw, D.H.; Tashima, K.T. Clinical contributors to cerebral white matter integrity in HIV-infected individuals. J. Neurovirol. 2011, 17, 477–486. [Google Scholar] [CrossRef] [PubMed]
- Heaps-Woodruff, J.M.; Wright, P.W.; Ances, B.M.; Clifford, D.; Paul, R.H. The impact of human immune deficiency virus and hepatitis C coinfection on white matter microstructural integrity. J. Neurovirol. 2016, 22, 389–399. [Google Scholar] [CrossRef]
- Pfefferbaum, A.; Rosenbloom, M.J.; Sassoon, S.A.; Kemper, C.A.; Deresinski, S.; Rohlfing, T.; Sullivan, E.V. Regional Brain Structural Dysmorphology in Human Immunodeficiency Virus Infection: Effects of Acquired Immune Deficiency Syndrome, Alcoholism, and Age. Biol. Psychiatry 2012, 72, 361–370. [Google Scholar] [CrossRef] [PubMed]
- Sullivan, E.V.; Zahr, N.M.; Sassoon, S.A.; Thompson, W.K.; Kwon, D.; Pohl, K.M.; Pfefferbaum, A. The Role of Aging, Drug Dependence, and Hepatitis C Comorbidity in Alcoholism Cortical Compromise. JAMA Psychiatry 2018, 75, 474–483. [Google Scholar] [CrossRef]
- Pfefferbaum, A.; Zahr, N.M.; Sassoon, S.A.; Kwon, D.; Pohl, K.M.; Sullivan, E.V. Accelerated and Premature Aging Characterizing Regional Cortical Volume Loss in Human Immunodeficiency Virus Infection: Contributions From Alcohol, Substance Use, and Hepatitis C Coinfection. Biol. Psychiatry. Cogn. Neurosci. Neuroimaging 2018, 3, 844–859. [Google Scholar] [CrossRef]
- Chen, M.H.; Kao, Z.K.; Chang, W.C.; Tu, P.C.; Hsu, J.W.; Huang, K.L.; Su, T.P.; Li, C.T.; Lin, W.C.; Tsai, S.J.; et al. Increased Proinflammatory Cytokines, Executive Dysfunction, and Reduced Gray Matter Volumes In First-Episode Bipolar Disorder and Major Depressive Disorder. J. Affect. Disord. 2020, 274, 825–831. [Google Scholar] [CrossRef]
- Belge, J.B.; van Diermen, L.; Sabbe, B.; Parizel, P.; Morrens, M.; Coppens, V.; Constant, E.; de Timary, P.; Sienaert, P.; Schrijvers, D.; et al. Inflammation, Hippocampal Volume, and Therapeutic Outcome following Electroconvulsive Therapy in Depressive Patients: A Pilot Study. Neuropsychobiology 2020, 79, 222–232. [Google Scholar] [CrossRef] [PubMed]
- Gongvatana, A.; Correia, S.; Dunsiger, S.; Gauthier, L.; Devlin, K.N.; Ross, S.; Navia, B.; Tashima, K.T.; DeLaMonte, S.; Cohen, R.A. Plasma cytokine levels are related to brain volumes in HIV-infected individuals. J. Neuroimmune Pharm. 2014, 9, 740–750. [Google Scholar] [CrossRef]
- First, M.B.; Spitzer, R.L.; Gibbon, M.; Williams, J.B.W. Structured Clinical Interview for DSM-IV Axis I Disorders (SCID) Version 2.0; Biometrics Research Department, New York State Psychiatric Institute: New York, NY, USA, 1998. [Google Scholar]
- Skinner, H.A.; Sheu, W.J. Reliability of alcohol use indices. The Lifetime Drinking History and the MAST. J. Stud. Alcohol 1982, 43, 1157–1170. [Google Scholar] [CrossRef] [PubMed]
- Beck, A.T.; Steer, R.A.; Brown, G.K. Manual for the Beck Depression Inventory-II; Psychological Corporation: San Antonio, TX, USA, 1996. [Google Scholar]
- Hollingshead, A. Four-Factor Index of Social Status; Department of Sociology, Yale University: New Haven, CT, USA, 1975. [Google Scholar]
- Endicott, J.; Spitzer, R.L.; Fleiss, J.L.; Cohen, J. The global assessment scale. A procedure for measuring overall severity of psychiatric disturbance. Arch. Gen. Psychiatry 1976, 33, 766–771. [Google Scholar] [CrossRef]
- Wechsler, D. Wechsler Test of Adult Reading: WTAR; Pearson Education, Inc.: San Antonio, TX, USA, 2001. [Google Scholar]
- Tate, J.P.; Justice, A.C.; Hughes, M.D.; Bonnet, F.; Reiss, P.; Mocroft, A.; Nattermann, J.; Lampe, F.C.; Bucher, H.C.; Sterling, T.R.; et al. An internationally generalizable risk index for mortality after one year of antiretroviral therapy. AIDS 2013, 27, 563–572. [Google Scholar] [CrossRef]
- Sterling, R.K.; Lissen, E.; Clumeck, N.; Sola, R.; Correa, M.C.; Montaner, J.; Sulkowski, S.M.; Torriani, F.J.; Dieterich, D.T.; Thomas, D.L.; et al. Development of a simple noninvasive index to predict significant fibrosis in patients with HIV/HCV coinfection. Hepatology 2006, 43, 1317–1325. [Google Scholar] [CrossRef]
- Thandassery, R.B.; Al Kaabi, S.; Soofi, M.E.; Mohiuddin, S.A.; John, A.K.; Al Mohannadi, M.; Al Ejji, K.; Yakoob, R.; Derbala, M.F.; Wani, H.; et al. Mean Platelet Volume, Red Cell Distribution Width to Platelet Count Ratio, Globulin Platelet Index, and 16 Other Indirect Noninvasive Fibrosis Scores: How Much Do Routine Blood Tests Tell about Liver Fibrosis in Chronic Hepatitis C? J. Clin. Gastroenterol. 2016, 50, 518–523. [Google Scholar] [CrossRef]
- Fouad, S.A.; Esmat, S.; Omran, D.; Rashid, L.; Kobaisi, M.H. Noninvasive assessment of hepatic fibrosis in Egyptian patients with chronic hepatitis C virus infection. World J. Gastroenterol. 2012, 18, 2988–2994. [Google Scholar] [CrossRef] [PubMed]
- Lee, C.H.; Shin, H.P.; Lee, J.I.; Joo, K.R.; Cha, J.M.; Jeon, J.W.; Lim, J.U.; Min, J.K.; Kim, D.H.; Kang, S.W.; et al. Predicting factors of present hepatitis C virus infection among patients positive for the hepatitis C virus antibody. Clin. Mol. Hepatol. 2013, 19, 376–381. [Google Scholar] [CrossRef]
- Scherzer, R.; Heymsfield, S.B.; Rimland, D.; Powderly, W.G.; Tien, P.C.; Bacchetti, P.; Shlipak, M.G.; Grunfeld, C.; Study of Fat Redistribution, Metabolic Change in HIV Infection (FRAM). Association of serum albumin and aspartate transaminase with 5-year all-cause mortality in HIV/hepatitis C virus coinfection and HIV monoinfection. AIDS 2017, 31, 71–79. [Google Scholar] [CrossRef]
- Coupe, P.; Yger, P.; Prima, S.; Hellier, P.; Kervrann, C.; Barillot, C. An optimized blockwise nonlocal means denoising filter for 3-D magnetic resonance images. IEEE Trans. Med. Imaging 2008, 27, 425–441. [Google Scholar] [CrossRef] [PubMed]
- Smith, S.M. Fast robust automated brain extraction. Hum. Brain Mapp. 2002, 17, 143–155. [Google Scholar] [CrossRef] [PubMed]
- Cox, R.W. AFNI: Software for analysis and visualization of functional magnetic resonance neuroimages. Comput Biomed. Res. 1996, 29, 162–173. [Google Scholar] [CrossRef] [PubMed]
- Iglesias, J.E.; Liu, C.Y.; Thompson, P.M.; Tu, Z. Robust brain extraction across datasets and comparison with publicly available methods. IEEE Trans. Med. Imaging 2011, 30, 1617–1634. [Google Scholar] [CrossRef]
- Avants, B.B.; Tustison, N.J.; Song, G.; Cook, P.A.; Klein, A.; Gee, J.C. A reproducible evaluation of ANTs similarity metric performance in brain image registration. NeuroImage 2011, 54, 2033–2044. [Google Scholar] [CrossRef] [PubMed]
- Sadananthan, S.A.; Zheng, W.; Chee, M.W.; Zagorodnov, V. Skull stripping using graph cuts. NeuroImage 2010, 49, 225–239. [Google Scholar] [CrossRef]
- Rohlfing, T.; Brandt, R.; Menzel, R.; Maurer, C.R., Jr. Evaluation of atlas selection strategies for atlas-based image segmentation with application to confocal microscopy images of bee brains. NeuroImage 2004, 21, 1428–1442. [Google Scholar] [CrossRef] [PubMed]
- Maecker, H.T.; Rosenberg-Hasson, Y.; Kolstad, K.D.; Steen, V.D.; Chung, L.S. A Novel Utility to Correct for Plate/Batch/Lot and Nonspecific Binding Artifacts in Luminex Data. J. Immunol. 2020, 204, 3425–3433. [Google Scholar] [CrossRef]
- R Core Team. R: A Language and Environment for Statistical Computing; R Foundation for Statistical Computing: Vienna, Austria, 2020. [Google Scholar]
- Fassbender, K.; Rossol, S.; Kammer, T.; Daffertshofer, M.; Wirth, S.; Dollman, M.; Hennerici, M. Proinflammatory cytokines in serum of patients with acute cerebral ischemia: Kinetics of secretion and relation to the extent of brain damage and outcome of disease. J. Neurol. Sci. 1994, 122, 135–139. [Google Scholar] [CrossRef]
- Vila, N.; Castillo, J.; Dávalos, A.; Chamorro, A. Proinflammatory cytokines and early neurological worsening in ischemic stroke. Stroke A J. Cereb. Circ. 2000, 31, 2325–2329. [Google Scholar] [CrossRef] [PubMed]
- Meistrell, M.E., 3rd; Botchkina, G.I.; Wang, H.; Di Santo, E.; Cockroft, K.M.; Bloom, O.; Vishnubhakat, J.M.; Ghezzi, P.; Tracey, K.J. Tumor necrosis factor is a brain damaging cytokine in cerebral ischemia. Shock 1997, 8, 341–348. [Google Scholar] [CrossRef]
- Wesselingh, S.L.; Power, C.; Glass, J.D.; Tyor, W.R.; McArthur, J.C.; Farber, J.M.; Griffin, J.W.; Griffin, D.E. Intracerebral cytokine messenger RNA expression in acquired immunodeficiency syndrome dementia. Ann. Neurol. 1993, 33, 576–582. [Google Scholar] [CrossRef]
- Glass, J.D.; Wesselingh, S.L.; Selnes, O.A.; McArthur, J.C. Clinical-neuropathologic correlation in HIV-associated dementia. Neurology 1993, 43, 2230–2237. [Google Scholar] [CrossRef] [PubMed]
- Seilhean, D.; Kobayashi, K.; He, Y.; Uchihara, T.; Rosenblum, O.; Katlama, C.; Bricaire, F.; Duyckaerts, C.; Hauw, J.J. Tumor necrosis factor-alpha, microglia and astrocytes in AIDS dementia complex. Acta Neuropathol. 1997, 93, 508–517. [Google Scholar] [CrossRef] [PubMed]
- Rostasy, K.; Monti, L.; Lipton, S.A.; Hedreen, J.C.; Gonzalez, R.G.; Navia, B.A. HIV leucoencephalopathy and TNFalpha expression in neurones. J. Neurol. Neurosurg Psychiatry 2005, 76, 960–964. [Google Scholar] [CrossRef] [PubMed]
- Xing, H.Q.; Hayakawa, H.; Izumo, K.; Kubota, R.; Gelpi, E.; Budka, H.; Izumo, S. In vivo expression of proinflammatory cytokines in HIV encephalitis: An analysis of 11 autopsy cases. Neuropathol. Off. J. Jpn. Soc. Neuropathol. 2009, 29, 433–442. [Google Scholar] [CrossRef] [PubMed]
- Jefferson, A.L.; Massaro, J.M.; Wolf, P.A.; Seshadri, S.; Au, R.; Vasan, R.S.; Larson, M.G.; Meigs, J.B.; Keaney, J.F., Jr.; Lipinska, I.; et al. Inflammatory biomarkers are associated with total brain volume: The Framingham Heart Study. Neurology 2007, 68, 1032–1038. [Google Scholar] [CrossRef]
- Braskie, M.N.; Boyle, C.P.; Rajagopalan, P.; Gutman, B.A.; Toga, A.W.; Raji, C.A.; Tracy, R.P.; Kuller, L.H.; Becker, J.T.; Lopez, O.L.; et al. Physical activity, inflammation, and volume of the aging brain. Neuroscience 2014, 273, 199–209. [Google Scholar] [CrossRef]
- Zhang, H.; Sachdev, P.S.; Wen, W.; Crawford, J.D.; Brodaty, H.; Baune, B.T.; Kochan, N.A.; Slavin, M.J.; Reppermund, S.; Kang, K.; et al. The relationship between inflammatory markers and voxel-based gray matter volumes in nondemented older adults. Neurobiol. Aging 2016, 37, 138–146. [Google Scholar] [CrossRef]
- Baune, B.T.; Konrad, C.; Grotegerd, D.; Suslow, T.; Ohrmann, P.; Bauer, J.; Arolt, V.; Heindel, W.; Domschke, K.; Schöning, S.; et al. Tumor necrosis factor gene variation predicts hippocampus volume in healthy individuals. Biol. Psychiatry 2012, 72, 655–662. [Google Scholar] [CrossRef]
- Wagner, G.; Herbsleb, M.; de la Cruz, F.; Schumann, A.; Brünner, F.; Schachtzabel, C.; Gussew, A.; Puta, C.; Smesny, S.; Gabriel, H.W.; et al. Hippocampal structure, metabolism, and inflammatory response after a 6-week intense aerobic exercise in healthy young adults: A controlled trial. J. Cereb. Blood Flow Metab. 2015, 35, 1570–1578. [Google Scholar] [CrossRef]
- Stacey, D.; Redlich, R.; Büschel, A.; Opel, N.; Grotegerd, D.; Zaremba, D.; Dohm, K.; Bürger, C.; Meinert, S.L.; Förster, K.; et al. TNF receptors 1 and 2 exert distinct region-specific effects on striatal and hippocampal grey matter volumes (VBM) in healthy adults. Genes Brain Behav. 2017, 16, 352–360. [Google Scholar] [CrossRef]
- Smagula, S.F.; Lotrich, F.E.; Aizenstein, H.J.; Diniz, B.S.; Krystek, J.; Wu, G.F.; Mulsant, B.H.; Butters, M.A.; Reynolds, C.F., 3rd; Lenze, E.J. Immunological biomarkers associated with brain structure and executive function in late-life depression: Exploratory pilot study. Int. J. Geriatr. Psychiatry 2017, 32, 692–699. [Google Scholar] [CrossRef]
- Lindbergh, C.A.; Casaletto, K.B.; Staffaroni, A.M.; Elahi, F.; Walters, S.M.; You, M.; Neuhaus, J.; Rivera Contreras, W.; Wang, P.; Karydas, A.; et al. Systemic Tumor Necrosis Factor-Alpha Trajectories Relate to Brain Health in Typically Aging Older Adults. J. Gerontol. Ser. A Biol. Sci. Med. Sci. 2020, 75, 1558–1565. [Google Scholar] [CrossRef]
- Benedetti, F.; Poletti, S.; Hoogenboezem, T.A.; Mazza, E.; Ambrée, O.; de Wit, H.; Wijkhuijs, A.J.; Locatelli, C.; Bollettini, I.; Colombo, C.; et al. Inflammatory cytokines influence measures of white matter integrity in Bipolar Disorder. J. Affect. Disord. 2016, 202, 1–9. [Google Scholar] [CrossRef]
- Teloh, H.A. Serum proteins in hepatic disease. Ann. Clin. Lab. Sci. 1978, 8, 127–129. [Google Scholar]
- O’Connell, T.X.; Horita, T.J.; Kasravi, B. Understanding and interpreting serum protein electrophoresis. Am. Fam. Physician 2005, 71, 105–112. [Google Scholar]
- Al-Joudi, F.S.; Wahab, N.A. The utilization of an index for serum globulin compensation in diseases associated with decreased serum albumin. Med. J. Malays. 2004, 59, 495–501. [Google Scholar]
- Olubodun, J.O.; Akinsola, H.A.; Adeleye, O.A. Prison deprivation and protein nutritional status of inmates of a developing community prison. Eur. J. Clin. Nutr. 1996, 50, 58–60. [Google Scholar] [CrossRef]
- Post, J.; Patek, A., Jr. Serum proteins in cirrhosis of the liver: I. Relation to prognosis and to formation of ascites. Arch. Intern. Med. 1942, 69, 67–82. [Google Scholar] [CrossRef]
- Cohen, R.A.; de la Monte, S.; Gongvatana, A.; Ombao, H.; Gonzalez, B.; Devlin, K.N.; Navia, B.; Tashima, K.T. Plasma cytokine concentrations associated with HIV/hepatitis C coinfection are related to attention, executive and psychomotor functioning. J. Neuroimmunol. 2011, 233, 204–210. [Google Scholar] [CrossRef]
- Pastor, L.; Casellas, A.; Ruperez, M.; Carrillo, J.; Maculuve, S.; Jairoce, C.; Paredes, R.; Blanco, J.; Naniche, D. Interferon-gamma-Inducible Protein 10 (IP-10) as a Screening Tool to Optimize Human Immunodeficiency Virus RNA Monitoring in Resource-Limited Settings. Clin. Infect. Dis. Off. Publ. Infect. Dis. Soc. Am. 2017, 65, 1670–1675. [Google Scholar] [CrossRef] [PubMed]
- Jiao, Y.; Zhang, T.; Wang, R.; Zhang, H.; Huang, X.; Yin, J.; Zhang, L.; Xu, X.; Wu, H. Plasma IP-10 is associated with rapid disease progression in early HIV-1 infection. Viral Immunol. 2012, 25, 333–337. [Google Scholar] [CrossRef] [PubMed]
- Ploquin, M.J.; Madec, Y.; Casrouge, A.; Huot, N.; Passaes, C.; Lecuroux, C.; Essat, A.; Boufassa, F.; Jacquelin, B.; Jochems, S.P.; et al. Elevated Basal Pre-infection CXCL10 in Plasma and in the Small Intestine after Infection Are Associated with More Rapid HIV/SIV Disease Onset. PLoS Pathog. 2016, 12, e1005774. [Google Scholar] [CrossRef] [PubMed]
- Vaidya, S.A.; Korner, C.; Sirignano, M.N.; Amero, M.; Bazner, S.; Rychert, J.; Allen, T.M.; Rosenberg, E.S.; Bosch, R.J.; Altfeld, M. Tumor necrosis factor alpha is associated with viral control and early disease progression in patients with HIV type 1 infection. J. Infect. Dis. 2014, 210, 1042–1046. [Google Scholar] [CrossRef] [PubMed]
- Pedersen, K.K.; Pedersen, M.; Gaardbo, J.C.; Ronit, A.; Hartling, H.J.; Bruunsgaard, H.; Gerstoft, J.; Ullum, H.; Nielsen, S.D. Persisting inflammation and chronic immune activation but intact cognitive function in HIV-infected patients after long-term treatment with combination antiretroviral therapy. J. Acquir. Immune Defic. Syndr. 2013, 63, 272–279. [Google Scholar] [CrossRef] [PubMed]
- Tandon, R.; Chew, G.M.; Byron, M.M.; Borrow, P.; Niki, T.; Hirashima, M.; Barbour, J.D.; Norris, P.J.; Lanteri, M.C.; Martin, J.N.; et al. Galectin-9 is rapidly released during acute HIV-1 infection and remains sustained at high levels despite viral suppression even in elite controllers. Aids Res. Hum. Retrovir. 2014, 30, 654–664. [Google Scholar] [CrossRef]
- Reiberger, T.; Aberle, J.H.; Kundi, M.; Kohrgruber, N.; Rieger, A.; Gangl, A.; Holzmann, H.; Peck-Radosavljevic, M. IP-10 correlates with hepatitis C viral load, hepatic inflammation and fibrosis and predicts hepatitis C virus relapse or non-response in HIV-HCV coinfection. Antivir. Ther. 2008, 13, 969–976. [Google Scholar] [PubMed]
- Hajarizadeh, B.; Lamoury, F.M.; Feld, J.J.; Amin, J.; Keoshkerian, E.; Matthews, G.V.; Hellard, M.; Dore, G.J.; Lloyd, A.R.; Grebely, J.; et al. Alanine aminotransferase, HCV RNA levels and pro-inflammatory and pro-fibrogenic cytokines/chemokines during acute hepatitis C virus infection. Virol. J. 2016, 13, 32. [Google Scholar] [CrossRef] [PubMed]
- Falconer, K.; Askarieh, G.; Weis, N.; Hellstrand, K.; Alaeus, A.; Lagging, M. IP-10 predicts the first phase decline of HCV RNA and overall viral response to therapy in patients co-infected with chronic hepatitis C virus infection and HIV. Scand. J. Infect. Dis. 2010, 42, 896–901. [Google Scholar] [CrossRef]
- Zeremski, M.; Markatou, M.; Brown, Q.B.; Dorante, G.; Cunningham-Rundles, S.; Talal, A.H. Interferon gamma-inducible protein 10: A predictive marker of successful treatment response in hepatitis C virus/HIV-coinfected patients. J. Acquir. Immune Defic. Syndr. 2007, 45, 262–268. [Google Scholar] [CrossRef]
- Grebely, J.; Feld, J.J.; Applegate, T.; Matthews, G.V.; Hellard, M.; Sherker, A.; Petoumenos, K.; Zang, G.; Shaw, I.; Yeung, B.; et al. Plasma interferon-gamma-inducible protein-10 (IP-10) levels during acute hepatitis C virus infection. Hepatology 2013, 57, 2124–2134. [Google Scholar] [CrossRef] [PubMed]
- Roe, B.; Coughlan, S.; Hassan, J.; Grogan, A.; Farrell, G.; Norris, S.; Bergin, C.; Hall, W.W. Elevated serum levels of interferon- gamma -inducible protein-10 in patients coinfected with hepatitis C virus and HIV. J. Infect. Dis. 2007, 196, 1053–1057. [Google Scholar] [CrossRef] [PubMed][Green Version]
- Dağ, Z.; Köseoğlu, H.; Kekilli, M. The use of prealbumin as a predictor of malnutrition in cirrhotic patients and the effect of nutritional support in patients with low prealbumin levels. Turk. J. Med. Sci. 2020, 50, 398–404. [Google Scholar] [CrossRef] [PubMed]
- Liu, F.; Cai, L.Y.; Zhong, L.; Chen, C.; Xu, F.; Zhao, Z.X.; Chen, X.M. Model for end-stage liver disease combined with serum prealbumin to predict the prognosis of patients with decompensated liver cirrhosis. J. Dig. Dis. 2010, 11, 352–357. [Google Scholar] [CrossRef] [PubMed]
- Mai, R.Y.; Zeng, J.; Lu, H.Z.; Liang, R.; Lin, Y.; Piao, X.M.; Gao, X.; Wu, G.B.; Wu, F.X.; Ma, L.; et al. Combining Aspartate Aminotransferase-to-Platelet Ratio Index with Future Liver Remnant to Assess Preoperative Hepatic Functional Reserve in Patients with Hepatocellular Carcinoma. J. Gastrointest. Surg. 2021, 25, 688–697. [Google Scholar] [CrossRef]
- Tan, L.; Meng, Y.; Zeng, T.; Wang, Q.; Long, T.; Wu, S.; Guan, X.; Fu, H.; Zheng, W.; Tian, Y.; et al. Clinical diagnostic significance of prealbumin, cholinesterase and retinol binding protein in liver cirrhosis combined with encephalopathy. Br. J. Biomed. Sci. 2019, 76, 24–28. [Google Scholar] [CrossRef]
- Yovita, H.; Djumhana, A.; Abdurachman, S.A.; Saketi, J.R. Correlation between anthropometrics measurements, prealbumin level and transferin serum with Child-Pugh classification in evaluating nutritional status of liver cirrhosis patient. Acta Med. Indones 2004, 36, 197–201. [Google Scholar]
- Maury, C.P.; Lăhdevirta, J. Correlation of serum cytokine levels with haematological abnormalities in human immunodeficiency virus infection. J. Intern. Med. 1990, 227, 253–257. [Google Scholar] [CrossRef] [PubMed]
- Peetre, C.; Gullberg, U.; Nilsson, E.; Olsson, I. Effects of recombinant tumor necrosis factor on proliferation and differentiation of leukemic and normal hemopoietic cells in vitro. Relationship to cell surface receptor. J. Clin. Investig. 1986, 78, 1694–1700. [Google Scholar] [CrossRef]
- Broxmeyer, H.E.; Williams, D.E.; Lu, L.; Cooper, S.; Anderson, S.L.; Beyer, G.S.; Hoffman, R.; Rubin, B.Y. The suppressive influences of human tumor necrosis factors on bone marrow hematopoietic progenitor cells from normal donors and patients with leukemia: Synergism of tumor necrosis factor and interferon-gamma. J. Immunol. 1986, 136, 4487–4495. [Google Scholar]
- Mahmoodi, B.K.; Matsushita, K.; Woodward, M.; Blankestijn, P.J.; Cirillo, M.; Ohkubo, T.; Rossing, P.; Sarnak, M.J.; Stengel, B.; Yamagishi, K.; et al. Associations of kidney disease measures with mortality and end-stage renal disease in individuals with and without hypertension: A meta-analysis. Lancet 2012, 380, 1649–1661. [Google Scholar] [CrossRef]
- Fox, C.S.; Matsushita, K.; Woodward, M.; Bilo, H.J.; Chalmers, J.; Heerspink, H.J.; Lee, B.J.; Perkins, R.M.; Rossing, P.; Sairenchi, T.; et al. Associations of kidney disease measures with mortality and end-stage renal disease in individuals with and without diabetes: A meta-analysis. Lancet 2012, 380, 1662–1673. [Google Scholar] [CrossRef]
- Abdullah, M.S.; Wild, G.; Jacob, V.; Milford-Ward, A.; Ryad, R.; Zanaty, M.; Ali, M.H.; el Nahas, A.M. Cytokines and the malnutrition of chronic renal failure. Min. Electrolyte Metab. 1997, 23, 237–242. [Google Scholar]
- Malyszko, J.; Malyszko, J.S.; Pawlak, K.; Mysliwiec, M. Hepcidin, an acute-phase protein and a marker of inflammation in kidney transplant recipients with and without coronary artery disease. Transpl. Proc. 2006, 38, 2895–2898. [Google Scholar] [CrossRef] [PubMed]
- Bélec, L.; Meillet, D.; Hernvann, A.; Grésenguet, G.; Gherardi, R. Differential elevation of circulating interleukin-1 beta, tumor necrosis factor alpha, and interleukin-6 in AIDS-associated cachectic states. Clin. Diagn. Lab. Immunol. 1994, 1, 117–120. [Google Scholar] [CrossRef] [PubMed]
- Herold, M.; Meise, U.; Günther, V.; Rössler, H.; Zangerle, R. Serum concentrations of circulating endogenous granulocyte-macrophage colony-stimulating factor in HIV-1-seropositive injecting drug users. Presse Med. 1994, 23, 1854–1858. [Google Scholar] [PubMed]
- Baronzio, G.; Zambelli, A.; Comi, D.; Barlocco, A.; Baronzio, A.; Marchesi, P.; Gramaglia, A.; Castiglioni, E.; Mafezzoni, A.; Beviglia, E.; et al. Proinflammatory and regulatory cytokine levels in AIDS cachexia. Vivo 1999, 13, 499–502. [Google Scholar]
- Kreuzer, K.A.; Dayer, J.M.; Rockstroh, J.K.; Sauerbruch, T.; Spengler, U. The IL-1 system in HIV infection: Peripheral concentrations of IL-1beta, IL-1 receptor antagonist and soluble IL-1 receptor type II. Clin. Exp. Immunol. 1997, 109, 54–58. [Google Scholar] [CrossRef] [PubMed]
- Kato, J.; Mogi, Y.; Kohgo, Y.; Takimoto, R.; Kobune, M.; Hisai, H.; Nakamura, T.; Takada, K.; Niitsu, Y. Suppressive effect of ethanol on the expression of hepatic asialoglycoprotein receptors augmented by interleukin-1beta, interleukin-6, and tumor necrosis factor-alpha. J. Gastroenterol. 1998, 33, 855–859. [Google Scholar] [CrossRef]
- Negrin, K.A.; Roth Flach, R.J.; DiStefano, M.T.; Matevossian, A.; Friedline, R.H.; Jung, D.; Kim, J.K.; Czech, M.P. IL-1 signaling in obesity-induced hepatic lipogenesis and steatosis. PLoS ONE 2014, 9, e107265. [Google Scholar]
- Zhang, L.; Hao, C.Q.; Miao, L.; Dou, X.G. Role of Th1/Th2 cytokines in serum on the pathogenesis of chronic hepatitis C and the outcome of interferon therapy. Genet. Mol. Res. 2014, 13, 9747–9755. [Google Scholar] [CrossRef] [PubMed]


Publisher’s Note: MDPI stays neutral with regard to jurisdictional claims in published maps and institutional affiliations. |
© 2021 by the authors. Licensee MDPI, Basel, Switzerland. This article is an open access article distributed under the terms and conditions of the Creative Commons Attribution (CC BY) license (https://creativecommons.org/licenses/by/4.0/).