
Animal Model for Glucocorticoid Induced Osteoporosis: A Systematic Review from 2011 to 2021


Abstract
:1. Introduction
2. Materials and Methods
2.1. Protocol and Registration
2.2. Eligibility Criteria
2.3. Information Sources
2.4. Search Strategy
2.5. Selection Process
2.6. Data Collection Process
2.7. Data Items
2.8. Study Risk of Bias Assessment
2.9. Effect Measures
2.10. Synthesis Methods
3. Results
3.1. Study Selection
3.2. Animal Characteristics

| Rat (34 Protocols) | Mice (18 Protocols) | Rabbit (1 Protocol) | Sheep (1 Protocol) | |||||
|---|---|---|---|---|---|---|---|---|
| Sprague Dawley | Wistar | Albinos /LEW CrlCrlj | C57BL/6 | C57BL/6 with Sprague Dawley | Other Strain | New Zealand White | Merino | |
| Male | 11 | 3 | 1 | 3 | 1 | 6 | 1 | |
| Female | 14 | 2 | 1 | 6 | 0 | 1 | ||
| Male /Female | 1 | 1 | 1 | |||||
| Sex Not available | 1 | |||||||
| Total articles | 26 | 6 | 2 | 9 | 1 | 8 | 1 | 1 |
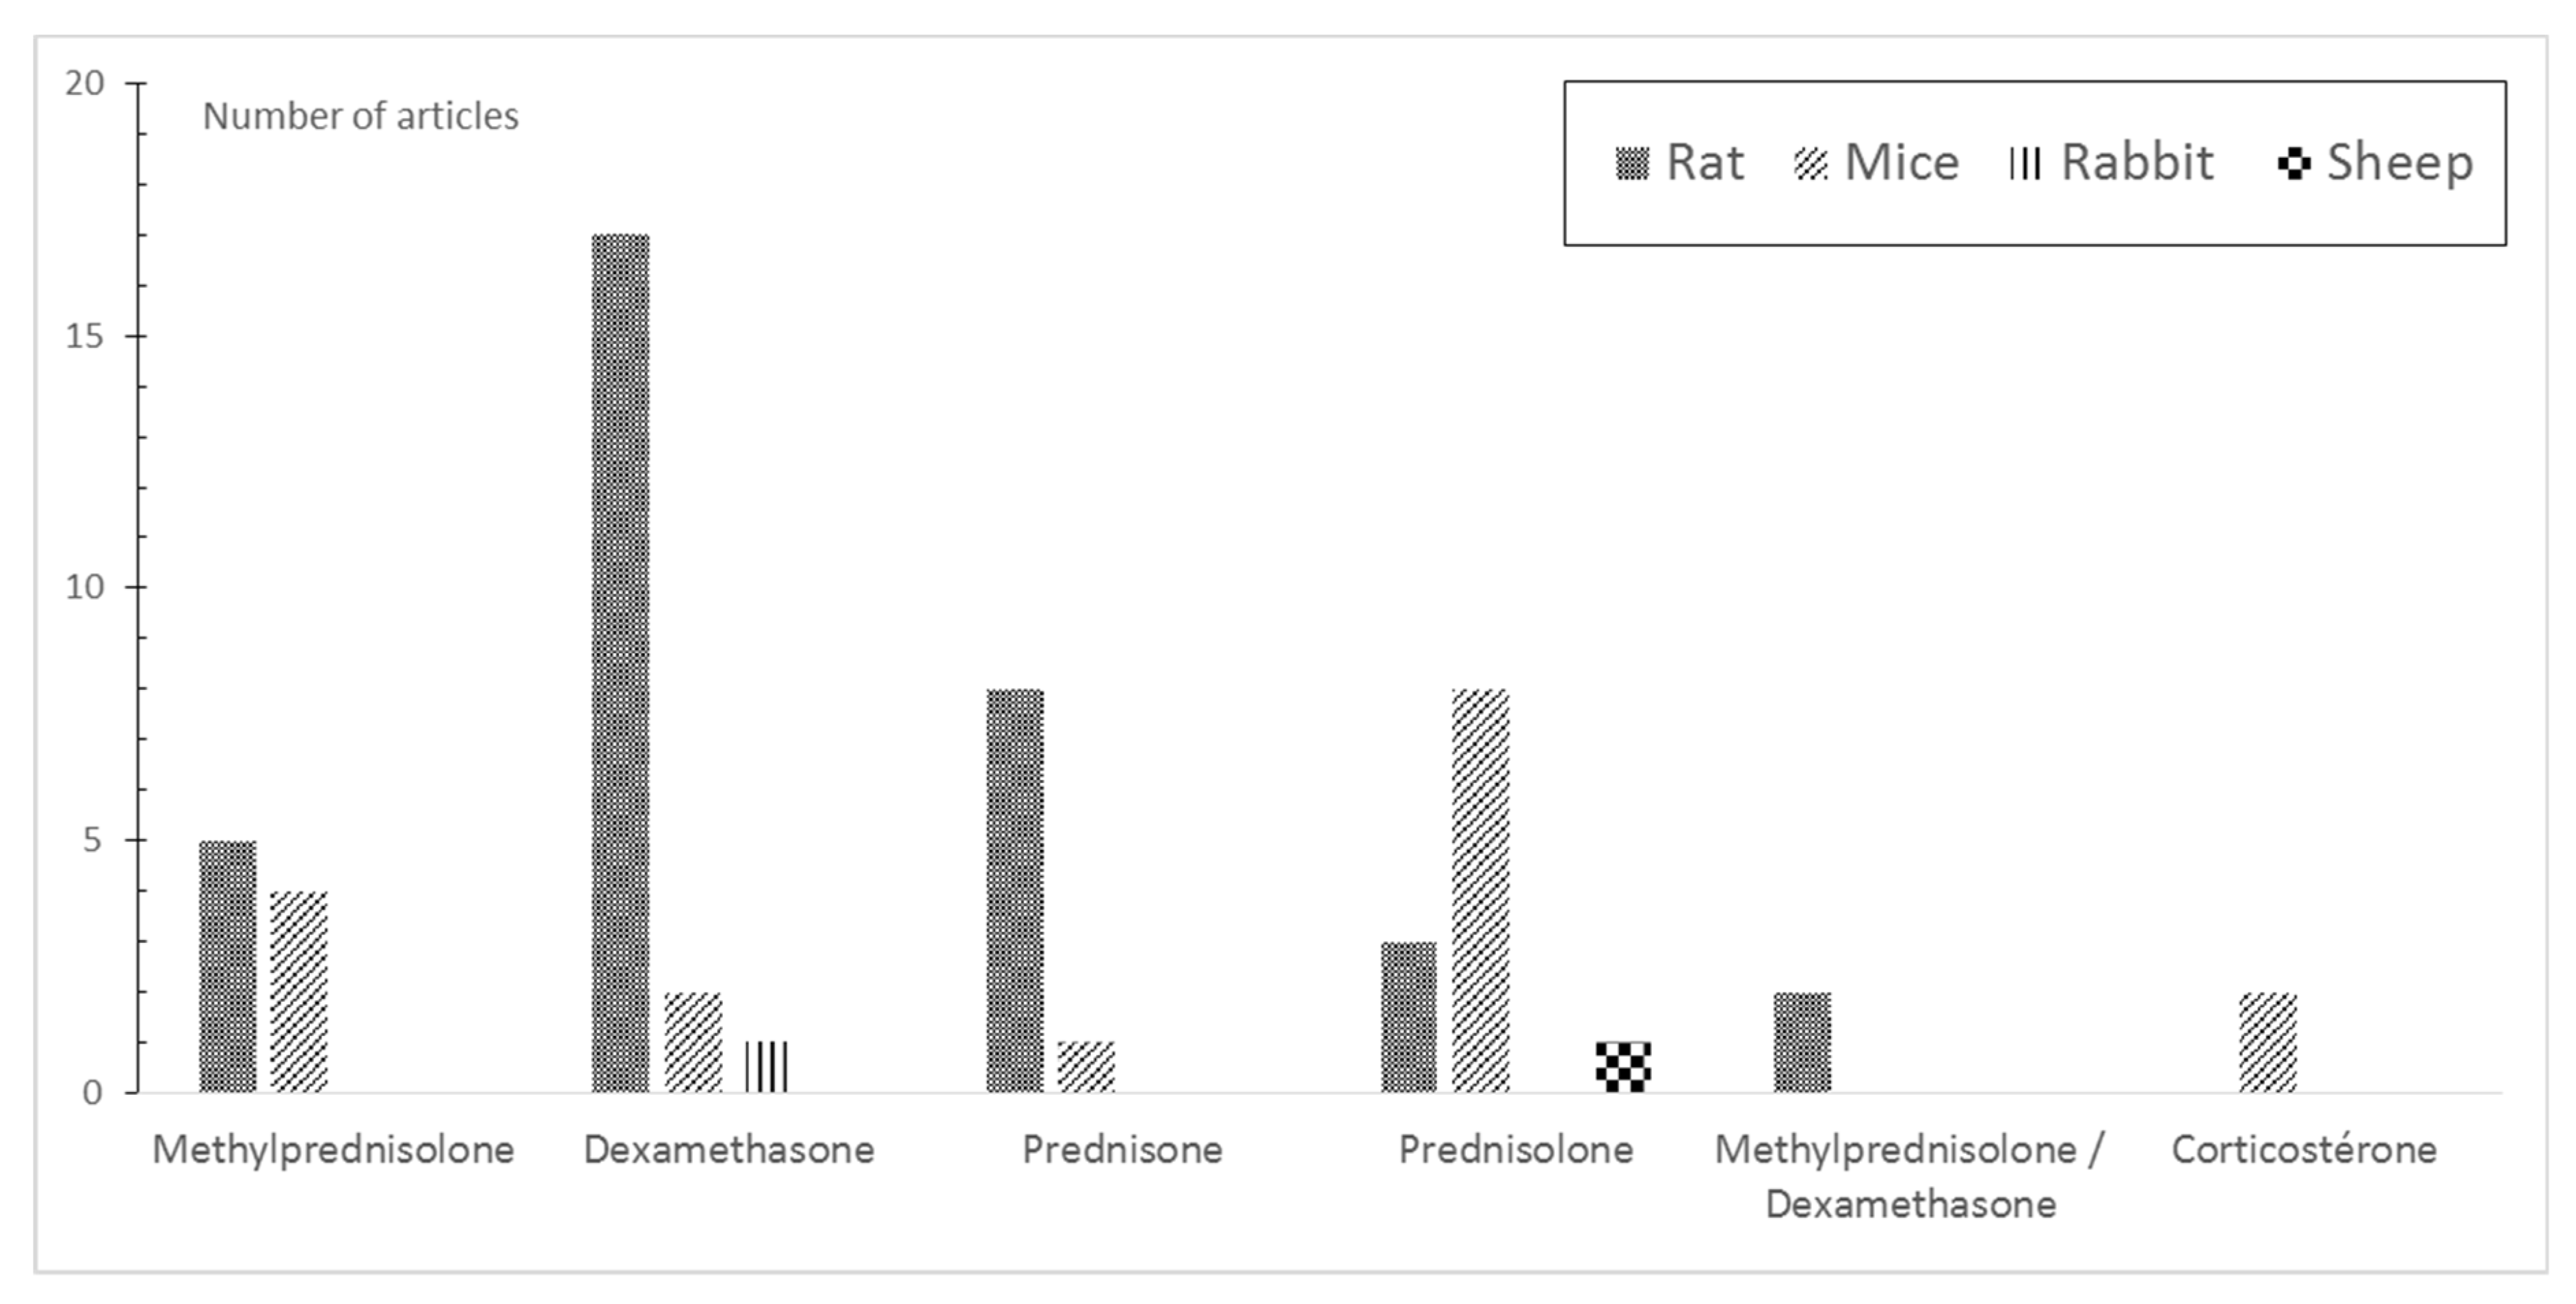
3.3. Induction of GIOP
| References | Age | Weight | Molecule Used | Route of Administration | Dosage | Duration |
|---|---|---|---|---|---|---|
| 2019 Y Xu [33] | 8 W | 250 ± 10 g | DEX | IM | 2.5 mg/kg twice per week | 2 M |
| 2019 J Zhao [34] | 3 M | 280 ± 14 g | MP | SC | 13 mg/kg 5 days per week | 9 W |
| 2018 Y Yang [35] | 4 M | 225 ± 25 g | Prednisone | P.O | 5 mg/kg daily | 14 W |
| 2017 H Ren [36] | 3 M | NA | DEX | SC | 0.6 mg/kg every 3 days | 3 M |
| 2017 M Zhou [37] | 6 M | 200± 20 g | Prednisone | P.O | 6 mg/kg daily | 21 W |
| 2017 G Chen [38] | 4–5 M | 250–275 g | Prednisone | P.O | 5 mg/kg daily | 90 D |
| 2016 Z Chen [29] | NA | NA | DEX | SC | 0.1 mg/kg daily | 60 D |
| 2016 Y Yang [39] | 4 M | 200–250 g | Prednisone | P.O | 5 mg/kg daily | 14 W |
| 2016 G Shen [40] | 3 M | NA | DEX | SC | 0.6 mg/kg twice per week | 3 M |
| 2015 H Ren [41] | 3 M | 212 ± 30 g | DEX MP | SC | 0.6 mg/kg twice per week 1 mg/kg daily | 12 W |
| 2013 M Khan [42] | NA | 180 ± 20 g | DEX MP | IP SC | 200 µg/kg 5 days per week 5 mg/kg 5 days per week | 4 W |
| 2017 G Pizzino [43] | 5 M | 250–275 g | MP | SC | 30 mg/kg | 60 D |
| 2016 Y Jiang [44] | 3 M | 210 ± 20 g | DEX | IM | 2.5 mg/kg twice per week | 12 W |
| 2016 D Liang [45] | 4 M | NA | DEX | SC | 0.6 mg/kg twice per week (prevention) 0.6 mg/kg daily (treatment) | 3 M |
| 2015 Y Liu [46] | 12 W | 263.5 ± 12 g | DEX | IV | 2 mg/kg twice per week | 12 W |
| References | Age | Weight | Molecule Used | Administration | Dosage | Duration |
|---|---|---|---|---|---|---|
| 2021 Y Mo [28] † | 4 M | NA | Prednisone | P.O | 5 mg/kg daily | 16 W |
| 2020 S Pal [47] | NA | 260 ± 20 g | MP | SC | 5 mg/kg daily | 4 W |
| 2019 L. Yang [48] | 8 W | 220 ± 10 g | DEX | IM | 1 mg/kg twice per week | 3 M |
| 2014 M Feng [49] | 6 M | 220–240 g | DEX | SC | 0.1 mg/kg daily | 5 W |
| 2013 Z Ren [50] | 5 M | 390 g | DEX | SC | 0.1 mg/kg daily | 5 W |
| 2013 F-S Wang [51] | 5 M | NA | MP | SC | 5 mg/kg daily | 1–2 or 4 W |
| 2011 F-S Wang [52] | 5 M | NA | DEX | SC | 0.1 mg/kg daily | 1–2 or 5 W |
| 2012 L Cui [53] | 6 M | 390 ± 25 g | Prednisone | P.O | 3.5 mg/kg daily | 12 W |
| 2017 Y Yang [54] | 12 W | 200 ± 20 g | DEX | IM | 1 mg/kg twice per week | 8 W |
| 2014 S Lin [31] | 3 M | 300 g | Prednisone | P.O | 1.5 mg/kg daily 3.0 mg/kg daily 6.0 mg/kg daily | 90 D |
| 2012 J-Y Ko [55] | 4 M | NA | DEX | SC | 0.1 mg/kg daily | 1–2 or 5 W |
| 2017 M Zhou [37] | 6 M | 220 ± 20 g | Prednisone | P.O | 6 mg/kg daily | 21 W |
| References | Strain | Sex | Age | Weight | Molecule Used | Administration | Dosage | Duration |
|---|---|---|---|---|---|---|---|---|
| 2020 Y Yang [56] | Wistar | F | 6 W | 180 ± 20 g | DEX | IM | 2.5 mg/kg twice per week | 7 W |
| 2020 D Sato [57] | LEW CrlCrlj | F | 5 W | 125 g | Prednisolone | PSC | 0.42 mg daily | 6 W |
| 2019 T Hou [58] | Albinos | M | Neo-natal | 5–10 g | DEX | NA | 0.1 mg/kg | 6 W |
| 2017 L.M.F. Lucinda [59] | Wistar | F | 50 D | 100–150 g | DEX | IM | 7 mg/kg once per week | 5 W |
| 2016 N Han [30] | Wistar | M/F | 3 M | 283 ± 42 g | DEX | IM | 25 mg/kg twice per week | 6 W |
| 2015 Z Achiou [60] | Wistar | M | 19 W | 450 g | MP | SC | 5 mg/kg 5 days per week | 9 W |
| 2013 K Pichler [61] | Wistar | M | 12 W | 240 ± 20 g | Prednisolone | SC | 7 mg/kg daily | 4 W |
| 2011 M Saito [62] | Wistar | M | 6 M | 330 g | Prednisolone | IM | 10 mg/kg 5 days per week | 4 W |
| References | Sex | Age | Weight | Molecule Used | Administration | Dosage | Duration |
|---|---|---|---|---|---|---|---|
| 2021 Y Mo [28] † | M | 8 W | NA | Prednisone | P.O | 2.1 mg/kg daily | 8 W |
| 2017 A Y Sato [63] | F | 16 W | NA | Prednisolone | PSC | 2.1 mg/kg daily | 14 or 28 D |
| 2016 A Y Sato [64] | F | 4 M | 25 ± 6 g | Prednisolone | PSC | 1.4 mg/kg daily 2.1 mg/kg daily | 90 D |
| 2016 A Ersek [65] | F | 12 W | NA | Prednisolone | PSC | 2.5 mg | 60 D |
| 2019 Q Geng [66] | M | 12 W | NA | DEX | SC | 1 mg/kg 5 days per week | 4 W |
| 2019 L Mao [67] | F | 10 W | 20 ± 2.0 g | DEX | SC | 10 mg/kg three times per week | 90 D |
| 2019 CG Fenton [68] | M | 9 W | NA | Corticosterone | P.O | 100µg/mL twice per week | 4 W |
| 2019 J D Schepper [69] | M | 15 W | NA | Prednisolone | PSC | 2.5 mg/kg daily | 60 D |
| 2018 C Ohlsson [70] | F | 12 W | NA | MP | PSC | 7.6 mg/kg daily | 4 W |
| 2018 I Bergström [71] | F | 3 M | NA | Prednisolone | PSC | 11 mg/kg daily | 11 D |
| References | Strain | Sex | Age | Weight | Molecule Used | Administration | Dosage | Duration |
|---|---|---|---|---|---|---|---|---|
| 2021 A M Dubrovsky [72] | BALB/cJ | M | 9 W | NA | MP | PSC | 2.5 mg for 21 day/pellet | 60 or 120 D |
| 2019 S Adhikary [73] | BALB/C | M | 8 W | 22–25 g | MP | SC | 10 mg/kg | 10 W |
| 2018 I Alam [74] | Col2.3- hWNT16TG | M/F | 16 W | NA | Prednisolone | PSC | 2.1 mg/kg daily | 28 D |
| 2017 G Mohan [75] | Swiss Webster | M | 4 M | NA | Prednisolone | PSC | 2.8 mg/kg daily | 28–56 D |
| 2016 F-S Wang [76] | 129 S Npytm1RPA/J | M | 16 W | NA | MP | IP | 5 mg/kg daily | 4 W |
| 2015 W Yao [32] | dsRed-LC3 report | M | 2 M | NA | Prednisolone | PSC | 0.8–2.8–4 mg/kg daily | 3 W |
| 2011 M Marenzana [77] | BALB/c | NA | 7 W | 22.5 g | DEX | P.O | 3 mg/kg daily | 6 W or 9 W |
| 2011 H Henneicke [78] | Col2.3-11βHSD2 | M | 8 W | NA | Corticosterone | PSC | 1.5 mg/kg implanted at 0–1–14 or 21 days | 28 D |
3.4. Quality Assessment
3.5. Techniques to Measure GIOP
3.6. Bone Loss, Micro Architecture Alteration, and Decrease in Bone Strength Induced by GCs
4. Discussion
4.1. Characteristics of Species and Strains
4.2. Molecules, Dose, Duration, and Route of Administration
4.3. Impact of the Weight, Age, and Sex on the Establishment of GIOP Model
4.4. Methods of Measurement of the Establishment of the GIOP Bone Phenotype
4.5. Methodological Quality
4.6. Strength and Limitation
5. Conclusions
Author Contributions
Funding
Institutional Review Board Statement
Informed Consent Statement
Data Availability Statement
Acknowledgments
Conflicts of Interest
References
- Briot, K.; Roux, C. Glucocorticoid-Induced Osteoporosis. RMD Open 2015, 1, e000014. [Google Scholar] [CrossRef] [Green Version]
- Compston, J. Glucocorticoid-Induced Osteoporosis: An Update. Endocrine 2018, 61, 7–16. [Google Scholar] [CrossRef] [Green Version]
- Amiche, M.A.; Albaum, J.M.; Tadrous, M.; Pechlivanoglou, P.; Lévesque, L.E.; Adachi, J.D.; Cadarette, S.M. Fracture Risk in Oral Glucocorticoid Users: A Bayesian Meta-Regression Leveraging Control Arms of Osteoporosis Clinical Trials. Osteoporos. Int. 2016, 27, 1709–1718. [Google Scholar] [CrossRef]
- Lespessailles, E.; Chapurlat, R. High Fracture Risk Patients with Glucocorticoid-Induced Osteoporosis Should Get an Anabolic Treatment First. Osteoporos. Int. 2020, 31, 1829–1834. [Google Scholar] [CrossRef] [PubMed]
- Canalis, E.; Mazziotti, G.; Giustina, A.; Bilezikian, J.P. Glucocorticoid-Induced Osteoporosis: Pathophysiology and Therapy. Osteoporos. Int. 2007, 18, 1319–1328. [Google Scholar] [CrossRef] [PubMed]
- Lane, N.E.; Yao, W. New Insights into the Biology of Glucocorticoid-Induced Osteoporosis Introduction-The Clinical Importance of Glucocorticoid-Induced Bone Loss. IBMS BoneKEy 2011, 8, 229–236. [Google Scholar] [CrossRef]
- De Vries, F.; Bracke, M.; Leufkens, H.G.M.; Lammers, J.W.J.; Cooper, C.; Van Staa, T.P. Fracture Risk with Intermittent High-Dose Oral Glucocorticoid Therapy. Arthritis Rheum. 2007, 56, 208–214. [Google Scholar] [CrossRef]
- Van Staa, T.P.; Leufkens, H.G.M.; Abenhaim, L.; Zhang, B.; Cooper, C. Use of Oral Corticosteroids and Risk of Fractures. J. Bone Miner. Res. 2000, 15, 993–1000. [Google Scholar] [CrossRef] [Green Version]
- Adami, G.; Saag, K.G. Glucocorticoid-Induced Osteoporosis: 2019 Concise Clinical Review. Osteoporos. Int. 2019, 30, 1145–1156. [Google Scholar] [CrossRef]
- Adamopoulos, I.E. Inflammation in Bone Physiology and Pathology. Curr. Opin. Rheumatol. 2018, 30, 59–64. [Google Scholar] [CrossRef]
- Cafiero, C.; Gigante, M.; Brunetti, G.; Simone, S.; Chaoul, N.; Oranger, A.; Ranieri, E.; Colucci, S.; Pertosa, G.B.; Grano, M.; et al. Inflammation Induces Osteoclast Differentiation from Peripheral Mononuclear Cells in Chronic Kidney Disease Patients: Crosstalk between the Immune and Bone Systems. Nephrol. Dial. Transplant. 2018, 33, 65–75. [Google Scholar] [CrossRef] [Green Version]
- Buckley, L.; Guyatt, G.; Fink, H.A.; Cannon, M.; Grossman, J.; Hansen, K.E.; Humphrey, M.B.; Lane, N.E.; Magrey, M.; Miller, M.; et al. 2017 American College of Rheumatology Guideline for the Prevention and Treatment of Glucocorticoid-Induced Osteoporosis. Arthritis Rheumatol. 2017, 69, 1521–1537. [Google Scholar] [CrossRef]
- Oheim, R.; Amling, M.; Ignatius, A.; Pogoda, P. Large Animal Model for Osteoporosis in Humans: The Ewe. Eur. Cells Mater. 2012, 24, 372–385. [Google Scholar] [CrossRef]
- Reinwald, S.; Burr, D. Review of Nonprimate, Large Animal Models for Osteoporosis Research. J. Bone Miner. Res. 2008, 23, 1353–1368. [Google Scholar] [CrossRef] [PubMed] [Green Version]
- R Brommage Perspectives on Using Nonhuman Primates to Understand the Etiology and Treatment of Postmenopausal Osteoporosis-PubMed. Available online: https://pubmed.ncbi.nlm.nih.gov/15758482/ (accessed on 18 June 2021).
- Komori, T. Animal Models for Osteoporosis. Eur. J. Pharmacol. 2015, 759, 287–294. [Google Scholar] [CrossRef] [PubMed]
- Lelovas, P.P.; Xanthos, T.T.; Thorma, S.E.; Lyritis, G.P.; Dontas, I.A. The Laboratory Rat as an Animal Model for Osteoporosis Research. Comp. Med. 2008, 58, 424–430. [Google Scholar] [PubMed]
- Page, M.J.; McKenzie, J.E.; Bossuyt, P.M.; Boutron, I.; Hoffmann, T.C.; Mulrow, C.D.; Shamseer, L.; Tetzlaff, J.M.; Akl, E.A.; Brennan, S.E.; et al. The PRISMA 2020 Statement: An Updated Guideline for Reporting Systematic Reviews. BMJ 2021, 372, 377. [Google Scholar]
- Kalu, D.N. The Ovariectomized Rat Model of Postmenopausal Bone Loss. Bone Miner. 1991, 15, 175–191. [Google Scholar] [CrossRef]
- Turner, R.T.; Maran, A.; Lotinun, S.; Hefferan, T.; Evans, G.L.; Zhang, M.; Sibonga, J.D. Animal Models for Osteoporosis. Rev. Endocr. Metab. Disord. 2001, 2, 117–127. [Google Scholar] [CrossRef]
- Schulz, K.F.; Chalmers, I.; Hayes, R.J.; Altman, D.G. Empirical Evidence of Bias: Dimensions of Methodological Quality Associated With Estimates of Treatment Effects in Controlled Trials. JAMA J. Am. Med. Assoc. 1995, 273, 408–412. [Google Scholar] [CrossRef]
- Bouxsein, M.L.; Boyd, S.K.; Christiansen, B.A.; Guldberg, R.E.; Jepsen, K.J.; Müller, R. Guidelines for Assessment of Bone Microstructure in Rodents Using Micro-Computed Tomography. J. Bone Miner. Res. 2010, 25, 1468–1486. [Google Scholar] [CrossRef] [PubMed]
- Parfitt, A.M.; Drezner, M.K.; Glorieux, F.H.; Kanis, J.A.; Malluche, H.; Meunier, P.J.; Ott, S.M.; Recker, R.R. Bone Histomorphometry: Standardization of Nomenclature, Symbols, and Units. Report of the ASBMR Histomorphometry Nomenclature Committee. J. Bone Miner. Res. Off. J. Am. Soc. Bone Miner. Res. 1987, 2, 595–610. [Google Scholar] [CrossRef] [PubMed]
- Turner, C.H.; Burr, D.B. Basic Biomechanical Measurements of Bone: A Tutorial. Bone 1993, 14, 595–608. [Google Scholar] [CrossRef]
- Draca, N.; Tikvica, A.; Eljuga, D.; Semenski, D.; Brncić, M.; Vukicević, S. Biomechanical Properties of Bones from Rats Treated with Sevelamer-PubMed. Available online: https://pubmed.ncbi.nlm.nih.gov/21755732/ (accessed on 18 August 2021).
- Yongtao, Z.; Kunzheng, W.; Jingjing, Z.; Hu, S.; Jianqiang, K.; Ruiyu, L.; Chunsheng, W. Glucocorticoids Activate the Local Renin–Angiotensin System in Bone: Possible Mechanism for Glucocorticoid-Induced Osteoporosis. Endocrine 2014, 47, 598–608. [Google Scholar] [CrossRef]
- Ding, M.; Danielsen, C.C.; Overgaard, S. The Effects of Glucocorticoid on Microarchitecture, Collagen, Mineral and Mechanical Properties of Sheep Femur Cortical Bone. J. Tissue Eng. Regen. Med. 2012, 6, 443–450. [Google Scholar] [CrossRef]
- Mo, Y.; Lai, W.; Zhong, Y.; Hu, Z.; You, M.; Du, M.; Wang, P.; Wu, X.; Chen, C.; He, H.; et al. TXNIP Contributes to Bone Loss via Promoting the Mitochondrial Oxidative Phosphorylation during Glucocorticoid-Induced Osteoporosis. Life Sci. 2021, 266, 118938. [Google Scholar] [CrossRef]
- Chen, Z.; Xue, J.; Shen, T.; Ba, G.; Yu, D.; Fu, Q. Curcumin Alleviates Glucocorticoid-Induced Osteoporosis by Protecting Osteoblasts from Apoptosis in Vivo and in Vitro. Clin. Exp. Pharmacol. Physiol. 2016, 43, 268–276. [Google Scholar] [CrossRef]
- Han, N.; Xu, J.; Xu, F.; Liu, Z.; Yin, J. The in Vivo Effects of a Fraction from Dioscorea Spongiosa on Glucocorticoid-Induced Osteoporosis. J. Ethnopharmacol. 2016, 185, 53–59. [Google Scholar] [CrossRef]
- Lin, S.; Huang, J.; Zheng, L.; Liu, Y.; Liu, G.; Li, N.; Wang, K.; Zou, L.; Wu, T.; Qin, L.; et al. Glucocorticoid-Induced Osteoporosis in Growing Rats. Calcif. Tissue Int. 2014, 95, 362–373. [Google Scholar] [CrossRef]
- Yao, W.; Dai, W.; Jiang, L.; Lay, E.Y.A.; Zhong, Z.; Ritchie, R.O.; Li, X.; Ke, H.; Lane, N.E. Sclerostin-Antibody Treatment of Glucocorticoid-Induced Osteoporosis Maintained Bone Mass and Strength. Osteoporos. Int. 2016, 27, 283–294. [Google Scholar] [CrossRef] [Green Version]
- Xu, Y.; Guan, J.; Xu, J.; Chen, S.; Sun, G. Z-Guggulsterone Attenuates Glucocorticoid-Induced Osteoporosis through Activation of Nrf2/HO-1 Signaling. Life Sci. 2019, 224, 58–66. [Google Scholar] [CrossRef]
- Zhao, J.; Li, Y.; Zhang, H.; Shi, D.; Li, Q.; Meng, Y.; Zuo, L. Preventative Effects of Metformin on Glucocorticoid-Induced Osteoporosis in Rats. J. Bone Miner. Metab. 2019, 37, 805–814. [Google Scholar] [CrossRef]
- Yang, Y.J.; Zhu, Z.; Wang, D.T.; Zhang, X.L.; Liu, Y.Y.; Lai, W.X.; Mo, Y.L.; Li, J.; Liang, Y.L.; Hu, Z.Q.; et al. Tanshinol Alleviates Impaired Bone Formation by Inhibiting Adipogenesis via KLF15/PPARγ 32 Signaling in GIO Rats. Acta Pharmacol. Sin. 2018, 39, 633–641. [Google Scholar] [CrossRef] [PubMed]
- Ren, H.; Shen, G.; Tang, J.; Qiu, T.; Zhang, Z.; Zhao, W.; Yu, X.; Huang, J.; Liang, D.; Yao, Z.; et al. Promotion Effect of Extracts from Plastrum Testudinis on Alendronate against Glucocorticoid-Induced Osteoporosis in Rat Spine. Sci. Rep. 2017, 7, 10617. [Google Scholar] [CrossRef] [PubMed] [Green Version]
- Zhou, M.; Li, J.; Wu, J.; Yang, Y.; Zeng, X.; Lv, X.; Cui, L.; Yao, W.; Liu, Y. Preventive Effects of Polygonum Multiflorum on Glucocorticoid-Induced Osteoporosis in Rats. Exp. Ther. Med. 2017, 14, 2445–2460. [Google Scholar] [CrossRef] [Green Version]
- Chen, G.; Zhang, X.; Lin, H.; Huang, G.; Chen, Y.; Cui, L. Tanshinol Alleviates Osteoporosis and Myopathy in Glucocorticoid-Treated Rats. Planta Med. 2017, 83, 1264–1273. [Google Scholar] [CrossRef] [PubMed] [Green Version]
- Yang, Y.; Su, Y.; Wang, D.; Chen, Y.; Liu, Y.; Luo, S.; Wu, T.; Cui, L. Tanshinol Rescues the Impaired Bone Formation Elicited by Glucocorticoid Involved in KLF15 Pathway. Oxidative Med. Cell. Longev. 2016, 2016. [Google Scholar] [CrossRef] [PubMed] [Green Version]
- Shen, G.; Ren, H.; Qiu, T.; Liang, D.; Wei, Q.; Tang, J.; Zhang, Z.; Yao, Z.; Zhao, W.; Jiang, X. Effect of Glucocorticoid Withdrawal on Glucocorticoid Inducing Bone Impairment. Biochem. Biophys. Res. Commun. 2016, 477, 1059–1064. [Google Scholar] [CrossRef] [PubMed]
- Ren, H.; Liang, D.; Jiang, X.; Tang, J.; Cui, J.; Wei, Q.; Zhang, S.; Yao, Z.; Shen, G.; Lin, S. Variance of Spinal Osteoporosis Induced by Dexamethasone and Methylprednisolone and Its Associated Mechanism. Steroids 2015, 102, 65–75. [Google Scholar] [CrossRef]
- Khan, M.P.; Mishra, J.S.; Sharan, K.; Yadav, M.; Singh, A.K.; Srivastava, A.; Kumar, S.; Bhaduaria, S.; Maurya, R.; Sanyal, S.; et al. A Novel Flavonoid C-Glucoside from Ulmus Wallichiana Preserves Bone Mineral Density, Microarchitecture and Biomechanical Properties in the Presence of Glucocorticoid by Promoting Osteoblast Survival: A Comparative Study with Human Parathyroid Hormone. Phytomedicine 2013, 20, 1256–1266. [Google Scholar] [CrossRef]
- Pizzino, G.; Irrera, N.; Galfo, F.; Oteri, G.; Atteritano, M.; Pallio, G.; Mannino, F.; D’Amore, A.; Pellegrino, E.; Aliquò, F.; et al. Adenosine Receptor Stimulation Improves Glucocorticoid-Induced Osteoporosis in a Rat Model. Front. Pharmacol. 2017, 8, 558. [Google Scholar] [CrossRef] [PubMed] [Green Version]
- Jiang, Y.; Gou, H.; Wang, S.; Zhu, J.; Tian, S.; Yu, L. Effect of Pulsed Electromagnetic Field on Bone Formation and Lipid Metabolism of Glucocorticoid-Induced Osteoporosis Rats through Canonical Wnt Signaling Pathway. Evid.-Based Complementary Altern. Med. 2016, 2016. [Google Scholar] [CrossRef] [PubMed] [Green Version]
- Liang, D.; Ren, H.; Qiu, T.; Shen, G.; Xie, B.; Wei, Q.; Yao, Z.; Tang, J.; Zhang, Z.; Jiang, X. Extracts from Plastrum Testudinis Reverse Glucocorticoid-Induced Spinal Osteoporosis of Rats via Targeting Osteoblastic and Osteoclastic Markers. Biomed. Pharmacother. 2016, 82, 151–160. [Google Scholar] [CrossRef]
- Liu, Y.; Cui, Y.; Chen, Y.; Gao, X.; Su, Y.; Cui, L. Effects of Dexamethasone, Celecoxib, and Methotrexate on the Histology and Metabolism of Bone Tissue in Healthy Sprague Dawley Rats. Clin. Interv. Aging 2015, 10, 1245–1253. [Google Scholar] [CrossRef] [PubMed] [Green Version]
- Pal, S.; Mittapelly, N.; Husain, A.; Kushwaha, S.; Chattopadhyay, S.; Kumar, P.; Ramakrishna, E.; Kumar, S.; Maurya, R.; Sanyal, S.; et al. A Butanolic Fraction from the Standardized Stem Extract of Cassia Occidentalis L Delivered by a Self-Emulsifying Drug Delivery System Protects Rats from Glucocorticoid-Induced Osteopenia and Muscle Atrophy. Sci. Rep. 2020, 10, 195. [Google Scholar] [CrossRef]
- Yang, L.; Yang, J.; Pan, T.; Zhong, X. Liraglutide Increases Bone Formation and Inhibits Bone Resorption in Rats with Glucocorticoid-Induced Osteoporosis. J. Endocrinol. Investig. 2019, 42, 1125–1131. [Google Scholar] [CrossRef] [PubMed]
- Feng, M.; Zhang, R.; Gong, F.; Yang, P.; Fan, L.; Ni, J.; Bi, W.; Zhang, Y.; Wang, C.; Wang, K. Protective Effects of Necrostatin-1 on Glucocorticoid-Induced Osteoporosis in Rats. J. Steroid Biochem. Mol. Biol. 2014, 144, 455–462. [Google Scholar] [CrossRef]
- Ren, Z.; Yang, L.; Xue, F.; Meng, Q.; Wang, K.; Wu, X.; Ji, C.; Jiang, T.; Liu, D.; Zhou, L.; et al. Yeast-Incorporated Gallium Attenuates Glucocorticoid-Induced Bone Loss in Rats by Inhibition of Bone Resorption. Biol. Trace Elem. Res. 2013, 152, 396–402. [Google Scholar] [CrossRef]
- Wang, F.S.; Chung, P.C.; Lin, C.L.; Chen, M.W.; Ke, H.J.; Chang, Y.H.; Chen, Y.S.; Wu, S.L.; Ko, J.Y. MicroRNA-29a Protects against Glucocorticoid-Induced Bone Loss and Fragility in Rats by Orchestrating Bone Acquisition and Resorption. Arthritis Rheum. 2013, 65, 1530–1540. [Google Scholar] [CrossRef] [PubMed]
- Wang, F.S.; Wu, R.W.; Ko, J.Y.; Tai, M.H.; Ke, H.C.; Yeh, D.W.; Wu, S.L.; Chen, M.W. Heat Shock Protein 60 Protects Skeletal Tissue against Glucocorticoid-Induced Bone Mass Loss by Regulating Osteoblast Survival. Bone 2011, 49, 1080–1089. [Google Scholar] [CrossRef]
- Cui, L.; Li, T.; Liu, Y.; Zhou, L.; Li, P.; Xu, B.; Huang, L.; Chen, Y.; Liu, Y.; Tian, X.; et al. Salvianolic Acid b Prevents Bone Loss in Prednisone-Treated Rats through Stimulation of Osteogenesis and Bone Marrow Angiogenesis. PLoS ONE 2012, 7, e34647. [Google Scholar] [CrossRef] [PubMed] [Green Version]
- Yang, Y.; Nian, H.; Tang, X.; Wang, X.; Liu, R. Effects of the Combined Herba Epimedii and Fructus Ligustri Lucidi on Bone Turnover and TGF-Β1/Smads Pathway in GIOP Rats. J. Ethnopharmacol. 2017, 201, 91–99. [Google Scholar] [CrossRef] [PubMed]
- Ko, J.Y.; Wu, R.W.; Kuo, S.J.; Chen, M.W.; Yeh, D.W.; Ke, H.C.; Wu, S.L.; Wang, F.S. Cannabinoid Receptor 1 Mediates Glucocorticoid-Induced Bone Loss in Rats by Perturbing Bone Mineral Acquisition and Marrow Adipogenesis. Arthritis Rheum. 2012, 64, 1204–1214. [Google Scholar] [CrossRef]
- Yang, Y.; Yu, T.; Tang, H.; Ren, Z.; Li, Q.; Jia, J.; Chen, H.; Fu, J.; Ding, S.; Hao, Q.; et al. Ganoderma Lucidum Immune Modulator Protein RLZ-8 Could Prevent and Reverse Bone Loss in Glucocorticoids-Induced Osteoporosis Rat Model. Front. Pharmacol. 2020, 11, 731. [Google Scholar] [CrossRef]
- Sato, D.; Takahata, M.; Ota, M.; Fukuda, C.; Hasegawa, T.; Yamamoto, T.; Amizuka, N.; Tsuda, E.; Okada, A.; Hiruma, Y.; et al. Siglec-15-Targeting Therapy Protects against Glucocorticoid-Induced Osteoporosis of Growing Skeleton in Juvenile Rats. Bone 2020, 135, 115331. [Google Scholar] [CrossRef] [PubMed]
- Hou, T.; Zhang, L.; Yang, X. Ferulic Acid, a Natural Polyphenol, Protects against Osteoporosis by Activating SIRT1 and NF-ΚB in Neonatal Rats with Glucocorticoid-Induced Osteoporosis. Biomed. Pharmacother. 2019, 120, 109205. [Google Scholar] [CrossRef] [PubMed]
- Lucinda, L.M.F.; Aarestrup, B.J.V.; Reboredo, M.M.; Pains, T.D.A.; Chaves, R.Z.; Reis, J.E.P.; Louzada, M.J.Q.; Guerra, M.O. Evaluation of the Anti-Osteoporotic Effect of Ginkgo Biloba L. In Wistar Rats with Glucocorticoid-Induced-Osteoporosis by Bone Densitometry Using Dualenergy x-Ray Absorptiometry (DEXA) and Mechanical Testing. Anais da Academia Brasileira de Ciências 2017, 89, 2833–2841. [Google Scholar] [CrossRef] [Green Version]
- Achiou, Z.; Toumi, H.; Touvier, J.; Boudenot, A.; Uzbekov, R.; Ominsky, M.S.; Pallu, S.; Lespessailles, E. Sclerostin Antibody and Interval Treadmill Training Effects in a Rodent Model of Glucocorticoid-Induced Osteopenia. Bone 2015, 81, 691–701. [Google Scholar] [CrossRef]
- Pichler, K.; Loreto, C.; Leonardi, R.; Reuber, T.; Weinberg, A.M.; Musumeci, G. RANKL Is Downregulated in Bone Cells by Physical Activity (Treadmill and Vibration Stimulation Training) in Rat with Glucocorticoid-Induced Osteoporosis. Histol. Histopathol. 2013, 28, 1185–1196. [Google Scholar] [CrossRef]
- Saito, M.; Marumo, K.; Ushiku, C.; Kato, S.; Sakai, S.; Hayakawa, N.; Mihara, M.; Shiraishi, A. Effects of Alfacalcidol on Mechanical Properties and Collagen Cross-Links of the Femoral Diaphysis in Glucocorticoid-Treated Rats. Calcif. Tissue Int. 2011, 88, 314–324. [Google Scholar] [CrossRef]
- Sato, A.Y.; Richardson, D.; Cregor, M.; Davis, H.M.; Au, E.D.; McAndrews, K.; Zimmers, T.A.; Organ, J.M.; Peacock, M.; Plotkin, L.I.; et al. Glucocorticoids Induce Bone and Muscle Atrophy by Tissue-Specific Mechanisms Upstream of E3 Ubiquitin Ligases. Endocrinology 2017, 158, 664–677. [Google Scholar] [CrossRef]
- Sato, A.Y.; Cregor, M.; Delgado-Calle, J.; Condon, K.W.; Allen, M.R.; Peacock, M.; Plotkin, L.I.; Bellido, T. Protection From Glucocorticoid-Induced Osteoporosis by Anti-Catabolic Signaling in the Absence of Sost/Sclerostin. J. Bone Miner. Res. 2016, 31, 1791–1802. [Google Scholar] [CrossRef] [PubMed] [Green Version]
- Ersek, A.; Santo, A.I.E.; Vattakuzhi, Y.; George, S.; Clark, A.R.; Horwood, N.J. Strain Dependent Differences in Glucocorticoid-Induced Bone Loss between C57BL/6J and CD-1 Mice. Sci. Rep. 2016, 6, 36513. [Google Scholar] [CrossRef] [Green Version]
- Geng, Q.; Heng, K.; Li, J.; Wang, S.; Sun, H.; Sha, L.; Guo, Y.; Nie, X.; Wang, Q.; Dai, L.; et al. A Soluble Bone Morphogenetic Protein Type 1A Receptor Fusion Protein Treatment Prevents Glucocorticoid-Induced Bone Loss in Mice-PubMed. Available online: https://pubmed.ncbi.nlm.nih.gov/31396331/ (accessed on 22 June 2021).
- Mao, L.; Wang, F.; Li, Y.; Dai, Y.; Liu, Y.; Wang, J.; Xue, C. Oil from Antarctic Krill (Euphausia Superba) Facilitates Bone Formation in Dexamethasone-Treated Mice. Food Sci. Biotechnol. 2019, 28, 539–545. [Google Scholar] [CrossRef] [PubMed]
- Fenton, C.G.; Doig, C.L.; Fareed, S.; Naylor, A.; Morrell, A.P.; Addison, O.; Wehmeyer, C.; Buckley, C.D.; Cooper, M.S.; Lavery, G.G.; et al. 11β-HSD1 Plays a Critical Role in Trabecular Bone Loss Associated with Systemic Glucocorticoid Therapy. Arthritis Res. Ther. 2019, 21, 1–10. [Google Scholar] [CrossRef] [Green Version]
- Schepper, J.D.; Collins, F.; Rios-Arce, N.D.; Kang, H.J.; Schaefer, L.; Gardinier, J.D.; Raghuvanshi, R.; Quinn, R.A.; Britton, R.; Parameswaran, N.; et al. Involvement of the Gut Microbiota and Barrier Function in Glucocorticoid-Induced Osteoporosis. J. Bone Miner. Res. 2020, 35, 801–820. [Google Scholar] [CrossRef] [PubMed]
- Ohlsson, C.; Nilsson, K.H.; Henning, P.; Wu, J.; Gustafsson, K.L.; Poutanen, M.; Lerner, U.H.; Movérare-Skrtic, S. WNT16 Overexpression Partly Protects against Glucocorticoid-Induced Bone Loss. Am. J. Physiol. Endocrinol. Metab. 2018, 314, E597–E604. [Google Scholar] [CrossRef] [PubMed] [Green Version]
- Bergström, I.; Isaksson, H.; Koskela, A.; Tuukkanen, J.; Ohlsson, C.; Andersson, G.; Windahl, S.H. Prednisolone Treatment Reduces the Osteogenic Effects of Loading in Mice. Bone 2018, 112, 10–18. [Google Scholar] [CrossRef] [PubMed]
- Dubrovsky, A.M.; Nyman, J.S.; Uppuganti, S.; Chmiel, K.J.; Kimmel, D.B.; Lane, N.E. Bone Strength/Bone Mass Discrepancy in Glucocorticoid-Treated Adult Mice. JBMR Plus 2021, 5, e10443. [Google Scholar] [CrossRef]
- Adhikary, S.; Kothari, P.; Choudhary, D.; Tripathi, A.K.; Trivedi, R. Glucocorticoid Aggravates Bone Micro-Architecture Deterioration and Skeletal Muscle Atrophy in Mice Fed on High-Fat Diet. Steroids 2019, 149, 108416. [Google Scholar] [CrossRef] [PubMed]
- Alam, I.; Oakes, D.K.; Reilly, A.M.; Billingsley, C.; Sbeta, S.; Gerard-O’Riley, R.L.; Acton, D.; Sato, A.; Bellido, T.; Econs, M.J. Overexpression of WNT16 Does Not Prevent Cortical Bone Loss Due to Glucocorticoid Treatment in Mice. JBMR Plus 2019, 3, e10084. [Google Scholar] [CrossRef] [PubMed]
- Mohan, G.; Lay, E.Y.A.; Berka, H.; Ringwood, L.; Kot, A.; Chen, H.; Yao, W.; Lane, N.E. A Novel Hybrid Compound LLP2A-Ale Both Prevented and Rescued the Osteoporotic Phenotype in a Mouse Model of Glucocorticoid-Induced Osteoporosis. Calcif. Tissue Int. 2017, 100, 67–79. [Google Scholar] [CrossRef] [PubMed] [Green Version]
- Wang, F.S.; Lian, W.S.; Weng, W.T.; Sun, Y.C.; Ke, H.J.; Chen, Y.S.; Ko, J.Y. Neuropeptide Y Mediates Glucocorticoid-Induced Osteoporosis and Marrow Adiposity in Mice. Osteoporos. Int. 2016, 27, 2777–2789. [Google Scholar] [CrossRef] [PubMed]
- Marenzana, M.; Greenslade, K.; Eddleston, A.; Okoye, R.; Marshall, D.; Moore, A.; Robinson, M.K. Sclerostin Antibody Treatment Enhances Bone Strength but Does Not Prevent Growth Retardation in Young Mice Treated with Dexamethasone. Arthritis Rheum. 2011, 63, 2385–2395. [Google Scholar] [CrossRef] [PubMed]
- Henneicke, H.; Herrmann, M.; Kalak, R.; Brennan-Speranza, T.C.; Heinevetter, U.; Bertollo, N.; Day, R.E.; Huscher, D.; Buttgereit, F.; Dunstan, C.R.; et al. Corticosterone Selectively Targets Endo-Cortical Surfaces by an Osteoblast-Dependent Mechanism. Bone 2011, 49, 733–742. [Google Scholar] [CrossRef]
- Thompson, D.D.; Simmons, H.A.; Pirie, C.M.; Ke, H.Z. FDA Guidelines and Animal Models for Osteoporosis. Bone 1995, 17, S125–S133. [Google Scholar] [CrossRef]
- Yao, W.; Cheng, Z.; Busse, C.; Pham, A.; Nakamura, M.C.; Lane, N.E. Glucocorticoid Excess in Mice Results in Early Activation of Osteoclastogenesis and Adipogenesis and Prolonged Suppression of Osteogenesis: A Longitudinal Study of Gene Expression in Bone Tissue from Glucocorticoid- Treated Mice. Arthritis Rheum. 2008, 58, 1674–1686. [Google Scholar] [CrossRef] [Green Version]
- Dias, I.R.; Camassa, J.A.; Bordelo, J.A.; Babo, P.S.; Viegas, C.A.; Dourado, N.; Reis, R.L.; Gomes, M.E. Preclinical and Translational Studies in Small Ruminants (Sheep and Goat) as Models for Osteoporosis Research. Curr. Osteoporos. Rep. 2018, 16, 182–197. [Google Scholar] [CrossRef]
- Ding, M.; Cheng, L.; Bollen, P.; Schwarz, P.; Overgaard, S. Glucocorticoid Induced Osteopenia in Cancellous Bone of Sheep: Validation of Large Animal Model for Spine Fusion and Biomaterial Research. Spine 2010, 35, 363–370. [Google Scholar] [CrossRef] [PubMed]
- Permuy, M.; López-Peña, M.; Muñoz, F.; González-Cantalapiedra, A. Rabbit as Model for Osteoporosis Research. J. Bone Miner. Metab. 2019, 37, 573–583. [Google Scholar] [CrossRef] [PubMed]
- Harrison, K.D.; Hiebert, B.D.; Panahifar, A.; Andronowski, J.M.; Ashique, A.M.; King, G.A.; Arnason, T.; Swekla, K.J.; Pivonka, P.; Cooper, D.M.L. Cortical Bone Porosity in Rabbit Models of Osteoporosis. J. Bone Miner. Res. 2020, 35, 2211–2228. [Google Scholar] [CrossRef] [PubMed]
- E Langhoff, J.L. Relative Immunosuppressive Potency of Various Corticosteroids Measured in Vitro. Eur. J. Clin. Pharmacol. 1983, 25, 459–462. [Google Scholar] [CrossRef] [PubMed]
- Jacobs, J.W.G.; Bijlsma, J.W.J. Glucocorticoids in Rheumatology: Indications and Routes of Administration. Clin. Exp. Rheumatol. 2011, 2, 127. [Google Scholar]
- Herrmann, M.; Henneicke, H.; Street, J.; Modzelewski, J.; Kalak, R.; Buttgereit, F.; Dunstan, C.R.; Zhou, H.; Seibel, M.J. The Challenge of Continuous Exogenous Glucocorticoid Administration in Mice. Steroids 2009, 74, 245–249. [Google Scholar] [CrossRef]
- Arantes-Rodrigues, R.; Henriques, A.; Pinto-Leite, R.; Faustino-Rocha, A.; Pinho-Oliveira, J.; Teixeira-Guedes, C.; Seixas, F.; Gama, A.; Colaço, B.; Colaço, A.; et al. The Effects of Repeated Oral Gavage on the Health of Male CD-1 Mice. Lab Anim. 2012, 41, 129–134. [Google Scholar] [CrossRef]
- Wood, C.L.; Soucek, O.; Wong, S.C.; Zaman, F.; Farquharson, C.; Savendahl, L.; Ahmed, S.F. Animal Models to Explore the Effects of Glucocorticoids on Skeletal Growth and Structure. J. Endocrinol. 2018, 236, R69–R91. [Google Scholar] [CrossRef] [Green Version]
- Sengupta, P. The Laboratory Rat: Relating Its Age With Human’s. Int. J. Prev. Med. 2013, 4, 624. [Google Scholar]
- Andreollo, N.A.; Santos, E.F.; Araújo, M.R.; Lopes, L.R. Rat’s Age versus Human’s Age: What Is the Relationship? Arq. Bras. De Cir. Dig. ABCD Braz. Arch. Dig. Surg. 2012, 25, 49–51. [Google Scholar] [CrossRef] [Green Version]
- Weinstein, R.S.; O’Brien, C.A.; Almeida, M.; Zhao, H.; Roberson, P.K.; Jilka, R.L.; Manolagas, S.C. Osteoprotegerin Prevents Glucocorticoid-Induced Osteocyte Apoptosis in Mice. Endocrinology 2011, 152, 3323–3331. [Google Scholar] [CrossRef] [Green Version]
- Plotkin, L.I.; Bivi, N.; Bellido, T. A Bisphosphonate That Does Not Affect Osteoclasts Prevents Osteoblast and Osteocyte Apoptosis and the Loss of Bone Strength Induced by Glucocorticoids in Mice. Bone 2011, 49, 122–127. [Google Scholar] [CrossRef] [Green Version]
- Horton, J.A.; Murray, G.M.; Spadaro, J.A.; Margulies, B.S.; Allen, M.J.; Damron, T.A. Precision and Accuracy of DXA and PQCT for Densitometry of the Rat Femur. J. Clin. Densitom. Off. J. Int. Soc. Clin. Densitom. 2003, 6, 381–390. [Google Scholar] [CrossRef]
- Johnson, L.C.; Johnson, R.W.; Munoz, S.A.; Mundy, G.R.; Peterson, T.E.; Sterling, J.A. Longitudinal Live Animal Micro-CT Allows for Quantitative Analysis of Tumor-Induced Bone Destruction. Bone 2011, 48, 141–151. [Google Scholar] [CrossRef] [Green Version]
- Becker, K.; Schwarz, F.; Rauch, N.J.; Khalaph, S.; Mihatovic, I.; Drescher, D. Can Implants Move in Bone? A Longitudinal in Vivo Micro-CT Analysis of Implants under Constant Forces in Rat Vertebrae. Clin. Oral Implant. Res. 2019, 30, 1179–1189. [Google Scholar] [CrossRef] [PubMed]
- Abadie, E.C.; Devogealer, J.P.; Ringe, J.D.; Ethgen, D.J.; Bouvenot, G.M.; Kreutz, G.; Laslop, A.; Orloff, J.J.; Vanderauwera, P.M.; Delmas, P.D.; et al. Recommendations for the Registration of Agents to Be Used in the Prevention and Treatment of Glucocorticoid-Induced Osteoporosis: Updated Recommendations from the Group for the Respect of Ethics and Excellence in Science. Semin. Arthritis Rheum. 2005, 35, 1–4. [Google Scholar] [CrossRef]
- Compston, J.; Reid, D.M.; Boisdron, J.; Brandi, M.-L.; Burlet, N.; Cahall, D.; Delmas, P.D.; Dere, W.; Devogelaer, J.-P.; Fitzpatrick, L.A.; et al. Recommendations for the Registration of Agents for Prevention and Treatment of Glucocorticoid-Induced Osteoporosis: An Update from the Group for the Respect of Ethics and Excellence in Science. Osteoporos. Int. 2008, 20, 497–498. [Google Scholar] [CrossRef] [Green Version]
- Van Staa, T.P.; Leufkens, H.G.M.; Cooper, C. The Epidemiology of Corticosteroid-Induced Osteoporosis: A Meta-Analysis. Osteoporos. Int. 2002, 13, 777–787. [Google Scholar] [CrossRef] [PubMed] [Green Version]
- Perel, P.; Roberts, I.; Sena, E.; Wheble, P.; Briscoe, C.; Sandercock, P.; Macleod, M.; Mignini, L.E.; Jayaram, P.; Khan, K.S. Comparison of Treatment Effects between Animal Experiments and Clinical Trials: Systematic Review. BMJ 2007, 334, 197–200. [Google Scholar] [CrossRef] [PubMed] [Green Version]
- Park, S.; Oh, J.; Son, K.Y.; Cho, K.O.; Choi, J. Quantitative Computed Tomographic Assessment of Bone Mineral Density Changes Associated with Administration of Prednisolone or Prednisolone and Alendronate Sodium in Dogs. Am. J. Vet. Res. 2015, 76, 28–34. [Google Scholar] [CrossRef] [PubMed]
- Carnovali, M.; Banfi, G.; Mariotti, M. Liquiritigenin Reduces Osteoclast Activity in Zebrafish Model of Glucocorticoid-Induced Osteoporosis. J. Pharmacol. Sci. 2020, 143, 300–306. [Google Scholar] [CrossRef] [PubMed]
- Briot, K. Bone and Glucocorticoids. Annales d’Endocrinologie 2018, 79, 115–118. [Google Scholar] [CrossRef] [PubMed]
- Adami, G.; Rahn, E.J.; Saag, K.G. Glucocorticoid-Induced Osteoporosis: From Clinical Trials to Clinical Practice. Ther. Adv. Musculoskelet. Dis. 2019, 11, 1759720X19876468. [Google Scholar] [CrossRef] [PubMed]

| References | Species | Strain | Sex | Age | Weight | Molecule Used | Administration | Dosage | Duration |
|---|---|---|---|---|---|---|---|---|---|
| 2014 Z Yongtao [26] | Rabbit | New Zealand White | M | 32 w | 3.2 ± 0.45 kg | DEX | IM | 3 mg/kg twice per week | 12 W |
| 2011 M Ding [27] | Sheep | Merino | F | 4–6 Y | 55 ± 10 kg | Prednisolone | SC | 0.60 mg/kg 5 times per weeks | 7 M |
| Rat | Mice | Rabbit | Sheep | |||
|---|---|---|---|---|---|---|
| Sprague Dawley | Other Strain | C57BL/6 | Other Strain | New Zealand White | Merino | |
| DXA | 20 | 8 | 5 | 3 | 1 | |
| µCT | 17 | 1 | 8 | 7 | 1 | |
| Mechanical Test | 23 | 6 | 6 | 7 | 1 | 1 |
| Histomorphometry | 13 | 3 | 6 | 3 | 1 | |
| References | Bone Loss Measuring by DXA | Alterations of the Microarchitecture Observed by µCT or Static/Dynamic Histomorphometry | Loss in Bone Strength Parameters Observed by Biomechanical Testing |
|---|---|---|---|
| 2019 Y Xu [33] | Yes at femur (BMC BMD) | Yes at femur (BV/TV, Tb.Th, Tb.Sp, Tb.N) by µCT | Yes at femur (maximum stress (MPa), maximum load (N), elasticity modulus (N/mm2) |
| 2019 J Zhao [34] | Yes at femur and L5 vertebra (BMD) | Yes at proximal tibia (BV/TV, Tb.Th, Tb.Sp, Tb.N, %L.Pm, MAR, BFR/BV, BFR/TV, BFR/BS, Oc.N/BS, Oc.Pm/BS) by histomorphometry | NA |
| 2018 Y Yang [35] | NA | Yes at proximal femur (Tb.Ar, Tb.Th, BV/TV, Tb.Sp, SMI, DA) by µCT | Yes at femur (elastic load (N), bending energy (N x mm) |
| 2017 H Ren [36] | Yes at L1–L5 vertebrae (BMD, BMC, AREA) | Yes at L2 vertebra (BS/TV, BV/TV, Tb.Th, Tb.Sp, Tb.N, vBMD) by µCT | Yes at L2 vertebra (compressive strength (N), compressive displacement (mm), energy absorption capacity (J)) |
| 2017 M Zhou [37] | Yes (BMD BMC at the L4 vertebra, whole femur in male; BMD proximal femur, BMC distal femur in female) | Yes (at the distal femur in female: BV/TV, density, SMI, Tb.N, Tb.Th, Tb.Sp; at the distal femur in male: BV/TV, density) by µCT | Yes (at the femur in male elastic load (N), stiffness (N/mm) at the femur in female: elastic load (N); at the L5 vertebra in female: elastic load (N), maximum load (N), break load (N), stiffness (N/mm)) |
| 2017 G Chen [38] | Yes at femur (BMD, BMC) | Yes at proximal tibia (Tb.Th, SMI by µCtT, Tb.Ar, Tb.N, Tb.Th, Tb.Sp by histomorphometry) | Yes at femur (maximum load (N), Breaking load (N), Yield load (N), bending energy (mJ)) |
| 2016 Z Chen [29] | Yes at proximal femur (BMD) | NA | Yes at femur (ultimate load (N), Stiffness (N/mm)) |
| 2016 Y Yang [39] | NA | Yes at proximal femur (BV/TV, Tb.Th, Tb.Sp); at proximal metaphysis tibia: %L.Pm, BFR/TV) by histomorphometry | Yes at femur (fracture load (N), Bending energy N x mm)) |
| 2016 G Shen [40] | Yes at L1–L3 vertebrae (BMC, BMD, AREA) | Yes at L4 vertebra (BS/TV, BV/TV, Tb.Th, Tb.Sp, Tb.N, vBMD, SMI) by µCT | Yes at L4 vertebra (compressive strength (N), compressive stiffness (N/mm),compressive displacement (mm), energy absorption capacity (N)) |
| 2015 H Ren [41] | Yes at L1–L3 vertebrae (BMC, BMD, AREA) | Yes at L4 vertebra for DEX group and MP group (BV/TV, BS/TV, SMI, Tb.Th, vBMD) only DEX group (Conn.D, Tb.Sp, Tb.N) by µCT | Yes at L4 vertebra for DEX group and MP group (compressive strength(N)) |
| 2013 MP Khan [42] | NA | Yes at hypophysis/diaphysis femur and tibia (vBMD, BV/TV, Conn.D, SMI, Tb.Th, Tb.Sp, Tb.N, Porosity, DA) by µCT; (Ct/th, MAR, pBFR/BS) and by histomorphometry | Yes at femur (ultimate load (N), Energy (mJ), Stiffness (N/mm)) |
| 2017 G Pizzino [43] | Yes at femur (BMD) | Yes at femur and vertebra (BV/TV, Tb.Th) by µCT | Yes at femur (maximum load (N)) |
| 2016 Y Jiang [44] | No statistical difference reported at femur and whole body (BMD, BMC) | Yes at L4 vertebra (Tb.Ar, Tb.N, Tb.Sp) by histomorphometry | NA |
| 2016 D Liang [45] | Yes at L1–L4 vertebrae (BMC, BMD) | Yes at L2 vertebra (BV/TV, SMI, Tb.N, Tb.Th, Tb.Sp, vBMD) by µCT | Yes at L2 vertebra (compressive strength (N), compressive displacement (mm), energy absorption capacity (J)) |
| 2015 Y Liu [46] | Yes at femur (BMD) and no statistical difference reported at L5 vertebra | Yes at proximal tibia by µCT (BV/TV, Tb.Th, Tb.N, Tb.Sp) and by histomorphometry (BV/TV, Tb.N, Tb.Sp, MS/BS, MAR, BFR/BS, BFR/BV, OcS, OcS/BS) | Yes at femur (energy (J), Bending stiffness (N/mm)) |
| 2021 Y Mo [28] | NA | Yes in rat at distal femur (vBMD) by µCT; at proximal tibia: %Tb.Ar, Tb.Wi, Oc.N, %Oc.Pm, %Ob.Pm) by histomorphometry; and in mice at distal femur (VBMD, Tb.Th) and by µCT | Yes at femur in rat (maximum load (N), fracture load (N), stiffness (N)) and in mice (elastic load (N)) |
| 2020 S Pal [47] | NA | Yes at femur (vBMD, BV/TV, Tb.N, Tb.SP, Tb.Th, SMI, BMD, Ct.Th, Periosteal perimeter) at L5 vertebra (vBMD, BV/TV, Tb.N, SMI) by µCT | Yes at femur (peak load (N), energy (mJ), stiffness (N/mm)) |
| 2019 L. Yang [48] | NA | Yes at vertebra (BMD, TMD, Conn.D, Tb.Th, Tb.Sp) at femur (BMD, TMD, Conn.D, Tb.Th, Tb.Sp, Tb.N, BV/TV) by µCT | Yes at femur (Bending load (N), Elastic modulus (MPa)) |
| 2014 M Feng [49] | Yes at femur (BMD) | Yes at proximal femur (BFR/BF, N.Ot, N.Ob, BV/TV, Tb.Th, N.OC/BS, Tb.Sp) by histomorphometry | NA |
| 2013 Z Ren [50] | Yes at femur (BMD) | Yes at proximal femur (BV/TV, Tb.N, Tb.Th, Tb.Sp) by µCT | Yes at femur (Peak load (N)) |
| 2013 F-S Wang [51] | Yes at femur (BMD, BMC) | Yes at femur (BV/TV, Ct. Porosity) by µCT | Yes at femur (Load (N)) |
| 2011 F-S Wang [52] | Yes but bone site no reported (BMD) | Yes at proximal tibia (BMC) by µCT; (BFR/BS, BV/TV, Ob surface, Oc surface) and by histomorphometry | Yes but bone site no reported (Peak load (N)) |
| 2012 L Cui [53] | Yes at proximal and whole femur (BMD), measured by single photon | Yes at proximal tibia (BV/TV, Tb.Wi, ObS/BS, LGR, MAR, BFR/TV, Ec.MS/BS, EC.MAR, Ec.BFR/BS) by histomorphometry | Yes at femur (maximum force (N), maximum deflection (mm)) |
| 2017 Y Yang [54] | Yes at whole femur (BMD) | Yes at proximal metaphysis femur (Tb.Ar, Tb.Th, Tb.Sp, Tb.N) by histomorphometry | Yes at femur (maximal load (kg), ultimate deflection (mm)) |
| 2014 S Lin [31] | Yes at whole femur (BMD (Significant result at 6 mg/kg/d prednisolone in femur)) | Yes at proximal tibia (Tb.Th, MS/BS, MAR, BFR/BS, BFR/BV) (significant result at 6 mg/kg/d prednisolone in tibia); Ob.S/BS, Oc.S/BS (significant result for doses below 6 mg/kg/d prednisolone in tibia); (Tb.Th, Tb.N, Tb.Sp (significant result at 3 mg/kg/d prednisolone in femur); (Ps MAR, Ps.BFR/BS (significant result at 3 mg/kg/d prednisolone in tibia shaft)(Ct.Th, Ec.MS/BS, Ec.MAR, Ec.BFR/BS (significant result at all dose)) by histomorphometry | Yes at femur and L5 vertebra (elastic load (N), maximum load(N) fracture load (N) stiffness coefficient (N/mm) (Significant result at 6 mg/kg/d prednisolone in femur)); maximum load (N), Young’s modulus at L5 vertebra (MPa)) |
| 2012 J-Y Ko [55] | Yes but bone site no reported (BMD, BMC) | Yes (BMC) by µCT; (BV/TV, Ob.S/BS, Oc.S/BS, BFR/BS) and by histomorphometry | Yes at tibia (peak load (N) |
| 2020 Y Yang [56] | Yes at femur (BMD, BMC (measured by single photon bone mineral density analyzer)) | Yes at femur (trabecular area index) by histomorphometry | NA |
| 2020 D Sato [57] | Yes at distal femur (BMD) | Yes at proximal tibia (Oc.Pm/B.Pm, ES/BS, N.Oc/BS, OS/BS, Ob.S/BS, BFR/BS) by histomorphometry | Yes at tibia (maximum stress (N/cm3)) |
| 2019 T Hou [58] | Yes at proximal tibia (BMD) | NA | Yes at femur (peak load (N), ultimate stiffness (N/mm)) |
| 2017 L.M.F. Lucinda [59] | Yes (BMD) at tibia | NA | Yes at tibia (maximum load (N), bone stiffness (N/m), energy (mJ) |
| 2016 N Han [30] | Yes (BMC, BMD) at femur | NA | Yes at femur (Flexure strength (Mpa), maximum bending force (N)) |
| 2015 Z Achiou [60] | Yes (BMC, BMD) at femur | Yes (BV/TV, Tb.N, Tb.Th, Tb.Pf, Ct.Ar, Ct.Th) at femoral mid-diaphysis by µCT | No statistical difference measured |
| 2013 K Pichler [61] | Yes (BMD) at whole body, vertebra, and femur | No statistical difference reported at femur by histomorphometry | NA |
| 2011 M Saito [62] | No statistical difference reported | NA | Yes at femur (maximum load (N), energy (mJ)) |
| 2017 A Y Sato [63] | Yes (BMD (at whole body at 14 days and whole body, femur, L1–L6 vertebrae at 28 days) | Yes (Tb.Th) at distal femur and proximal tibia by µCT; (BFR/BS, MAR, MS/BS) proximal tibia (periosteal and endocortical) and by histomorphometry | NA |
| 2016 A Y Sato [64] | Yes (BMD) at whole body and L1–L6 vertebrae | Yes (Tb.Th, BA/TA, total Ct.Th, dorsal Ct.Th) by µCT at L6 vertebra; (MAR, BFR/BS, N.Oc/BS, Oc.S/BS) and by histomorphometry at L1–L3 vertebrae | Yes at L6 vertebra (ultimate force (N), energy to ultimate load (mJ), toughness (mJ/mm3)) |
| 2016 A Ersek [65] | NA | Yes (BV/TV, Tb.N, Tb.Pf, SMI, Ct.Th) at vertebra by µCT (N.Oc/T.Ar, Oc.S/BS) at vertebra and by histomorphometry | Yes at femur (maximum load (N), elastic modulus (MPa)) |
| 2019 Q Geng [66] | Yes (BMC) at total body, vertebrae, and femur | Yes (BV/TV, Tb.N, Tb.Th, Ct.Th, Ct.V, SMI, Tb.Sp) at femur by µCT; (BV/TV, T.Col, N.Ob/BS, Ob.S/BS, MS/BS, MAR BFR/BS) at distal femur and by histomorphometry | Yes at femur (maximum load (N), energy absorption (N x mm), stiffness (N/M), ultimate displacement (µm), yield displacement (µm), yield load (N)) |
| 2019 L Mao [67] | Yes (BMD) at femur | NA | Yes at tibia (ultimate load, stiffness) |
| 2019 CG Fenton [68] | NA | Yes (BV/TV, Tb.N, Tb.Th, Tb.Sp) at tibia by µCT; (N.Ob/B.Pm) at L3–4 vertebrae by histomorphometry | NA |
| 2019 J D Schepper [69] | NA | Yes (BV/TV/BW, Tb.Sp, Tb.Th, Tb.N, BV/TV) at femur by µCT | No statistical difference reported |
| 2018 C Ohlsson [70] | Yes (BMC) at total body | Yes (BV/TV) at femur by µCT; (Tb.Th, MAR, Ct.Th, Endosteal circumference, Ct.Po, BFR) at femur and by histomorphometry | NA |
| 2018 I Bergström [71] | NA | Yes (cBMC, Ps.Pm, Imoment of inertia, moment of resistance, Ct.Ar, Ct.Th) at proximal tibia by µCT | No statistical difference reported |
| 2021 A M Dubrovsky [72] | NA | Yes (Ct.Ar, Ct.Ar/Tt.Ar, CT.Th) at central femur; (Tb.Th) at distal femur by µCT | Yes (Yield load (N)) at femur; (ultimate load (N), Yield load (N), work to ultimate force (N mm) for 120 days treatment at L6 vertebra. |
| 2019 S Adhikary [73] | NA | Yes (vBMD, BV/TV, Tb.N, Conn.Den, Tb.Sp, SMI) at epiphysis femur; (CT.Ar, T.Ar, T.Pm) at diaphysis femur; (vBMD, Ct.Th, T.Ar, B.Ar, T.Pm, MMI) at disphysis tibia by µCT | Yes at femur (stiffness (N), energy (mJ), power (N)) |
| 2018 I Alam [74] | Yes (aBMD, BMC (only in female)) at femur | Yes (only in Female) (Tb.N, Tb.Sp) at L5 vertebra; BA/TA, Ct.Th, pMOI,) at femur by µCT | Yes at femur (stiffness, ultimate force, energy to ultimate force (only in female)) |
| 2017 G Mohan [75] | NA | Yes (BV/TV, Ct.BV (only treatment study)) at distal and mid-shaft femur by µCT | Yes (maximum load (prevention (28 days) and treatment (56 days) study)) at L6 vertebra; (maximum load (only treatment study) at femur |
| 2016 F-S Wang [76] | Yes (BMC, BMC) at femur | Yes (B.Ar/T.Ar, Tb.Th, Tb.N, Tb.Sp, Bv/TV, BFR/BS, Ob.S, Oc.S) at femur by histomorphometry | NA |
| 2015 W Yao [32] | NA | Yes (BV/TV) by µCT; (Tb.Th, Conn.D (at 4 mg/kg/d prednisolone)) at L5 vertebra by histomorphometry; (BMD, Ec-MS/BS, Ps-BFR at 2.8 mg/kg/d prednisolone, BV, Ec-MS/BS, Ec-BFR, Ps-MS/BS, Ps-BFR at 4 mg/kg/d prednisolone) at mid femur and by histomorphometry | Yes (maximum load (N), apparent ultimate stress (Mpa), at 4 mg/kg/d prednisolone apparent toughness (kj/m2) at 4 mg/kg/d prednisolone)at vertebral; (apparent ultimate stress (Mpa), apparent toughness (kj/m2)) at 4 mg/kg/d prednisolone at femur |
| 2011 M Marenzana [77] | Yes (BMD) at femur | Yes (Tb.Th, Tb.N) at distal femur TB.Th, longitudinal length) at L5 vertebra (Ct volume, metaphysis Tb.Th) at femur by µCT | Yes at femur (maximum load (N), ultimate strength) |
| 2011 H Henneicke [78] | NA | Yes (Tb.Th, Ct.Th, CT.Ar, MAR, BFR, pericortical Area, osteoclast/pericortical surface, pericortical area) at tibia by µCT and by histomorphometry | No statistical difference reported in mechanical load (N) and elastic modulus (Mpa) |
| 2014 Z Yongtao [26] | Yes (BMD at 12 weeks treatment) at L3–L4 vertebrae | Yes (BV/TV, Tb.Th, MS/BS, MAR, BFR/BS, N.Oc/BS, Oc/BS, ES/BS) at L3 vertebra by histomorphometry | Yes at L4 vertebra (maximum load (N), stiffness (N/mm), fracture stress (N/mm2)) |
| 2011 M Ding [27] | NA | Yes (CT.Po, bone surface: volume ratio, bone surface density, cross sectional area followed by 3 months without treatment) at midshaft femur by µCT | No statistical difference measured in ultimate stress (MPa), ultimate strain (%) Young’s modulus (GPa), failure energy (kJ/cm3) at femur |
| References | GCs Used | BMD Loss | Alteration of the Microarchitecture | Decrease in Biomechanical Properties |
|---|---|---|---|---|
| 2019 Y Xu [33] Rat female SD | DEX (2.5 mg/kg twice per week for 2 months, IM) | Femur | Femur | Femur |
| 2017 H Ren [36] Rat female SD | DEX (0.6 mg/kg every 3 days for 3 months, SC) | L1–L5 vertebrae | L2 vertebra | L2 vertebra |
| 2017 M Zhou [37] Rat female SD | Prednisone (6 mg/kg daily for 21 weeks, SC) | L4 vertebra and femur | Femur | Femur |
| 2017 G Chen [38] Rat female SD | Prednisone (5 mg/kg daily for 90 days, P.O) | Femur | Tibia | Femur |
| 2016 G Shen [40] Rat female SD | DEX (0.6 mg/kg twice per week for 3 months, SC) | L1–L3 vertebrae | L4 vertebra | L4 vertebra |
| 2015 H Ren [41] Rat female SD | DEX (0.6 mg/kg daily for 12 weeks, SC) MP (1 mg/kg daily for 12 weeks, SC) | L1–L3 vertebrae | L4 vertebra | L4 vertebra |
| 2017 G Pizzino [43] Rat female SD | MP (30 mg/kg for 60 days, SC) | Femur | Femur and vertebra | Femur |
| 2016 D Liang [45] Rat female SD | DEX (0.6 mg/kg twice per week or daily for 3 months, IM) | L1–L4 vertebrae | L2 vertebra | L2 vertebra |
| 2015 Y Liu [46] Rat female SD | DEX (2 mg/kg twice per week for 12 weeks, IM) | Femur and L5 vertebra | Tibia | Femur |
| 2013 Z Ren [50] Rat male SD | DEX (0.1 mg/kg daily for 5 weeks, SC) | Femur | Femur | Femur |
| 2013 F-S Wang [51] Rat male SD | MP (5 mg/kg daily for 1–2 or 4 weeks, SC) | Femur | Femur | Yes at femur (Load (N)) |
| 2011 F-S Wang [52] Rat male SD | DEX(0.1 mg/kg daily for 1–2 or 5 weeks, SC) | Bone site no reported | Tibia | Bone site no reported |
| 2012 L Cui [53] Rat male SD | Prednisone (3.5 mg/kg daily for 12 weeks, P.O) | Femur | Tibia | Femur |
| 2017 Y Yang [54] Rat male SD | DEX (1 mg/kg twice per week for 8 weeks, IM) | Femur | Femur | Femur |
| 2014 S Lin [31] Rat male SD | Prednisone (1.5 or 3 or 6 mg/kg daily for 90 days, P.O) | Femur | Tibia at 6 mg/kg and femur at 3 mg/kg | Femur and L5 vertebra at 6 mg/kg |
| 2012 J-Y Ko [55] Rat male SD | DEX (0.1 mg/kg daily for 1–2 or 5 weeks | Bone site no reported | Bone site no reported | Tibia |
| 2020 D Sato [57] Rat female LEW CrlCrlj | Prednisolone (0.42 mg daily for 6 weeks, PSC) | Femur | Tibia | Tibia |
| 2016 A Y Sato [64] Mice female C57BL/6 | Prednisolone (1.4 or 2.1 mg/kg daily for 90 days, PSC) | Whole body and L1–L6 vertebrae | L1–L3 vertebrae | L6 vertebra |
| 2019 Q Geng [66] Mice male C57BL/6 | DEX (1 mg/kg for 5 days per week for 4 weeks, SC) | Total body, vertebra and femur | Femur | Femur |
| 2018 I Alam [74] Mice male and female Col2.3hWNT16TG | Prednisolone (2.1 mg/kg daily for 28 days, PSC) | Femur | Femur | Femur |
| 2011 M Marenzana [77] Mice BALB/c | DEX (3 mg/kg daily for 6 or 9 weeks, P.O) | Femur | Femur and L5 vertebra | Femur |
| 2014 Z Yongtao [26] Rabbit male New Zealand white | DEX (3 mg/kg twice per week for 12 weeks, IM) | L3–L4 vertebrae | L3 vertebra | L4 vertebra |
Publisher’s Note: MDPI stays neutral with regard to jurisdictional claims in published maps and institutional affiliations. |
© 2021 by the authors. Licensee MDPI, Basel, Switzerland. This article is an open access article distributed under the terms and conditions of the Creative Commons Attribution (CC BY) license (https://creativecommons.org/licenses/by/4.0/).
Share and Cite
Xavier, A.; Toumi, H.; Lespessailles, E. Animal Model for Glucocorticoid Induced Osteoporosis: A Systematic Review from 2011 to 2021. Int. J. Mol. Sci. 2022, 23, 377. https://doi.org/10.3390/ijms23010377
Xavier A, Toumi H, Lespessailles E. Animal Model for Glucocorticoid Induced Osteoporosis: A Systematic Review from 2011 to 2021. International Journal of Molecular Sciences. 2022; 23(1):377. https://doi.org/10.3390/ijms23010377
Chicago/Turabian StyleXavier, Andy, Hechmi Toumi, and Eric Lespessailles. 2022. "Animal Model for Glucocorticoid Induced Osteoporosis: A Systematic Review from 2011 to 2021" International Journal of Molecular Sciences 23, no. 1: 377. https://doi.org/10.3390/ijms23010377