Article

Linalool Activates Oxidative and Calcium Burst and CAM3-ACA8 Participates in Calcium Recovery in Arabidopsis Leaves

1
College of Biological Sciences and Technology, Beijing Forestry University, Beijing 100083, China
2
National Engineering Laboratory for Tree Breeding, Beijing Forestry University, Beijing 100083, China
*
Author to whom correspondence should be addressed.
These authors contributed equally to this work.
Int. J. Mol. Sci. 2022, 23(10), 5357; https://doi.org/10.3390/ijms23105357
Submission received: 22 April 2022 / Revised: 6 May 2022 / Accepted: 9 May 2022 / Published: 11 May 2022
(This article belongs to the Special Issue Plant-Insect Interactions 2022)

Abstract

:
Plants produce linalool to respond to biotic stress, but the linalool-induced early signal remains unclear. In wild-type Arabidopsis, plant resistance to diamondback moth (Plutella xylostella) increased more strongly in a linalool-treated group than in an untreated control group. H2O2 and Ca2+, two important early signals that participated in biotic stress, burst after being treated with linalool in Arabidopsis mesophyll cells. Linalool treatment increased H2O2 and intracellular calcium concentrations in mesophyll cells, observed using a confocal microscope with laser scanning, and H2O2 signaling functions upstream of Ca2+ signaling by using inhibitors and mutants. Ca2+ efflux was detected using non-invasive micro-test technology (NMT), and Ca2+ efflux was also inhibited by NADPH oxidase inhibitor DPI (diphenyleneiodonium chloride) and in cells of the NADPH oxidase mutant rbohd. To restore intracellular calcium levels, Ca2+-ATPase was activated, and calmodulin 3 (CAM3) participated in Ca2+-ATPase activation. This result is consistent with the interaction between CAM7 and Ca2+-ATPase isoform 8 (ACA8). In addition, a yeast two-hybrid assay, firefly luciferase complementation imaging assay, and an in vitro pulldown assay showed that CAM3 interacts with the N-terminus of ACA8, and qRT-PCR showed that some JA-related genes and defense genes expressions were enhanced when treated with linalool in Arabidopsis leaves. This study reveals that linalool enhances H2O2 and intracellular calcium concentrations in Arabidopsis mesophyll cells; CAM3-ACA8 reduces intracellular calcium concentrations, allowing cells to resume their resting state. Additionally, JA-related genes and defense genes’ expression may enhance plants’ defense when treated with linalool.

1. Introduction

During plant defense, calcium functions as a crucial early signal. When plants perceive external signals of a pathogen attack, such as oral elicitors from insects or bacterial flagella, Ca2+ ions immediately flow into the cytoplasm from extracellular calcium stores (in the interstitial spaces between the cell wall and plasmids or between cell walls) or intracellular calcium stores (in the vacuole, Golgi apparatus, or endoplasmic reticulum) [1,2]. Once Ca2+ has completed its function as a second messenger, it is returned to the calcium stores via Ca2+-ATPases and the Ca2+/proton antiporter system [3]. H2O2, a reactive oxygen species (ROS) that also participates in many defense mechanisms of plants, has a close relationship with Ca2+. Ca2+ and H2O2 signals can be induced by exogenous polyamine and jasmonic acid (JA) treatment [4] and are also elicited by herbivore feeding [5]. Thus, Ca2+ and H2O2 participate in many resistance mechanisms in plants.
Ca2+ and H2O2 function together in two processes in plants: Ca2+-induced ROS production and ROS-induced Ca2+ release. There are three ways that Ca2+ induces ROS: Ca2+ activates RBOH by binding to the EF region of the RBOH protein in N-terminal; Ca2+-CPKs phosphorylates RBOH; Ca2+ induces the accumulation of phosphatidic acid (PA), which binds to the N-terminus of RBOH and activates RBOH. ROS-induced Ca2+ release is mainly caused by ROS directly activating or inhibiting the activity of calcium channels or pumps regulating the Ca2+ concentration [6]. Additionally, the sequence of calcium and ROS bursts may be an important factor for plants to recognize different stimulations.
Calmodulins (CAMs), including the seven CAMs encoded in the Arabidopsis (Arabidopsis thaliana) genome, play important roles in plant stress or defense responses [7]. AtCaM1 and AtCaM4 interact with S-nitroso glutathione reductase (GSNOR), an important component of nitric oxide (NO) homeostasis, during the salt-stress response, as revealed by protein–protein interaction assays [8]. Moreover, AtCAM4, which negatively affects freezing tolerance, interacts with the CAM-binding protein PATELLIN 1 (PATL1) to regulate Ca2+ signal transduction [9]. AtCAM3 regulates heat shock transcription factor (HSF) activity, HSP gene expression, and HSP protein accumulation [10]. Ca2+-CAM3 activates the expression of heat shock protein (HSP) genes in both the absence and presence of heat shock [11]. CAM7 was previously shown to interact with ACA8 [12]. Different CAMs have different functions, and the understanding of these CAMs’ functions needs further research.
When plants are exposed to insect herbivory, they emit volatile organic compounds (VOCs) [13,14]. The production of the terpene linalool, a fragrant volatile, is induced in plants in response to biotic stress. For example, linalool is among the many volatiles emitted by mossy sorrel (Rumex confertus Willd., Polygonaceae) when injured by weevils (Hypera rumicis L., Coleoptera: Curculionidae) [15]. Herbivory-induced linalool production increases plant resistance to insects. Chrysanthemum plants expressing the linalool synthase gene FaNES1 produce more linalool than wild-type (WT) plants, which makes them smell better but taste worse to insects [16]. Similarly, compared to untreated control plants, rice (Oryza sativa) plants treated with linalool develop significantly shorter Xoo (Xanthomonas oryzae pv. oryzae) lesions. Notably, linalool enhances rice resistance to Xoo without having a direct antibacterial effect on Xoo [17]. The VOC linalool is emitted from plants attacked by insects and enhances plant resistance. However, few studies have focused on the early signal mechanisms induced by linalool. Although linalool enantiomers have different functions [18], in most cases, the two enantiomers are produced at the same time. Indeed, many studies have used a mixture of both enantiomers [19,20,21,22]. Thus, in the current study, we used a linalool mixture and did not separate the two enantiomers.
Here, using non-invasive micro-test technology (NMT) and confocal laser scanning microscopy, we demonstrated that linalool treatment enhances intracellular H2O2 and calcium concentrations in leaves. CAM3 then interacts with ACA8 to transfer Ca2+ out of the cytoplasm and reduce cytoplasmic calcium concentrations. Our findings uncover the role of linalool as a signal inducing H2O2 and calcium concentration changes in Arabidopsis leaves.

2. Results

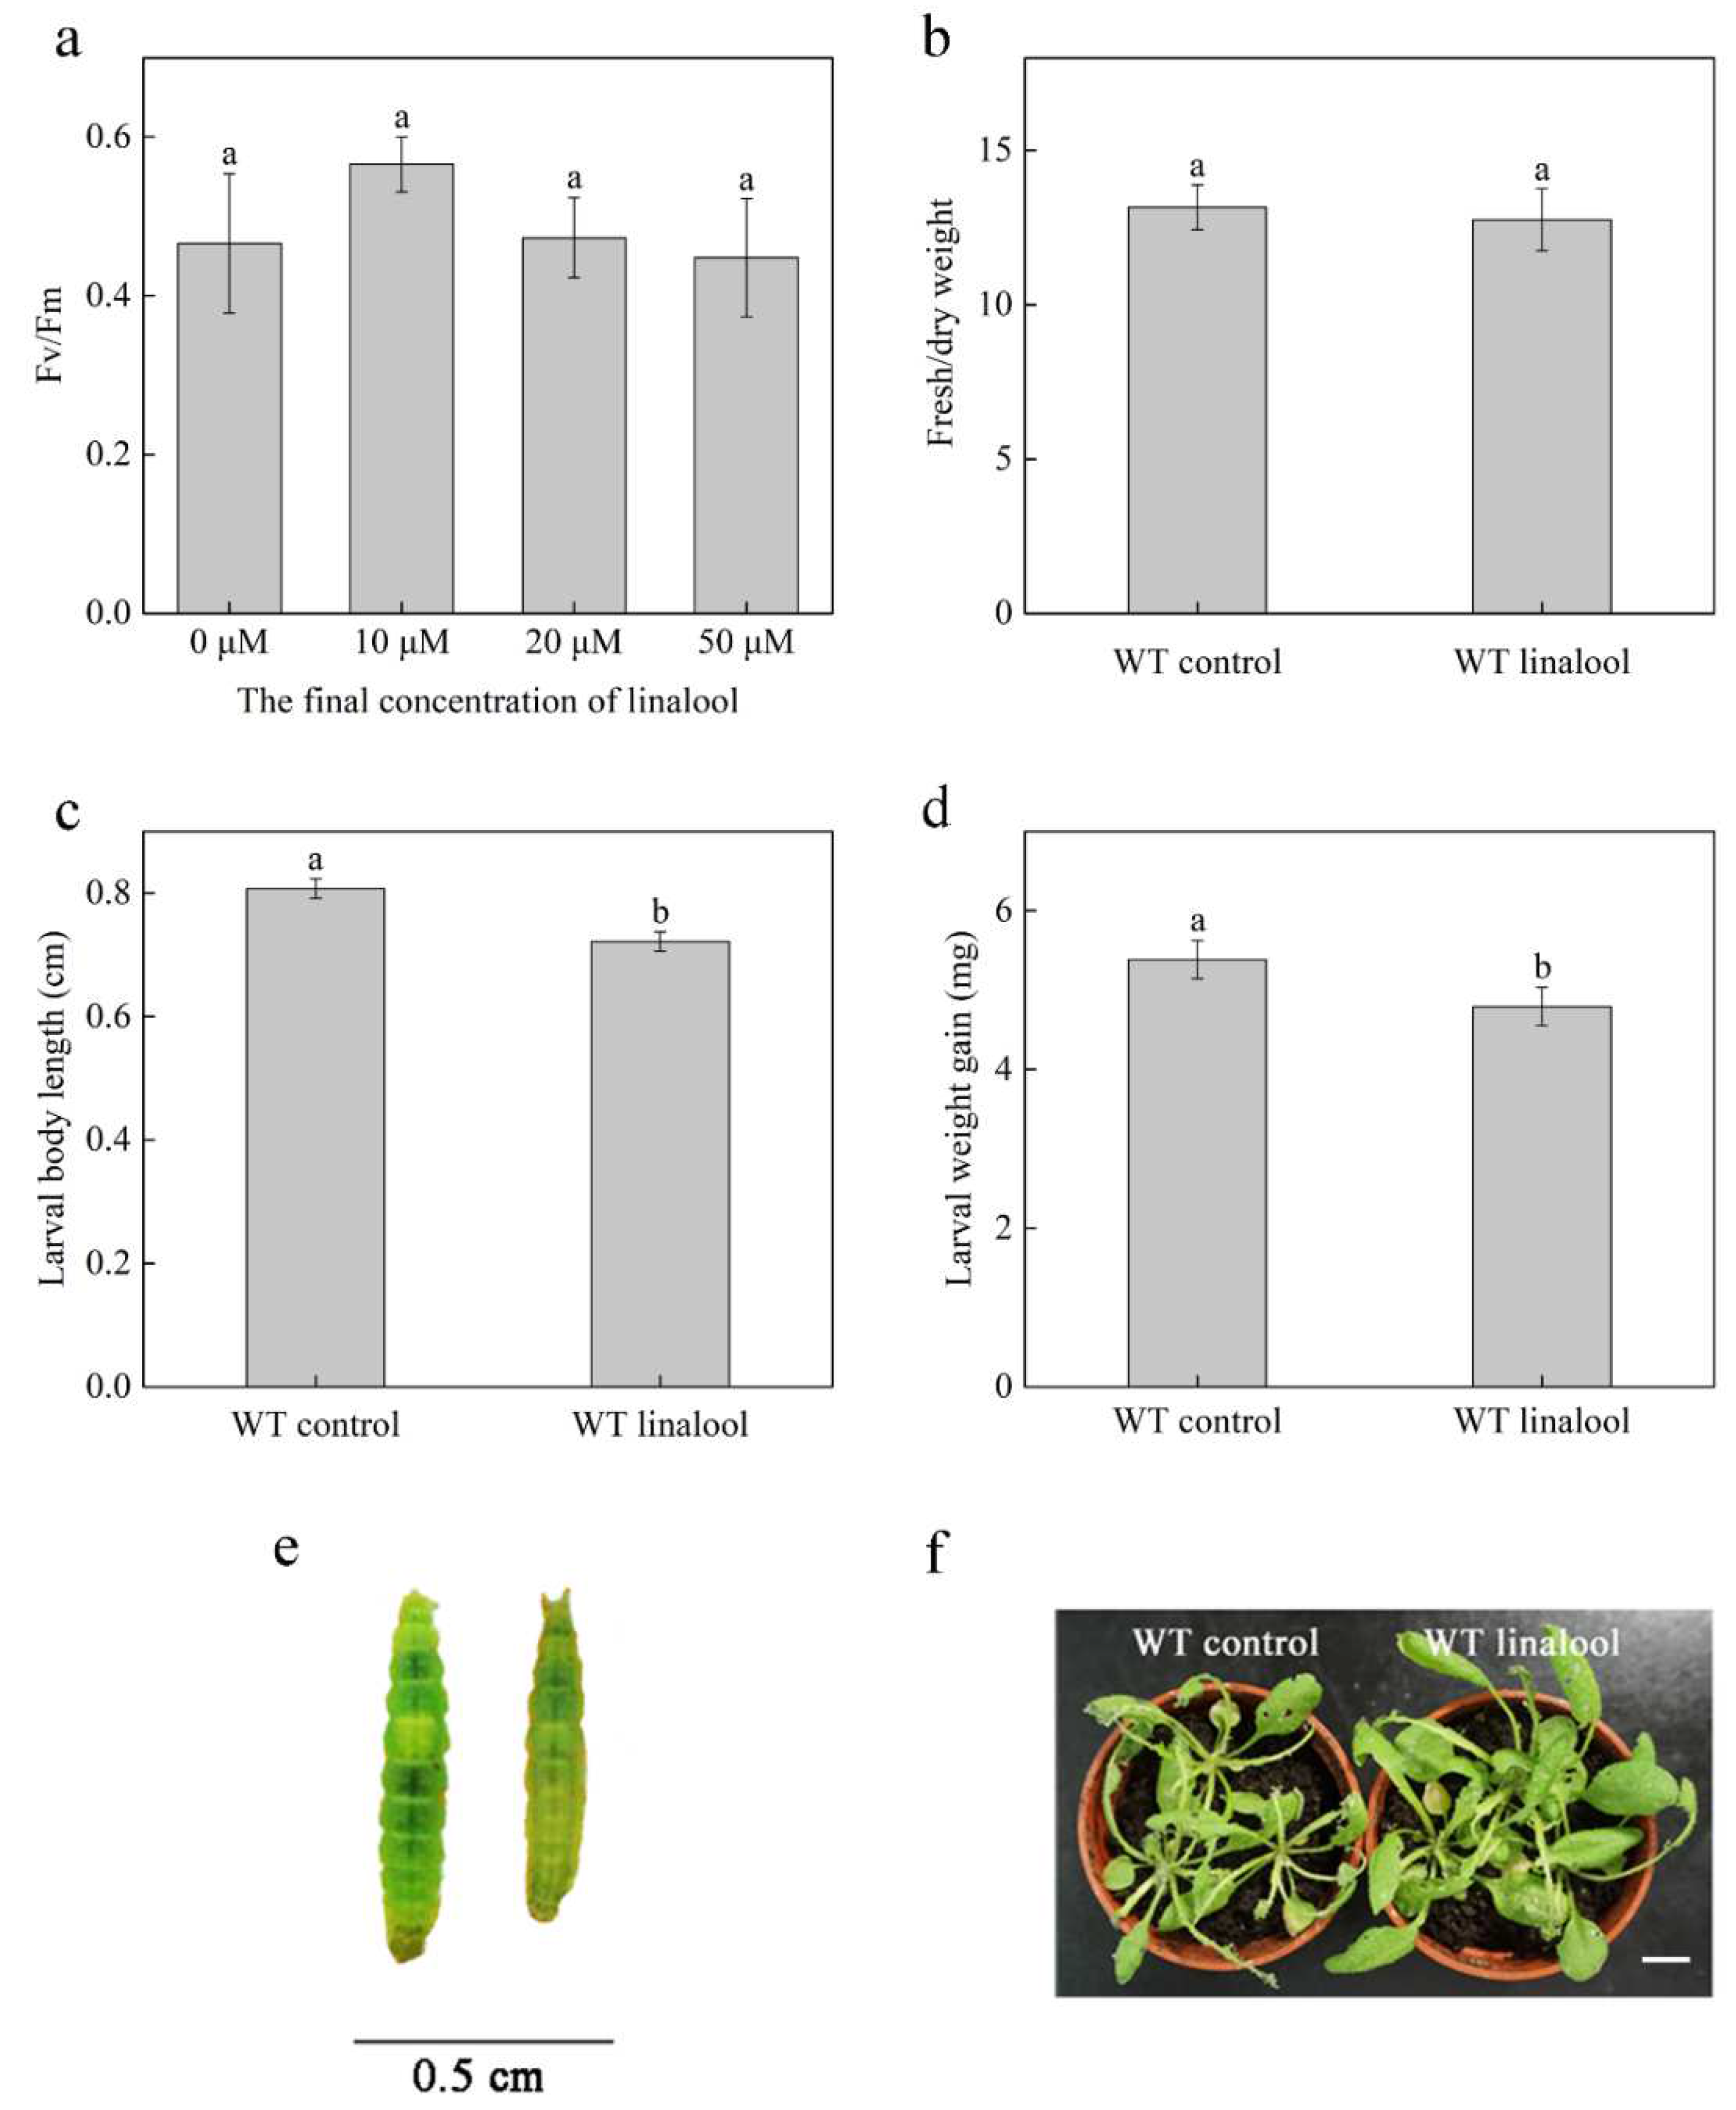
2.1. Linalool Induces Defense Responses against P. xylostella in Arabidopsis

Determination of chlorophyll fluorescence is a common method of studying plant stress responses, particularly in photosystem II (PSII). Additionally, the maximal photochemical efficiency, Fv/Fm, shows the degree of damage in the PSII reaction centers [23]. We set up 10 μM, 20 μM, and 50 μM in three linalool final fumigation concentrations, and the three groups did not have significant differences in Fv/Fm compared with the 0 μM control group (use ethyl alcohol) after 24 h treatment (Figure 1a). This result indicated that there were no stresses on Arabidopsis plants in 10 μM, 20 μM, and 50 μM linalool groups. The Fv/Fm value increased slightly in the lowest linalool concentration group, the 10 μM linalool group (about 0.57), when compared with that in the 0 μM control group (about 0.47). Additionally, the 20 μM linalool group (about 0.47) and 50 μM linalool group (about 0.45) were closer to the 0 μM control group. Thus, we selected the second linalool concentration, 20 μM. In addition, the fresh/dry weight ratio can also reflect the growth status of plants. We detected the fresh/day weight in the WT control group (use ethyl alcohol) and WT linalool group (20 μM linalool final fumigation concentration). Additionally, there was no significant difference between the two groups (Figure 1b). The two experiments’ results indicated that the 20 μM linalool final fumigation concentration did not affect the growth of Arabidopsis plants and could be used for subsequent experiments.
To confirm that linalool induces resistance to P. xylostella in Arabidopsis, we inoculated WT plants with P. xylostella larvae after 24 h of linalool treatment; the control group was treated with ethyl alcohol. After 7 days, we measured the length and weight of P. xylostella larvae. Both growth indicators were significantly lower in linalool-treated plants than in control plants (Figure 1c–e). In addition, the plant leaf damage was also more severe in the control group than in the linalool group (Figure 1f). These results indicate that linalool induces Arabidopsis plant defense against P. xylostella. Early signals are the first response of plants to external stimuli [24]. To further investigate the early signals, we conducted the following experiments.

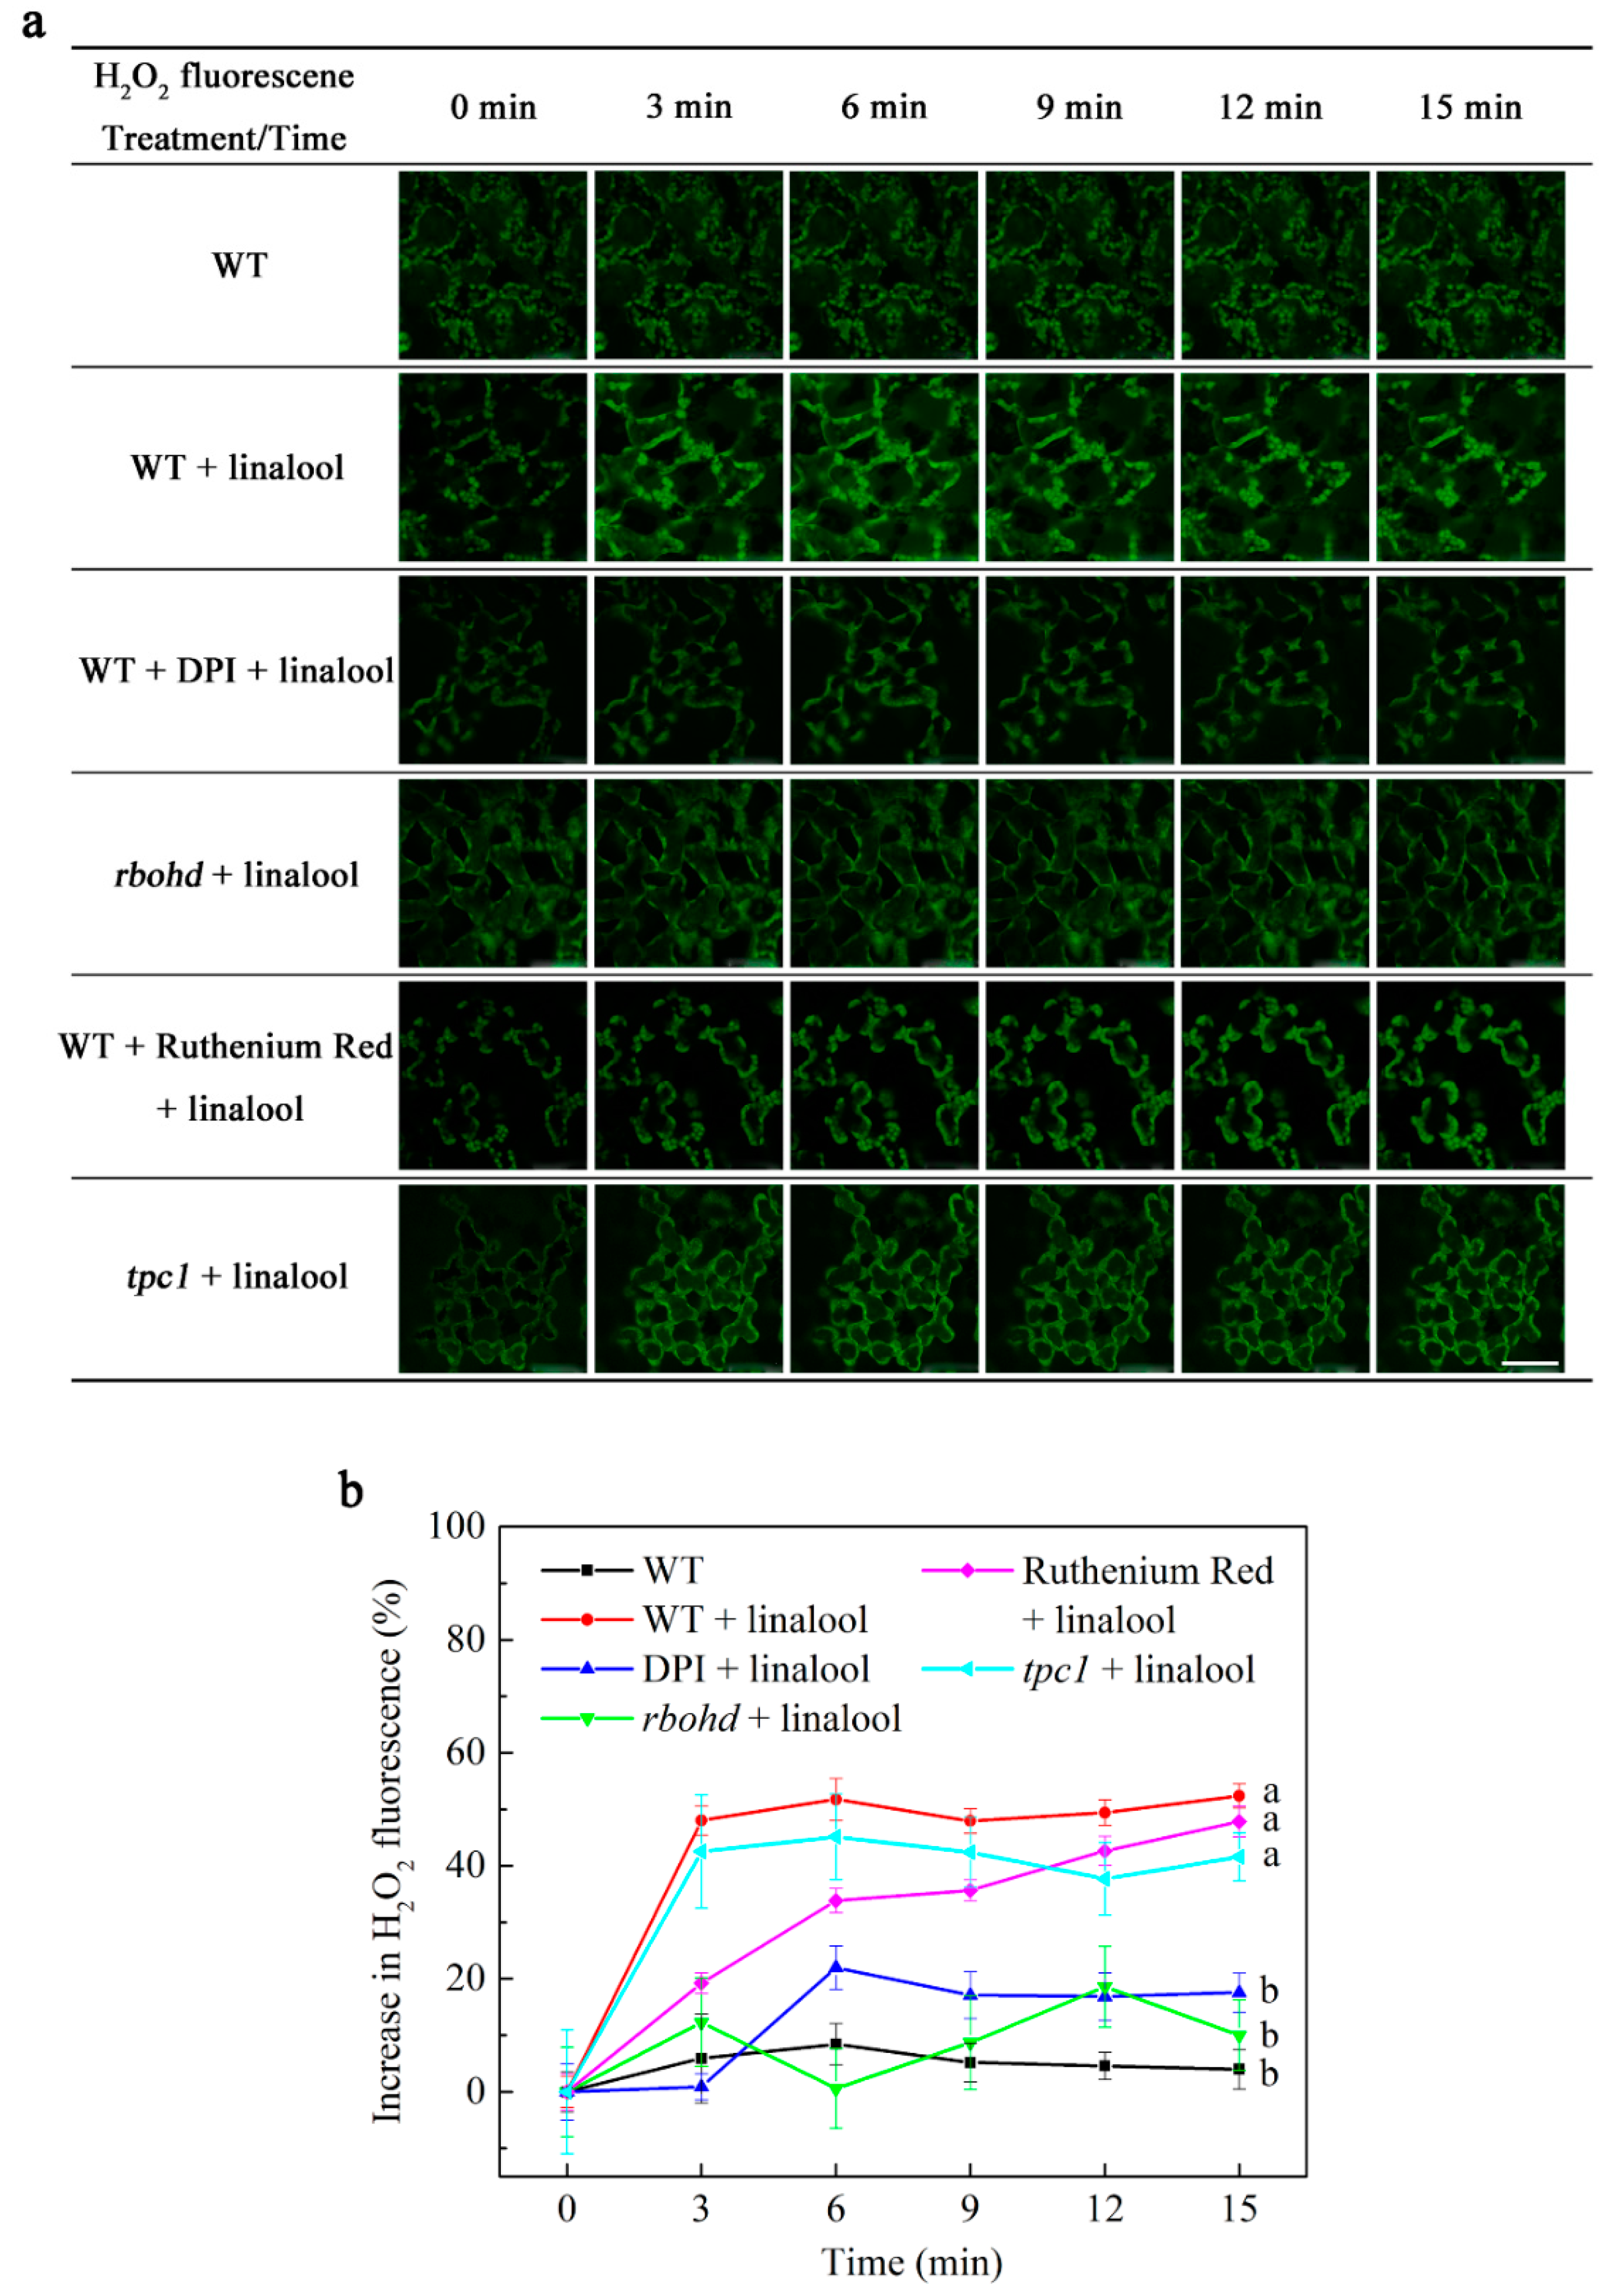
2.2. Linalool Increases H2O2 Levels in Arabidopsis Mesophyll Cells

H2O2 functions as an early signal in various signal transduction processes. We tested the variation in H2O2 levels in Arabidopsis mesophyll cells by performing confocal laser scanning microscopy of mesophyll cells from linalool-treated versus untreated control plants. H2O2 levels were strongly increased in mesophyll cells from linalool-treated WT plants compared to the control. Following linalool treatment, we photographed the plants every 3 min for 15 min (Figure 2a). High levels (increase about 50% above control) of H2O2 were maintained in the WT linalool group throughout the 15 min period (Figure 2b). In contrast, in linalool-treated mesophyll cells pretreated with the NADPH oxidase inhibitor DPI (diphenyleneiodonium chloride) and in cells of the NADPH oxidase mutant rbohd, H2O2 enhanced levels (about 20% above control) were lower than WT linalool group after linalool treatment (Figure 2b). H2O2 levels (about 30–45% above control) in linalool-treated WT cells pretreated with ruthenium red (a Ca2+ channel inhibitor that blocks the release of internal Ca2+) [25,26] and tpc1 cells were similar to those of the WT linalool group (Figure 2b; data from controls are shown in Figure S1). These results indicate that RBOHD functions in linalool signal transduction and that changes in calcium concentrations have little effect on H2O2 levels in mesophyll cells.

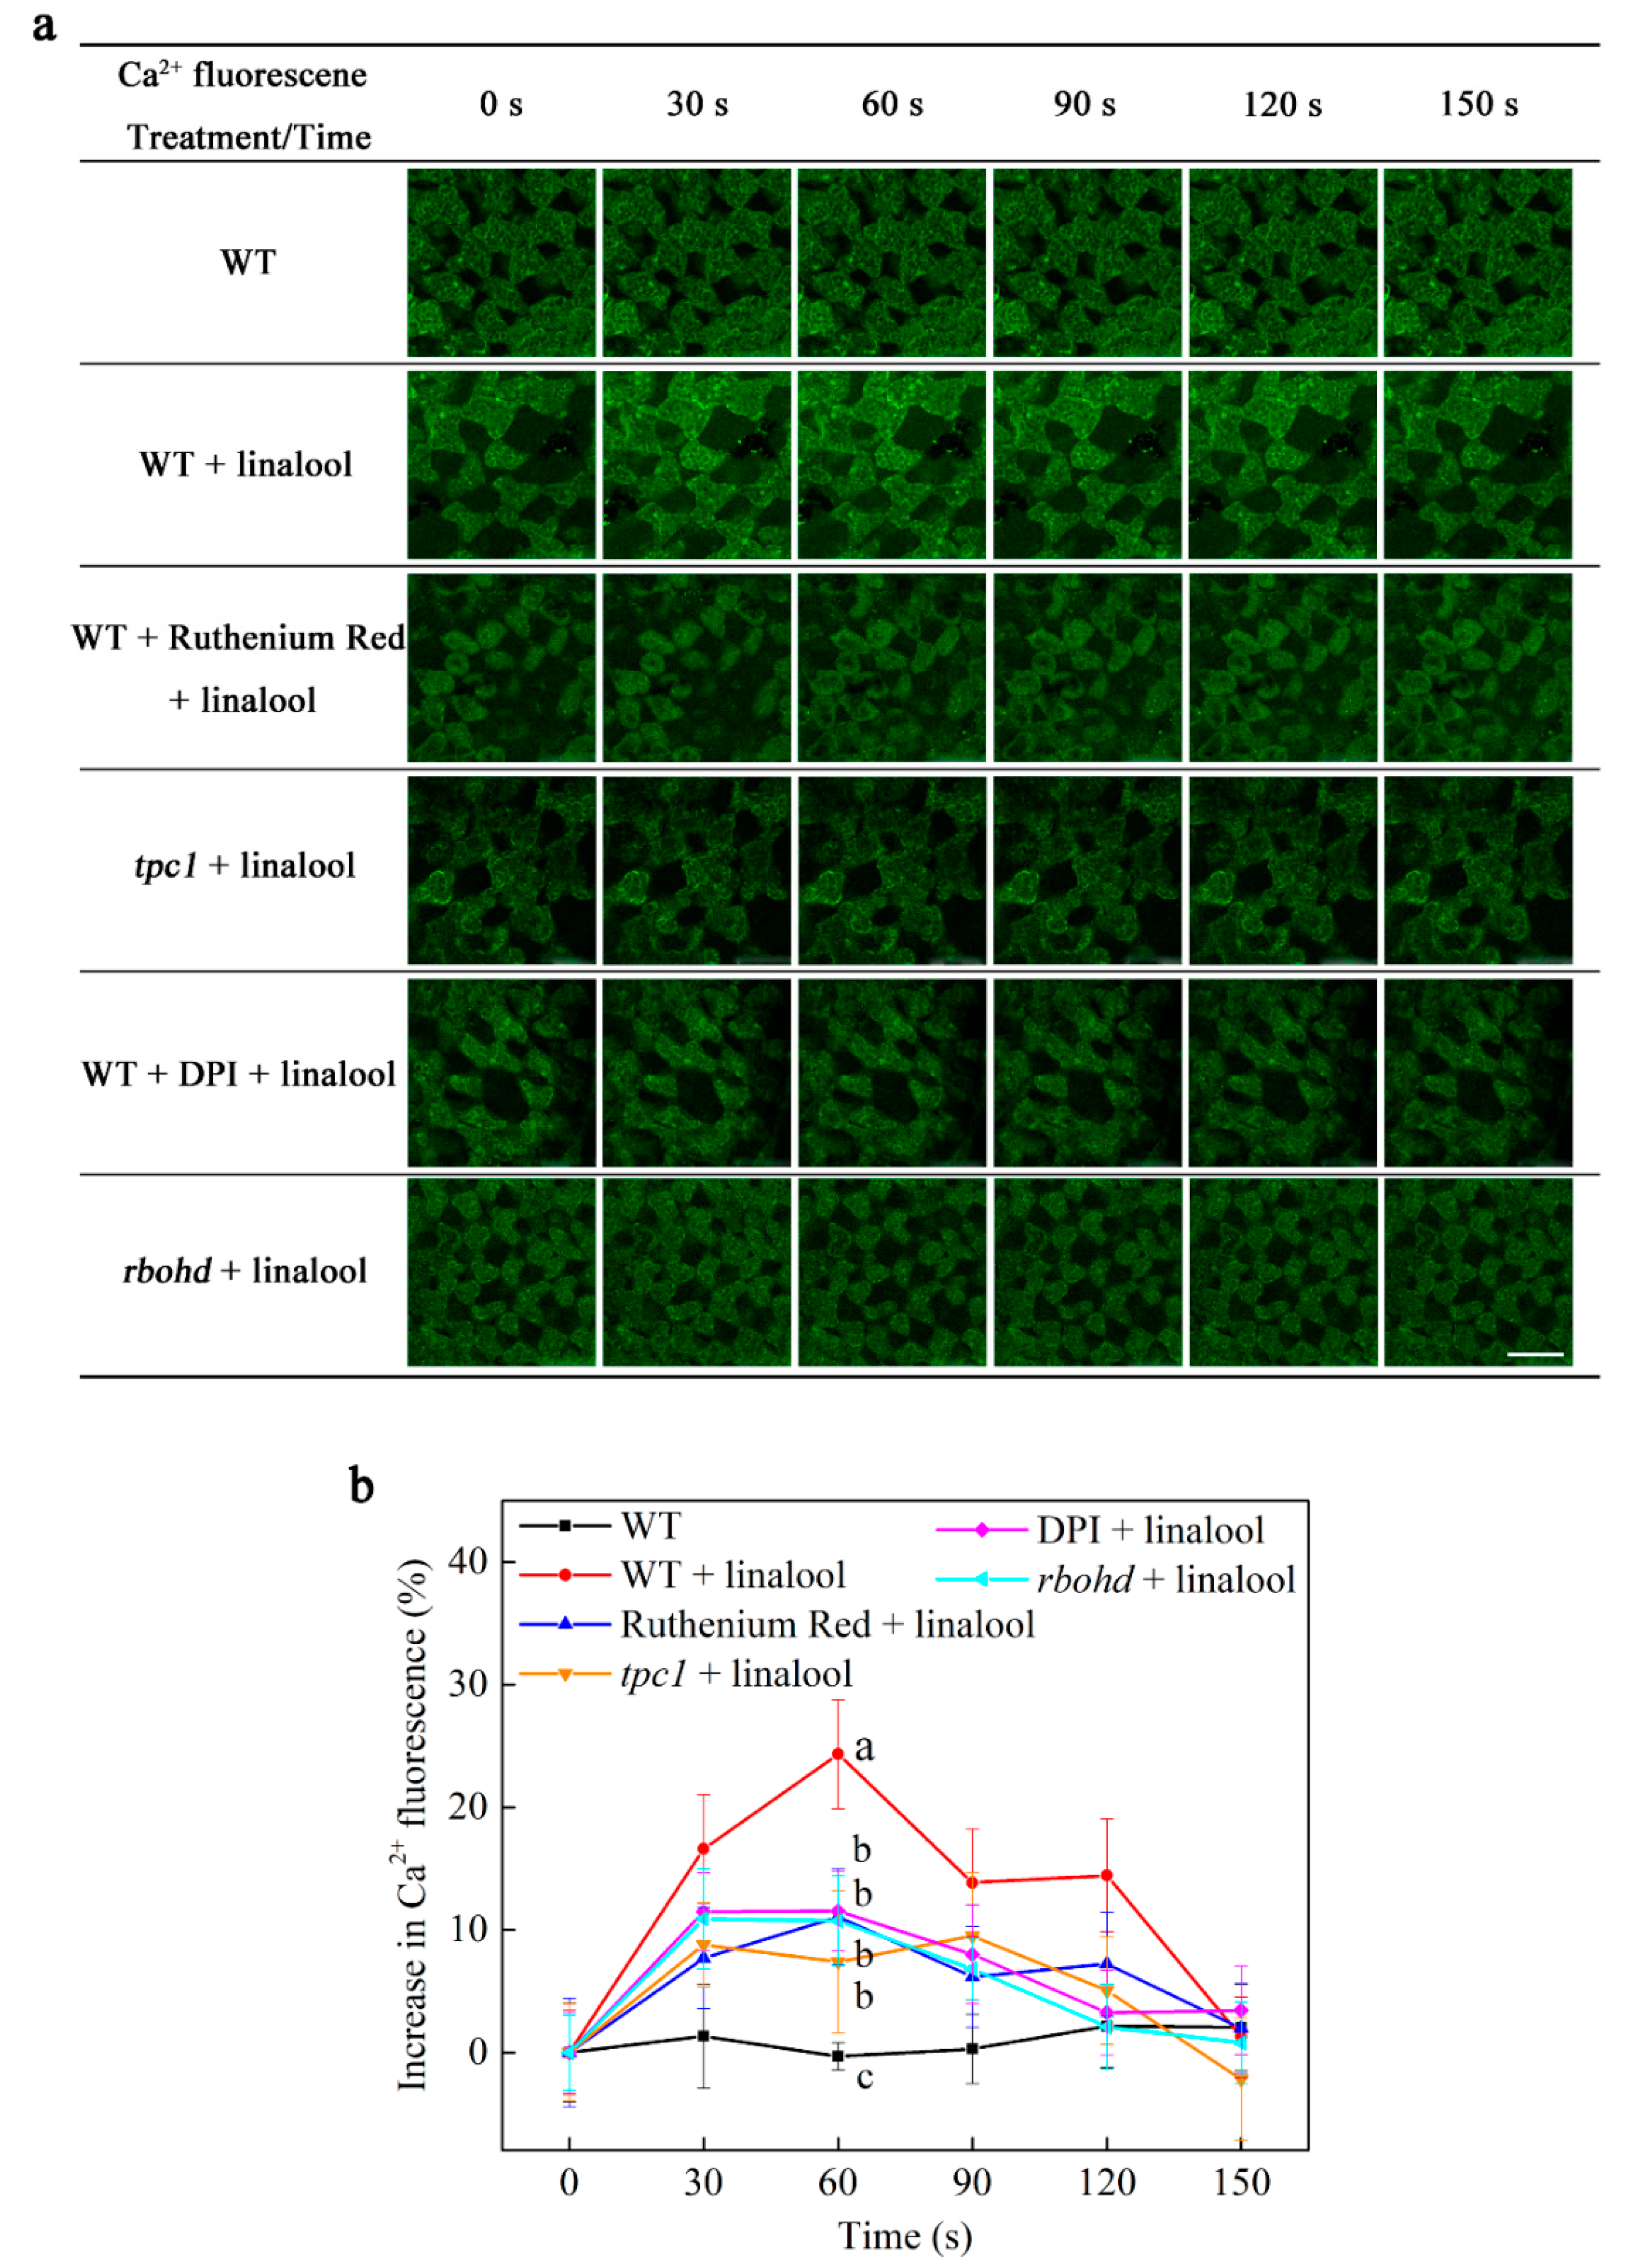
2.3. Linalool Increases Intracellular Calcium Levels in Arabidopsis Mesophyll Cells and Functions Downstream of H2O2 Signaling Burst

To investigate the changes in intracellular calcium concentrations, we performed confocal laser scanning microscopy to detect Ca2+ fluorescence. Ca2+ fluorescence was higher in the WT linalool group versus the other groups from 30 s to 120 s (Figure 3a; data for the control groups are shown in Figure S2). We then calculated the increase in Ca2+ fluorescence. When WT Arabidopsis mesophyll cells were treated with linalool, intracellular Ca2+ fluorescence rapidly increased for 30 s (about 17% above control), remained at a similar level at 60 s, and then gradually decreased to the initial level (Figure 3b). However, in ruthenium-red-treated WT cells, tpc1 cells, DPI-treated WT cells, and rbohd cells, only slight increases (about 8–10% above control) in calcium concentrations were detected during this period in response to linalool treatment (Figure 3a,b). These results suggest that linalool increases calcium concentrations in Arabidopsis mesophyll cells due to the influx of calcium from internal calcium stores. The results of analysis of H2O2 levels and variations in calcium concentrations in DPI-treated and rbohd cells suggest that H2O2 signaling burst functions upstream of the Ca2+ concentration increase.
To further explore the changes in calcium flux in Arabidopsis mesophyll cells, we detected calcium flux by NMT. The test period was divided into pre-linalool treatment (pre), the linalool-responsive peak (peak), and the post-linalool response (post) based on the transient processing of Ca2+ ions by linalool. The pre-period lasted for 2 min, and the peak period began in the second minute. In WT mesophyll cells, Ca2+ flux peaked at 281 pmol cm−2 s−1 and then underwent a steady decline. By 2.5 min, Ca2+ flux was stable and entered the post-period. During both the pre- and post-periods, Ca2+ flux was approximately 58 pmol cm−2 s−1 (Figure 4a). When WT plants were pretreated with ruthenium red, the peak (104 pmol cm−2 s−1) was significantly reduced following linalool treatment compared to that in WT plants treated with linalool but not pretreated with ruthenium red. The peak of the tpc1 mutant (166 pmol cm−2 s−1) showed the same degree of decline as that of the WT ruthenium red group (Figure 4b). In both DPI-pretreated (102 pmol cm−2 s−1) and rbohd (73 pmol cm−2 s−1) mesophyll cells, the peak following linalool treatment was reduced to a level similar to that of the WT ruthenium red and tpc1 groups (Figure 4c). To further test the differences among these groups, we calculated the mean Ca2+ flux, finding that the peak was significantly higher in the WT linalool group than in the other groups. The mean Ca2+ flux was calculated and compared amongst experimental treatments to test the statistical differences among these groups (Figure 4e). The results showed that the mean Ca2+ fluxes were reduced in the ruthenium red pretreated group, tpc1 mutant group, DPI-pretreated group, and rbohd mutant group. The result of Ca2+ flux is consistent with that of calcium concentrations.

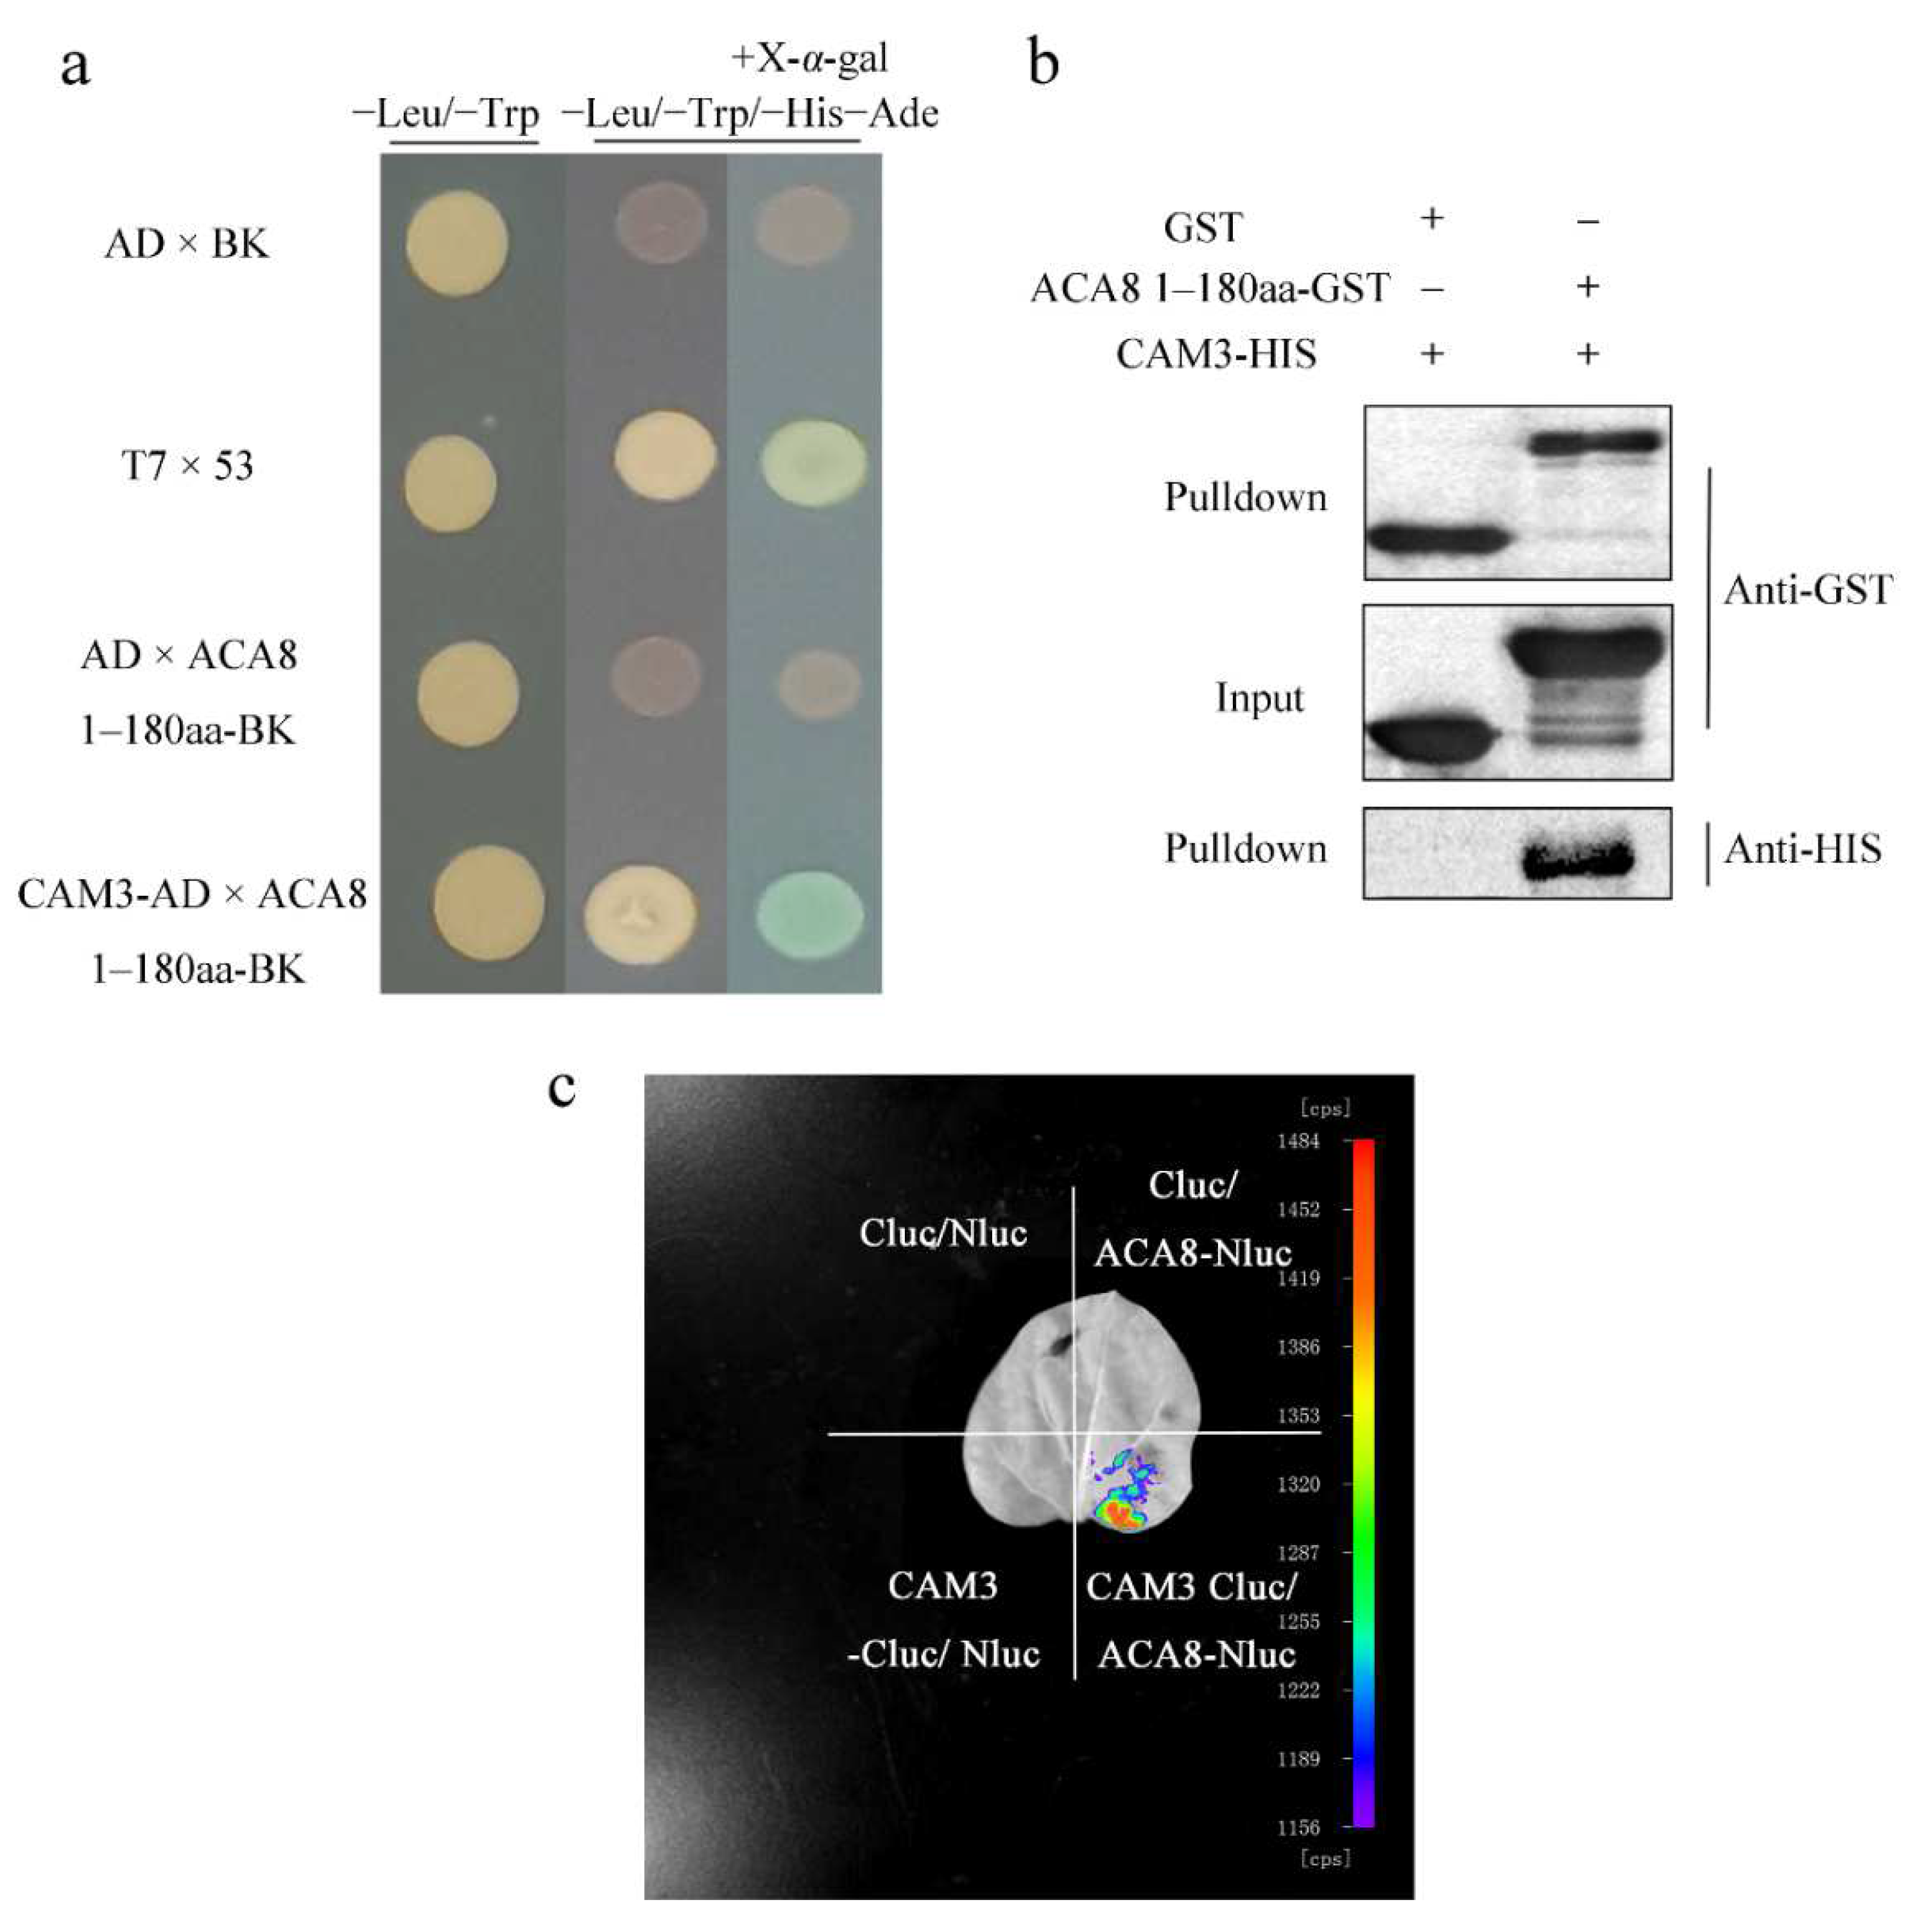
2.4. CAM3 Interacts with ACA8 to Transport Calcium Ions Outside of Mesophyll Cells

After the calcium signal is transferred, the calcium must be transported into extracellular or intracellular calcium stores. Since the overall transmembrane calcium flow rate of the cell population at the monitoring site where the electrode monitored by NMT is located is efflux, we speculated that Ca2+-ATPase might play an important role in this process. We pretreated WT leaves with the Ca2+-ATPase inhibitor Eosin B and examined calcium flux. The peak of calcium flux was lower in the Eosin B-pretreated WT + linalool group (about 109 pmol cm−2 s−1) than in the WT + linalool group (about 281 pmol cm−2 s−1) (Figure 4d), indicating that Ca2+-ATPase functions in calcium transport. ACA8, a Ca2+-ATPase, is located in the plasma membrane. Additionally, CAM7 was previously shown to interact with ACA8 [12]. Because CAM3 and CAM7 are CAM family members that share high sequence similarity (up to 98.9%), the peak of calcium flux was also about 100 pmol cm−2 s−1 in the cam3-1 + linalool group and about 19 pmol cm−2 s−1 in the cam3-2 + linalool group (Figure 4d). We predicted that CAM3 is also a binding partner of ACA8. To investigate this hypothesis, we conducted Y2H, LCI, and in vitro pulldown assays.
Since ACA8 is a transmembrane protein, and CAM7 interacts with the N-terminus of ACA8, we used the N-terminus (residues 1–180) of ACA8 as bait and CAM3 as the prey protein, finding that the competent yeast strain AH109 cells with co-transformed plasmid pairs CAM3-AD plus ACA8 (residues 1–180)-BK grew on SD/−Leu/−Trp and SD/−Ade/−His/−Leu/−Trp and grew blue colonies on SD/−Ade/−His/−Leu/−Trp with X-α-gal. This result indicated that CAM3 binds to the N-terminus of ACA8 in the Y2H assay (Figure 5a). CAM3 also interacted with the N-terminus of ACA8 in a pulldown assay. In the anti-HIS pulldown line, CAM3–HIS was not detected in CAM3-HIS with GST group, but in CAM3-HIS with ACA8-GST group, CAM3-HIS was detected by immunoblot analysis using anti-HIS antibodies (Figure 5b). In LCI assay, N. benthamiana leaf parts injected with CAM3-Cluc/ACA8-Nluc showed stronger fluorescence than the other three (control) leaf parts (Cluc/Nluc, CAM3-Cluc/Nluc, and Cluc/ACA8-Nluc) (Figure 5c). These results demonstrate that CAM3 interacts with ACA8. In addition, we examined calcium flux in the cam3 mutant after linalool treatment and found that the peak flux was lower in cam3 than in WT plants following linalool treatment (Figure 4d). These results provide further evidence that CAM3 interacts with ACA8 to participate in calcium efflux.

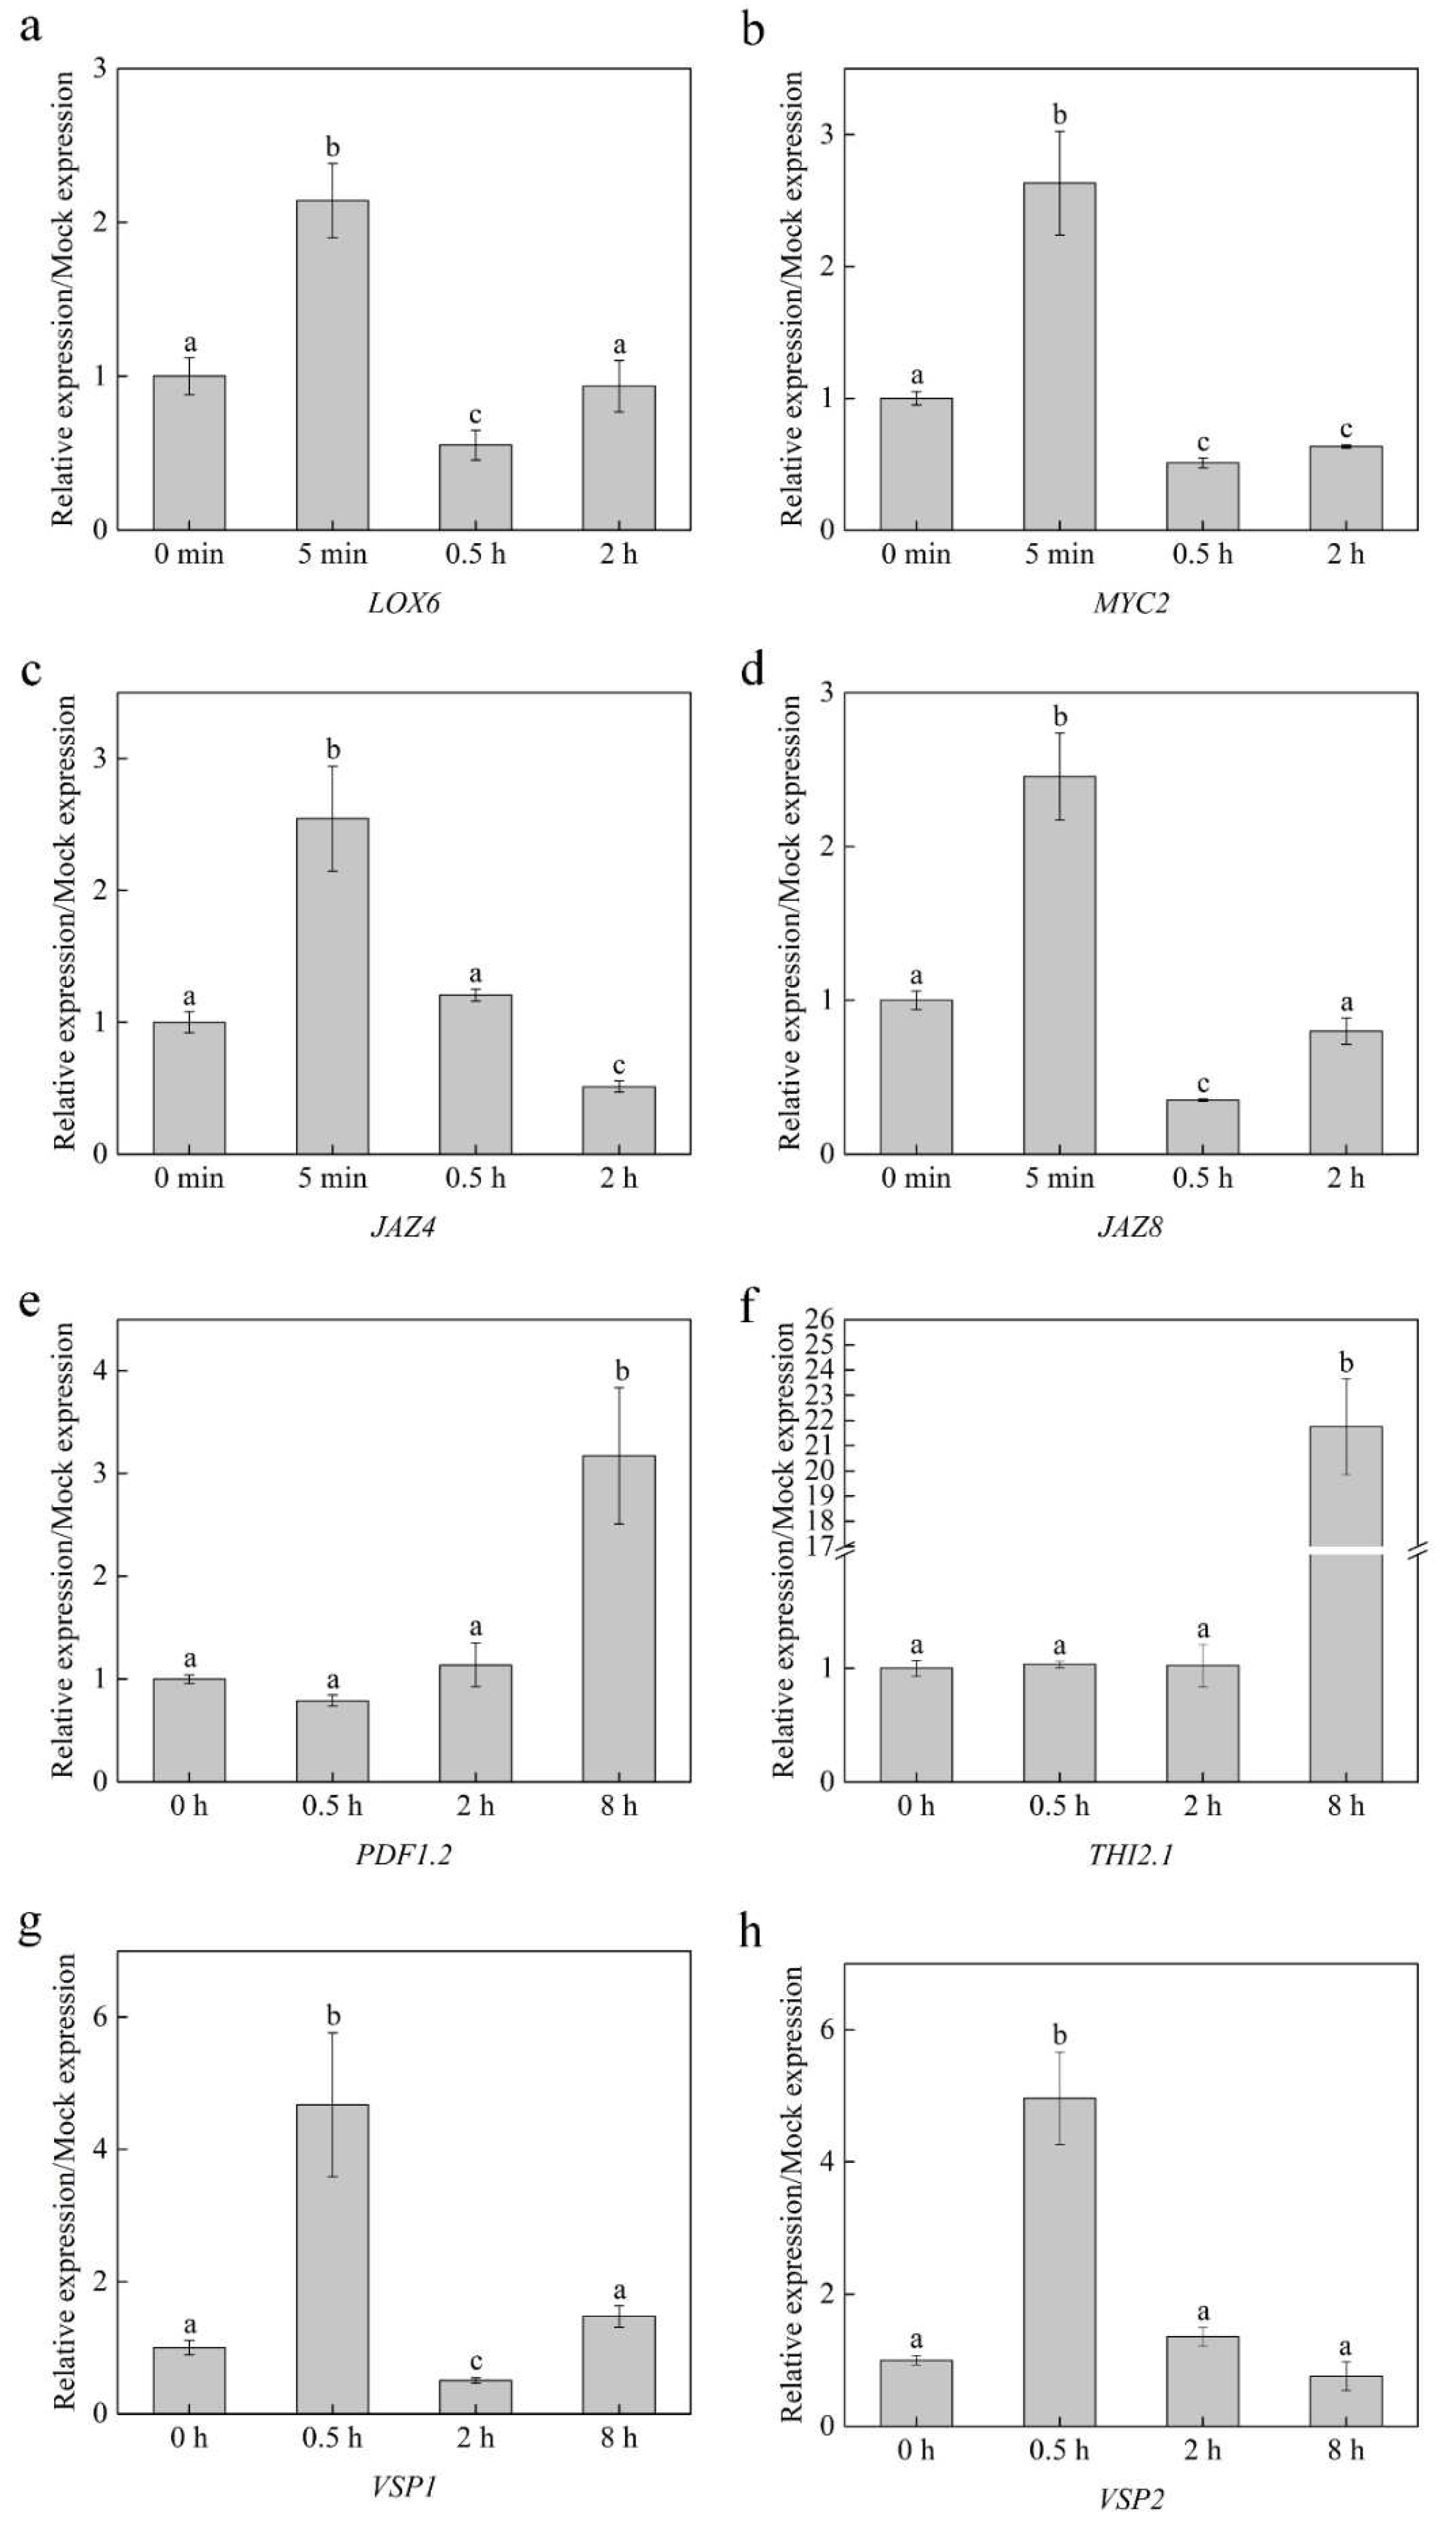
2.5. Linalool Activates JA-Related Gene Expression

JA is an important hormone that functions in plant defense. To further explore the roles of JA in linalool-induced signaling, we measured the expression of important genes related to JA pathways, including LOX6, MYC2, JAZ4, and JAZ8, in WT plants following linalool treatment for 5 min, 0.5 h, and 2 h. In addition, we measured the expression of defense genes PDF1.2, THI2.1, VSP1, and VSP2 in WT plants following linalool treatment for 0.5 h, 2 h, and 8 h. Almost all genes are expressed in the WT (Figure 6), as revealed by qPCR. The maximum value of JA-related gene expression was about 2~3-fold at 5 min (Figure 6a–d). In contrast, the maximum value of defense gene expression was not at the same time. The maximum value of PDF1.2 (about 3.2-fold) and THI2.1 (about 22-fold) gene expression was at 8 h (Figure 6e,f), and the maximum value of VSP1 (about 4.7-fold) and VSP2 (about 5-fold) gene expression was at 0.5 h (Figure 6g,h). Overall, these results indicate that linalool can induce JA-related gene and defense gene expression.

3. Discussion

In this study, we demonstrated that linalool, a volatile released from plants, enhances H2O2 and intracellular calcium concentrations in Arabidopsis mesophyll cells; CAM3-ACA8 reduces intracellular calcium concentrations, allowing cells to resume their calcium resting state. In addition, the observation that linalool treatment enhances plant defense may be due to JA-related genes’ expression and defense genes’ expression.
When Arabidopsis recognizes linalool, H2O2 levels in leaf mesophyll cells rapidly increase. We found that this H2O2 burst was inhibited in the leaves of WT plants pretreated with the NADPH oxidase inhibitor DPI and in leaves of the NADPH oxidase mutant rbohd (Figure 2). Similarly, linalool treatment resulted in rapid increases in the intracellular Ca2+ concentration and Ca2+ flux, and both of these effects were inhibited in DPI-treated and rbohd mesophyll cells (Figure 3 and Figure 4). Increases in intracellular Ca2+ concentrations and Ca2+ flux were also inhibited when we used the intracellular calcium store inhibitor ruthenium red and in tpc1, a mutant of TPC1 (a depolarization-activated Ca2+ channel located in the vacuolar membrane). Therefore, we measured H2O2 levels in ruthenium-red-pretreated wild-type and tpc1 leaves following linalool treatment. The H2O2 burst was not inhibited in these cells, indicating that the linalool-induced H2O2 burst occurs before the increase of Ca2+ levels in Arabidopsis leaf mesophyll cells. (E)-2-hexenal can also increase the Ca2+ concentration in leaves of Arabidopsis thaliana. When leaves were pretreated with ruthenium red, calcium ions could not be induced by (E)-2-hexenal, suggesting that intracellular calcium store is involved in the increase in the (E)-2-hexenal-induced intracellular Ca2+ concentration [27].
Ca2+ and H2O2 function together in two processes in plants: Ca2+-induced ROS production and ROS-induced Ca2+ release [6]. Here, we demonstrated that linalool-induced Ca2+ and H2O2 signaling function in ROS-induced Ca2+ release. The recognition of different stimuli occurs via different processes during early signaling, making the sequence of early signaling events a special ’language’ in plant resistance.
TPC1 activation is regulated by many factors. Ca2+ binding to the TPC1 cytosolic EF-hand domain triggers conformational changes to activate TPC1 [28]. Additionally, ABA, ATP, cAMP, and Ca2+ treatment increase vacuolar Ca2+ release, while vacuolar Ca2+ efflux was strongly suppressed by H2O2 in an earlier study [29]. In our study, linalool-induced H2O2 burst is upstream of the enhancement of calcium concentration in Arabidopsis mesophyll cells. Therefore, there may be other ways to slightly increase intracellular calcium concentration in the cytoplasm before linalool-induced calcium is released from the intracellular calcium store, thereby activating TPC1 and releasing large amounts of calcium from the intracellular calcium store into the cytoplasm. At the same time, a more detailed study of how TPC1 is activated with linalool treatment should be undertaken in a separate investigation.
Ca2+ plays an important role in many signaling transduction processes, but high concentrations of calcium in the cytoplasm are toxic to cells. After calcium has functioned as a second messenger, it is transported into calcium stores. The P-type ATPase, Ca2+-ATPase, located in the plasma membrane and the intracellular calcium store membrane, participates in the process of calcium efflux. Studies have shown that only II B Ca2+-ATPase can bind to CAMs. When the N-terminal of Ca2+-ATPase binds to Ca2+, CAM also binds to the N-terminal CAM binding site [30]. By examining Ca2+ flux, we showed that linalool-treated mesophyll cells exhibit strong Ca2+ efflux. Therefore, we investigated whether the Ca2+-ATPase inhibitor Eosin B would inhibit this Ca2+ efflux. Our findings indicate that Ca2+-ATPase participates in linalool-induced Ca2+ efflux in mesophyll cells and that Ca2+ efflux is inhibited in cam3 plants (Figure 4d). Since CAM7 interacts with ACA8 [12], CAM3 and CAM7 share high sequence similarity (up to 98.9%), so we suggested that CAM3 may also interact with ACA8. Y2H, LCI, and in vitro pulldown assays indicated that CAM3 binds to the N-terminus of ACA8 and functions in the Ca2+ efflux process (Figure 4d and Figure 5).
Early signals are the beginning of a series of responses that begin in plants when they feel external stimulations [24]. Plants that receive VOCs influence gene regulation, metabolism, phenotype, responses to stress, and behavioral choices [31]. In our study, linalool-treated plants can be seen as ‘receivers’ that change in gene regulation and responses to stress (linalool-treated plants are more resistant to insects) to improve the ability of plants to cope with biotic stress. In WT plants treated with linalool, the expression of almost all genes related to the JA pathway and defense genes increased compared to those in the untreated control (Figure 6). These results indicate that the linalool-induced upregulation of JA-related genes and defense genes made plants in a more stress-resistant state to enhance plant defense.
Notably, changes in intracellular Ca2+ concentrations regulate the JA biosynthesis pathway. When plants are wounded by insects, CML37 and CML42 influence the JA biosynthesis pathway [32,33]. Further studies could uncover the Ca2+ sensors involved in linalool-induced plant defense. In addition, much remains to be learned about the messages encoded in different VOCs. This knowledge could lay the foundation for the strategies plants use to defend themselves against insects.

4. Materials and Methods

4.1. Plant Materials and Culture Conditions

Wild-type (Col-0) Arabidopsis, rbohd CS9555 (AT5G47910), tpc1 SALK_125658 (AT4G03560), cam3-1 SALK_149754C (AT3G56800), and cam3-2 SALK_042391C (AT3G56800) mutants were used in this study. The seeds were vernalized at 4 °C for 2 days in the dark. After vernalization, the seeds were surface-sterilized for 4 min in 75% ethyl alcohol, washed four times in sterile water, sown in the autoclaved soil mixture, and placed in an incubator (Percival model: I-36vl). Plants were grown in soil at 21–23 °C and 70% relative humidity with a light intensity of 80–110 μmol m−2 s−1 under long-day (16 h light/8 h dark) conditions. The plants used for insect inoculation were grown for 4 weeks, and the plants used in the other experiments were grown for 2 weeks before treatment.

4.2. Plutella xylostella Egg Hatching and Inoculation

Plutella xylostella (diamondback moth) eggs were hatched in an incubator at 25 ± 1 °C with a relative humidity of 50 ± 10%. After 1–2 days, larvae that were identical in length and weight were chosen for inoculation onto Arabidopsis plants; each plant was inoculated with three larvae. WT control and WT linalool-treated plants were prepared for analysis. Seven days later, the insects were removed, and their lengths and weights were measured. Each group contained 25–40 insects.

4.3. Chlorophyll Fluorescence Measurement

WT control and WT linalool-treated plants were used to measure leaf chlorophyll fluorescence. After 0.5 h dark adaption, the maximum photochemical efficiency Fv/Fm was of PSII, obtained with a modulated fluorometer IMAGING PAM (Zealquest Scientific Technology Co., Ltd., Shanghai, China). Every group contained 6–8 Arabidopsis plants.

4.4. Linalool Fumigation

Arabidopsis plants were treated with linalool (≥97%, a mixture of the two enantiomers of linalool, purchased from Sigma-Aldrich, Shanghai, China, CAS NO.: 78-70-6) via fumigation in glass bell jars (height: 12.5 cm; diameter: 15 cm) in insect growth test. Cotton balls 1 cm in diameter were soaked in linalool dissolved in ethyl alcohol (in insect inoculation and qRT-PCR experiments; linalool’s final concentration was 20 μM) and hung in the bell jars; cotton balls soaked in the same volume of ethyl alcohol were used for the control. After adding the cotton balls, the bell jars were immediately sealed with Vaseline petroleum jelly.

4.5. Fresh/Dry Weight Measurements

Arabidopsis plants treated with ethyl alcohol and linalool (linalool’s final concentration was 20 μM) were used to measure fresh weight. Additionally, the samples were then dried in an oven at 80 °C for 24 h to constant weight and weighed as dry weight. Every group contained 6–8 Arabidopsis plants.

4.6. Ca2+ Flux Measurements in Mesophyll Cells

Ca2+ flux in mesophyll cells was measured using non-invasive micro-test technology (NMT) (BIO-001A, Younger, MA, USA). Before testing, a small cut was made in the leaves of 2-week-old Arabidopsis plants. The leaves were soaked in test solution (0.1 mmol L−1 KCl, 0.1 mmol L−1 CaCl2, 0.1 mmol L−1 MgCl2, 0.5 mmol L−1 NaCl, 0.3 mmol L−1 MES, 0.2 mmol L−1 Na2SO4, pH 6.0) for approximately 30 min. Silanized glass micropipettes (2–4 μm aperture) were filled with electrolyte solution (100 mmol L−1 CaCl2) and front-filled with a selective liquid ion exchange (LIX) cocktail to approximately 10 μm. The glass micropipettes were connected to the NMT system with a silver chloride wire, and electrodes with Nernstian slopes of 28 ± 5 mV log−1 were used.
The Ca2+ concentration in the mesophyll cells was measured near the cells and 30 μm away from the cells at 0.2 Hz. Each leaf was tested for 2 min before linalool treatment (pre-linalool treatment; pre). After linalool was quickly added to the test solution to a final concentration of 100 μM, data were collected for approximately 2.5 min as the linalool response peak (peak) group. Data were then collected from the post-linalool response (post) group to indicate the end of the reaction. The final flux values are reported as the mean of eight individual plants per treatment. The Ca2+ flux was calculated as:
J = D Δ C Δ X
where J is the flux of Ca2+ (pmol cm−2 s−1), D is the diffusion coefficient (0.79 × 10⁻⁵ cm2 s−1), ΔC is the difference between the concentrations near and far from the cells, and ΔX is 30 μm. Each group contained 6–8 replicates.

4.7. Ca2+ Fluorescence Measurements in Mesophyll Cells

Before treatment with Fluo3-AM (10 μM), Arabidopsis leaves were soaked in a test solution (the same solution used for the Ca2+ flux experiment). The leaves were then soaked in Fluo3-AM solution to label Ca2+ ions for 1 h in the dark in an incubator. The leaves were washed and placed in the fresh test solution. Ca2+ fluorescence was detected under a confocal laser scanning microscope (Leica TCS SP8, Leica Microsystems, Wetzlar, Germany). The excitation wavelength was 488 nm, and the emission wavelength was 530 nm. Before linalool (a final concentration of 100 μM) addition (0 min), the basal level of Ca2+ fluorescence in mesophyll cells was measured. Following the addition of linalool, fluorescence was measured every 30 sec for 150 s. Each group contained 20–40 cells.
The increase in Ca2+ fluorescence = (Xa)/a × 100%, where X is the fluorescence of linalool-treated samples, and a is fluorescence at 0 s. The value for each group was calculated separately.

4.8. H2O2 Fluorescence Measurements in Mesophyll Cells

H2DCF-DA was used to measure changes in H2O2 levels in Arabidopsis mesophyll cells. Following incubation in the test solution, the leaves were incubated in 50 μM H2DCF-DA for 15 min. Confocal laser scanning microscopy (Leica TCS SP8, Leica Microsystems, Wetzlar, Germany) was used to detect H2O2 fluorescence at an excitation wavelength of 488 nm and an emission wavelength of 510–530 nm. H2O2 fluorescence measurements were obtained at 0 min (before the addition of linalool) and every 3 min for 15 min. The increase in H2O2 fluorescence was calculated as Ca2+, and linalool’s final concentration was 100 μM. Each group contained 20–40 cells.

4.9. Yeast Two-Hybrid (Y2H) Assay

The sequences encoding CAM3 were cloned into pGADT7, and the sequences encoding amino acid residues 1–180 of ACA8 (ACA8 (residues 1–180)) were cloned into pGBKT7, respectively. The plasmid pairs CAM3-AD plus ACA8 (residues 1–180)-BK were co-transformed into competent yeast strain AH109 cells. The cells were grown on SD/−Leu/−Trp medium. After 4 days, growing colonies were transferred to SD/−Ade/−His/−Leu/−Trp for further verification. Growing colonies on SD/−Ade/−His/−Leu/−Trp were transferred to SD/−Ade/−His/−Leu/−Trp with X-α-gal. Cell growth on SD/−Leu/−Trp and SD/−Ade/−His/−Leu/−Trp and blue colonies on SD/−Ade/−His/−Leu/−Trp with X-α-gal indicate protein–protein interactions between the two proteins.

4.10. Firefly Luciferase Complementation Imaging Assay (LCI)

CAM3 was cloned into the Cluc plasmid, and ACA8 was cloned into the Nluc plasmid, respectively. Additionally, the plasmids were transformed into Agrobacterium strain GV3101, respectively. Fluorescence from luciferase in Nicotiana tabacum leaves infected with pairs of Agrobacterium was imaged with a molecular imaging system (LB983, Berthold Technologies, Bad Wildbad, Germany). Each leaf was divided into four quadrants before injection with the following combinations: Cluc/Nluc, CAM3-Cluc/Nluc, Cluc/ACA8-Nluc, and CAM3-Cluc/ACA8-Nluc, respectively.

4.11. In Vitro Pulldown Assay

The genes encoding ACA8 (residues 1–180) were cloned into pGEX-4T-1, and the genes encoding CAM3 were cloned into pET28A. ACA8-GST and CAM3-HIS were transformed into E. coli Rosetta (DE3) cells for protein expression. Protein-GST was used as the bait protein. Glutathione beads containing 50 µg ACA8-GST or GST were incubated with 50 µg CAM3-HIS in pulldown buffer (1% NP40, 150 mM NaCl, 50 mM Tris–HCl, 1 mM EDTA, pH 7.5) at 4 °C for 2 h, respectively. The protein beads complexes were washed with pulldown buffer, then centrifuged 500× g for 5 min, the supernatant was removed, and the whole process was repeated 4 times; at last, the SDS sample buffer was boiled for 5–10 min. The bindings of CAM3-HIS with ACA8-GST were detected by immunoblot analysis using anti-GST and anti-HIS antibodies.

4.12. qRT-PCR

For quantitative RT-PCR, total RNA was extracted from the samples using an RNA extraction kit, and cDNA was generated using a reverse transcriptase kit (Takara). The expression levels of several important genes in the JA biosynthesis pathway were detected, including the following: LOX6 (forward primer sequence (5′–3′): GCTTGAAATCAATGCTCGTGCG; reverse primer sequence (5′–3′): GTCAATCACAAGCCTCACGCCAC), MYC2 (forward primer sequence (5′–3′): GATGAGGAGGTGACGGATACGGAA; reverse primer sequence (5′–3′): CGCTTTACCAGCTAATCCCGCA), JAZ4 (forward primer sequence (5′–3′): TCTCCGATAACTGTGAAGGA; reverse primer sequence (5′–3′): CTTGCTGACTGGAACCTG), JAZ8 (forward primer sequence (5′–3′): AATTGTGACTTGGAACTTCG; reverse primer sequence (5′–3′): TTGCCTGAAGATGGGTAAC); PDF1.2 (forward primer sequence (5′–3′): CCATCATCACCCTTATCTTCGC; reverse primer sequence (5′–3′): TGTCCCACTTGGCTTCTCG), THI2.1 (forward primer sequence (5′–3′): GTTCGTATACGTGAAGGGAGTA; reverse primer sequence (5′–3′): CACACACTACATATTATCGACT), VSP1 (forward primer sequence (5′–3′): CGTATCCGTCACCTCCTCAT; reverse primer sequence (5′–3′): CGCCAAAGGACTTGCCCTAA), VSP2 (forward primer sequence (5′–3′): GGCCTTGCATCTTTACCAAAAC; reverse primer sequence (5′–3′): GTAGTAGAGTGGATTTGGGAGC). ACTIN2 (forward primer sequence (5′–3′): AGTGGTCGTACAACCGGTATTGT; reverse primer sequence (5′–3′): GATGGCATGAGGAAGAGAGAAAC) and EF1α (forward primer sequence (5′–3′): TCCAGCTAAGGGTGCC; reverse primer sequence (5′–3′): GGTGGGTACTCGGAGA) were used as references [34,35,36,37,38]. qPCR was performed in a 7500 fast real-time PCR system (Applied Biosystems, Foster City, CA, USA) using a Power SYBR Green PCR Master Mix kit (Applied Biosystems, Foster City, CA, USA), and the 2−ΔΔCt method was used to calculate relative gene expression levels [39].

4.13. Statistical Analysis

Student’s t-test and Dunnett’s C (variance not neat) at the level of p < 0.05 was significant. Error bars denote ± standard error of mean (SEM).

4.14. Accession Numbers

The GenBank numbers and Genome Initiative numbers of all genes used in this article are as follows: RBOHD (GenBank NM_124165, AT5G47910), TPC1 (GenBank NM_116594, AT4G03560), CAM3 (GenBank NM_115539, AT3G56800), ACA8 (GenBank NM_001345242, AT5G57110), LOX6 (GenBank NM_105423, AT1G67560), MYC2 (GenBank NM_102998, At1G32640), JAZ4 (GenBank NM_001123978, AT1G48500), JAZ8 (GenBank NM_102753, AT1G30135), PDF1.2 (GenBank NM_123809, AT5G44420), THI2.1 (GenBank NM_105885, AT1G72260), VSP1 (GenBank NM_001125801, AT5G24780), VSP2 (GenBank NM_001036860, AT5G24770), ACTIN2 (GenBank NM_001338358, AT3G18780), EF1α (GenBank NM_001125992.1, AT5G60390).

5. Conclusions

In this study, we revealed the early signaling process induced by linalool. H2O2 burst mainly because of NADPH oxidase RBOHD, then calcium ions were released into the cytoplasm through intracellular calcium stores, and the excess calcium ions in the cytoplasm were pumped out through the interaction between CAM3 and ACA8. In addition, linalool may enhance insect resistance by activating the JA pathway in Arabidopsis plants, which requires further study.

Supplementary Materials

The following supporting information can be downloaded at: https://www.mdpi.com/article/10.3390/ijms23105357/s1.

Author Contributions

C.J. and Y.S. designed the research project; C.J., J.G. and Z.G. performed most of the experiments; S.L. and Y.Z. performed the Plutella xylostella growth experiments. C.J., J.G. and Z.G. contributed equally to this work. All authors have read and agreed to the published version of the manuscript.

Funding

This research was supported by the National Natural Science Foundation of China (31270655).

Institutional Review Board Statement

Not applicable.

Informed Consent Statement

Not applicable.

Data Availability Statement

The data that support the findings of this study are available from the corresponding author upon request.

Acknowledgments

This research was supported by the National Natural Science Foundation of China (31270655). We thank Meiqin Liu (Analysis and Testing Center, Beijing Forestry University) for her guidance on laser scanning confocal microscopy; Daoxin Xie (Tsinghua-Peking Joint Center for Life Sciences and MOE Key Laboratory of Bioinformatics, School of Life Sciences, Tsinghua University) for providing the Cluc and Nluc plasmids.

Conflicts of Interest

The authors declare no conflict of interest.

References

  1. Kiep, V.; Vadassery, J.; Lattke, J.; Maaß, J.; Boland, W.; Peiter, E.; Mithöfer, A. Systemic cytosolic Ca2+ elevation is activated upon wounding and herbivory in Arabidopsis. New Phytol. 2015, 207, 996–1004. [Google Scholar] [CrossRef] [PubMed]
  2. Ranf, S.; Eschen-Lippold, L.; Pecher, P.; Lee, J.; Scheel, D. Interplay between calcium signalling and early signalling elements during defence responses to microbe- or damage-associated molecular patterns. Plant J. 2011, 68, 100–113. [Google Scholar] [CrossRef] [PubMed]
  3. Kudla, J.; Batistic, O.; Hashimoto, K. Calcium Signals: The Lead Currency of Plant Information Processing. Plant Cell 2010, 22, 541–563. [Google Scholar] [CrossRef] [PubMed]
  4. Ozawa, R.; Bertea, C.M.; Foti, M.; Narayana, R.; Arimura, G.; Muroi, A.; Horiuchi, J.; Nishioka, T.; Maffei, M.E.; Takabayashi, J. Exogenous polyamines elicit herbivore-induced volatiles in lima bean leaves: Involvement of calcium, H2O2 and Jasmonic acid. Plant Cell Physiol. 2009, 50, 2183–2199. [Google Scholar] [CrossRef]
  5. Zebelo, S.A.; Maffei, M.E. Role of early signaling events in plant-insect interactions. J. Exp. Bot. 2015, 66, 435–448. [Google Scholar] [CrossRef] [Green Version]
  6. Gilroy, S.; Suzuki, N.; Miller, G.; Choi, W.; Toyota, M.; Devireddy, A.R.; Mittler, R. A tidal wave of signals: Calcium and ROS at the forefront of rapid systemic signaling. Trends Plant Sci. 2014, 19, 623–630. [Google Scholar] [CrossRef]
  7. McCormack, E.; Tsai, Y.; Braam, J. Handling calcium signaling: Arabidopsis CaMs and CMLs. Trends Plant Sci. 2005, 10, 383–389. [Google Scholar] [CrossRef]
  8. Zhou, S.; Jia, L.; Chu, H.; Wu, D.; Peng, X.; Liu, X.; Zhang, J.; Zhao, J.; Chen, K.; Zhao, L. Arabidopsis CaM1 and CaM4 Promote Nitric Oxide Production and Salt Resistance by Inhibiting S-Nitroso glutathione Reductase via Direct Binding. PLoS Genet. 2016, 12, e1006255. [Google Scholar] [CrossRef]
  9. Chu, M.; Li, J.; Zhang, J.; Shen, S.; Li, C.; Gao, Y.; Zhang, S. AtCaM4 interacts with a Sec14-like protein, PATL1, to regulate freezing tolerance in Arabidopsis in a CBF-independent manner. J. Exp. Bot. 2018, 69, 5241–5253. [Google Scholar] [CrossRef] [Green Version]
  10. Zhang, W.; Zhou, R.; Gao, Y.; Zheng, S.; Xu, P.; Zhang, S.; Sun, D. Molecular and genetic evidence for the key role of AtCaM3 in heat-shock signal transduction in Arabidopsis. Plant Physiol. 2009, 149, 1773. [Google Scholar] [CrossRef] [Green Version]
  11. Liu, H.; Sun, D.; Zhou, R. Ca2+ and AtCaM3 are involved in the expression of heat shock protein gene in Arabidopsis. Plant Cell Environ. 2005, 28, 1276–1284. [Google Scholar] [CrossRef]
  12. Tidow, H.; Poulsen, L.R.; Andreeva, A.; Knudsen, M.; Hein, K.L.; Wiuf, C.; Palmgren, M.G.; Nissen, P. A bimodular mechanism of calcium control in eukaryotes. Nature 2012, 491, 468–472. [Google Scholar] [CrossRef] [PubMed]
  13. Dudareva, N.; Klempien, A.; Muhlemann, J.K.; Kaplan, I. Biosynthesis, function and metabolic engineering of plant volatile organic compounds. New Phytol. 2013, 198, 16–32. [Google Scholar] [CrossRef] [PubMed]
  14. Heil, M. Herbivore-induced plant volatiles: Targets, perception and unanswered questions. New Phytol. 2014, 204, 297–306. [Google Scholar] [CrossRef]
  15. Piesik, D.; Wenda-Piesik, A.; Krasińska, A.; Wrzesińska, D.; Delaney, K.J. Volatile organic compounds released by Rumex confertus following Hypera rumicis herbivory and weevil responses to volatiles. J. Appl. Entomol. 2016, 140, 308–316. [Google Scholar] [CrossRef]
  16. Yang, T.; Stoopen, G.; Thoen, M.; Wiegers, G.; Jongsma, M.A. Chrysanthemum expressing a linalool synthase gene ‘smells good’, but ‘tastes bad’ to western flower thrips. Plant Biotechnol. J. 2013, 11, 875–882. [Google Scholar] [CrossRef]
  17. Taniguchi, S.; Hosokawa-Shinonaga, Y.; Tamaoki, D.; Yamada, S.; Akimitsu, K.; Gomi, K. Jasmonate induction of the monoterpene linalool confers resistance to rice bacterial blight and its biosynthesis is regulated by JAZ protein in rice. Plant Cell Environ. 2014, 37, 451–461. [Google Scholar] [CrossRef]
  18. Raguso, R.A. More lessons from linalool: Insights gained from a ubiquitous floral volatile. Curr. Opin. Plant Biol. 2016, 32, 31–36. [Google Scholar] [CrossRef] [Green Version]
  19. Ginglinger, J.; Boachon, B.; Höfer, R.; Paetz, C.; Köllner, T.G.; Miesch, L.; Lugan, R.; Baltenweck, R.; Mutterer, J.; Ullmann, P.; et al. Gene coexpression analysis reveals complex metabolism of the monoterpene alcohol linalool in Arabidopsis flowers. Plant Cell 2013, 25, 4640–4657. [Google Scholar] [CrossRef] [Green Version]
  20. Pragadheesh, V.S.; Chanotiya, C.S.; Rastogi, S.; Shasany, A.K. Scent from Jasminum grandiflorum flowers: Investigation of the change in linalool enantiomers at various developmental stages using chemical and molecular methods. Phytochemistry 2017, 140, 83–94. [Google Scholar] [CrossRef]
  21. Mei, X.; Liu, X.; Zhou, Y.; Wang, X.; Zeng, L.; Fu, X.; Li, J.; Tang, J.; Dong, F.; Yang, Z. Formation and emission of linalool in tea (Camellia sinensis) leaves infested by tea green leafhopper (Empoasca (Matsumurasca) onukii Matsuda). Food Chem. 2017, 237, 356–363. [Google Scholar] [CrossRef] [PubMed]
  22. Ye, L.; Yang, P.; Zeng, Y.; Li, C.; Jian, N.; Wang, R.; Huang, S.; Yang, R.; Wei, L.; Zhao, H.; et al. Rhizobium Symbiosis Modulates the Accumulation of Arsenic in Medicago truncatula via Nitrogen and NRT3.1-like Genes Regulated by ABA and Linalool. J. Hazard. Mater. 2021, 415, 125611. [Google Scholar] [CrossRef] [PubMed]
  23. Sharma, D.K.; Andersen, S.B.; Ottosen, C.; Rosenqvist, E. Wheat cultivars selected for high Fv/Fm under heat stress maintain high photosynthesis, total chlorophyll, stomatal conductance, transpiration and dry matter. Physiol. Plant. 2015, 153, 284–298. [Google Scholar] [CrossRef] [PubMed]
  24. Maffei, M.E.; Mithöfer, A.; Boland, W. Before gene expression: Early events in plant–insect interaction. Trends Plant Sci. 2007, 12, 310–316. [Google Scholar] [CrossRef]
  25. Yan, C.; Fan, M.; Yang, M.; Zhao, J.; Zhang, W.; Su, Y.; Xiao, L.; Deng, H.; Xie, D. Injury Activates Ca2+/Calmodulin-Dependent Phosphorylation of JAV1-JAZ8-WRKY51 Complex for Jasmonate Biosynthesis. Mol. Cell 2018, 70, 136–149.e7. [Google Scholar] [CrossRef] [PubMed] [Green Version]
  26. Chen, Y.; Cao, C.; Guo, Z.; Zhang, Q.; Li, S.; Zhang, X.; Gong, J.; Shen, Y. Herbivore exposure alters ion fluxes and improves salt tolerance in a desert shrub. Plant Cell Environ. 2020, 43, 400–419. [Google Scholar] [CrossRef]
  27. Asai, N.; Nishioka, T.; Takabayashi, J.; Furuichi, T. Plant volatiles regulate the activities of Ca2+-permeable channels and promote cytoplasmic calcium transients in Arabidopsis leaf cells. Plant Signal. Behav. 2009, 4, 294–300. [Google Scholar] [CrossRef] [Green Version]
  28. Guo, J.; Zeng, W.; Chen, Q.; Lee, C.; Chen, L.; Yang, Y.; Cang, C.; Ren, D.; Jiang, Y. Structure of the voltage-gated two-pore channel TPC1 from Arabidopsis thaliana. Nature 2016, 531, 196–201. [Google Scholar] [CrossRef] [Green Version]
  29. Pottosin, I.; Wherrett, T.; Shabala, S. SV channels dominate the vacuolar Ca2+ release during intracellular signaling. FEBS Lett. 2009, 583, 921–926. [Google Scholar] [CrossRef] [Green Version]
  30. Huda, K.M.K.; Banu, M.S.A.; Tuteja, B.; Tuteja, N. Global calcium transducer P-type Ca-ATPases open new avenues for agriculture by regulating stress signalling. J. Exp. Bot. 2013, 64, 3099–3109. [Google Scholar] [CrossRef]
  31. Loreto, F.; D’Auria, S. How do plants sense volatiles sent by other plants? Trends Plant Sci. 2022, 27, 29–38. [Google Scholar] [CrossRef] [PubMed]
  32. Scholz, S.S.; Vadassery, J.; Heyer, M.; Reichelt, M.; Bender, K.W.; Snedden, W.A.; Boland, W.; Mithöfer, A. Mutation of the Arabidopsis Calmodulin-Like Protein CML37 Deregulates the Jasmonate Pathway and Enhances Susceptibility to Herbivory. Mol. Plant 2014, 7, 1712–1726. [Google Scholar] [CrossRef] [PubMed] [Green Version]
  33. Vadassery, J.; Reichelt, M.; Hause, B.; Gershenzon, J.; Boland, W.; Mithöfer, A. CML42-Mediated Calcium Signaling Coordinates Responses to Spodoptera Herbivory and Abiotic Stresses in Arabidopsis. Plant Physiol. 2012, 159, 1159–1175. [Google Scholar] [CrossRef] [Green Version]
  34. Mustilli, A.; Merlot, S.; Vavasseur, A.; Fenzi, F.; Giraudat, J. Arabidopsis ost1 protein kinase mediates the regulation of stomatal aperture by abscisic acid and acts upstream of reactive oxygen species production. Plant Cell 2002, 14, 3089–3099. [Google Scholar] [CrossRef] [PubMed] [Green Version]
  35. Brown, R.L.; Kazan, K.; McGrath, K.C.; Maclean, D.J.; Manners, J.M. A role for the GCC-Box in jasmonate-mediated activation of the PDF1.2 gene of Arabidopsis. Plant Physiol. 2003, 132, 1020–1032. [Google Scholar] [CrossRef] [Green Version]
  36. Gutierrez, L.; Mauriat, M.; Guénin, S.; Pelloux, J.; Lefebvre, J.; Louvet, R.; Rusterucci, C.; Moritz, T.; Guerineau, F.; Bellini, C.; et al. The lack of a systematic validation of reference genes: A serious pitfall undervalued in reverse transcription-polymerase chain reaction (RT-PCR) analysis in plants. Plant Biotechnol. J. 2008, 6, 609–618. [Google Scholar] [CrossRef] [Green Version]
  37. Yan, S.; Luo, S.; Dong, S.; Zhang, T.; Sun, J.; Wang, N.; Yao, H.; Shen, Y. Heterotrimeric G-proteins involved in the MeJA regulated ion flux and stomatal closure in Arabidopsis thaliana. Funct. Plant Biol. 2015, 42, 126. [Google Scholar] [CrossRef]
  38. Yan, S.; Jiao, C.; McLamore, E.S.; Wang, N.; Yao, H.; Shen, Y. Insect Herbivory of Leaves Affects the Auxin Flux along Root Apices in Arabidopsis thaliana. J. Plant Growth Regul. 2017, 36, 846–854. [Google Scholar] [CrossRef]
  39. Livak, K.J.; Schmittgen, T. Analysis of relative gene expression data using real-time quantitative PCR and the 2−ΔΔCt method. Methods 2001, 25, 402–408. [Google Scholar] [CrossRef]
Figure 1. Arabidopsis plants show a linalool-induced plant defense against P. xylostella. (a) The maximal photochemical efficiency of Fv/Fm in different linalool treated groups. In the 0 μM control group, Arabidopsis plants were treated with ethyl alcohol. Additionally, in 10 μM, 20 μM, and 50 μM linalool groups, Arabidopsis plants were treated with linalool corresponding to the final concentrations. Error bars denote ± SEM, n = 6~8, p < 0.05, Dunnett’s C (variance not neat). (b) The ratio of fresh weight to dry weight. In the WT control group, Arabidopsis plants were treated with ethyl alcohol, and in the WT linalool group, Arabidopsis plants were treated with linalool at 20 μM final concentration. Error bars denote ± SEM (standard error of mean), n = 6~8, p < 0.05, Student’s t-test. (c,d) Larval body length and weight gain were measured 7 days after inoculation. Every pot had 3 Arabidopsis plants, 3 larvae were put in each plant, and each group (WT control and WT + linalool) contained approximately 25–40 larvae. Error bars denote ± SEM, n ≥ 25, and columns labeled with different letters are significantly different at p < 0.05, Student’s t-test. (e) Larvae phenotypes of the WT control (left) and WT + linalool (right). (f) Conditions of plants after 7 days of larval feeding. The plants were grown for 4 weeks (10 leaves). The scale bar represents 1 cm.
Ijms 23 05357 g001
Figure 2. Linalool-induced increases in H2O2 levels depend on RBOHD but not on internal Ca2+ release channels in Arabidopsis mesophyll cells. (a) The cells were washed to remove 50 μM H2DCF-DA test solution (0 min), then linalool was added, and the cells were photographed every 3 min. The scale bar represents 50 μm. (b) Analysis of changes in H2O2 fluorescence indicated that increases in H2O2 fluorescence were significantly suppressed in DPI-treated and rbohd cells compared to the WT + linalool-treated group but were unaffected in ruthenium-red-treated and tpc1 cells. The plants were grown for 2 weeks. Error bars denote ± SEM, n ≥ 20, and means labeled with different letters are significantly different at p < 0.05, Dunnett’s C (variance not neat).
Ijms 23 05357 g002
Figure 3. Linalool-induced increases in intracellular calcium levels depend on RBOHD and internal Ca2+ release channels in Arabidopsis mesophyll cells (a) The cells were washed to remove the 10 μM Fluo3-AM test solution (0 min), linalool was added, and the cells were photographed every 30 s. The scale bar represents 50 μm. (b) Linalool-induced increases in Ca2+ fluorescence were significantly suppressed in ruthenium-red-treated WT, tpc1, DPI-treated WT, and rbohd cells compared to linalool-treated WT control cells. The plants were grown for 2 weeks. Error bars denote ± SEM, n ≥ 20, and means labeled with different letters are significantly different at p < 0.05, Dunnett’s C (variance not neat).
Ijms 23 05357 g003
Figure 4. Calcium channel activity (related to changes in intracellular calcium levels) is induced by linalool treatment in Arabidopsis mesophyll cells. (ad) Linalool treatment increases Ca2+ efflux. Ca2+ efflux was significantly suppressed in WT cells pretreated with ruthenium red and in tpc1, DPI-pretreated WT, rbohd, Eosin B-pretreated WT, and cam3 cells. (e) A comparison of the peaks in mean Ca2+ efflux among groups shows that Ca2+ efflux was significantly suppressed in all groups compared to the linalool-treated WT control. The plants were grown for 2 weeks. Error bars denote ± SEM, n ≥ 6, and columns labeled with different letters are significantly different at p < 0.05, Dunnett’s C (variance not neat).
Ijms 23 05357 g004
Figure 5. CAM3 interacts with ACA8. (ac) Y2H, in vitro pulldown, and LCI assays show that CAM3 interacts with ACA8. (a,b) In the Y2H and in vitro pulldown assays, because ACA8 is a membrane protein, the N-terminus (residues 1–180), an intracellular domain, was used to interact with CAM3. (c) N. benthamiana leaves were divided into four parts: the bottom right part was an experimental group, and the others were control groups. Red represents the maximum fluorescence intensity.
Ijms 23 05357 g005
Figure 6. JA-related gene and defense gene expression induced by linalool. (ad) JA-related gene expression in two-week-old Arabidopsis leaves after linalool treatment. The treated times were 5 min, 0.5 h, and 2 h. (eh) Defense gene expression in two-week-old Arabidopsis leaves after linalool treatment. The treated times were 0.5 h, 2 h, and 8 h. Each group has three replicates. Every replicate includes dozens of seedlings (n ≥ 30), and error bars represent standard error; columns labeled with different letters are significantly different at p < 0.05, Dunnett’s C (variance not neat).
Ijms 23 05357 g006
Publisher’s Note: MDPI stays neutral with regard to jurisdictional claims in published maps and institutional affiliations.

