
A Weed-Derived Hierarchical Porous Carbon with a Large Specific Surface Area for Efficient Dye and Antibiotic Removal

 ,
,
Abstract
:1. Introduction
2. Results and Discussion
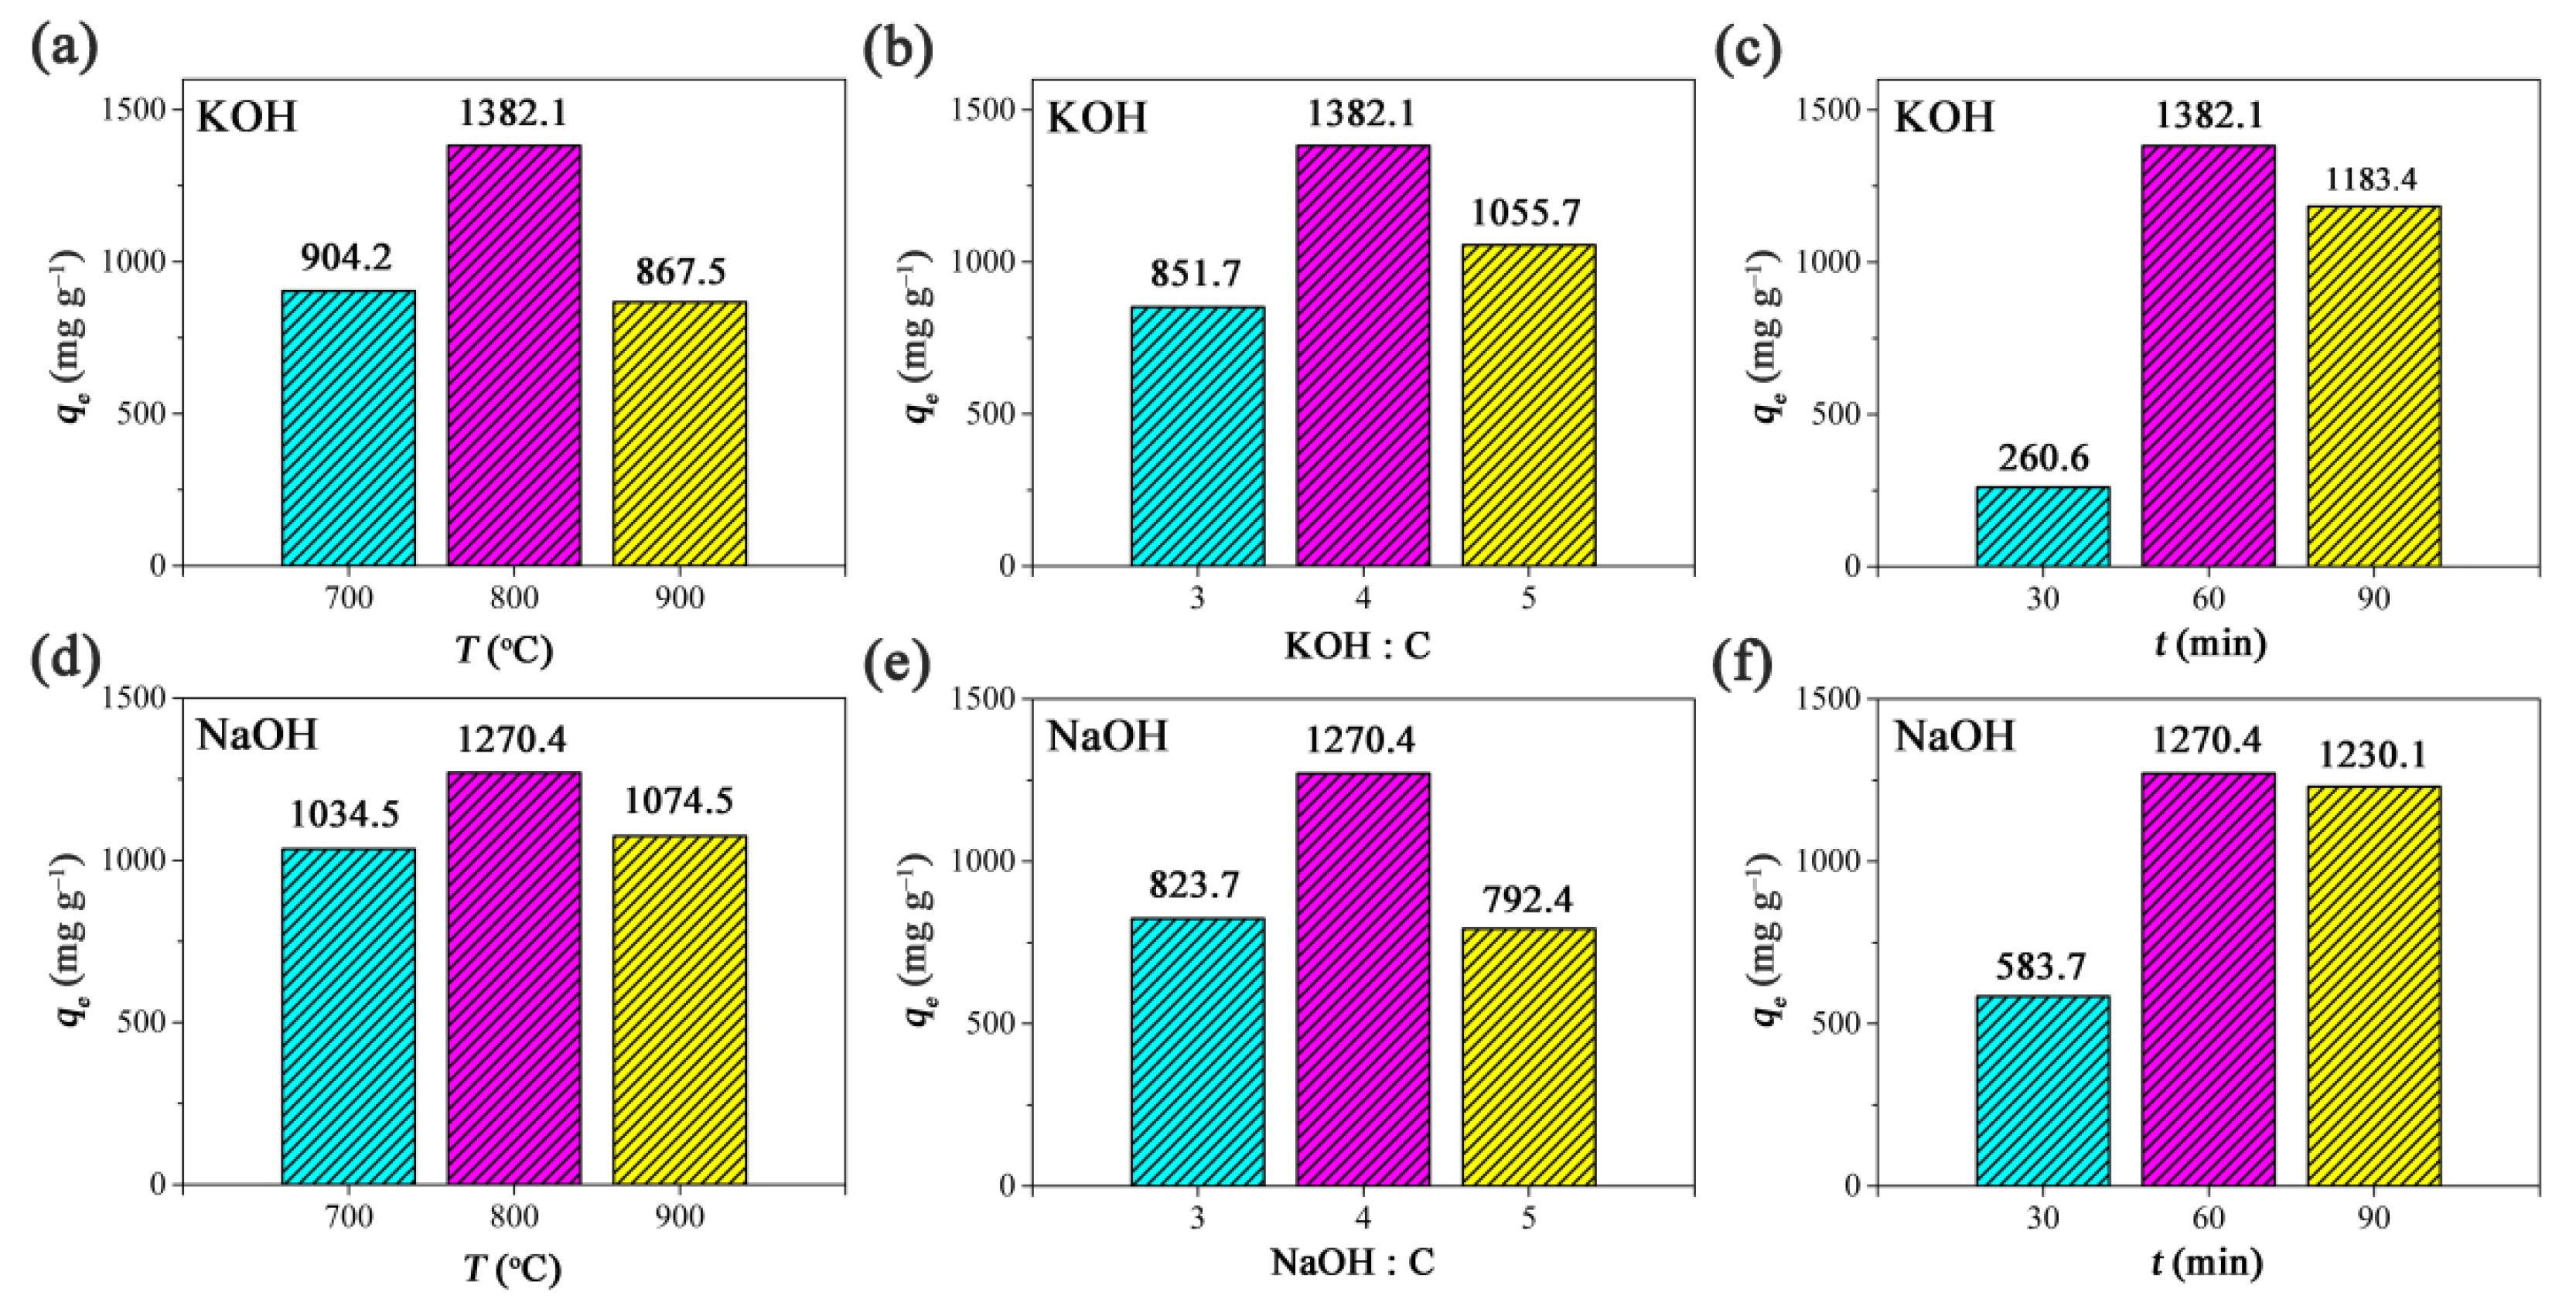
2.1. Preparation of Porous Carbon
2.2. Characterization of Adsorbent
2.3. Batch Adsorption Experiments
2.3.1. Adsorption Kinetics
2.3.2. Adsorption Isotherms
2.3.3. Adsorption Thermodynamics
2.3.4. Adsorption Mechanism
2.3.5. Effect of Ionic Strength
2.3.6. Reusability
2.4. Fixed-Bed Adsorption Column Study
3. Materials and Methods
3.1. Materials
3.2. Preparation of Porous Carbon
3.3. Characterization
3.4. Batch Adsorption Experiments
3.5. Adsorption Kinetic Experiments
3.6. Adsorption Isotherm Experiments
3.7. Adsorption Thermodynamic Experiments
3.8. Reusability Studies
3.9. The Point of Zero Charge (PZC) of PCAC
3.10. Fixed-Bed Adsorption Column Study
3.11. Error Analysis
4. Conclusions
Supplementary Materials
Author Contributions
Funding
Institutional Review Board Statement
Informed Consent Statement
Data Availability Statement
Conflicts of Interest
References
- De Leo, V.; Maurelli, A.M.; Ingrosso, C.; Lupone, F.; Catucci, L. Easy preparation of liposome@PDA microspheres for fast and highly efficient removal of methylene blue from water. Int. J. Mol. Sci. 2021, 22, 11916. [Google Scholar] [CrossRef] [PubMed]
- Zdarta, J.; Degórska, O.; Jankowska, K.; Rybarczyk, A.; Piasecki, A.; Ciesielczyk, F.; Jesionowski, T. Removal of persistent sulfamethoxazole and carbamazepine from water by horseradish peroxidase encapsulated into poly(vinyl chloride) electrospun fibers. Int. J. Mol. Sci. 2022, 23, 272. [Google Scholar] [CrossRef] [PubMed]
- Ji, Y.; Zhang, X.; Chen, Z.; Xiao, Y.; Li, S.; Gu, J.; Hu, H.; Cheng, G. Silk sericin enrichment through electrodeposition and carbonous materials for the removal of methylene blue from aqueous solution. Int. J. Mol. Sci. 2022, 23, 1668. [Google Scholar] [CrossRef] [PubMed]
- Bhat, S.A.; Sher, F.; Hameed, M.; Bashir, O.; Kumar, R.; Vo, D.V.N.; Ahmad, P.; Lima, E.C. Sustainable nanotechnology based wastewater treatment strategies: Achievements, challenges and future perspectives. Chemosphere 2022, 288, 132606. [Google Scholar] [CrossRef] [PubMed]
- Ahmad, A.; Banat, F.; Alsafar, H.; Hasan, S.W. Algae Biotechnology for industrial wastewater treatment, bioenergy production, and high-value bioproducts. Sci. Total Environ. 2022, 806, 150585. [Google Scholar] [CrossRef] [PubMed]
- Liu, T.; Zhou, Z.; Zhang, L.; Zhang, W.; Yang, W. Novel electrochemical sensor based on molecularly imprinted polymers with MWCNTs-SiO2 for selective and sensitive detecting 2,4-D. J. Inorg. Organomet. Polym. Mater. 2022, 32, 572–582. [Google Scholar] [CrossRef]
- Huang, W.; Si, H.; Qing, Y.; Zhang, L.; Zhang, W.; Song, F.; Ni, X.; Yang, W. A magnetic, core–shell structured, pH-responsive molecularly imprinted polymers for the selective detection of sulfamethoxazole. J. Inorg. Organomet. Polym. Mater. 2021, 31, 2054–2062. [Google Scholar] [CrossRef]
- Wang, Y.; Zhou, Z.; Xu, W.; Luan, Y.; Lu, Y.; Yang, Y.; Liu, T.; Li, S.; Yang, W. Surface molecularly imprinted polymers based ZnO quantum dots as fluorescence sensors for detection of diethylhexyl phthalate with high sensitivity and selectivity. Polym. Int. 2018, 67, 1003–1010. [Google Scholar] [CrossRef]
- Xu, W.; Zhang, X.; Huang, W.; Luan, Y.; Yang, Y.; Zhu, M.; Yang, W. Synthesis of surface molecular imprinted polymers based on carboxyl-modified silica nanoparticles with the selective detection of dibutyl phthalate from tap water samples. Appl. Surf. Sci. 2017, 426, 1075–1083. [Google Scholar] [CrossRef]
- Nawaz, A.; ul Haq, I.; Qaisar, K.; Gunes, B.; Raja, S.I.; Mohyuddin, K.; Amin, H. Microbial fuel cells: Insight into simultaneous wastewater treatment and bioelectricity generation. Process Saf. Environ. 2022, 161, 357–373. [Google Scholar] [CrossRef]
- Ziembowicz, S.; Kida, M. Limitations and future directions of application of the fenton-like process in micropollutants degradation in water and wastewater treatment: A critical review. Chemosphere 2022, 296, 134041. [Google Scholar] [CrossRef] [PubMed]
- Moreno, M.; Mazur, L.P.; Weschenfelder, S.E.; Regis, R.J.; de Souza, R.A.F.; Marinho, B.A.; da Silva, A.; de Souza, S.M.A.G.U.; de Souza, A.A.U. Water and wastewater treatment by micellar enhanced ultrafiltration—A critical review. J. Water Process Eng. 2022, 46, 102574. [Google Scholar] [CrossRef]
- Mahmoodi, N.M.; Taghizadeh, A.; Taghizadeh, M.; Azimi, M. Surface modified montmorillonite with cationic surfactants: Preparation, characterization, and dye adsorption from aqueous solution. J. Environ. Chem. Eng. 2019, 7, 103243. [Google Scholar] [CrossRef]
- Mahmoodi, N.M.; Taghizadeh, M.; Taghizadeh, A. Mesoporous activated carbons of low-cost agricultural bio-wastes with high adsorption capacity: Preparation and artificial neural network modeling of dye removal from single and multicomponent (binary and ternary) systems. J. Mol. Liq. 2018, 269, 217–228. [Google Scholar] [CrossRef]
- Chen, S.; Chen, G.; Chen, H.; Sun, Y.; Yu, X.; Su, Y.; Tan, S. Preparation of porous carbon-based material from corn straw via mixed alkali and its application for removal of dye. Colloids Surf. A 2019, 568, 173–183. [Google Scholar] [CrossRef]
- Jiang, N.; Shang, R.; Heijman, S.G.J.; Rietveld, L.C. High-silica zeolites for adsorption of organic micro-pollutants in water treatment: A review. Water Res. 2018, 144, 145–161. [Google Scholar] [CrossRef] [PubMed]
- Panahdar, A.; Langari, S.; Mahmoodi, N.M.; Ghiyasi, S.; Saeb, M.R.; Seifpanahi-Shabani, K.; Jalili, M. Zeolitic imidazole framework (ZIF)—Zinc oxide nanocomposite: Synthesis and ultrasound-assisted pollutant removal from the binary system. Desalin. Water Treat. 2021, 210, 240–249. [Google Scholar] [CrossRef]
- Bagheri, A.; Hoseinzadeh, H.; Hayati, B.; Mahmoodi, N.M.; Mehraeen, E. Post-synthetic functionalization of the metal-organic framework: Clean synthesis, pollutant removal, and antibacterial activity. J. Environ. Chem. Eng. 2021, 9, 104590. [Google Scholar] [CrossRef]
- Yazdi, M.K.; Vatanpour, V.; Taghizadeh, A.; Taghizadeh, M.; Ganjali, M.R.; Munir, M.T.; Habibzadeh, S.; Saeb, M.R.; Ghaedi, M. Hydrogel Membranes: A Review. Mat. Sci. Eng. C-Mater. 2020, 114, 111023. [Google Scholar] [CrossRef] [PubMed]
- Abu-Nada, A.; Abdala, A.; McKay, G. Removal of phenols and dyes from aqueous solutions using graphene and graphene composite adsorption: A review. J. Environ. Chem. Eng. 2021, 9, 105858. [Google Scholar] [CrossRef]
- Hoseinzadeh, H.; Hayati, B.; Shahmoradi Ghaheh, F.; Seifpanahi-Shabani, K.; Mahmoodi, N.M. Development of room temperature synthesized and functionalized metal-organic framework/graphene oxide composite and pollutant adsorption ability. Mater. Res. Bull. 2021, 142, 111408. [Google Scholar] [CrossRef]
- Shahmoradi Ghaheh, F.; Taghizadeh, M.; Taghizadeh, A.; Hayati, B.; Mahmoodi, N.M.; Parastar, S. Clean synthesis of rock candy-like metal–organic framework biocomposite for toxic contaminants remediation. Environ. Technol. Innov. 2021, 23, 101747. [Google Scholar] [CrossRef]
- Mahmoodi, N.M.; Taghizadeh, M.; Taghizadeh, A. Activated carbon/metal-organic framework composite as a bio-based novel green adsorbent: Preparation and mathematical pollutant removal modeling. J. Mol. Liq. 2019, 277, 310–322. [Google Scholar] [CrossRef]
- Mahmoodi, N.M.; Taghizadeh, M.; Taghizadeh, A.; Abdi, J.; Hayati, B.; Shekarchi, A.A. Bio-based magnetic metal-organic framework nanocomposite: Ultrasound-assisted synthesis and pollutant (heavy metal and dye) removal from aqueous media. Appl. Surf. Sci. 2019, 480, 288–299. [Google Scholar] [CrossRef]
- Li, Y.; Xing, B.; Ding, Y.; Han, X.; Wang, S. A critical review of the production and advanced utilization of biochar via selective pyrolysis of lignocellulosic biomass. Bioresour. Technol. 2020, 312, 123614. [Google Scholar] [CrossRef]
- Wang, Z.; Shen, D.; Wu, C.; Gu, S. State-of-the-art on the production and application of carbon nanomaterials from biomass. Green Chem. 2018, 20, 5031–5057. [Google Scholar] [CrossRef] [Green Version]
- Chen, S.; Wang, Z.; Xia, Y.; Zhang, B.; Chen, H.; Chen, G.; Tang, S. Porous carbon material derived from fungal hyphae and its application for the removal of dye. RSC Adv. 2019, 9, 25480–25487. [Google Scholar] [CrossRef] [Green Version]
- Zhang, B.; Jin, Y.; Qi, J.; Chen, H.; Chen, G.; Tang, S. Porous carbon materials based on Physalis alkekengi L. husk and its application for removal of malachite green. Environ. Technol. Innov. 2021, 21, 101343. [Google Scholar] [CrossRef]
- Dhyani, V.; Bhaskar, T. A comprehensive review on the pyrolysis of lignocellulosic biomass. Renew. Energy 2018, 129, 695–716. [Google Scholar] [CrossRef]
- Zhao, H.; Zhong, H.; Jiang, Y.; Li, H.; Tang, P.; Li, D.; Feng, Y. Porous ZnCl2-activated carbon from shaddock peel: Methylene blue adsorption behavior. Materials 2022, 15, 895. [Google Scholar] [CrossRef]
- Yorgun, S.; Vural, N.; Demiral, H. Preparation of high-surface area activated carbons from paulownia wood by ZnCl2 activation. Micropor. Mesopor. Mat. 2009, 122, 189–194. [Google Scholar] [CrossRef]
- Wang, J.; Kaskel, S. KOH Activation of carbon-based materials for energy storage. J. Mater. Chem. 2012, 22, 23710–23725. [Google Scholar] [CrossRef]
- Martins, A.C.; Pezoti, O.; Cazetta, A.L.; Bedin, K.C.; Yamazaki, D.A.S.; Bandoch, G.F.G.; Asefa, T.; Visentainer, J.V.; Almeida, V.C. Removal of tetracycline by NaOH-activated carbon produced from macadamia nut shells: Kinetic and equilibrium studies. Chem. Eng. J. 2015, 260, 291–299. [Google Scholar] [CrossRef]
- Chen, S.; Xia, Y.; Zhang, B.; Chen, H.; Chen, G.; Tang, S. Disassembly of lignocellulose into cellulose, hemicellulose, and lignin for preparation of porous carbon materials with enhanced performances. J. Hazard. Mater. 2021, 408, 124956. [Google Scholar] [CrossRef] [PubMed]
- Wang, Z.; Zhou, Q.; Chen, S.; Liang, D.; Tang, S.; Chen, H.; Chen, G.; Xia, Y.; Zhang, B. Preparation of a quinoa straw-derived porous carbon material and a fe3o4-contained composite material for removal of rhodamine b from water. Mater. Res. Express 2020, 7, 125603. [Google Scholar] [CrossRef]
- Loddo, D.; Bozic, D.; Calha, I.M.; Dorado, J.; Izquierdo, J.; Scepanovic, M.; Baric, K.; Carlesi, S.; Leskovsek, R.; Peterson, D.; et al. Variability in Seedling Emergence for European and North American Populations of Abutilon Theophrasti. Weed Res. 2019, 59, 15–27. [Google Scholar] [CrossRef] [Green Version]
- Cortes, J.A.; Mendiola, M.A.; Castejon, M. Competition of Velvetleaf (Abutilon theophrasti M.) Weed with Cotton (Gossypium hirsutum L.). Economic Damage Threshold. Span. J. Agric. Res. 2010, 8, 391–399. [Google Scholar] [CrossRef] [Green Version]
- Ma, X.; Yang, J.; Wu, H.; Jiang, W.; Ma, Y.; Ma, Y. Growth Analysis of Cotton in Competition with Velvetleaf (Abutilon theophrasti). Weed Technol. 2016, 30, 123–136. [Google Scholar] [CrossRef]
- Hartzler, R.; Battles, B. Reduced Fitness of Velvetleaf (Abutilon theophrasti) Surviving Glyphosate. Weed Technol. 2001, 15, 492–496. [Google Scholar] [CrossRef]
- Su, C.; Guo, Y.; Chen, H.; Zou, J.; Zeng, Z.; Li, L. VOCs adsorption of resin-based activated carbon and bamboo char: Porous characterization and nitrogen-doped effect. Colloids Surf. A 2020, 601, 124983. [Google Scholar] [CrossRef]
- Tran, T.H.; Le, A.H.; Pham, T.H.; Nguyen, D.T.; Chang, S.W.; Chung, W.J.; Nguyen, D.D. Adsorption isotherms and kinetic modeling of methylene blue dye onto a carbonaceous hydrochar adsorbent derived from coffee husk waste. Sci. Total Environ. 2020, 725, 10. [Google Scholar] [CrossRef]
- Vu, M.T.; Chao, H.P.; Trinh, T.V.; Le, T.T.; Lin, C.C.; Tran, H.N. Removal of ammonium from groundwater using naoh-treated activated carbon derived from corncob wastes: Batch and column experiments. J. Clean. Prod. 2018, 180, 560–570. [Google Scholar] [CrossRef]
- Ma, C.; Min, J.; Gong, J.; Liu, X.; Mu, X.; Chen, X.; Tang, T. Transforming polystyrene waste into 3d hierarchically porous carbon for high-performance supercapacitors. Chemosphere 2020, 253, 126755. [Google Scholar] [CrossRef] [PubMed]
- Ling, L.L.; Liu, W.J.; Zhang, S.; Jiang, H. Magnesium oxide embedded nitrogen self-doped biochar composites: Fast and high-efficiency adsorption of heavy metals in an aqueous solution. Environ. Sci. Technol. 2017, 51, 10081–10089. [Google Scholar] [CrossRef]
- Geng, J.; Chang, J. Synthesis of magnetic Forsythia suspensa leaf powders for removal of metal ions and dyes from wastewater. J. Environ. Chem. Eng. 2020, 8, 104224. [Google Scholar] [CrossRef]
- Cheng, Z.-L.; Li, Y.; Liu, Z. Fabrication of graphene oxide/silicalite-1 composites with hierarchical porous structure and investigation on their adsorption performance for rhodamine B. J. Ind. Eng. Chem. 2017, 55, 234–243. [Google Scholar] [CrossRef]
- Liu, K.; Li, H.; Wang, Y.; Gou, X.; Duan, Y. Adsorption and removal of rhodamine b from aqueous solution by tannic acid functionalized graphene. Colloids Surf. A 2015, 477, 35–41. [Google Scholar] [CrossRef]
- Hayeeye, F.; Sattar, M.; Chinpa, W.; Sirichote, O. Kinetics and thermodynamics of rhodamine b adsorption by gelatin/activated carbon composite beads. Colloids Surf. A 2017, 513, 259–266. [Google Scholar] [CrossRef]
- Gad, H.M.H.; El-Sayed, A.A. Activated Carbon from Agricultural by-products for the removal of rhodamine-b from aqueous solution. J. Hazard. Mater. 2009, 168, 1070–1081. [Google Scholar] [CrossRef]
- Ding, L.; Zou, B.; Gao, W.; Liu, Q.; Wang, Z.; Guo, Y.; Wang, X.; Liu, Y. Adsorption of rhodamine-B from aqueous solution using treated rice husk-based activated carbon. Colloids Surface A 2014, 446, 1–7. [Google Scholar] [CrossRef]
- Junyong, C.; Yongmei, H.; Yan, L.; Jiajia, G. Magnetic graphene oxides as highly effective adsorbents for rapid removal of a cationic dye rhodamine b from aqueous solutions. RSC Adv. 2013, 3, 7254–7258. [Google Scholar] [CrossRef]
- Li, A.; Huang, W.; Qiu, N.; Mou, F.; Wang, F. Porous carbon prepared from lotus leaves as potential adsorbent for efficient removal of rhodamine B. Mater. Res. Express 2020, 7, 055505. [Google Scholar] [CrossRef]
- Zhao, X.; Zhao, H.; Dai, W.; Wei, Y.; Wang, Y.; Zhang, Y.; Zhi, L.; Huang, H.; Gao, Z. A metal-organic framework with large 1-d channels and rich -oh sites for high-efficiency chloramphenicol removal from water. J. Colloid Interface Sci. 2018, 526, 28–34. [Google Scholar] [CrossRef] [PubMed]
- Yao, Q.; Fan, B.; Xiong, Y.; Jin, C.; Sun, Q.; Sheng, C. 3D assembly based on 2d structure of cellulose nanofibril/graphene oxide hybrid aerogel for adsorptive removal of antibiotics in water. Sci. Rep. 2017, 7, 45914. [Google Scholar] [CrossRef] [Green Version]
- Yang, J.; Ji, G.; Gao, Y.; Fu, W.; Irfan, M.; Mu, L.; Zhang, Y.; Li, A. High-yield and high-performance porous biochar produced from pyrolysis of peanut shell with low-dose ammonium polyphosphate for chloramphenicol adsorption. J. Clean. Prod. 2020, 264, 121516. [Google Scholar] [CrossRef]
- Dai, J.; Tian, S.; Jiang, Y.; Chang, Z.; Xie, A.; Zhang, R.; Yan, Y. Facile synthesis of porous carbon sheets from potassium acetate via in-situ template and self-activation for highly efficient chloramphenicol removal. J. Alloys Compd. 2018, 732, 222–232. [Google Scholar] [CrossRef]
- Qin, L.; Zhou, Z.; Dai, J.; Ma, P.; Zhao, H.; He, J.; Xie, A.; Li, C.; Yan, Y. Novel n-doped hierarchically porous carbons derived from sustainable shrimp shell for high-performance removal of sulfamethazine and chloramphenicol. J. Taiwan Inst. Chem. Eng. 2016, 62, 228–238. [Google Scholar] [CrossRef]
- Liu, H.; Wei, Y.; Luo, J.; Li, T.; Wang, D.; Luo, S.; Crittenden, J.C. 3D hierarchical porous-structured biochar aerogel for rapid and efficient phenicol antibiotics removal from water. Chem. Eng. J. 2019, 368, 639–648. [Google Scholar] [CrossRef]
- Zhu, X.; Gao, Y.; Yue, Q.; Song, Y.; Gao, B.; Xu, X. Facile synthesis of hierarchical porous carbon material by potassium tartrate activation for chloramphenicol removal. J. Taiwan Inst. Chem. Eng. 2018, 85, 141–148. [Google Scholar] [CrossRef]
- Dai, J.; Qin, L.; Zhang, R.; Xie, A.; Chang, Z.; Tian, S.; Li, C.; Yan, Y. Sustainable bovine bone-derived hierarchically porous carbons with excellent adsorption of antibiotics: Equilibrium, kinetic and thermodynamic investigation. Powder Technol. 2018, 331, 162–170. [Google Scholar] [CrossRef]
- Anastopoulos, I.; Kyzas, G.Z. Are the thermodynamic parameters correctly estimated in liquid-phase adsorption phenomena? J. Mol. Liq. 2016, 218, 174–185. [Google Scholar] [CrossRef]
- Barkakati, P.; Begum, A.; Das, M.L.; Rao, P.G. Adsorptive separation of ginsenoside from aqueous solution by polymeric resins: Equilibrium, kinetic and thermodynamic studies. Chem. Eng. J. 2010, 161, 34–45. [Google Scholar] [CrossRef]
- Zhao, Y.; Zhang, R.; Liu, H.; Li, M.; Chen, T.; Chen, D.; Zou, X.; Frost, R.L. Green preparation of magnetic biochar for the effective accumulation of Pb(II): Performance and mechanism. Chem. Eng. J. 2019, 375, 122011. [Google Scholar] [CrossRef]
- Huang, Y.; Zheng, X.; Feng, S.; Guo, Z.; Liang, S. Enhancement of rhodamine B removal by modifying activated carbon developed from Lythrum Salicaria L. with pyruvic acid. Colloids Surface A 2016, 489, 154–162. [Google Scholar] [CrossRef]
- Rao, W.; Piliouras, P.; Wang, X.; Guido, A.; Kugler, K.; Sieren, B.; Wang, L.; Lv, G.; Li, Z. Zwitterionic dye rhodamine B (RhB) uptake on different types of clay minerals. Appl. Clay Sci. 2020, 197, 105790. [Google Scholar] [CrossRef]
- Yang, C.; Wu, S.; Cheng, J.; Chen, Y. Indium-based metal-organic framework/graphite oxide composite as an efficient adsorbent in the adsorption of rhodamine B from aqueous solution. J. Alloys Compd. 2016, 687, 804–812. [Google Scholar] [CrossRef]
- Ganesan, V.; Louis, C.; Damodaran, S.P. Graphene oxide-wrapped magnetite nanoclusters: A recyclable functional hybrid for fast and highly efficient removal of organic dyes from wastewater. J. Environ. Chem. Eng. 2018, 6, 2176–2190. [Google Scholar] [CrossRef]
- Penafiel, M.E.; Matesanz, J.M.; Vanegas, E.; Bermejo, D.; Mosteo, R.; Ormad, M.P. Comparative adsorption of ciprofloxacin on sugarcane bagasse from Ecuador and on commercial powdered activated carbon. Sci. Total Environ. 2021, 750, 141498. [Google Scholar] [CrossRef]
- Chu, K.H. Breakthrough curve analysis by simplistic models of fixed bed adsorption: In defense of the century-old bohart-adams model. Chem. Eng. J. 2020, 380, 122513. [Google Scholar] [CrossRef]
- Benjelloun, M.; Miyah, Y.; Akdemir Evrendilek, G.; Zerrouq, F.; Lairini, S. Recent advances in adsorption kinetic models: Their application to dye types. Arab. J. Chem. 2021, 14, 103031. [Google Scholar] [CrossRef]
- Mozaffari Majd, M.; Kordzadeh-Kermani, V.; Ghalandari, V.; Askari, A.; Sillanpää, M. Adsorption isotherm models: A comprehensive and systematic review (2010−2020). Sci. Total Environ. 2022, 812, 151334. [Google Scholar] [CrossRef] [PubMed]
- Elmi, F.; Damghani, F.M.; Taleshi, M.S. Kinetic and isotherm studies of adsorption of the metribuzin herbicide on an Fe3O4/CNT@PDA hybrid magnetic nanocomposite in wastewater. Ind. Eng. Chem. Res. 2020, 59, 9604–9610. [Google Scholar] [CrossRef]
- Taoufik, N.; Elmchaouri, A.; Anouar, F.; Korili, S.A.; Gil, A. Improvement of the adsorption properties of an activated carbon coated by titanium dioxide for the removal of emerging contaminants. J. Water Process Eng. 2019, 31, 100876. [Google Scholar] [CrossRef]
- Jaria, G.; Calisto, V.; Silva, C.P.; Victoria Gil, M.; Otero, M.; Esteves, V.I. Fixed-bed performance of a waste-derived granular activated carbon for the removal of micropollutants from municipal wastewater. Sci. Total Environ. 2019, 683, 699–708. [Google Scholar] [CrossRef] [PubMed]
- Yin, C.Y.; Aroua, M.K.; Daud, W.M.A.W. Fixed-Bed Adsorption of metal ions from aqueous solution on polyethyleneimine-impregnated palm shell activated carbon. Chem. Eng. J. 2009, 148, 8–14. [Google Scholar] [CrossRef] [Green Version]


| Isotherm Models | Parameters | Adsorbates | |
|---|---|---|---|
| RhB | CAP | ||
| Langmuir | qm (mg g−1) | 1378.8 | 1397.0 |
| KL (L mg−1) | 0.16 | 0.06 | |
| R2 | 0.9272 | 0.9988 | |
| SSE | 3232.34 | 58.80 | |
| Freundlich | KF (mg g−1 (L mg−1)1/n) | 674.20 | 498.00 |
| nF | 7.76 | 5.76 | |
| R2 | 0.9855 | 0.8705 | |
| SSE | 1924.38 | 6773.32 | |
| Sips | qm (mg g−1) | 1883.3 | 1375.3 |
| Ks | 0.07 | 0.06 | |
| ns | 0.35 | 1.09 | |
| R2 | 0.9998 | 0.9998 | |
| SSE | 9.00 | 10.22 | |
| Redlich-Peterson | KRP (L g−1) | 605.90 | 74.27 |
| bRP (L mg−1)−1/α | 0.72 | 0.05 | |
| α | 0.91 | 1.02 | |
| R2 | 0.9992 | 0.9995 | |
| SSE | 32.55 | 22.26 | |
| Adsorbents | Adsorption Capacities (mg g−1) | Refs. |
|---|---|---|
| Magnetic Forsythia suspensa leaf powders | 34.014 | [45] |
| graphene oxide/silicalite-1 composites | 56.55 | [46] |
| Tannic acid functionalized graphene | 201 | [47] |
| Gelatin/activated carbon composite | 256.41 | [48] |
| Activated carbon derived from bagasse pith | 263.85 | [49] |
| Rice husk-based activated carbon | 518.1 | [50] |
| Fe3O4 magnetic nanoparticles-graphene oxide | 714.3 | [51] |
| Lotus leaf porous carbon | 718.9 | [52] |
| PCAC | 1883.3 | This work |
| Adsorbents | Adsorption Capacities (mg g−1) | Refs. |
|---|---|---|
| Metal–organic framework (PCN-222) | 370 | [53] |
| Cellulose nanofibril/graphene oxide hybrid aerogel | 418.7 | [54] |
| Porous carbon produced from peanut shell | 423.7 | [55] |
| Porous carbon sheets from potassium acetate | 588.2 | [56] |
| N-doped hierarchically porous carbon | 742.4 | [57] |
| 3D hierarchical porous biochar aerogel | 786.1 | [58] |
| Porous carbon derived from Enteromorpha prolifera | 892.86 | [59] |
| Bovine bone-derived porous carbon | 1240 | [60] |
| PCAC | 1375.3 | This work |
| Adsorbates | Temperature (°C) | ΔH (kJ mol−1) | ΔS (J mol−1) | ΔG (kJ mol−1) |
|---|---|---|---|---|
| RhB | 30 | 2.10 | 20.76 | −4.19 |
| 40 | −4.40 | |||
| 50 | −4.61 | |||
| CAP | 30 | −2.12 | 6.12 | −3.98 |
| 40 | −4.04 | |||
| 50 | −4.10 |
| m (g) | H (cm) | H/D | C0/C = 0.1 | C0/C = 0.9 | FBU (%) | Vt (L) | ||
|---|---|---|---|---|---|---|---|---|
| tb (min) | qb (mg g−1) | ts (min) | qs (mg g−1) | |||||
| 0.4 | 2.7 | 2.3 | 435 | 1193.1 | 590 | 1358.1 | 87.8 | 3.2 |
| 0.8 | 5.4 | 4.5 | 915 | 1254.6 | 1200 | 1389.2 | 90.3 | 6.6 |
| 1.0 | 6.7 | 5.6 | 1270 | 1395.4 | 1497 | 1495.2 | 93.3 | 8.2 |
| m (g) | Thomas Model | Yoon–Nelson Model | ||||
|---|---|---|---|---|---|---|
| kTh (L min−1 mg−1) | q0 (mg L−1) | R2 | kYN (min−1) | τ (min) | R2 | |
| 0.4 | 1.6 × 10⁻⁴ | 1348.8 | 0.9862 | 0.032 | 491 | 0.9862 |
| 0.8 | 1.1 × 10⁻⁴ | 1373.6 | 0.9873 | 0.022 | 999 | 0.9873 |
| 1.0 | 1.0 × 10⁻⁴ | 1489.1 | 0.9861 | 0.020 | 1354 | 0.9861 |
Publisher’s Note: MDPI stays neutral with regard to jurisdictional claims in published maps and institutional affiliations. |
© 2022 by the authors. Licensee MDPI, Basel, Switzerland. This article is an open access article distributed under the terms and conditions of the Creative Commons Attribution (CC BY) license (https://creativecommons.org/licenses/by/4.0/).
Share and Cite
Liang, D.; Tian, X.; Zhang, Y.; Zhu, G.; Gao, Q.; Liu, J.; Yu, X. A Weed-Derived Hierarchical Porous Carbon with a Large Specific Surface Area for Efficient Dye and Antibiotic Removal. Int. J. Mol. Sci. 2022, 23, 6146. https://doi.org/10.3390/ijms23116146
Liang D, Tian X, Zhang Y, Zhu G, Gao Q, Liu J, Yu X. A Weed-Derived Hierarchical Porous Carbon with a Large Specific Surface Area for Efficient Dye and Antibiotic Removal. International Journal of Molecular Sciences. 2022; 23(11):6146. https://doi.org/10.3390/ijms23116146
Chicago/Turabian StyleLiang, Dadong, Xingyi Tian, Yupeng Zhang, Guanya Zhu, Qiang Gao, Junbo Liu, and Xiaoxiao Yu. 2022. "A Weed-Derived Hierarchical Porous Carbon with a Large Specific Surface Area for Efficient Dye and Antibiotic Removal" International Journal of Molecular Sciences 23, no. 11: 6146. https://doi.org/10.3390/ijms23116146
APA StyleLiang, D., Tian, X., Zhang, Y., Zhu, G., Gao, Q., Liu, J., & Yu, X. (2022). A Weed-Derived Hierarchical Porous Carbon with a Large Specific Surface Area for Efficient Dye and Antibiotic Removal. International Journal of Molecular Sciences, 23(11), 6146. https://doi.org/10.3390/ijms23116146