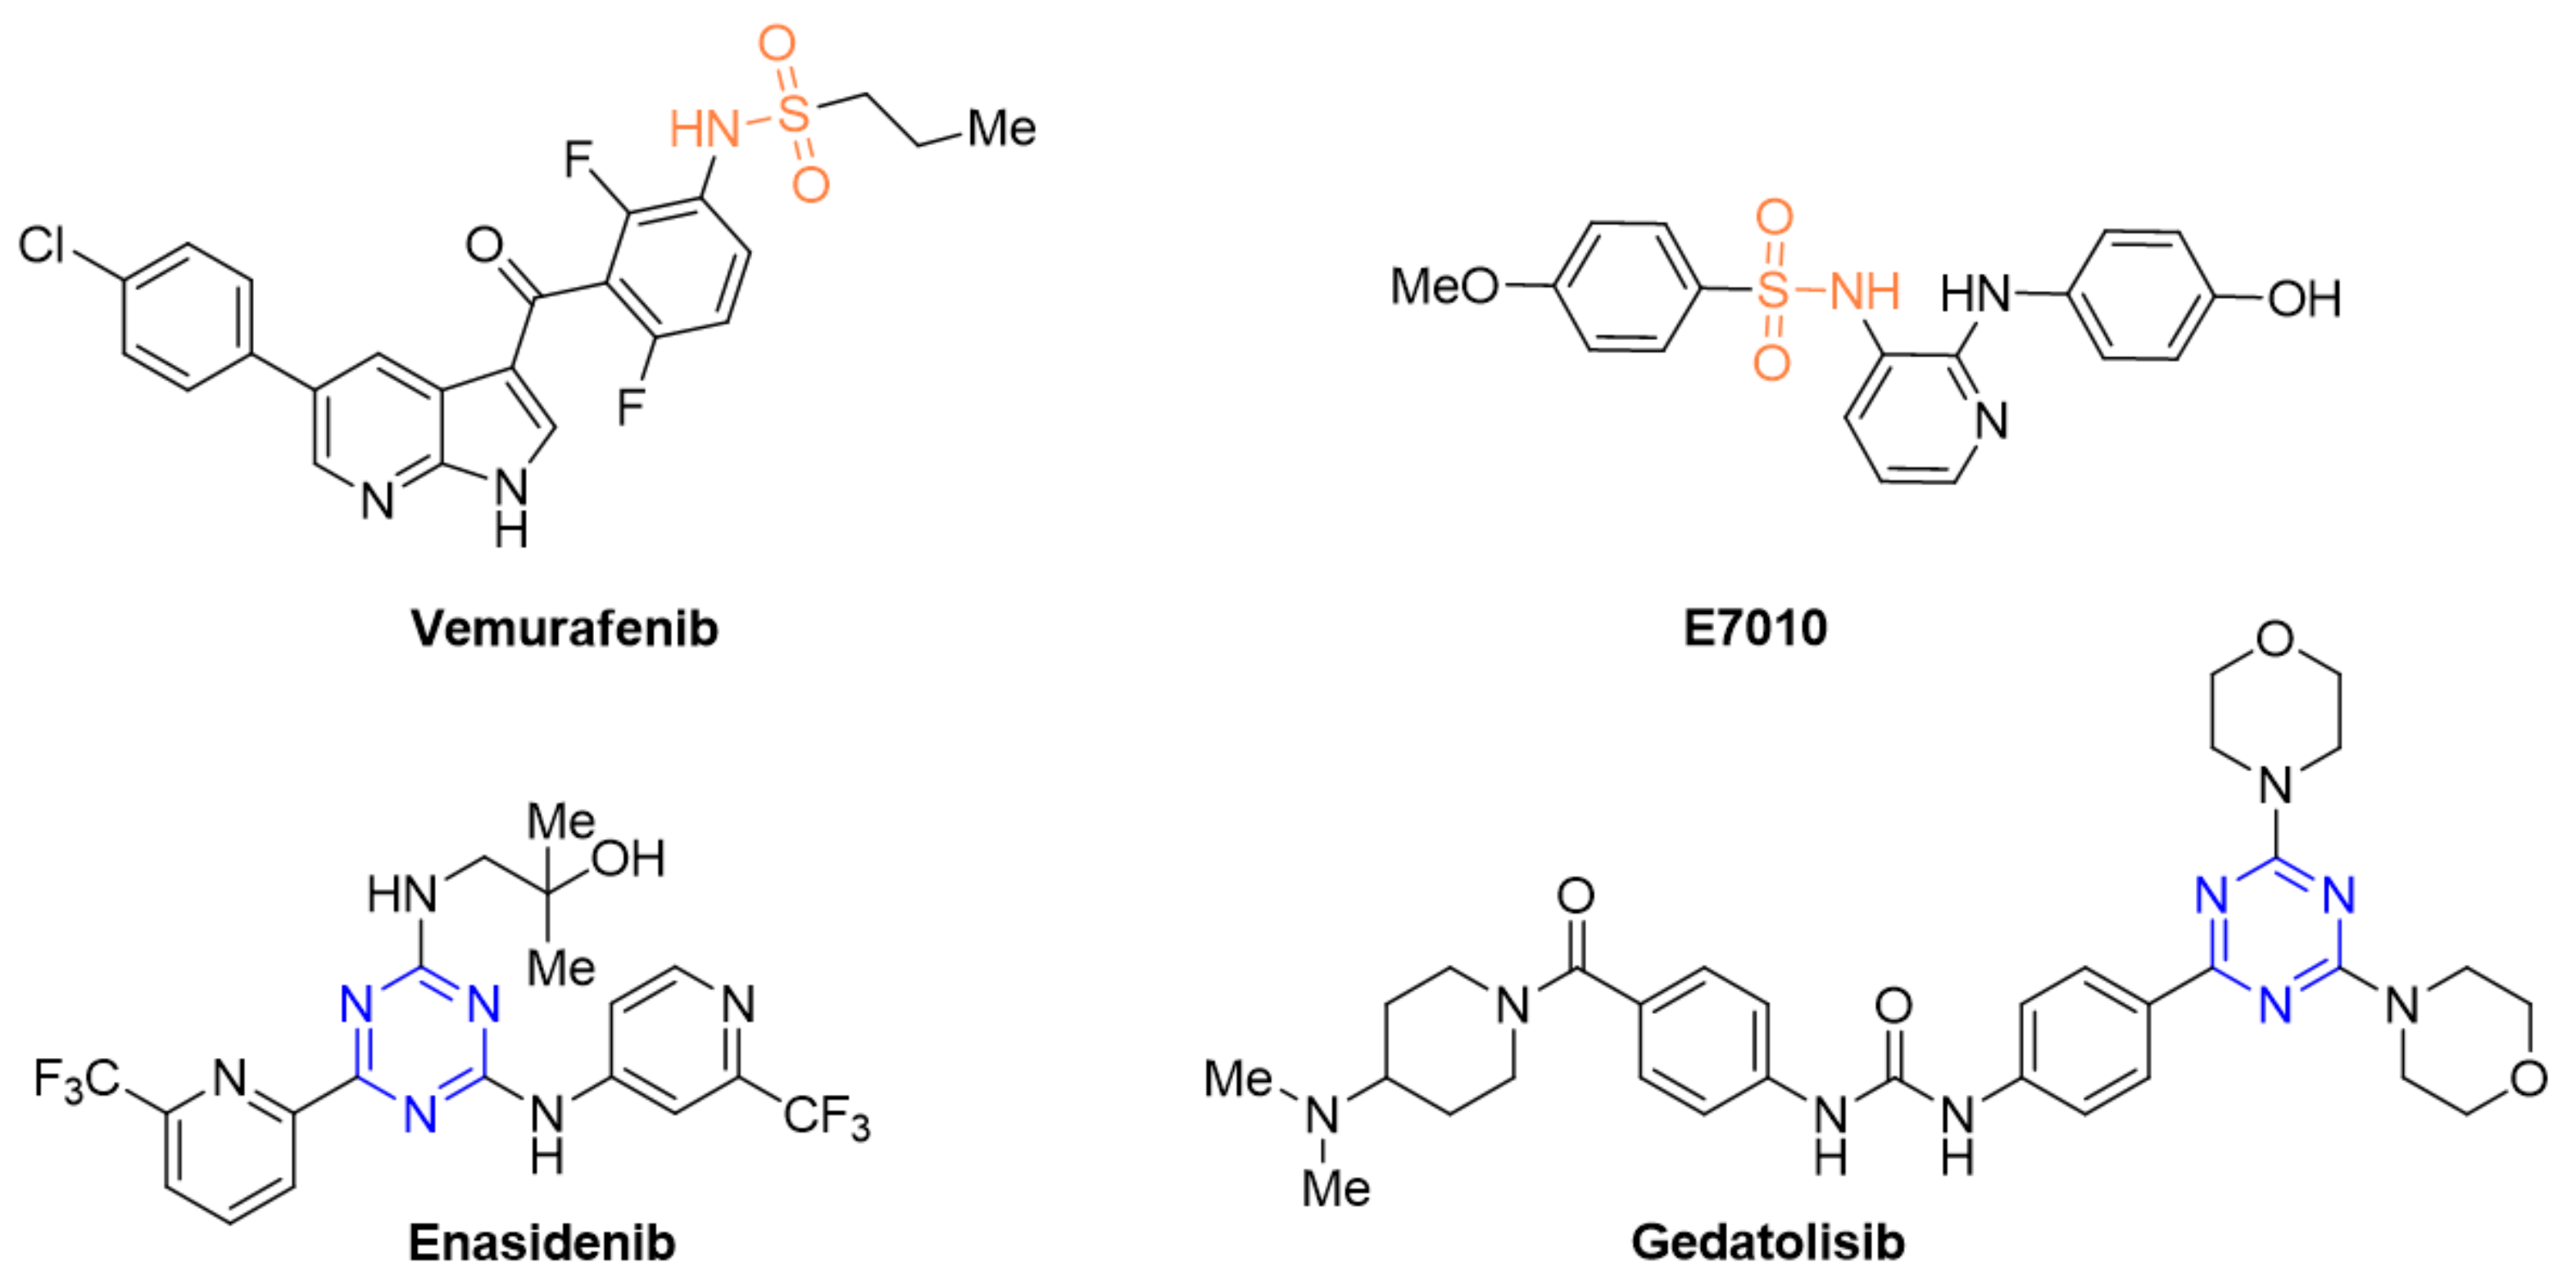
Article

New 2-[(4-Amino-6-N-substituted-1,3,5-triazin-2-yl)methylthio]-N-(imidazolidin-2-ylidene)-4-chloro-5-methylbenzenesulfonamide Derivatives, Design, Synthesis and Anticancer Evaluation

by
Łukasz Tomorowicz
1,
Beata Żołnowska
1,
Krzysztof Szafrański
1,
Jarosław Chojnacki
2,
Ryszard Konopiński
3,
Ewa A. Grzybowska
3,
Jarosław Sławiński
1,* and
Anna Kawiak
4,*
1
Department of Organic Chemistry, Faculty of Pharmacy, Medical University of Gdańsk, Al. Gen. J. Hallera 107, 80-416 Gdańsk, Poland
2
Department of Inorganic Chemistry, Faculty of Chemistry, Gdańsk University of Technology, G. Narutowicza 11/12, 80-233 Gdańsk, Poland
3
Maria Skłodowska-Curie National Research Institute of Oncology, ul. Roentgena 5, 02-781 Warszawa, Poland
4
Department of Biotechnology, Intercollegiate Faculty of Biotechnology, University of Gdańsk and Medical University of Gdańsk, ul. Abrahama 58, 80-307 Gdańsk, Poland
*
Authors to whom correspondence should be addressed.
Int. J. Mol. Sci. 2022, 23(13), 7178; https://doi.org/10.3390/ijms23137178
Submission received: 20 May 2022 / Revised: 23 June 2022 / Accepted: 24 June 2022 / Published: 28 June 2022
(This article belongs to the Section Molecular Pathology, Diagnostics, and Therapeutics)

Abstract

:
In the search for new compounds with antitumor activity, new potential anticancer agents were designed as molecular hybrids containing the structures of a triazine ring and a sulfonamide fragment. Applying the synthesis in solution, a base of new sulfonamide derivatives 20162 was obtained by the reaction of the corresponding esters 1119 with appropriate biguanide hydrochlorides. The structures of the compounds were confirmed by spectroscopy (IR, NMR), mass spectrometry (HRMS or MALDI-TOF/TOF), elemental analysis (C,H,N) and X-ray crystallography. The cytotoxic activity of the obtained compounds toward three tumor cell lines, HCT-116, MCF-7 and HeLa, was examined. The results showed that some of the most active compounds belonged to the R1 = 4-trifluoromethylbenzyl and R1 = 3,5-bis(trifluoromethyl)benzyl series and exhibited IC50 values ranging from 3.6 µM to 11.0 µM. The SAR relationships were described, indicating the key role of the R2 = 4-phenylpiperazin-1-yl substituent for the cytotoxic activity against the HCT-116 and MCF-7 lines. The studies regarding the mechanism of action of the active compounds included the assessment of the inhibition of MDM2-p53 interactions, cell cycle analysis and apoptosis induction examination. The results indicated that the studied compounds did not inhibit MDM2-p53 interactions but induced G0/G1 and G2/M cell cycle arrest in a p53-independent manner. Furthermore, the active compounds induced apoptosis in cells harboring wild-type and mutant p53. The compound design was conducted step by step and assisted by QSAR models that correlated the activity of the compounds against the HCT-116 cell line with molecular descriptors.

1. Introduction

Cancers are the leading cause of death worldwide. The WHO reports that, in 2020, the number of deaths from cancer was almost 10 million. The most common cancers in terms of new cases in 2020 were: breast cancer (2.26 million cases), lung cancer (2.21 million cases), colon and rectal cancer (1.93 million cases), prostate cancer (1.41 million cases), skin cancer (non-melanoma) (1.20 million cases) and stomach cancer (1.09 million cases). The most common causes of cancer deaths in 2020 were lung cancer (1.80 million deaths), colon and rectal cancer (935,000 deaths), liver cancer (830,000 deaths), stomach cancer (769,000 deaths), and breast cancer (685,000 deaths) [1]. The most common cancers are colorectal cancers, including colon and breast cancer. This fact has led us to focus our research, among others, on the cancer cell lines of breast cancer (MCF-7) and colon cancer (HCT-116).
Chemotherapy, radiotherapy and surgery are the most popular methods of cancer treatment available nowadays [2]. Multi-drug resistance (MDR) is one of the main problems of long-term chemotherapy failure [3,4]. For some types of cancer, e.g., pancreatic cancer, no effective chemotherapeutic agents have been found so far, and the only method of choice with a minimum survival of 5 years is surgical resection, which is less than 5% effective [5]. On the other hand, in the case of surgically inoperable cancers (which include the majority of infiltrating cancers and those located in places inaccessible for surgical treatment), chemotherapy [6,7], hormone therapy [7], immunotherapy [8] and radiotherapy [7] are the main treatment options.
Undoubtedly, compounds containing a sulfonamide moiety belong to a wide group of chemotherapeutic agents that have been used as anticancer agents. One good example can be Vemurafenib, which has been used since 2011 in the chemotherapy of melanomas with the BRAF V600 mutation [9]. Vemurafenib is currently in phase two clinical trials for colorectal cancer patients with the BRAF mutation in the VIC regimen [10] and for non-small cell lung cancer [11]. Another sulfonamide compound, E7010 (Figure 1), is presently in phase two clinical trials in colorectal cancer patients [12]. In turn, Enasidenib, approved by the FDA in 2017 [13], containing the 1,3,5-triazine moiety, is used in relapsed or refractory acute myeloid leukemia (AML), and Gedatolisib (Figure 1) is used in combination either with Talazoparib, at present in phase two clinical trials for breast cancer [14], or Palbociclib, in phase one clinical trials for patients with head and neck, pancreatic, lung and solid tumors [15].
Our previous reports indicated that 4-chloro-2-arylmethylthio-5-methylbenzenesulfonamide derivatives show cytotoxic activity against numerous human cancer cell lines, including colon, breast and cervical cancer, among others [16,17,18,19]. We have also proved that some of these compounds showed an apoptotic effect in cancer cells. In this work, we developed a series of 2-[(4-amino-6-R2-1,3,5-triazin-2-yl)methylthio]-N-(1-R1-imidazolidin-2-ylidene)-4-chloro-5-methylbenzenesulfonamides (Figure 2), applying the molecular hybrids strategy. Molecular hybrids were designed as a combination of 2-mercaptobenzenesulfonamide fragments (A) with a 4-amino-6-R2-1,3,5-triazin-2-yl ring (B). The structures of the designed compounds were also diversified with the substituent R1 (C) (Figure 2) on the imidazolidine ring in position N-1 to investigate their influence on cytotoxic activity.
The quantitative structure–activity relationship (QSAR) computational method is helpful in the design and development of new anticancer active compounds [20,21,22]. Thus, a series of 2-[(4-amino-6-R2-1,3,5-triazin-2-yl)methylthio]-N-(1-R1-imidazolidin-2-ylidene)-4-chloro-5-methylbenzenesulfonamide derivatives (20157) were synthesized in four separate steps, which required the building of QSAR models and introducing structural modifications, leading to better cytotoxic activities (Figure 3). All synthesized compounds were tested in a series designed sequentially for their cytotoxic activity against three human cancer cell lines, i.e., HCT-116, MCF-7, and HeLa. The resulting experimental data for the HCT-116 cell lines were consequently used for QSAR analysis. QSAR models were constructed step by step for a series of structurally modified compounds with R1 = H (Step 1), Bn (Step 2), and 4-F-Bn (Step 3). The predictive performance of the models built for the compounds from Step 3 allowed for the virtual design of a subsequent series modified in the N-1 position of imidazolidine ring with R1 = 3-F3C-Bn, 4-F3C-Bn, and 3,5-bis(F3C)Bn (Step 4).

2. Results and Discussion

2.1. Chemistry

The necessary substrates, i.e., 4-chloro-2-mercapto-5-methyl-N-(1-R1-benzylimidazolidin-2-ylidene)benzenesulfonamide (2, 3), were synthesized by the methods previously described [23,24]. The novel substrates 49 and 10 were obtained analogously to the reaction of 1 with either ethane-1,2-diamine, N-benzylethane-1,2-diamine (49) or N-(4-trifluoromethylbenzyl)propane-1,3-diamine (10). Subsequent reaction of 210 with ethyl bromoacetate and triethylamine (TEA) in methylene chloride (DCM), led to the appropriate novel ethyl 2-{2-[N-(imidazolidin-2-ylidene)sulfamoyl or N-(tetrahydropyrimidin-2(1H)-ylidene)sulfamoyl]-5-chloro-4-methylphenylthio}acetate derivatives 1118 and 19, respectively (Scheme 1).
Aiming for the synthesis of the final 6-substituted 4-amino-1,3,5-triazin-2-yl derivatives 20157 (Scheme 2) and 158162 (Scheme 3), the esters 1118 or 19 were reacted with the appropriate biguanide hydrochlorides [25,26,27,28,29,30] in MeONa/MeOH solution at reflux for 45 h.
The structures of the final compounds 20162 were confirmed with the IR and NMR methods, as well as HRMS (ESI-TOF) or MALDI-TOF/TOF, elemental analysis (C,H,N) and X-ray crystallography of the representative compound 27.
X-ray crystallography was undertaken to study the structure of the representative compound 27. Compound 27 forms transparent crystals satisfying the symmetry of the triclinic system, space group P 1 ¯ (no. 2). An asymmetric unit contains one molecule, and the whole unit cell is built from two molecules of the sulfonamide and two (disordered) molecules of solvent, DMSO, Z = 2. Most of the bond lengths and angles are in the expected ranges. The obtained molecular structure is presented in Figure 4 and Figure 5. The report and details on data collection, structure solution, refinement geometry parameters, and hydrogen bonding details for 27 are given in Supplementary Materials (Tables S1 and S2).

2.2. Cytotoxic Activity

Compounds 20162 were evaluated in vitro for their effects on the viability of three cancer cell lines: HCT-116 (colon cancer), MCF-7 (breast cancer) and HeLa (cervical cancer), as well as the non-cancerous keratinocyte cell line (HaCaT). The concentration required for 50% inhibition of cell viability IC50 was calculated and, as a positive control, cisplatin was used. Analysis was performed using an MTT assay after 72 h of incubation. The results are shown in Table 1, Table 2, Table 3, Table 4 and Table 5.
The most active compounds 135, 143, 150 and 156 belonged to the R1 = 4-trifluoromethylbenzyl (135, 143) and R1 = 3,5-bis(trifluoromethyl)benzyl (150, 156) series and showed high activity (3.6–5.0 µM, 4.5–7.5 µM and 5.5–11.0 µM, respectively) against all tested cell lines, HCT-116, MCF-7 and HeLa. The selectivity indexes of the most active compounds ranged from 6.4 to 1.7 (Table 6). In turn, twelve compounds, 2023, 30, 67, 6971, 7980 and 118, were inactive for all tested cell lines, which is about eight percent of the tested compounds (Table 1, Table 2, Table 3, Table 4 and Table 5).
As shown in Table 1, Table 2, Table 3, Table 4 and Table 5 the HCT-116 cell line presented the relatively highest susceptibility (IC50 < 6.0 µM) towards the tested compounds, with the highest activity displayed by the seventeen compounds 73, 111, 114115, 134136, 140, 142143, 150, 154158 and 162. Whereas, activity against the MCF-7 cell line, with IC50 in the range 4.5–6.0 µM, was observed for eight compounds (96, 136, 143, 150, 151, 155, 157 and 162), and against HeLa by five compounds (111, 135, 143, 156 and 158), with IC50 values ranging between 5.5 and 7.5 µM.

2.3. QSAR Analysis

QSAR models were constructed to find a correlation between the activity against the HCT-116 cell line and the parameters of the molecules. On the basis of the QSAR models, successive series of derivatives were designed (mainly by modifying the R1 substituent), synthesized and evaluated in MTT tests step by step (Figure 6). As a result, the four QSAR models 1–4 have been developed in the four steps 1–4 (Table 7).
To compute the molecular descriptors, the energy of the molecules was minimized in the MOE software [32], using the MMFF94X force field and PM6 methods consecutively. Then, the energy was finally optimized in the GAMES software [33] using the STO3G HF method. Such optimized structures were used to calculate 365 molecular descriptors in the MOE software. QSAR models were obtained by stepwise linear progressive regression (MLR) in the STATISTICA software [34]. Compounds with IC50 outliers were removed from the analysis.
The statistical quality predictive ability of the QSAR models was evaluated using the coefficient of determination R2 and modified coefficients R2adj and Q2Loo. Additionally, for each model, the residuals were normally distributed. The minimal value of the parameters were: R2adj greater than 0.85 and Q2LOO greater than 0.72, where, in the test set for each model, there was a minimum of 25% compounds.
The QSAR Model 1 for compounds 2044 (R1 = H) (Table 7, Figure 6) shows that the activity for the HCT-116 cell line correlates with higher values of descriptors related to atom counts and bond counts, ast_violation, and partial charge PEOE_VSA-0 as well as the number of rings in the molecule rings (Table 8). Taking into account a residue analysis for the obtained model, it is noted that a high correlation coefficient of 89% is observed for the rings descriptor and the IC50 value for the HCT-116 cell line. To conclude, the model shows that, if the number of rings in the molecule increases, the IC50 value for the HCT-116 cell line will decrease. Based on this observation, compounds with one and two more rings, 4573 (R1 = Bn) and 7481 (R1 = 2-(naphtalen-2-yl)methyl group), were synthesized and investigated for their cytotoxic activity. The obtained experimental data were used to build a following model describing the quantitative structure–activity relationships.
In the second step, QSAR Model 2 for compounds 4573 (R1 = Bn) (Table 7, Figure 6) indicated that the IC50 value depends on the number of rotatable single bonds b_1rotN, the distance between the atoms and the charge of atoms GCUT_PEOE_0, the number of oxygen and nitrogen atoms lip_acc and the descriptor related to the distance between atoms and the surrounding atoms by other atoms radius (Table 8). It was observed that the predictor that corresponded most with antitumor activity for the HCT-116 model was the lip_acc descriptor, with a correlation coefficient of 70%. Based on this information, it was decided to synthesize compounds with one fluorine atom and one bromide atom in benzyl ring, compounds 82101 (R1 = 4-F-Bn) and 102111 (R1 = 4-Br-Bn), respectively. Model 2 allowed us to obtain series of compounds with interesting cytotoxic effects that were used to perform new QSAR calculations in Step 3.
The following QSAR Model 3 for compounds 82101 (R1 = 4-F-Bn) (Table 7, Figure 6) paid attention to low values of descriptors related to adjacency and distance matrix BCUT_SMR_1 as well as to total hydrophobic van der Waals surface area Q_VSA_HYD, which have beneficial impacts on high anticancer activity. The negative coefficient of the vsurf_S descriptor shows that a high value for the interaction field surface area is valuable for anticancer activity (Table 8). The residual analysis for Model 3 indicated the best correlation coefficient for the Q_VSA_HYD descriptor. Based on this conclusion, in Step 4 we decided to increase the hydrophobicity of compounds by replacing the fluorine atom with one and two trifluoromethyl groups in the benzyl ring. Consequently, in the next steps, compounds 112117 (R1 = 3-F3C-Bn), 118143 (R1 = 4-F3C-Bn) and 144157 (R1 = 3,5-bis(F3C)Bn) were synthesized.
Based on the analysis of the QSAR equations, the series of above-described derivatives were designed and synthesized consistently step by step. Each synthesized series of compounds followed the previously drawn conclusions from the generated QSAR models. In this way, the most active series against the HCT-116 cell line 112117 (R1 = 3-F3C-Bn), 118143 (R1 = 4-F3C-Bn) and 144157 (R1 = 3,5-bis(F3C)Bn) were achieved successfully. Additionally, compound 150 turned out to be the most prominent anticancer agent towards colorectal and breast tumors, exhibiting IC50 values of 3.6 μM for HCT-116 and 4.5 μM for the MCF-7 cell line.
The presented QSAR Model 4 for compounds 112117 (R1 = 3-F3C-Bn), 118143 (R1 = 4-F3C-Bn) and 144157 (R1 = 3,5-bis(F3C)Bn) (Table 7, Figure 6) indicated three descriptors connected with the hydrophobicity of compounds, vsurf_DD12, vsurf_IW4 and vsurf_IW5 (Table 8). High values of vsurf_IW4 and low values of vsurf_IW5 and vsurf_DD12 favorably influence the cytotoxic activity toward the HCT-116 cell line.

2.4. SAR Analysis

Compounds containing 1,4-disubstituted piperazine rings at the R2 position are generally more active for the HCT-116 and MCF-7 cell lines. Comparison of a series containing the R2 = 4-phenylpiperazin-1-yl substituent (31, 57, 92, 106, 131 and 150) with a similar series bearing the R2 = PhNH group (25, 50, 85, 104, 122 and 146) clearly shows this advantage in activity (Table 9). We also found that the nature of the R1 substituent exerted a strong influence on the anticancer activity of the discussed compounds. Thus, replacement in both series of R1 = H (31, 25) by the R1 = benzyl, 4-F-benzyl, 4-Br-benzyl, 4-(trifluoromethyl)benzyl or 3,5-bis(trifluoromethyl)benzyl moieties consequently leads to a significant increase in activity (Table 9).
Moreover, the activity of compounds containing the R2 = 4-phenylpiparazin-1-yl moiety depends significantly on the position and nature of the substituent of the phenyl ring. For example, compounds bearing the R2 = 4-(4-trifluoromethyl)phenylpiparazin-1-yl moiety (34, 60 and 134) show slightly weaker activity compared to the series comprising the trifluoromethyl group in 3 position (35, 61 and 135) (Table 10). Although the presence of the substituted phenyl moiety attached to the piperazine ring positively affects the activity, it should be noted that, in some cases, a loss of activity was noted, e.g., 67 (R2 = 4-(4-nitrophenyl)piperaizn-1-yl), 70 (R2 = 4-(phenylsulfonyl)piperaizn-1-yl) or 71 (R2 = 4-tosylpiperazin-1-yl) with IC50 (HCT-116) 168.0, 300.0 and 155.0 µM, IC50 (MCF-7) 153.0, 490.0 and 205.0 µM and IC50 (HeLa) 140.0, 550.0 and 265.0 µM, respectively (Table 1, Table 2, Table 3, Table 4 and Table 5).

2.5. Investigation of the Mechanism of Antiprolifeartive Activity

2.5.1. MDM2 and p53 Protein Levels

Structural analogs of the examined compounds were found to bind into the p53-binding pocket of the MDM2 protein. Thus, the effects of the examined compounds on the inhibition of MDM2-p53 interactions were examined. MDM2 and p53 protein levels were determined with Western blot analysis after the treatment of MCF-7 cells with compounds selected for their high selectivity index (48, 62, 134, 138, and 140). Compounds were examined at different concentrations (4 µM and 10 µM) following a 24-h incubation (Figure 7). Western blot analysis revealed no changes in either MDM2 or p53 levels, indicating that p53 stability does not change upon compound treatment.

2.5.2. Cell Cycle Analysis

P53 controls cell proliferation through the regulation of the cell cycle. In order to determine p53-independent cell cycle arrest, the influence of selected compounds on the cell cycle distribution in MCF-7 cells was analyzed. Cells were treated with a concentration range of two selected compounds (140 and 48) for 48 h. Cell cycle distribution was analyzed with flow cytometry. In the case of compound 48, a significant increase in the G0/G1 phase of the cell cycle was observed at a concentration of 10 µM, while a concentration-dependent increase in the sub-G1 population of the cell cycle was observed, indicating possible apoptosis induction. Compound 140 at the lower concentration of 10 µM increased the G0/G1 population, whereas at the higher examined concentration of 25 µM, an increase in the G2/M phase of the cell cycle was observed. Alongside G0/G1 and G2/M arrest, a concentration-dependent increase in the sub-G1 fraction of the cell cycle was observed upon treatment with compound 140. However, a higher increase in the sub-G1 population was observed in compound-48-treated cells (Figure 8).

2.5.3. Cytotoxic Activity toward Wild-Type and Mutant p53 Cell Lines

Cell cycle analysis showed a p53-independent mechanism of action for the examined compounds. Thus, the ability of the selected compounds to exert cytotoxic activity toward cell lines harboring mutant p53 was examined. Compounds displaying a high selectivity index (Table 6) were selected for the analysis of their activity toward ovarian and breast cancer cells with wild-type p53 (A2780, MCF-7) and mutant p53 (SKOV-3, T47D). The results of the MTT assay showed cytotoxic activity exerted by the compounds toward both types of cells (Table 11).

2.5.4. Apoptosis Induction Analysis

The increase in the sub-G1 fraction of the cell cycle by compounds 140 and 48 suggested apoptosis induction. To confirm this, MCF-7 cells were treated with a concentration range of compounds 140 and 48 for 72 h. Flow cytometric analysis was performed with Annexin V-PE staining. The results showed a concentration-dependent increase in the apoptotic population of cells induced by the treatment with both compounds. The increase in apoptotic cells was mainly evident in the late apoptotic stage (upper right quadrant) (Figure 9).
Since the examined compounds exerted cytotoxic activity toward cell lines harboring mutant p53, the ability of compounds 140 and 48 to induce apoptosis in T47D cells with mutant p53 was examined. Similarly, as in the case of MCF-7 cells, a concentration-dependent increase in apoptotic cells was induced in T47D cells. Cell death was induced to a similar extent in cells harboring wild-type and mutant p53 (Figure 10).

2.5.5. Discussion

To discern the mechanism of activity of the studied compounds, cell cycle arrest and apoptosis induction, associated with the activation of the p53 tumor suppressor protein, were analyzed. Our previous research showed that structural analogs of the compounds examined in the presented research bind into the p53-binding pocket of MDM2 protein [17]. This suggests possible induction of apoptosis by a mechanism similar to that of Nutlin-3a, a selective inhibitor of MDM2-p53 interactions. MDM2 is a promising target for developing anti-cancer therapies since it is as an important negative regulator of the p53 protein [35,36]. MDM2, a p53-specific E3 ubiquitin ligase, is the principal cellular antagonist of p53, limiting the p53 growth-suppressive function in unstressed cells. In these cells, MDM2 constantly monoubiquitinates p53 and thus is a critical step in mediating its degradation by nuclear and cytoplasmic proteasomes [37]. To explore the possibility that the observed cytotoxicity of the analyzed compounds results from their ability to block MDM2-p53 interactions and subsequently inhibit MDM2-mediated p53 degradation, p53 protein levels were examined by Western blot. An increase in p53 levels after treatment would signify its stabilization and promotion of cell death. The results of our analysis showed no change in p53 stability. However, cell cycle arrest and apoptosis were determined upon treatment with the examined compounds. These results pointed to a p53-independent mechanism of cell death induction.
The p53 pathway is an important target in cancer drug design. In cancers with wild-type p53, MDM2 inhibitors have found clinical application. However, in the case of tumors with mutant p53, targeting strategies are more challenging. Fifty percent of tumors harbor mutated or deleted p53, which leads to not only loss of p53 tumor suppressor functions, but also to gain-of-function driving tumor cell proliferation. Mutant p53 tumors display a more aggressive phenotype than their counterpart tumors harboring wild-type 53. Targeting strategies for mutant p53 tumors include reactivation of p53. However, direct targeting of mutant p53 is challenging due to its structural diversity. Thus, compounds inducing cell death in mutant p53 tumors can be considered important candidates in the treatment of cancers [38,39,40].
The results of the presented research showed cell death induction by compounds 48 and 140 in breast cancer cell lines harboring wild-type p53 (MCF-7 cells) and mutant p53 (T47D cells). Compounds 48 and 140 induced apoptosis in T47D cells to a similar extent as in MCF-7 cells. Research has shown that the p53 mutation in T47D cells facilitates cell survival [41]. This is associated with the disruption of signaling pathways controlled by wild-type p53 and induced by a p53 mutation, which leads to the activation of various compensatory mechanisms required to support tumor cell survival [40]. Thus, targeting signaling pathways activated by mutant p53 is a promising therapeutic strategy. Further research regarding the mechanism of cell death induced by the examined compounds could address the pharmacological value of these compounds.

3. Materials and Methods

3.1. General Information

The following instruments and parameters were used: Melting points were measured using a Stuart SMP30 (Bibby Scientific Limited, Stone Staffordshire UK) apparatus. IR spectra: KBr pellets, spectra were made on a Thermo Mattson Satellite FTIR spectrophotometer in the range 400–4000 cm−1. 1H NMR and 13C NMR spectra were obtained on a Varian Unity Plus 500 apparatus (Varian, Palo Alto, CA, USA) at 500 MHz, chemical shifts are expressed in parts per million (ppm) relative to (Me4Si) TMS as an internal standard. Elemental analyses for C, H and N were obtained on a CHN Elemental Analyzer (Perkin Elmer, Shelton, CT, USA) and obtained values are in agreement with the theoretical values within the ±0.4% range. Thin-Layer chromatography (TLC) was performed on Merck Kieselgel 60 F254 Plates (Merck, Darmstadt, Germany) and visualized with UV. High-resolution mass spectrometry (HRMS) was conducted on a TripleTOF 5600+ mass spectrometer (AB SCIEX, Framingham, MA, USA) equipped with a DuoSprayTM Ion Source and coupled with a Micro HPLC system Ekspert™ microLC 200 (Eksigent Redwood City, CA, USA); Column: HALO Fused-Core C18 (50 × 0.5 mm, 2.7 μm) (Eksigent), thermostated at 50 °C; Flow: 30 μL/min; Mobile Phase: A: 0.1% formic acid in water, B: 0.1% formic acid in acetonitrile; Isocratic program 100% B, 4 min. Moreover, a MALDI-TOF/TOF 5800 Sciex spectrometer was used to analyze the remaining obtained compounds. Samples were dissolved in methanol with 5% water content, and ferulic acid (FA, concentration 10 mg/mL in 33% acetonitrile/17% formic acid in water) was used as the matrix. Briefly, 0.8 microl of the sample was mixed on a measuring plate (Opti-TOF 384 MALDI plate insert) with 0.8 microl of the matrix and was allowed to crystallize freely at room temperature. Then, the plate was introduced into the spectrometer, and the measurements were carried out in reflector positive ion mode at a constant laser intensity. The commercially unavailable starting materials were obtained according to the following methods previously described: 1 [42], 2 [23] and 3 [24].

3.2. Synthesis

The procedures for the preparation of compounds 4162 are provided in the Supplementary Materials (S.3.2. Synthesis).

3.3. X-ray Structure Determination

Crystal structures were investigated on an IPDS 2T dual beam diffractometer (STOE & Cie GmbH, Darmstadt, Germany). The crystal structure was solved using intrinsic phasing implemented in SHELXT and refined anisotropically using the program packages Olex2 [43] and SHELX-2015 [44,45]. Crystallographic data reported in this paper have been deposited with the Cambridge Crystallographic Data Centre as supplementary publication No. CCDC 2154790 for 27. The data can be obtained free of charge from The Cambridge Crystallographic Data Centre via www.ccdc.cam.ac.uk/structures (accessed on 25 February 2022).

3.4. Cytotoxic Activity Screening and Determination of Mode Cell Death Induction

3.4.1. Cell Culture

All chemicals, if not stated otherwise, were obtained from Sigma–Aldrich (St. Louis, MO, USA). The HCT-116 cell line was purchased from ATCC (ATCC-No: CCL-247), while the MCF-7, HeLa and HaCaT cell lines were purchased from Cell Lines Services (Eppelheim, Germany). Cells were cultured in Dulbecco’s modified Eagle’s medium (DMEM) supplemented with 10% fetal bovine serum, 2 mM glutamine, 100 units/mL penicillin and 100 µg/mL streptomycin. Cultures were maintained in a humidified atmosphere with 5% carbon dioxide at 37 °C in an incubator (Heraceus, HeraCell).

3.4.2. Cell Viability Assay

Cell viability was examined using the MTT [3-(4,5-dimethylthiazol-2-yl)-2,5-diphenyltetrazolium bromide] assay. Cells were seeded in 96-well plates at a density of 3 × 10³ cells/well and treated for 72 h with the tested compounds in the concentration range of 1–100 µM. Then, MTT (0.5 mg/mL) was added to the medium and cells were further incubated for 2 h at 37 °C. In the next stage, cells were lysed with DMSO and the absorbance of the formazan solution was measured at 550 nm with a plate reader (1420 multilabel counter, Victor, Jügesheim, Germany). The experiment was performed in triplicate. Values are expressed as the mean ± SD of at least three independent experiments. Cisplatin was used as a positive control.
Compounds 48, 62, 134, 138 and 140 were further examined toward MCF7 (breast cancer cell line, ATCC, HTB-22), T47D (breast cancer cell line, DSMZ ACC 739), A2780 (ovarian carcinoma cell line, ECACC, 93112519), and SKOV3 (ovarian carcinoma cell line, ATCC, HTB-77) cells. Cells were grown in Dulbecco’s Modified Eagle Medium (DMEM) supplemented with 10% fetal bovine serum (Thermo Fisher Scientific).

3.4.3. Determination of Protein Levels with Western Blot

Protein extracts were heat-denaturated (95 °C) in Laemmli buffer (50 mM Tris/HCl, 0.01% Bromophenol Blue, 1.75% 2-mercaptoethanol, 11% glycerol, 2% SDS) and separated by 10–12% SDS/PAGE electrophoresis. Proteins were transferred to an Immobilon-P PVDF membrane (Merck Millipore, Burlington, MA, USA). The membranes were incubated for 1 h using 5% low-fat milk solution in 1× TBS (50 mM Tris-Cl, pH 7.5, 150 mM NaCl) as a blocking buffer and then overnight at 4 °C in the same blocking solution containing one of the following antibodies: anti-MDM2 (rabbit, Sigma-Aldrich AB-166, Burlington, MA, USA), anti-p53 (rabbit, Sigma-Aldrich S15) or α-tubulin (rabbit, 11H10, Cell Signaling, Danvers, MA, USA). After washing (3 × 10 min in TBS), membranes were incubated for 2 h in room temperature with the adequate HRP-conjugated secondary antibody: goat anti-rabbit IgG (1:5000, Abcam, Cambridge, UK; cat. 97051). Membranes were developed using an HRP detection kit WesternBright Quantum (Advansta, San Jose, CA, USA; cat. K-12042).

3.4.4. Cell Cycle Analysis

Cell cycle distribution was analyzed with flow cytometry analysis with PI staining. MCF-7 cells were treated with compounds 48 and 140 (5, 10, 25 µM) for 48 h. Following treatment, the cells were collected and fixed in cold 70% ethanol for 24 h. The fixed cells were washed with PBS and incubated with 100 µg/mL RNAse (Invitrogen, Germany) and stained with 10 µg/mL PI (Invitrogen, Germany) for 30 min at RT. A total of 104 cells were examined with a FACSCalibur cytometer (BD) and data was analyzed with Flowing software (version 2.5).

3.4.5. Apoptosis Analysis

Levels of apoptosis were measured by flow cytometry using the Annexin V-PE Apoptosis Detection Kit I (BD Biosciences, Belgium) according to the manufacturer’s instructions. Apoptosis was assessed after a 72 h treatment of MCF7 and T47D cells with compounds 48 and 140 in the concentrations of 5, 10 and 25 µM. Proceeding cell treatment, cells were collected, washed with PBS and stained with Annexin V-phycoerythrin (PE) and 7-amino-actinomycin (7-AAD) in Annexin V binding buffer for 15 min at RT in the dark. After staining, cells were diluted in Annexin V binding buffer and analyzed on a BD FACSCalibur flow cytometer (BD Biosciences). At total of 104 cells were analyzed from each sample and data were analyzed with Flowing software (version 2.5).

3.4.6. Statistical Analysis

Values are expressed as means ± SD of at least three independent experiments. Statistical analysis was performed using GraphPad Prism 5.0 (GraphPad software). Differences between control and treated samples were analyzed by one-way ANOVA with Tukey’s post hoc tests. A p value of <0.05 was considered as statistically significant in each experiment.

3.5. Calculation of Molecular Descriptors and Generation of QSAR Models

Molecular descriptors were calculated in MOE 2019.01 software. Statistical analysis was carried out used TIBCO STATISTICA software 13.3.

4. Conclusions

We have synthesized a series of 2-[(4-amino-6-N-substituted-1,3,5-triazin-2-yl)methylthio]-N-(imidazolidin-2-ylidene)-4-chloro-5-methylbenzenesulfonamide 20157 and 2-[(4-amino-6-substituted-1,3,5-triazin-2-yl)methylthio]-N-{1-[4-(trifluoromethyl)benzyl]tetrahydropyrimidin-2(1H)-ylidene}-4-chloro-5-methylbenzenesulfonamides derivatives 158162 using cyclocondensation reactions of the 1,3,5-triazine moiety from previously obtained ethyl 2-{2-[N-(imidazolidin-2-ylidene)sulfamoyl]-5-chloro-4-methylphenylthio}acetate 1118 and appropriate biguanide hydrochloride. The molecular structures of most compounds were confirmed by elemental analyses, and, for all compounds, NMR and IR spectroscopic methods were employed. For the representative compound 27, an X-ray structure was determined.
The designing and development of new structures were supported with QSAR analysis. QSAR models were constructed in four steps and led to modification of the N-1 position of imidazolidine ring with benzyl, halogen-substituted benzyl and trifluoromethylbenzyl (3-F3C-Bn, 4-F3C-Bn, and 3,5-bis(F3C)Bn) groups consistently. Consequently, improvement of cytotoxic activity against the HCT-116 cell line was achieved and the highest cytotoxic activity was presented by series 112117 (R1 = 3-F3C-Bn), 118143 (R1 = 4-F3C-Bn) and 144157 (R1 = 3,5-bis(F3C)Bn).
All obtained compounds 20162 were investigated on three tumor cell lines: colon cancer (HCT-116), breast cancer (MCF-7), cervical cancer (HeLa) and non-cancerous keratinocyte cell line (HaCaT). Compounds containing the substituent R1 = 3,5-bis(trifluoromethyl)benzyl showed the highest cytotoxic activity against the tested cancer lines. Compounds from the series of derivatives containing the substituents R1 = 3,5-bis(trifluoromethyl)benzyl and R1 = 4-trifluoromethylbenzyl showed the highest cytotoxic activity against the tested cancer lines, with IC50 values ranging from 3.6 µM to 11.0 µM. Compounds 48 R1 = benzyl (IC50 HCT-116, MCF-7 = 6.0 and 7.0 µM; SI HCT-116, MCF-7 = 5.5 and 4.7) and 140 R1 = 4-trifloromethylbenzyl (IC50 HCT-116, HeLa = 5.0 and 8.0 µM; SI HCT-116, HeLa = 4.4 and 2.7) were shown to induce cell cycle arrest in the G0/G1 and G2/M phases of the cell cycle. Furthermore, apoptosis was induced in wt-p53 and mutant p53 cells in a p53-independent manner. The indicated selectivity index in comparison to the control compound as well as the established mechanism of activity shows the promising potential of the utilized scaffolds in this research for anticancer compound design.

Supplementary Materials

The following supporting information can be downloaded at: https://www.mdpi.com/article/10.3390/ijms23137178/s1.

Author Contributions

Ł.T. and J.S. created the concept and designed the study; Ł.T. performed the synthesis of compounds; Ł.T., J.S., B.Ż. and A.K., wrote the manuscript; Ł.T. and K.S. generated the QSAR models; Ł.T., J.S. and B.Ż. carried out interpretation of the QSAR models; A.K. tested the cytotoxic activity toward HCT-116, MCF-7, HeLa and HaCaT cell lines for all obtained compounds and performed flow cytometry analysis and data analysis; J.C. performed crystallographic analysis; E.A.G. and R.K. performed Western blot analysis and cytotoxicity analysis towards A2780, SKOV-3, MCF-7 and T47D cell lines for five selected compounds and performed data analysis. All the authors discussed the results of the manuscript. All authors have read and agreed to the published version of the manuscript.

Funding

The study was supported by the project POWR.03.02.00-00-I026/17-00, co-financed by the European Union through the European Social Fund under the Operational Programme Knowledge Education Development 2014–2020. Financial support of these studies from Gdańsk University of Technology by the DEC--2/2021/IDUB/V.6/Si grant under the SILICIUM SUPPORTING CORE R&D FACILITIES—‘Excellence Initiative—Research University’ program is gratefully acknowledged.

Institutional Review Board Statement

Not applicable.

Informed Consent Statement

Not applicable.

Data Availability Statement

All data are available as Supplementary Materials.

Conflicts of Interest

The authors declare no conflict of interest.

References

  1. World Health Organization (WHO). Fact Sheet: Cancer. Available online: https://www.who.int/news-room/fact-sheets/detail/cancer (accessed on 3 February 2022).
  2. Arruebo, M.; Vilaboa, N.; Sáez-Gutierrez, B.; Lambea, J.; Tres, A.; Valladares, M.; González-Fernández, Á. Assessment of the evolution of cancer treatment therapies. Cancers 2011, 3, 3279–3330. [Google Scholar] [CrossRef] [PubMed] [Green Version]
  3. Cui, Q.; Wang, J.-Q.; Assaraf, Y.G.; Ren, L.; Gupta, P.; Wei, L.; Ashby, C.R.; Yang, D.H.; Chen, Z.-S. Modulating ROS to overcome multidrug resistance in cancer. Drug Resist. Updates 2018, 41, 1–25. [Google Scholar] [CrossRef] [PubMed]
  4. Cui, Q.; Yang, Y.; Ji, N.; Wang, J.-Q.; Ren, L.; Yang, D.-H.; Chen, Z.-S. Gaseous signaling molecules and their application in resistant cancer treatment: From invisible to visible. Future Med. Chem. 2019, 11, 323–336. [Google Scholar] [CrossRef] [PubMed]
  5. Hong, X.; Li, Z.-X.; Hou, J.; Zhang, H.-Y.; Zhang, C.-Y.; Zhang, J.; Sun, H.; Pang, L.-H.; Wang, T.; Deng, Z.-H. Effects of ER-resident and secreted AGR2 on cell proliferation, migration, invasion, and survival in PANC-1 pancreatic cancer cells. BMC Cancer 2021, 21, 33. [Google Scholar] [CrossRef] [PubMed]
  6. Subbiah, V.; Kreitman, R.J.; Wainberg, Z.A.; Cho, J.Y.; Schellens, J.H.M.; Soria, J.C.; Wen, P.Y.; Zielinski, C.; Cabanillas, M.E.; Urbanowitz, G.; et al. Dabrafenib and Trametinib Treatment in Patients With Locally Advanced or Metastatic BRAF V600-Mutant Anaplastic Thyroid Cancer. J. Clin. Oncol. 2018, 36, 7–13. [Google Scholar] [CrossRef] [Green Version]
  7. Curigliano, G.; Criscitiello, C.; Esposito, A.; Fumagalli, L.; Gelao, L.; Locatelli, M.; Minchella, I.; Goldhirsch, A. Best management of locally advanced inoperable breast cancer. EJC Suppl. 2013, 11, 289–290. [Google Scholar] [CrossRef] [Green Version]
  8. Onuma, A.E.; Zhang, H.; Huang, H.; Williams, T.M.; Noonan, A.; Tsung, A. Immune Checkpoint Inhibitors in Hepatocellular Cancer: Current Understanding on Mechanisms of Resistance and Biomarkers of Response to Treatment. Gene Expr. 2020, 20, 53–65. [Google Scholar] [CrossRef]
  9. Kim, G.; McKee, A.E.; Ning, Y.M.; Hazarika, M.; Theoret, M.; Johnson, J.R.; Xu, Q.C.; Tang, S.; Sridhara, R.; Jiang, X.; et al. FDA approval summary: Vemurafenib for treatment of unresectable or metastatic melanoma with the BRAFV600E mutation. Clin. Cancer Res. 2014, 20, 4994–5000. [Google Scholar] [CrossRef] [Green Version]
  10. ClinicalTrials.gov Identifier: NCT04790448. Available online: https://clinicaltrials.gov/ct2/show/NCT04790448?cond=NCT04790448&draw=2&rank=1 (accessed on 10 March 2021).
  11. ClinicalTrials.gov Identifier: NCT02314481. Available online: https://clinicaltrials.gov/ct2/show/NCT02314481?cond=NCT02314481&draw=2&rank=1 (accessed on 11 December 2014).
  12. ClinicalTrials.gov Identifier: NCT00073138. Available online: https://clinicaltrials.gov/ct2/show/NCT00073138?cond=NCT00073138&draw=2&rank=1 (accessed on 18 November 2003).
  13. Kim, E.S. Enasidenib: First Global Approval. Drugs 2017, 77, 1705–1711. [Google Scholar] [CrossRef]
  14. ClinicalTrials.gov Identifier: NCT03911973, NCT03698383. Available online: https://clinicaltrials.gov/ct2/show/NCT03911973?cond=NCT03911973&draw=2&rank=1 (accessed on 11 April 2019).
  15. ClinicalTrials.gov Identifier: NCT03065062. Available online: https://clinicaltrials.gov/ct2/show/NCT03065062?cond=NCT03065062&draw=2&rank=1 (accessed on 27 February 2017).
  16. Sławiński, J.; Żołnowska, B.; Orlewska, C.; Chojnacki, J. Synthesis and molecular structure of novel 2-(alkylthio)-4-chloro-N-(4,5-dihydro-5-oxo-1H-1,2,4-triazol-3-yl)-5-methylbenzenesulfonamides with potential anticancer activity. Mon. Chem. 2012, 143, 1705–1718. [Google Scholar] [CrossRef] [Green Version]
  17. Tomorowicz, Ł.; Sławiński, J.; Żołnowska, B.; Szafrański, K.; Kawiak, A. Synthesis, Antitumor Evaluation, Molecular Modeling and Quantitative Structure-Activity Relationship (QSAR) of Novel 2-[(4-Amino-6-N-substituted-1,3,5-triazin-2-yl)methylthio]-4-chloro-5-methyl-N-(1H-benzo[d]imidazol-2(3H)-ylidene)benzenesulfonamides. Int. J. Mol. Sci. 2020, 21, 2924. [Google Scholar] [CrossRef] [PubMed]
  18. Pogorzelska, A.; Sławiński, J.; Kawiak, A.; Żołnowska, B.; Chojnacki, J.; Stasiłojć, G.; Ulenberg, S.; Szafrański, K.; Bączek, T. Synthesis, molecular structure, and metabolic stability of new series of N’-(2-alkylthio-4-chloro-5-methylbenzenesulfonyl)-1-(5-phenyl-1H-pyrazol-1-yl)amidine as potential anti-cancer agents. Eur. J. Med. Chem. 2018, 155, 670–680. [Google Scholar] [CrossRef] [PubMed]
  19. Bułakowska, A.; Sławiński, J.; Siedlecka-Kroplewska, K.; Stasiłojć, G.; Serocki, M.; Heldt, M. Novel N-(aryl/heteroaryl)-2-chlorobenzenesulfonamide derivatives: Synthesis and anticancer activity evaluation. Bioorg. Chem. 2020, 104, 104309. [Google Scholar] [CrossRef] [PubMed]
  20. Worachartcheewan, A.; Nantasenamat, C.; Isarankura-Na-Ayudhya, C.; Prachayasittikul, V. QSAR study of amidino bis-benzimidazole derivatives as potent anti-malarial agents against Plasmodium falciparum. Chem. Pap. 2013, 67, 1462–1473. [Google Scholar] [CrossRef]
  21. Worachartcheewan, A.; Prachayasittikul, S.; Pingaew, S.; Nantasenamat, C.; Tantimongcolwat, T.; Ruchirawat, S.; Prachayasittikul, V. Antioxidant, cytotoxicity, and QSAR study of 1-adamantylthio derivatives of 3-picoline and phenylpyridines. Med. Chem. Res. 2012, 21, 3514–3522. [Google Scholar] [CrossRef]
  22. QSAR and Lead Optimization. Computer Applications in Drug Discovery and Development; Puratchikody, A., Prabu, S.L., Umamaheswari, A., Eds.; IGI Global: Hershey, PA, USA, 2018; Chapter 4; pp. 80–100. ISBN 9781522573265. [Google Scholar]
  23. Pomarnacka, E.; Brzozowski, Z.; Filczewski, M.; Szymanska-Kosmala, M.; Oledzka, K. Various possibilities of using 6-chloro-3-methylthio-7-methyl-1,1-dioxo-1,4,2-benzodithiazine for the synthesis of 2-(4-chloro-2-mercapto-5-methylbenzenesulfonamido)imidazoline derivatives, and their pharmacological properties. Acta Pol. Pharm. 1985, 42, 501–510. [Google Scholar]
  24. Pomarnacka, E.; Kornicka, A. Synthesis and in vitro anticancer and anti-HIV evaluation of new 2-mercaptobenzenesulfonamides. Farmaco II 2001, 56, 571–577. [Google Scholar] [CrossRef]
  25. Liu, K.G.; Robichaud, A.J. A general and convenient synthesis of N-arylpiperazines. Tetrahedron Lett. 2005, 46, 7921–7922. [Google Scholar] [CrossRef]
  26. Konstantinov, I.; Bukhryakov, K.; Gezentsvey, Y.; Krasavin, M. Practical method for parallel synthesis of diversely substituted 1-phenylpiperazines. Lett. Org. Chem. 2011, 8, 628–630. [Google Scholar] [CrossRef] [Green Version]
  27. Patel, R.V.; Mistry, B.; Syed, R.; Rathi, A.K.; Lee, Y.J.; Sung, J.S.; Shinf, H.S.; Keum, Y.S. Chrysin piperazine conjugates as antioxidant and anticancer agents. Eur. J. Pharm. Sci. 2016, 88, 166–177. [Google Scholar] [CrossRef]
  28. Kommula, D.; Polepall, S.; Jain, N.; Murty, M.S.R. Synthesis and preliminary antiproliferative activity of novel 4-substituted phenylsulfonyl piperazines with tetrazole moiety. Indian J. Pharm. Sci. 2018, 80, 930–939. [Google Scholar] [CrossRef]
  29. Guariento, S.; Tonelli, M.; Espinoza, S.; Gerasimov, A.S.; Gainetdinov, R.R.; Cichero, E. Rational design, chemical synthesis and biological evaluation of novel biguanides exploring species-specificity responsiveness of TAAR1 agonists. Eur. J. Med. Chem. 2018, 146, 171–184. [Google Scholar] [CrossRef] [PubMed]
  30. Ma, X.; Poon, T.Y.; Wong, P.T.H.; Chui, W.-K. Synthesis and in vitro evaluation of 2,4-diamino-1,3,5-triazine derivatives as neuronal voltage-gated sodium channel blockers. Bioorg. Med. Chem. Lett. 2009, 19, 5644–5647. [Google Scholar] [CrossRef]
  31. Kozakiewicz, I. Syntezy niektórych pochodnych 2-[4-chloro-5-metylo-2-(2,4-diamino-1,3,5-triazyn-6-ylo)metylotiobenzenosulfonylo]iminoimidazolidyny. Ann. Acad. Med. Gedanensis 1998, 28, 155–159. [Google Scholar]
  32. The Molecular Operating Environment (MOE); Chemical Computing Group Inc.: Montreal, QC, Canada, 2019; Available online: https://www.chemcomp.com/Products.htm (accessed on 17 September 2019).
  33. Monderer, D.; Shapley, L. Potential games. Game Econ. Behav. 1996, 14, 124–143. [Google Scholar] [CrossRef]
  34. TIBCO Software Inc. Statistica, Version 13; StatSoft: Kraków, Poland, 2017. [Google Scholar]
  35. Wang, S.; Zhao, Y.; Aguilar, A.; Bernard, D.; Yang, C.Y. Targeting the MDM2-p53 protein-protein interaction for new cancer therapy: Progress and challenges. Cold Spring Harb. Perspect. Med. 2017, 7, a026245. [Google Scholar] [CrossRef] [Green Version]
  36. Burgess, A.; Chia, K.M.; Haupt, S.; Thomas, D.; Haupt, Y.; Lim, E. Clinical overview of MDM2/X-targeted therapies. Front. Oncol. 2016, 27, 6–7. [Google Scholar] [CrossRef]
  37. Moll, U.M.; Petrenko, O. The MDM2-p53 interaction. Mol. Cancer Res. 2003, 1, 1001–1008. [Google Scholar]
  38. Zalcenstein, A.; Stambolsky, P.; Weisz, L.; Müller, M.; Wallach, D.; Goncharov, T.M.; Krammer, P.H.; Rotter, V.; Oren, M. Mutant p53 gain of function: Repression of CD95(Fas/APO-1) gene expression by tumor-assiated p53 mutants. Oncogene 2003, 22, 5667–5676. [Google Scholar] [CrossRef] [Green Version]
  39. Chari, N.S.; Pinaire, N.L.; Thorpe, L.; Medeiros, L.J.; Routbort, M.J.; McDonnell, T.J. The p53 tumor suppressor network in cancer and the therapeutic modulation of cell death. Apoptosis 2009, 14, 336–347. [Google Scholar] [CrossRef]
  40. Hu, J.; Cao, J.; Topatana, W.; Juengpanich, S.; Li, S.; Zhang, B.; Shen, J.; Cai, L.; Cai, X.; Chen, M. Targeting mutant p53 for cancer therapy: Direct and indirect strategies. J. Hematol. Oncol. 2021, 14, 157. [Google Scholar] [CrossRef] [PubMed]
  41. Lim, L.Y.; Vidnovic, N.; Ellisen, L.W.; Leong, C.O. Mutant p53 mediates survival of breast cancer cells. Br. J. Cancer 2009, 101, 1606–1612. [Google Scholar] [CrossRef] [PubMed]
  42. Brzozowski, Z.; Sławiński, J. 1,1-Dioxo-1,4,2-benzodithiazine derivatives. II Synthesis of some 3-mercapto-1,1-dioxo-1,4,2-benzodithiazine derivatives. Acta Pol. Pharm. 1984, 41, 133–139. [Google Scholar]
  43. Dolomanov, O.V.; Bourhis, L.J.; Gildea, R.J.; Howard, J.A.K.; Puschmann, H. OLEX2: A complete structure solution, refinement and analysis program. J. Appl. Crystallogr. 2009, 42, 339–341. [Google Scholar] [CrossRef]
  44. Sheldrick, G.M. SHELXT—Integrated space-group and crystalstructure determination. Acta Cryst. A 2015, 71, 3–8. [Google Scholar] [CrossRef] [Green Version]
  45. Sheldrick, G.M. Crystal structure refinement with SHELXL. Acta Cryst. C 2015, 71, 3–8. [Google Scholar] [CrossRef]
Figure 1. Structures of exemplary anticancer drugs and compounds containing a sulfonamide or 1,3,5-triazine moiety which are in clinical trials, among others, for breast or colorectal cancer.
Ijms 23 07178 g001
Figure 2. The general structure of a designed molecular hybrid consisting of two pharmacophores: a 2-mercaptobenzenesulfonamide fragment (A) and a 4-amino-6-R2-1,3,5-triazin-2-yl ring (B), modified by the R1 substituent (C) on the N-1 imidazolidine ring.
Ijms 23 07178 g002
Figure 3. A pathway of the designing of 2-[(4-amino-6-R2-1,3,5-triazin-2-yl)methylthio]-N-(imidazolidin-2-ylidene)-4-chloro-5-methylbenzenesulfonamide derivatives based on QSAR models.
Ijms 23 07178 g003
Scheme 1. Synthesis of ethyl 2-{2-[N-(1-R1-imidazolidin-2-ylidene)sulfamoyl]-5-chloro-4-methylphenylthio}acetate 1118 and ethyl 2-{2-[N-{1-[4-(trifluoromethyl)benzyl]tetrahydropyrimidin-2(1H)-ylidene}sulfamoyl]-5-chloro-4-methylphenylthio}acetate 19. Reagents and conditions: (a) appropriate diamine (0.04 mol), anhydrous MeOH, reflux 70–240 h; (b) N-(4-trifluoromethylbenzyl)propane-1,3-diamine (0.04 mol), anhydrous MeOH, reflux 123 h; (c) ethyl 2-bromoacetate (0.024 mol), TEA (0.02 mol), DCM.
Ijms 23 07178 sch001
Scheme 2. Synthesis of 2-[(4-amino-6-R2-1,3,5-triazin-2-yl)methylthio]-N-(1-R1-imidazolidin-2-ylidene)-4-chloro-5-methylbenzenesulfonamides (20157). Compounds synthesized previously [31].
Ijms 23 07178 sch002
Scheme 3. Synthesis of 2-[(4-amino-6-R2-1,3,5-triazin-2-yl)methylthio]-N-{1-[4-(trifluoromethyl)benzyl]tetrahydropyrimidin-2(1H)-ylidene}-4-chloro-5-methylbenzenesulfonamides (158162).
Ijms 23 07178 sch003
Figure 4. Molecular structure of compound 27, showing the atom-labelling scheme. Solvent molecules omitted. Displacement ellipsoids are shown at 50% probability.
Ijms 23 07178 g004
Figure 5. Crystal packing and hydrogen bonding in 27. Molecules of the main component are linked by the ring-type hydrogen bond motif R 2 2 8 NHN (using N4 and N8 atoms) located at the inversion center (drawn as the orange ball). The two dimethylsulfoxide molecules are interacting with the sulfonamide through NHO, CHO or NHS hydrogen bonds.
Ijms 23 07178 g005
Figure 6. Scatter plots for N-(imidazolidin-2-ylidene)benzenesulfonamides 2044 (model 1), N-(1-benzylimidazolidin-2-ylidene)benzenesulfonamides 4573 (model 2) and N-[1-(4-fluorobenzyl)imidazolidin-2-ylidene]benzenesulfonamides 82101 (model 3), as well as N-[1-(3-trifluoromethylbenzyl)imidazolidin-2-ylidene]benzenesulfonamides 112117, N-[1-(4-trifluoromethylbenzyl)imidazolidin-2-ylidene]benzenesulfonamides 118143 and N-{1-[3,5-bis(trifluoromethyl)benzyl]imidazolidin-2-ylidene}benzenesulfonamides 144157 (model 4) with experimental IC50 and predicted IC50 values of the training set (blue) and test set (red) for the HCT-116 cell line.
Ijms 23 07178 g006aIjms 23 07178 g006b
Figure 7. Effects on MDM2 and p53 protein levels upon treatment. Western blot analysis showing MDM2 and p53 protein levels in MCF-7 cells, untreated and treated with the indicated compounds in concentrations 4 µM (A) and 10 µM (B) for 24 h. Reference: β-tubulin.
Ijms 23 07178 g007
Figure 8. Cell cycle arrest in MCF-7 cells induced by compounds 48 and 140. Cells were treated with the indicated concentrations of the compounds, and the cell cycle distribution was analyzed with flow cytometry. (A) Histograms showing the distribution of cell populations in the sub-G1, G0/G1, S and G2/M phases of the cell cycle. (B) Graphs demonstrating the percentages of cells in the depicted phases of the cell cycle. Values represent the mean ± SD of three independent experiments. Data were analyzed by one-way ANOVA with Tukey’s post hoc test [p < 0.05 (*), p < 0.01 (**), p < 0.001 (***)].
Ijms 23 07178 g008
Figure 9. Induction of apoptosis by compounds 48 and 140 in MCF-7 cells. Cells were treated with the indicated concentrations of compounds 48 and 140 for 72 h, stained with Annexin V-PE and 7-AAD and analyzed with flow cytometry. (A) Dot plots showing early apoptotic (bottom right quadrant), late apoptotic (upper right quadrant), viable (lower left quadrant) and necrotic cell populations (upper left quadrant). (B) Graphs indicating early and late apoptotic cells. Values represent the mean ± SD of three repetitions. Data were analyzed by one-way ANOVA with Tukey’s post hoc test [p < 0.05 (*), p < 0.01 (**), p < 0.001 (***)].
Ijms 23 07178 g009
Figure 10. Induction of apoptosis by compounds 48 and 140 in T47D cells. Cells were treated with the indicated concentrations of compounds 48 and 140 for 72 h, stained with Annexin V-PE and 7-AAD, and analyzed with flow cytometry. (A) Dot plots showing early apoptotic (bottom right quadrant), late apoptotic (upper right quadrant), viable (lower left quadrant) and necrotic cell populations (upper left quadrant). (B) Graphs indicating early and late apoptotic cells. Values represent the mean ± SD of three repetitions. Data were analyzed by one-way ANOVA with Tukey’s post hoc test [p < 0.01 (**), p < 0.001 (***)].
Ijms 23 07178 g010
Table 1. Cytotoxicity of N-(imidazolidin-2-ylidene)benzenesulfonamides 2044 toward human cancer cell lines and non-cancerous line HaCaT. Cell lines: colon cancer (HCT-116), breast cancer (MCF-7), cervical cancer (HeLa), and the human keratinocyte cell line (HaCaT).
CompdSubstituentIC50 [µM]
HCT-116MCF-7HeLaHaCaT
20 110.0 ± 2.0220.0 ± 6.0115.0 ± 7.0NT
21350.0 ± 7.0190.0 ± 2.0510.0 ± 5.0NT
22140.0 ± 3.0130.0 ± 4.0110.0 ± 4.0NT
23142.0 ± 4.0130.0 ± 3.0150.0 ± 2.0NT
2420.0 ± 0.427.0 ± 0.322.0 ± 0.241.0 ± 1.0
2545.0 ± 2.046.0 ± 2.046.0 ± 2.054.0 ± 2.0
2633.0 ± 2.033.0 ± 1.034.0 ± 1.045.0 ± 2.0
2739.0 ± 2.044.0 ± 1.074.0 ± 2.075.0 ± 3.0
2858.0 ± 0.645.0 ± 0.580.0 ± 1.0NT
2925.0 ± 0.524.0 ± 0.232.0 ± 0.343.0 ± 2.0
30 Ijms 23 07178 i001170.0 ± 3.0145.0 ± 7.0153.0 ± 5.0NT
31 10.0 ± 0.416.0 ± 0.216.0 ± 0.126.0 ± 1.0
3214.0 ± 0.516.0 ± 0.514.0 ± 0.528.0 ± 1.0
3319.0 ± 0.526.0 ± 1.025.0 ± 1.041.0 ± 2.0
3418.0 ± 1.012.0 ± 0.524.0 ± 2.041.0 ± 1.0
3514.0 ± 0.716.0 ± 1.016.0 ± 1.032.0 ± 2.0
3612.0 ± 0.113.0 ± 0.112.0 ± 0.128.0 ± 1.0
3718.0 ± 0.519.0 ± 1.024.0 ± 1.037.0 ± 2.0
3815.0 ± 0.528.0 ± 1.019.0 ± 1.035.0 ± 1.0
3915.0 ± 1.017.0 ± 1.018.0 ± 1.037.0 ± 2.0
4021.0 ± 0.528.0 ± 2.023.0 ± 1.045.0 ± 3.0
4121.0 ± 1.046.0 ± 1.039.0 ± 2.051.0 ± 3.0
4231.0 ± 1.031.0 ± 2.030.0 ± 1.561.0 ± 4.0
4317.0 ± 1.022.0 ± 0.519.0 ± 0.543.0 ± 2.0
4414.0 ± 0.516.0 ± 0.514.0 ± 0.528.0 ± 1.0
cisplatin3.8 ± 0.13.0 ± 0.12.2 ± 0.17.7 ± 0.2
NT–not tested; IC50 values are expressed as the mean ± SD of at last three independent experiments.
Table 2. Cytotoxicity of N-(1-benzylimidazolidin-2-ylidene)benzenesulfonamides 4573 and N-(1-naphthylimidazolidin-2-ylidene)benzenesulfonamides 7481 toward human cancer cell lines and non-cancerous line HaCaT. Cell lines: colon cancer (HCT-116), breast cancer (MCF-7), cervical cancer (HeLa), and the human keratinocyte cell line (HaCaT).
CompdSubstituentIC50 [µM]
HCT-116MCF-7HeLaHaCaT
45 19.0 ± 0.422.0 ± 0.234.0 ± 1.043.0 ± 2.0
4621.0 ± 0.223.0 ± 0.737.0 ± 0.4NT
4719.0 ± 0.220.0 ± 0.434.0 ± 0.345.0 ± 2.0
486.0 ± 0.17.0 ± 0.225.0 ± 0.333.0 ± 1.0
4914.0 ± 0.117.0 ± 0.324.0 ± 0.538.0 ± 1.0
5018.0 ± 0.243.0 ± 1.035.0 ± 2.051.0 ± 2.0
5119.0 ± 0.610.0 ± 0.515.0 ± 1.0 220.0 ± 12.0
5237.0 ± 0.564.0 ± 2.061.0 ± 2.092.0 ± 3.0
5310.0 ± 0.511.0 ± 0.585.0 ± 2.081.0 ± 4.0
5411.0 ± 0.112.0 ± 0.116.0 ± 0.228.0 ± 1.0
557.0 ± 0.110.0 ± 0.213.0 ± 0.139.0 ± 2.0
5622.0 ± 1.054.0 ± 1.037.0 ± 1.058.0 ± 2.0
57 Ijms 23 07178 i0028.0 ± 0.18.0 ± 0.2102.0 ± 2.048.0 ± 2.0
58 11.0 ± 0.317.0 ± 1.014.0 ± 2.029.0 ± 1.0
5913.0 ± 0.318.0 ± 1.015.0 ± 1.030.0 ± 1.0
608.0 ± 0.314.0 ± 0.39.0 ± 0.523.0 ± 1.0
616.5 ± 0.19.0 ± 0.3 10.0 ± 0.221.0 ± 1.0
626.0 ± 0.17.0 ± 0.1107.0 ± 1.032.0 ± 1.0
637.0 ± 0.19.0 ± 0.512.0 ± 0.524.0 ± 1.0
6411.0 ± 0.414.0 ± 0.515.0 ± 1.028.0 ± 1.0
657.0 ± 0.211.0 ± 0.511.0 ± 0.323.0 ± 1.0
6612.0 ± 0.429.0 ± 1.020.0 ± 1.036.0 ± 2.0
67168.0 ± 8.0153.0 ± 5.0140.0 ± 7.0NT
6816.0 ± 0.516.0 ± 0.514.0 ± 0.532.0 ± 2.0
6966.0 ± 2.0122.0 ± 7.0100.0 ± 6.0128.0 ± 5.0
70300.0 ± 18.0490.0 ± 10.0550.0 ± 21.0NT
71155.0 ± 6.0205.0 ± 4.0265.0 ± 8.027.0 ± 1.0
726.5 ± 0.19.0 ± 0.517.0 ± 0.528.0 ± 1.0
735.2 ± 0.27.5 ± 0.314.0 ± 0.329.0 ± 1.0
7444.0 ± 2.012.0 ± 0.613.0 ± 0.581.0 ± 4.0
7530.0 ± 2.08.0 ± 0.577.0 ± 5.0110.0 ± 5.0
76 Ijms 23 07178 i00346.0 ± 1.025.0 ± 1.028.0 ± 2.099.0 ± 4.0
77 40.0 ± 1.029.0 ± 1.0110.0 ± 5.0220.0 ± 11.0
7819.5 ± 0.611.0 ± 0.5130.0 ± 8.0280.0 ± 14.0
7994.0 ± 2.098.0 ± 5.088.0 ± 3.0NT
8079.0 ± 2.089.0 ± 4.098.0 ± 5.0NT
818.4 ± 0.38.0 ± 0.563.0 ± 1.0240.0 ± 12.0
cisplatin3.8 ± 0.13.0 ± 0.12.2 ± 0.17.7 ± 0.2
NT–not tested; IC50 values are expressed as the mean ± SD of at last three independent experiments.
Table 3. Cytotoxicity of N-[1-(4-fluoro or bromo)benzylimidazolidin-2-ylidene]benzenesulfonamides 82111 toward human cancer cell lines and non-cancerous line HaCaT. Cell lines: colon cancer (HCT-116), breast cancer (MCF-7), cervical cancer (HeLa), and the human keratinocyte cell line (HaCaT).
CompdSubstituentIC50 [µM]
HCT-116MCF-7HeLaHaCaT
82 19.0 ± 0.812.0 ± 0.130.0 ± 1.054.0 ± 2.0
8310.0 ± 0.514.0 ± 1.012.0 ± 3.032.0 ± 1.0
849.0 ± 0.57.0 ± 0.115.0 ± 0.627.0 ± 1.0
8515.0 ± 0.523.0 ± 1.021.0 ± 4.038.0 ± 1.0
8613.0 ± 0.515.0 ± 0.216.0 ± 0.235.0 ± 2.0
8710.0 ± 0.47.0 ± 0.315.0 ± 1.034.0 ± 1.0
8817.0 ± 0.531.0 ± 1.025.0 ± 2.043.0 ± 2.0
8914.0 ± 0.718.0 ± 1.017.0 ± 0.631.0 ± 1.0
9012.0 ± 0.217.0 ± 1.015.0 ± 0.630.0 ± 2.0
91 Ijms 23 07178 i00420.0 ± 1.013.0 ± 0.434.0 ± 2.054.0 ± 2.0
92 7.0 ± 0.38.0 ± 0.48.0 ± 0.518.0 ± 1.0
937.0 ± 0.37.0 ± 0.58.0 ± 0.418.0 ± 1.0
949.0 ± 0.214.0 ± 0.512.0 ± 1.025.0 ± 1.0
957.0 ± 0.37.0 ± 0.18.0 ± 0.418.0 ± 1.0
966.0 ± 0.36.0 ± 0.29.0 ± 0.322.0 ± 1.0
976.0 ± 0.27.0 ± 0.49.0 ± 0.324.0 ± 1.0
987.0 ± 0.17.0 ± 0.48.0 ± 0.418.0 ± 1.0
9917.0 ± 1.017.0 ± 1.018.0 ± 0.530.0 ± 1.0
1008.0 ± 0.27.0 ± 0.18.0 ± 0.518.0 ± 1.0
10112.0 ± 0.511.0 ± 0.210.0 ± 0.621.0 ± 1.0
1028.0 ± 0.47.5 ± 0.417.0 ± 1.033.0 ± 1.0
1037.0 ± 0.16.5 ± 0.316.0 ± 0.528.0 ± 1.0
10417.0 ± 1.013.0 ± 0.425.0 ± 1.044.0 ± 2.0
105 Ijms 23 07178 i00513.0 ± 0.810.0 ± 0.217.0 ± 0.535.0 ± 2.0
106 8.5 ± 0.16.5 ± 0.482.0 ± 4.0110.0 ± 4.0
1078.5 ± 0.37.0 ± 0.258.0 ± 2.076.0 ± 4.0
10810.5 ± 0.511.0 ± 0.511.0 ± 0.524.0 ± 1.0
10923.0 ± 1.022.0 ± 0.536.0 ± 2.055.0 ± 2.0
11020.0 ± 0.623.0 ± 1.085.0 ± 5.0123.0 ± 6.0
1115.6 ± 0.37.0 ± 0.27.5 ± 0.318.0 ± 1.0
cisplatin3.8 ± 0.13.0 ± 0.12.2 ± 0.17.7 ± 0.2
IC50 values are expressed as the mean ± SD of at last three independent experiments.
Table 4. Cytotoxicity of N-[1-(3- or 4-trifluoromethyl)benzylimidazolidin-2-ylidene]benzenesulfonamides 112143 and N-[1-(3,5-bis(trifluoromethyl)benzylimidazolidin-2-ylidene]benzenesulfonamides 144157 toward human cancer cell lines and non-cancerous line HaCaT. Cell lines: colon cancer (HCT-116), breast cancer (MCF-7), cervical cancer (HeLa), and the human keratinocyte cell line (HaCaT).
CompdSubstituentIC50 [µM]
HCT-116MCF-7HeLaHaCaT
112 15.0 ± 0.317.0 ± 1.015.5 ± 1.029.0 ± 1.0
113 Ijms 23 07178 i0066.0 ± 0.16.5 ± 0.315.0 ± 1.031.0 ± 2.0
114 5.0 ± 0.26.5 ± 0.312.0 ± 0.327.0 ± 1.0
1155.5 ± 0.26.5 ± 0.212.0 ± 1.023.0 ± 0.5
1166.0 ± 0.28.5 ± 0.317.0 ± 1.031.0 ± 2.0
11716.0 ± 0.517.0 ± 1.012.0 ± 0.236.0 ± 2.0
118105.0 ± 4.010.0 ± 0.5115.0 ± 2.0>500
11913.0 ± 0.413.5 ± 1.018.0 ± 1.041.0 ± 2.0
1209.0 ± 0.511.0 ± 0.112.0 ± 0.524.0 ± 1.0
1216.0 ± 0.114.0 ± 1.013.0 ± 1.024.0 ± 1.0
12214.0 ± 0.420.0 ± 1.019.0 ± 0.535.0 ± 1.0
12312.0 ± 0.521.0 ± 0.618.0 ± 1.030.0 ± 1.0
1249.5 ± 0.110.0 ± 0.515.0 ± 0.231.0 ± 1.0
1257.5 ± 0.27.5 ± 0.213.0 ± 0.525.0 ± 1.0
12611.0 ± 0.621.0 ± 1.020.0 ± 1.037.0 ± 1.0
12717.0 ± 0.517.5 ± 1.018.0 ± 1.039.0 ± 2.0
12810.0 ± 0.314.0 ± 0.515.0 ± 0.433.0 ± 1.0
129 Ijms 23 07178 i00711.0 ± 0.114.0 ± 0.515.0 ± 1.031.0 ± 1.0
130 10.5 ± 0.48.0 ± 0.317.0 ± 0.536.0 ± 1.0
1317.0 ± 0.215.0 ± 0.513.0 ± 0.525.0 ± 1.0
1328.0 ± 0.217.0 ± 0.416.0 ± 1.026.0 ± 1.0
1338.0 ± 0.316.0 ± 0.514.0 ± 1.025.0 ± 1.0
1345.0 ± 0.211.0 ± 0.110.0 ± 0.622.0 ± 1.0
1355.0 ± 0.26.5 ± 0.37.0 ± 0.219.0 ± 1.0
1365.0 ± 0.16.0 ± 0.310.0 ± 0.421.0 ± 1.0
1376.0 ± 0.27.0 ± 0.412.0 ± 0.621.0 ± 1.0
1386.0 ± 0.29.0 ± 0.59.0 ± 0.622.0 ± 1.0
1396.0 ± 0.113.0 ± 1.012.0 ± 1.024.0 ± 1.0
1405.0 ± 0.210.0 ± 0.28.0 ± 0.522.0 ± 1.0
1417.5 ± 0.29.5 ± 0.545.0 ± 2.0180.0 ± 9.0
1424.6 ± 0.16.5 ± 0.314.0 ± 0.229.0 ± 1.0
1434.6 ± 0.16.0 ± 0.37.0 ± 0.419.0 ± 1.0
1448.0 ± 0.58.0 ± 0.213.0 ± 0.227.0 ± 1.0
14513.0 ± 0.513.0 ± 0.816.5 ± 1.0 36.0 ± 1.0
14611.5 ± 0.512.5 ± 0.615.0 ± 1.032.0 ± 1.0
1476.5 ± 0.38.0 ± 0.215.0 ± 1.028.0 ± 1.0
148 Ijms 23 07178 i0089.5 ± 0.28.5 ± 0.515.0 ± 1.029.0 ± 1.0
149 11.5 ± 0.611.0 ± 0.518.0 ± 1.033.0 ± 1.0
1503.6 ± 0.24.5 ± 0.211.0 ± 0.323.0 ± 1.0
1516.0 ± 0.16.0 ± 0.115.0 ± 1.028.0 ± 1.0
1526.5 ± 0.36.5 ± 0.315.5 ± 1.029.0 ± 1.0
1536.0 ± 0.38.0 ± 0.29.0 ± 0.519.0 ± 0.5
1545.0 ± 0.16.5 ± 0.212.0 ± 1.026.0 ± 1.0
1555.0 ± 0.16.0 ± 0.110.0 ± 0.119.0 ± 1.0
1564.8 ± 0.17.5 ± 0.45.5 ± 0.217.0 ± 1.0
1575.0 ± 0.16.0 ± 0.313.0 ± 0.523.0 ± 1.0
cisplatin3.8 ± 0.13.0 ± 0.12.2 ± 0.17.7 ± 0.2
Table 5. Cytotoxicity of N-[1-(4-trifluoromethyl)benzyltetrahydropyrimidin-2(1H)-ylidene]benzenesulfonamides 158162 toward human cancer cell lines and non-cancerous line HaCaT. Cell lines: colon cancer (HCT-116), breast cancer (MCF-7), cervical cancer (HeLa), and the human keratinocyte cell line (HaCaT).
CompdSubstituentIC50 [µM]
HCT-116MCF-7HeLaHaCaT
158 5.0 ± 0.38.0 ± 0.46.0 ± 0.317.0 ± 1.0
159 Ijms 23 07178 i0099.0 ± 0.510.0 ± 0.315.5 ± 0.529.0 ± 1.0
160 10.5 ± 0.412.0 ± 0.58.5 ± 0.323.0 ± 1.0
1616.5 ± 0.16.5 ± 0.214.0 ± 0.527.0 ± 1.0
1625.5 ± 0.36.0 ± 0.212.5 ± 0.525.0 ± 0.7
cisplatin3.8 ± 0.23.0 ± 0.12.2 ± 0.17.7 ± 0.2
IC50 values are expressed as the mean ± SD of at last three independent experiments.
Table 6. Selectivity indexes (SI) of selected compounds toward cell lines: colon cancer (HCT-116), breast cancer (MCF-7), cervical cancer (HeLa).
CompdSelectivity Index (SI)
HCT-116MCF-7HeLa
485.54.71.3
555.53.93.0
625.34.50.3
735.53.82.0
1145.44.12.2
1344.42.02.2
1404.42.22.7
1506.45.12.0
1574.63.81.7
1624.54.12.0
cisplatin2.02.53.5
Selectivity index: IC50 value toward HaCaT cells/IC50 value toward cancer cell lines.
Table 7. Summary of the QSAR equations.
STEP 1
Model 1R1 = H, compounds: 2044
IC50 = −8.783228 ast_violation − 0.242646 PEOE_VSA-0 − 28.231708 rings + 212.156433
R2 = 0.88; R2adj = 0.85; Q2LOO = 0.80; F(3,11) = 26.76; p = 0.2 × 10⁻⁴; N(train) = 15; N(test) = 6
STEP 2
Model 2R1 = Bn, compounds: 4573
IC50 = 100.345937 b_1rotN + 10.490686 GCUT_PEOE_0 + 0.507081 lip_acc − 0.318859 radius + 6.112894
R2 = 0.88; R2adj = 0.85; Q2LOO = 0.72; F(4,15) = 28.17; p = 0.8 × 10⁻⁶; N(train) = 20; N(test) = 7
STEP 3
Model 3R1 = 4-F-Bn, compounds: 82101
IC50= 256.006020 BCUT_SMR_1 + 0.139099 Q_VSA_HYD − 0.120301 vsurf_V + 201.402742
R2 = 0.91; R2adj = 0.89; Q2LOO = 0.85; F(3,11) = 37.67; p = 0.4 × 10⁻⁵; N(train) = 15; N(test) = 5
STEP 4
Model 4R1 = 3-F3C-Bn, 4-F3C-Bn, 3,5-bis(F3C)Bn, compounds: 112157
IC50 = 10^[1/(−2.44368 vsurf_CW6 + 1.59455 VDistEq − 0.02515 vsurf_DD12 + 0.24868 vsurf_IW4 − 0.11745 vsurf_IW5 − 5.49371)]
R2 = 0.84; R2adj = 0.81; Q2LOO = 0.74; F(5,25) = 26.27; p = 0.3 × 10⁻⁸; N(train) = 31; N(test) = 14
R2adj—modified form R2 adj in the test set; Q2LOO—squared correlation coefficient for the test set; F—Fisher’s test; pp-value for Fisher’s test for the whole equation; N(train)—training set; N(test)—test set.
Table 8. Type and chemical meaning of molecular descriptors in QSAR models.
DescriptorTypeDefinition
Model 1ast_violationThe atom count and bond count descriptorsNumber of Astex fragment-likeness violations
PEOE_VSA-0Partial charge descriptorSum of the van der Waals area, where the partial charge is in the range −0.05 to 0.50
ringsThe atom count and bond count descriptorsThe number of rings in molecule
Model 2b_1rotNThe atom count and bond count descriptorsNumber of rotatable single bonds. Conjugated single bonds are not included (e.g. ester and peptide bonds)
GCUT_PEOE_0Adjacency and distance matrix descriptorsThe smallest GCUT descriptor using partial PEOE loads. The descriptor is related to the distance between the atoms and the charge of the atoms
lip_accThe atom count and bond count descriptorsThe number of oxygen and nitrogen atoms
radiusAdjacency and distance matrix descriptorsThe descriptor is related to the distance between atoms and the surrounding atoms by other atoms
Model 3BCUT_SMR_1Adjacency and distance matrix descriptorsThe BCUT descriptors using atomic contribution to molar refractivity (using the Wildman and Crippen SMR method) instead of partial charge.
Q_VSA_HYDPartial charge descriptorsTotal hydrophobic van der Waals surface area.
vsurf_SSurface area, volume and shape descriptorsInteraction field surface area
Model 4vsurf_CW6Capacity factorThe descriptor is depend on the structure of molecule, connectivity and configuration of atoms
VDistEqAdjacency and distance matrix descriptorThe descriptor VDistEq is information content index of vertex distance equality.
vsurf_DD12Adjacency and distance matrix descriptorThe descriptor quantifies the contact distance of lowest and the 2nd lowest hydrophobic energy points of a molecule
vsurf_IW4Partial charge descriptorHydrophilic interaction energy moment
vsurf_IW5Partial charge descriptorHydrophilic interaction energy moment
Table 9. Comparison of IC50 value for the HCT-116 and MCF-7 cell lines for compounds 31, 57, 92, 106, 131, 150, with the substituent R2 = 4-phenylpiperazin-1-yl, and compounds 25, 50, 85, 104, 122, 146, with the substituent R2 = phenylamino.
Compd315792106131150
R1 =HBn4-F-Bn4-Br-Bn4-F3C-Bn3,5-bis(F3C)Bn
R2 =4-Ph-piperazin-1-yl
IC50 [µM]
HCT-11645.08.07.08.57.03.6
MCF-746.08.08.06.515.04.5
Compd255085104122146
R1 =HBn4-F-Bn4-Br-Bn4-F3C-Bn3,5-bis(F3C)Bn
R2 =PhNH
IC50 [µM]
HCT-11645.018.015.017.014.011.5
MCF-746.043.023.013.020.012.5
Table 10. Comparison of IC50 values for the HCT-116, MCF-7 and HeLa cell lines for compounds 34, 60, 134, with R2 = S = 4-[4-(trifluoromethyl)phenyl]piperazin-1-yl, and compounds 35, 61, 135, with R2 = T = 4-[3-(trifluoromethyl)phenyl]piperazin-1-yl.
Compd34356061134135
R1 =HHBnBn4-F3C-Bn4-F3C-Bn
R2 =STSTST
IC50 [µM]
HCT-11618.014.08.06.55.05.0
MCF-712.016.014.09.011.06.5
HeLa24.016.09.010.010.07.0
Ijms 23 07178 i010
Table 11. Cytotoxicity of compounds 48, 62, 134, 138 and 140 toward ovarian cancer (A2780, SKOV-3) and breast cancer (MCF-7, T47D) cell lines.
CompdSubstituentIC50 [µM]
A2780SKOV3MCF-7T47DHaCaT
48 Ijms 23 07178 i0114.0 ± 0.18.1 ± 0.17.8 ± 0.14.8 ± 0.1 25.0 ± 1.0
623.9 ± 0.110.1 ± 0.110.4 ± 0.14.9 ± 0.132.0 ± 1.0
134 Ijms 23 07178 i0123.9 ± 0.15.7 ± 0.17.8 ± 0.13.2 ± 0.122.0 ± 1.0
1382.2 ± 0.15.8 ± 0.18.2 ± 0.14.4 ± 0.122.0 ± 1.0
1404.5 ± 0.16.6 ± 0.16.9 ± 0.15.3 ± 0.122.0 ± 1.0
cisplatin1.4 ± 0.171.0 ± 0.13.0 ± 0.13.1 ± 0.17.7 ± 0.2
IC50 was determined following 72 h of incubation. IC50 values are expressed as the mean ± SD of at last three independent experiments.
Publisher’s Note: MDPI stays neutral with regard to jurisdictional claims in published maps and institutional affiliations.

